Abstract
Many factors (material properties, drill bit type and size, drill bit wear, drilling parameters used, and machine-tool characteristics) affect the efficiency of the drilling process, which could be quantified through the delamination factor, thrust force, and drilling torque. To find the optimal combination among the factors that affect the desired responses during drilling of wood-based composites, various modelling techniques could be applied. In this work, an artificial neural network (ANN) and response surface methodology (RSM) were applied to predict and optimize the delamination factor at the inlet and outlet, thrust force, and drilling torque during drilling of prelaminated particleboards, medium- density fiberboard (MDF), and plywood. The artificial neural networks were used to design four models—one for each analyzed response. The coefficient of determination (R2) during the validation phase of designed ANN models was among 0.39 and 0.96. The response surface methodology was involved to reveal the individual influence of analyzed factors on the drilling process and also to figure out the optimum combination of factors. The regression equations obtained an R2 among 0.88 and 0.99. The material type affects mostly the delamination factor. The thrust force is mostly influenced by the drill type. The chipload has a significant effect on the drilling torque. A twist drill with a tip angle equal to 30° and a chipload of 0.1 mm/rev. could be used to efficiently drill the analyzed wood-based composites.
1. Introduction
Nowadays, furniture is mostly made of wood-based composites, namely, prelaminated particleboards (PBs), medium-density fiberboard (MDF), and plywood. To assemble the parts of furniture, a large amount of holes should be created by means of drilling machines. The quality of holes is usually addressed though by the delamination factor and surface roughness [1]. The efficiency of the drilling process is also quantified through two dynamic parameters, namely, thrust force and drilling torque [2]. These dynamic parameters influence the energy consumption during drilling, and tool wear and the quality of holes too.
Many factors like material properties, drill bit diameter, spindle rotation speed, tip angle of the drill bit, feed rate, type of the drill (spade or twist), machine-tool characteristics, etc., have been investigated by various scholars to determine their influence on the drilling process [3,4].
Delamination at the entry and exit of holes during drilling is a significant challenge in processing composite materials. Over the past few decades, various delamination factors and assessment techniques have been proposed by different authors to measure and evaluate delamination severity. Patel and Chaudhary [5] reviewed these techniques, focusing on improving drilling methods. They presented the mechanisms of delamination at both the entrance and exit of holes, along with different measurement methods, calculation formulas, bibliographic sources, and the pros and cons of each method.
Agarwal and Mishra [6] used wood dust and wooden fibers as reinforcements in epoxy resin to create laminated plywood and medium-density fiberboard. They examined how drilling parameters affect the performance of these wooden plastic composites, focusing on the delamination factor and burr height. The study found that increasing the drill bit’s point angle and feed rate raises the delamination factor, while lower speeds and feed rates improve the drilled surface’s performance. They also found that optimal parameters can reduce delamination and burr height by 65%.
Sydor et al. [7] revealed that drilling holes through the adhesive layer of plywood resulted in significantly less accurate dimensions compared to holes drilled through the veneer layers. Additionally, the dimensional inaccuracy of holes affects the strength of wood-made products. In the study from 2024, the authors found that the feed rate values used during drilling pilot holes significantly affect the withdrawal force of screws [8].
Podziewski et al. [9] evaluated machinability issues during drilling of wood-based materials, using fiberboards, particleboards, and plywood as test samples. They drilled holes through 14 different materials to assess edge quality, cutting force, and torque. The study found that the quality-based machinability index did not correlate with the cutting force-based index, nor with basic physical/mechanical properties of materials such as density or hardness, but highlighted the influence of internal structure and material homogeneity. However, the cutting force index showed significant correlations with the physical/mechanical properties, except for particleboards.
Kumar and Jayakumar [10] studied particleboard drilling with twist and spade drills. Experiments have shown that the roughness of the holes’ internal surfaces has decreased as the rotational speed of the drills has increased and the feed speed has decreased. It was also observed that the twist drills performed better than the spade ones. The same authors also studied the influence of liquid coolants during particleboard drilling.
Szwajka et al. [11] developed a method of material identification using the short-time Fourier transform that automatically adjusts the cutting parameters during drilling of a particleboard, MDF, plywood, and high-pressure laminate (HPL) based on force signals, cutting torque, and acceleration signals.
The study of Kurek et al. [12] presents the application of a Siamese network to recognize drill wear, using images of drilled holes as training data. Siamese networks, initially used for face recognition, can distinguish between different classes and identify if an input image matches the original class. The evaluation used three classes: green for sharp drills, red for worn drills, and yellow for drills needing further evaluation by a human expert. This approach simplifies data collection, requires minimal financial investment, and accurately assesses drill wear based on the input images.
Jegorowa et al. [13] used the Multi-Layer Perceptron (MLP) algorithm to automatically identify drill conditions during drilling in a laminated chipboard. Drilling into melamine-faced wood-based panels is common in furniture manufacturing, with delamination being a major quality issue. Studies indicate that tool wear is a key problem, making tool condition monitoring and timely replacement essential to reduce delamination. The study used various sensors (a contact sensor of acoustic emission, accelerometer for vibration, two-component force gauge, and microphone) to register signals in the cutting zone and classified tool conditions into three categories: green (keep working), red (stop and replace), and yellow (warning). The classification achieved an overall accuracy above 70%.
Kurek et al. [14] introduced an automated method for tool condition monitoring, classifying drill wear into three states: green (operational), yellow (warning), and red (replace). They collected signals like noise levels, current/voltage values, and vibrations as training data for classification algorithms. Among the ten evaluated methods, Extreme Gradient Boosting (XGBoost), Gradient Boosting (GB), and Decision Tree (DT) achieved accuracy rates above 85%, with XGBoost reaching 93.33% accuracy. The algorithms effectively avoided the most critical misclassification errors, with only one yellow sample misclassified as green.
Zbieć [15] explores a neural network-based diagnostic system for predicting tool wear in MDF milling. The study involved ten tools, each subjected to wear during the MDF milling process. Key process parameters, including cutting and thrust forces, temperature, and power consumption, were measured throughout. The neural network system used data from previous trials to predict tool wear for all tools except the first one. The results demonstrated that the proposed system has high prediction accuracy and could be valuable for optimizing the woodworking process.
To sum up, the modeling of the drilling process of wood and wood-based materials arrived in the era of artificial intelligence. This fact could lead to many ways to increase the efficiency of the drilling process either through predictive maintenance and/or by means of optimization techniques. Therefore, the primary aim of this study was to optimize the drilling process of wood-based composites by (1) predicting the delamination factor, thrust force, and drilling torque; (2) identifying the optimal combination of factors (drill tip angle, chipload, drill type, and material type) that influence these parameters. This study employed artificial neural networks and response surface methodology to achieve these goals.
2. Materials and Methods
2.1. Experimental Part
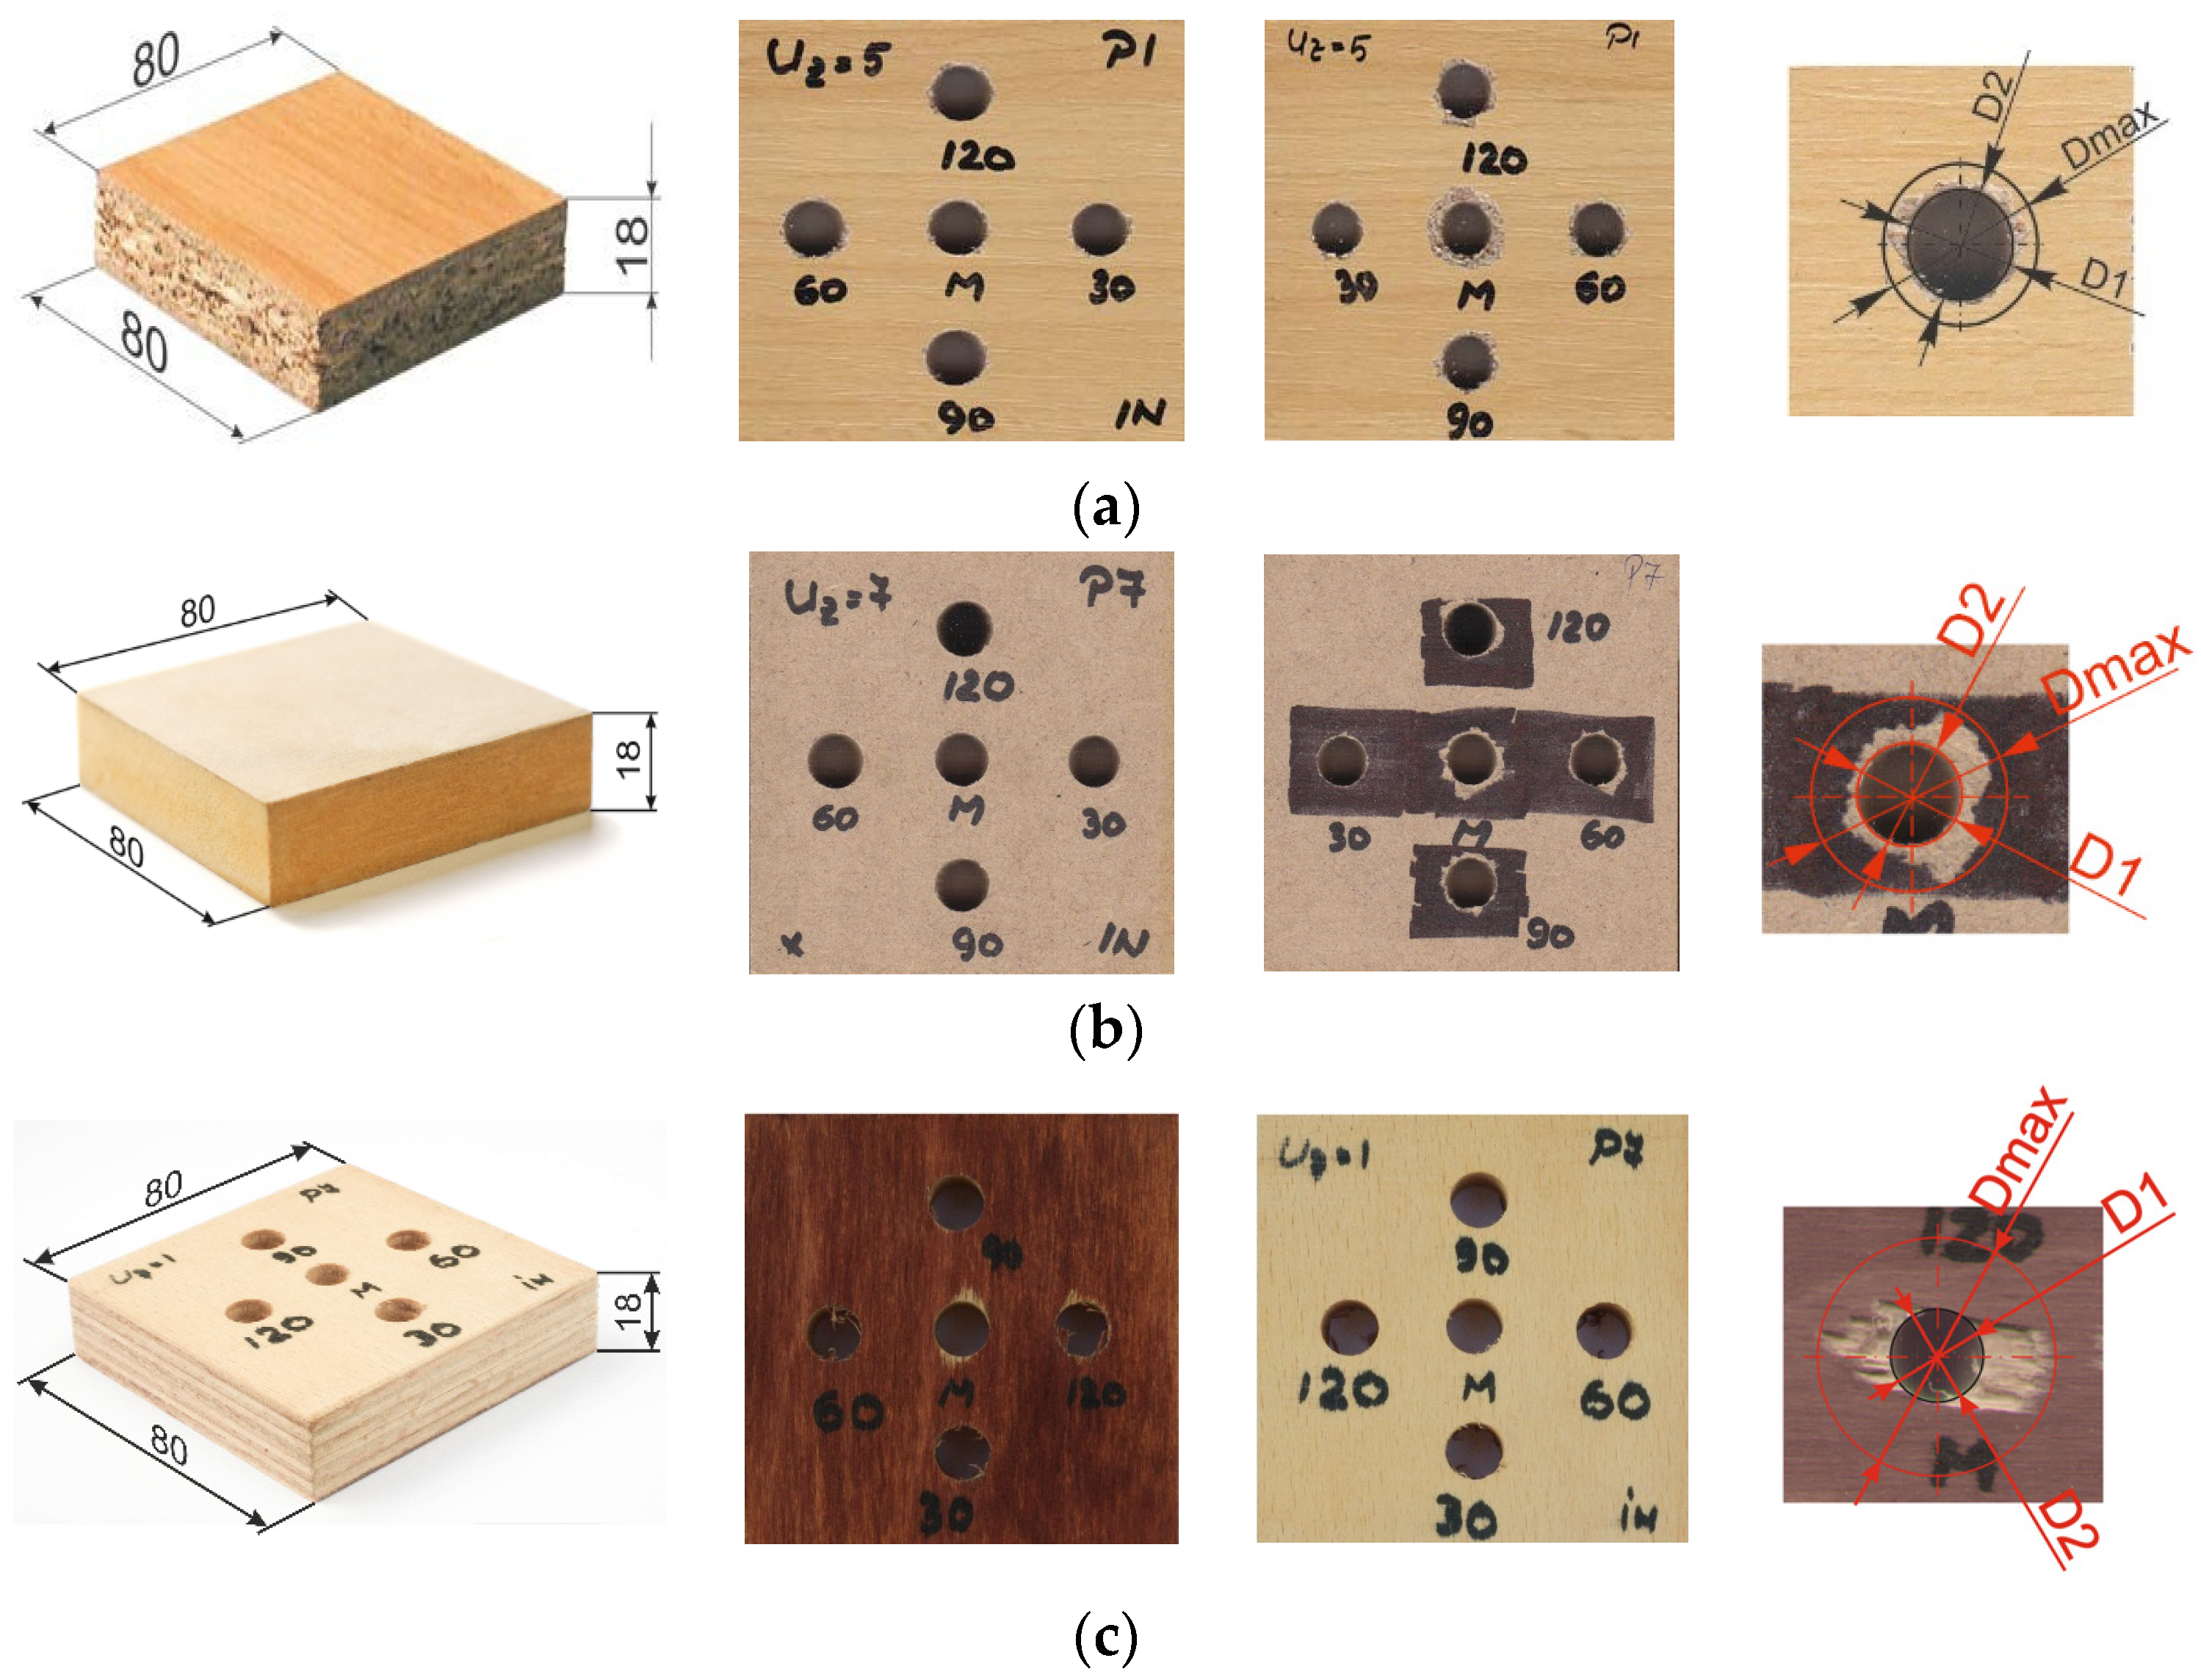
A total number of 240 samples were cut for the experiments: 80 square samples (□80 mm) were cut from a single 18 mm thick particleboard, another 80 samples were cut from a single 18 mm thick MDF, and the last 80 samples were from a similar plywood board (Figure 1). The average density was equal to 717 kg/m3 in the case of the particleboard; 747 kg/m3 for the MDF; and 769 kg/m3 for the plywood samples. Three-layer particleboards were used in this study. The plywood was made of 11 layers of beech (Fagus sylvatica L.) veneers, glued with urea-formaldehyde resin.
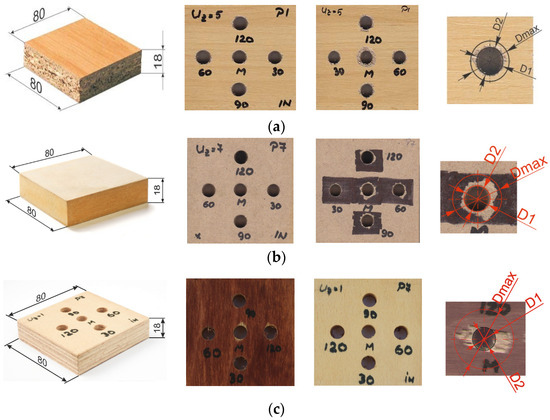
Figure 1.
Wood-based samples used for drilling experiments: (a) particleboard; (b) medium-density fiberboard; (c) plywood.
The experiments were performed with eight drill bits (10 mm cutting diameter). Four of the drill bits were twist drill bits and the other four were spade drill bits (rake angle γ = 0°) (as shown in Figure 2). The tip angle of the drill bits was different, having the values of 30°, 60°, 90°, and 120°, and the clearance angle α = 20°. The drill bits were named according to the tip angle: T30, T60, T90, T120. The drills were purchased from a specialized store (Leroy-Merlin) under the trade name DEXTER.
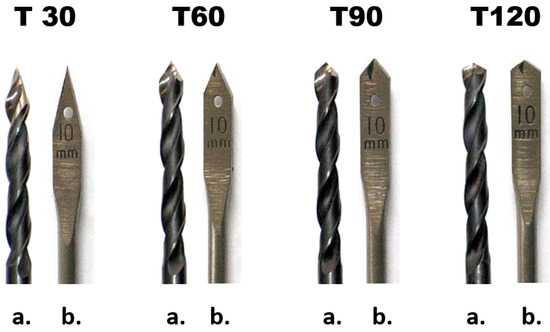
Figure 2.
The drill bits used for drilling of wood-based samples: (a) twist drills and (b) spade drills.
For each wood-based material used, the group of 80 samples was divided into smaller groups of 10 samples. According to the type of drills used, half of these samples were drilled with four different spade drills (T30, T60, T90, and T120) while the other half were drilled with the twist drills in a similar way. Each group of 10 samples was drilled with a different feed speed. The value of the feed speed was (vf) = 0.6, 1.8, 3.0, and 4.2 m/min; the rotation speed was the same for all specimens, n = 3000 rev./min; and the chipload (fz) had the values of 0.1, 0.3, 0.5, and 0.7 mm/rev.
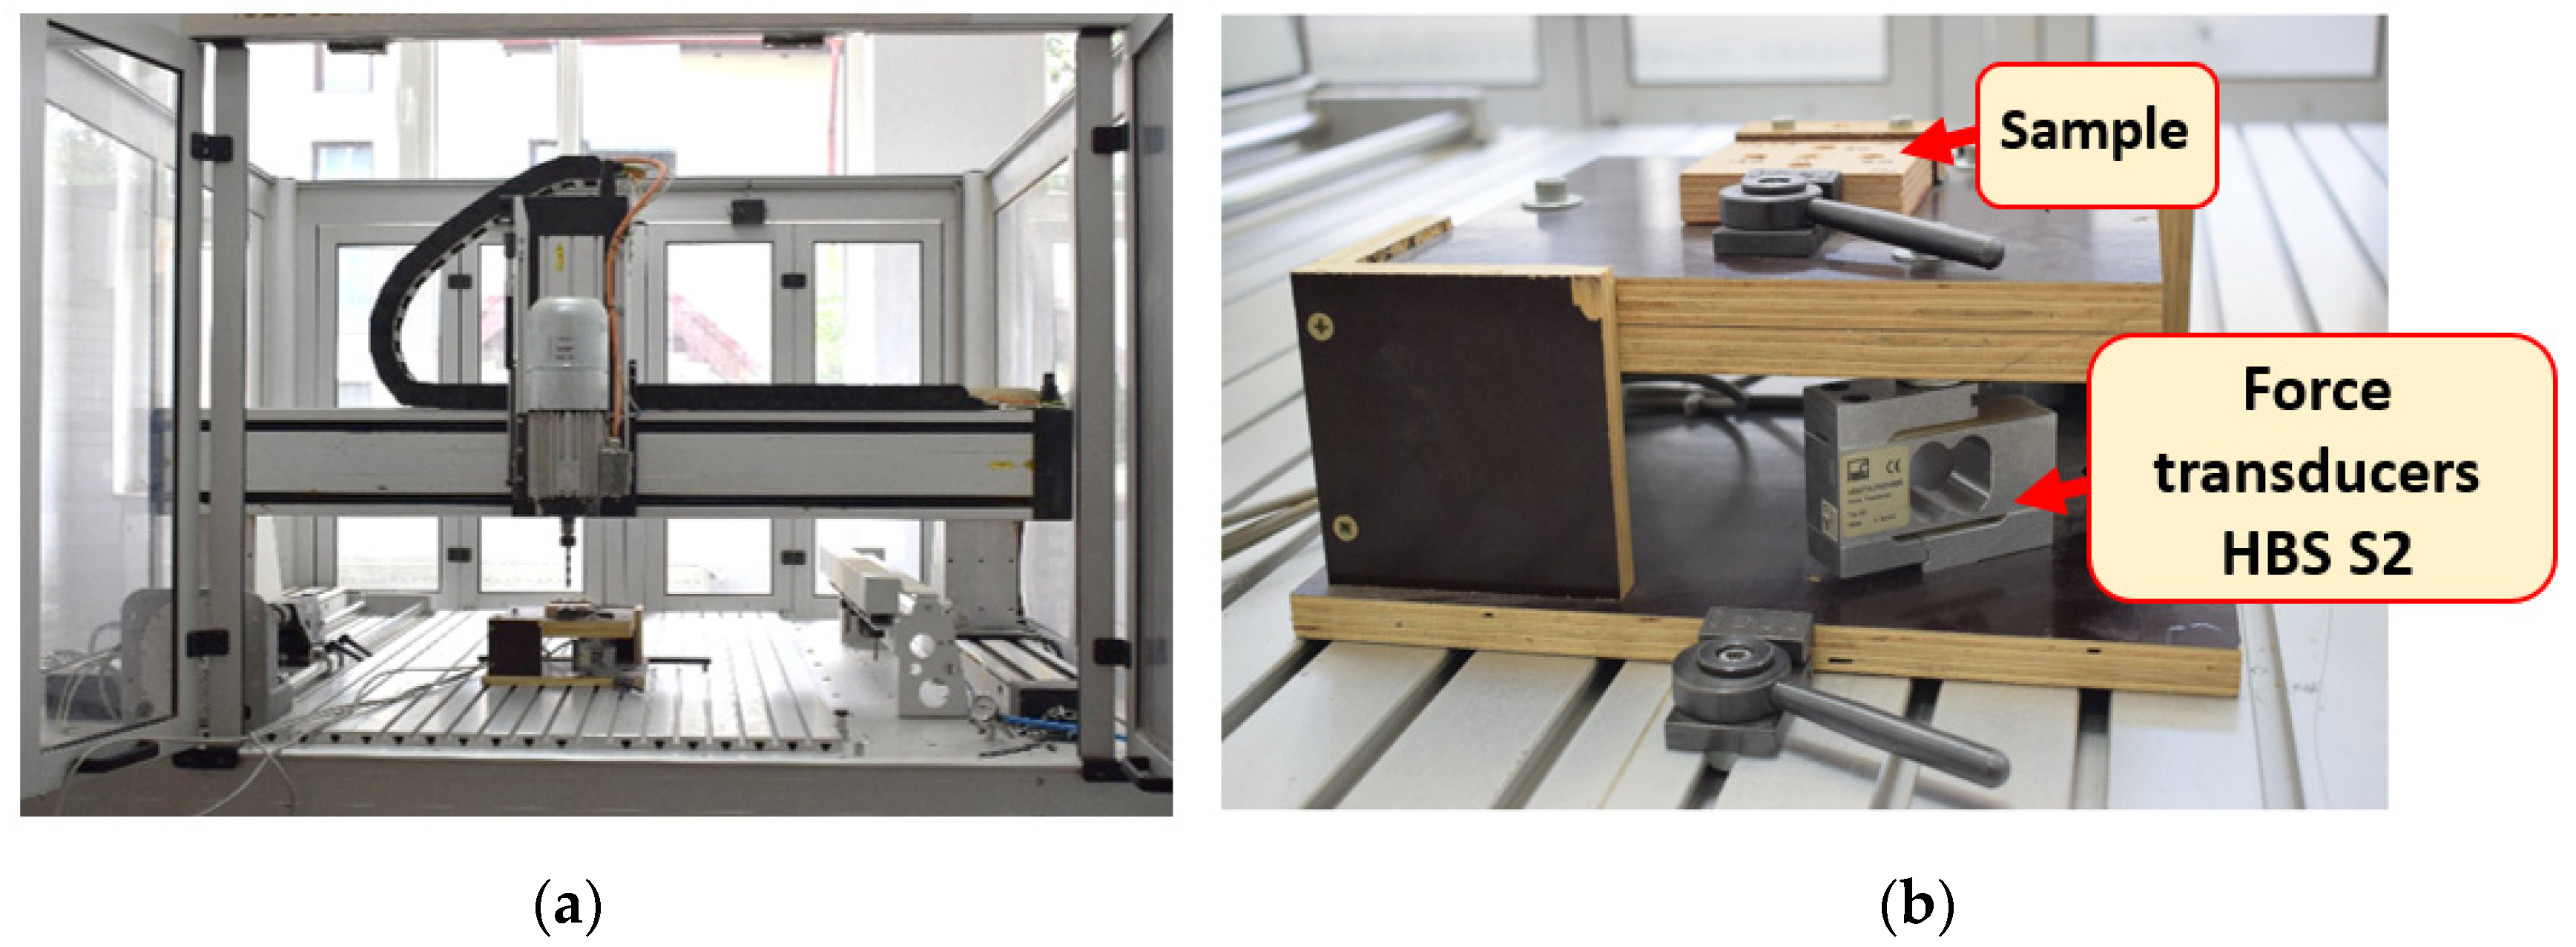
The machining of specimens was carried out using a CNC processing center, type ISEL GFV/GFY (ISEL Germany GmbH, Eichenzell, Germany). The CNC machine, which has adjustable rotational speed of the spindle (up to 15,000 rev./min) and adjustable feed speed on all 3 axes (X, Y, and Z), allowed the exact set-up of the cutting parameters. The thrust force was measured with a device composed of three HBS S2 force transducers (nominal force: 500 N) (as shown in Figure 3).
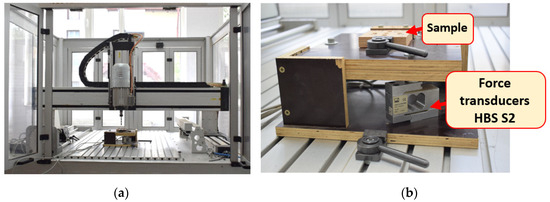
Figure 3.
The machine tool and the measuring device: (a) CNC processing center type ISEL GFV/GFY; (b) the force transducer device.
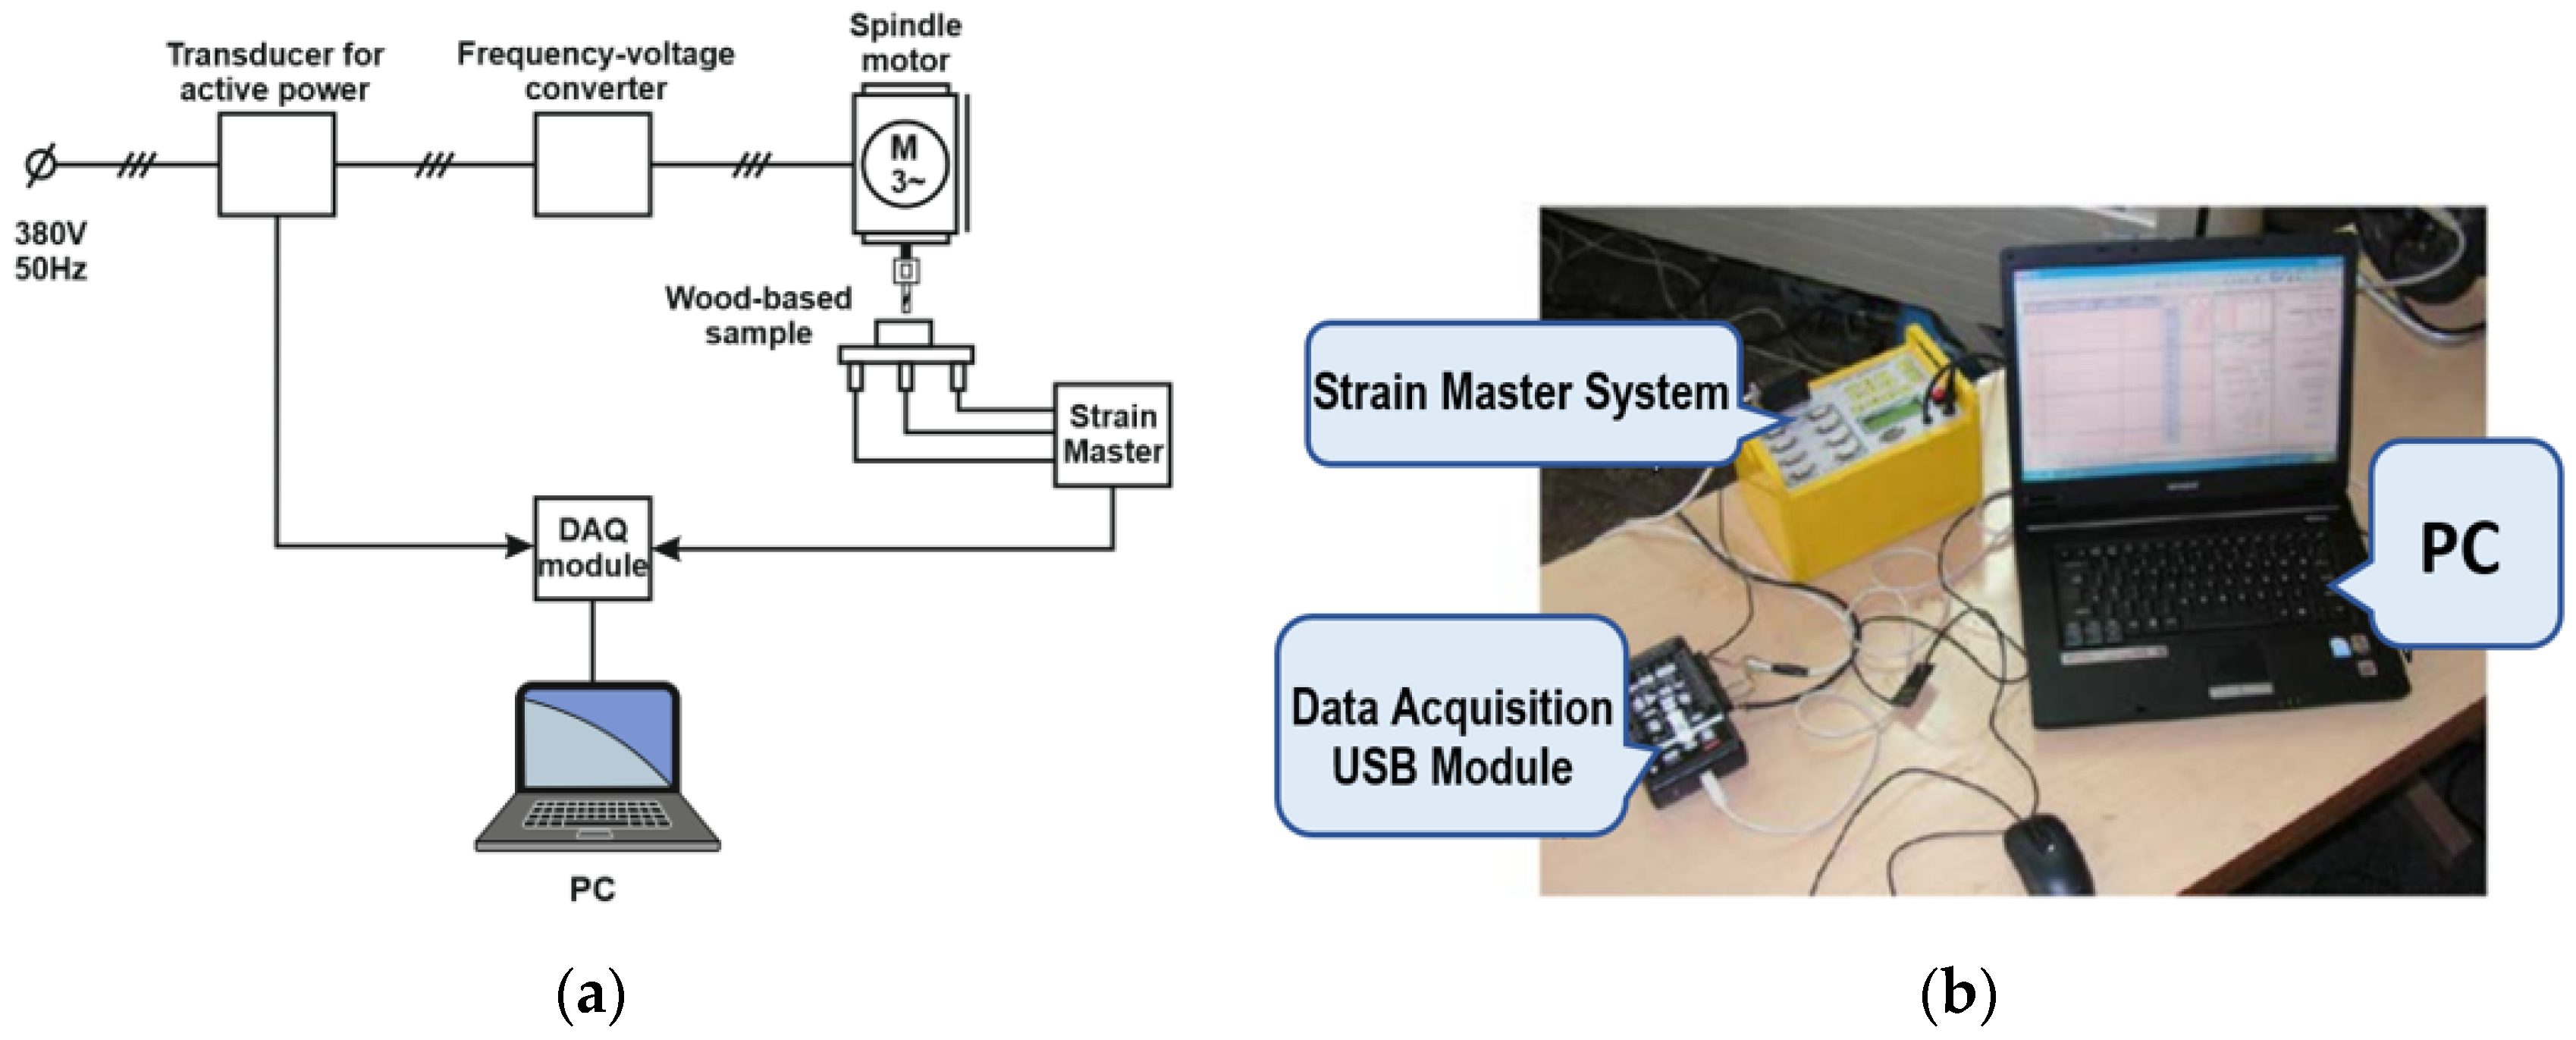
In order to measure the active power consumed by the spindle motor, a Camille Bauer Sineax P530/Q531 (Camille Bauer Metrawatt AG, Wohlen, Switzerland) transducer for active and reactive power was used. The data were recorded by a DAQ Board Keithley Model KUSB-3108 (Tektronix UK Ltd., Bracknell, UK) and the Keithley KUSB QuickDataAcq software v. 1.5.5.0 (Tektronix UK Ltd, Bracknell, UK). Four channels of the DAQ system were used to record data simultaneously: three channels were used to record data from force sensors and one channel was for the active power. In Figure 4, the equipment used for measurements and connection diagram are presented.

Figure 4.
Power and force measurement: (a) the connection diagram; (b) the equipment used.
Regarding the obtained data, the sum of the values recorded by the tree force transducers represents the thrust force (FT). The active power consumed for spindle rotation (PT) contains both the power consumed for idle spindle rotation (P0), and the power consumed while drilling the samples (PD).
The drilling torque (TD) was calculated with Equation (1):
where
PD—represents the active power consumed only for drilling, PD = PT − P0, in W;
n—is spindle rotation, in rpm.
The delamination factor (Fd) was calculated through Equation (2):
2.2. Data Modeling
From the experimental data, 382 values were selected to design four ANN models that are able to predict the delamination factor at the inlet (Y1), delamination factor at the outlet (Y2), thrust force (Y3), and drilling torque (Y4) based on selected inputs, namely, the drill tip angle (X1), chipload (X2), drill type (X3), and material type (X4). These models were validated by means of 95 experimental values. These values were not used during the training and testing phase of neural networks. To sum up, 80% of experimental values were used to design the neural networks and around 20% were involved during the validation phase.
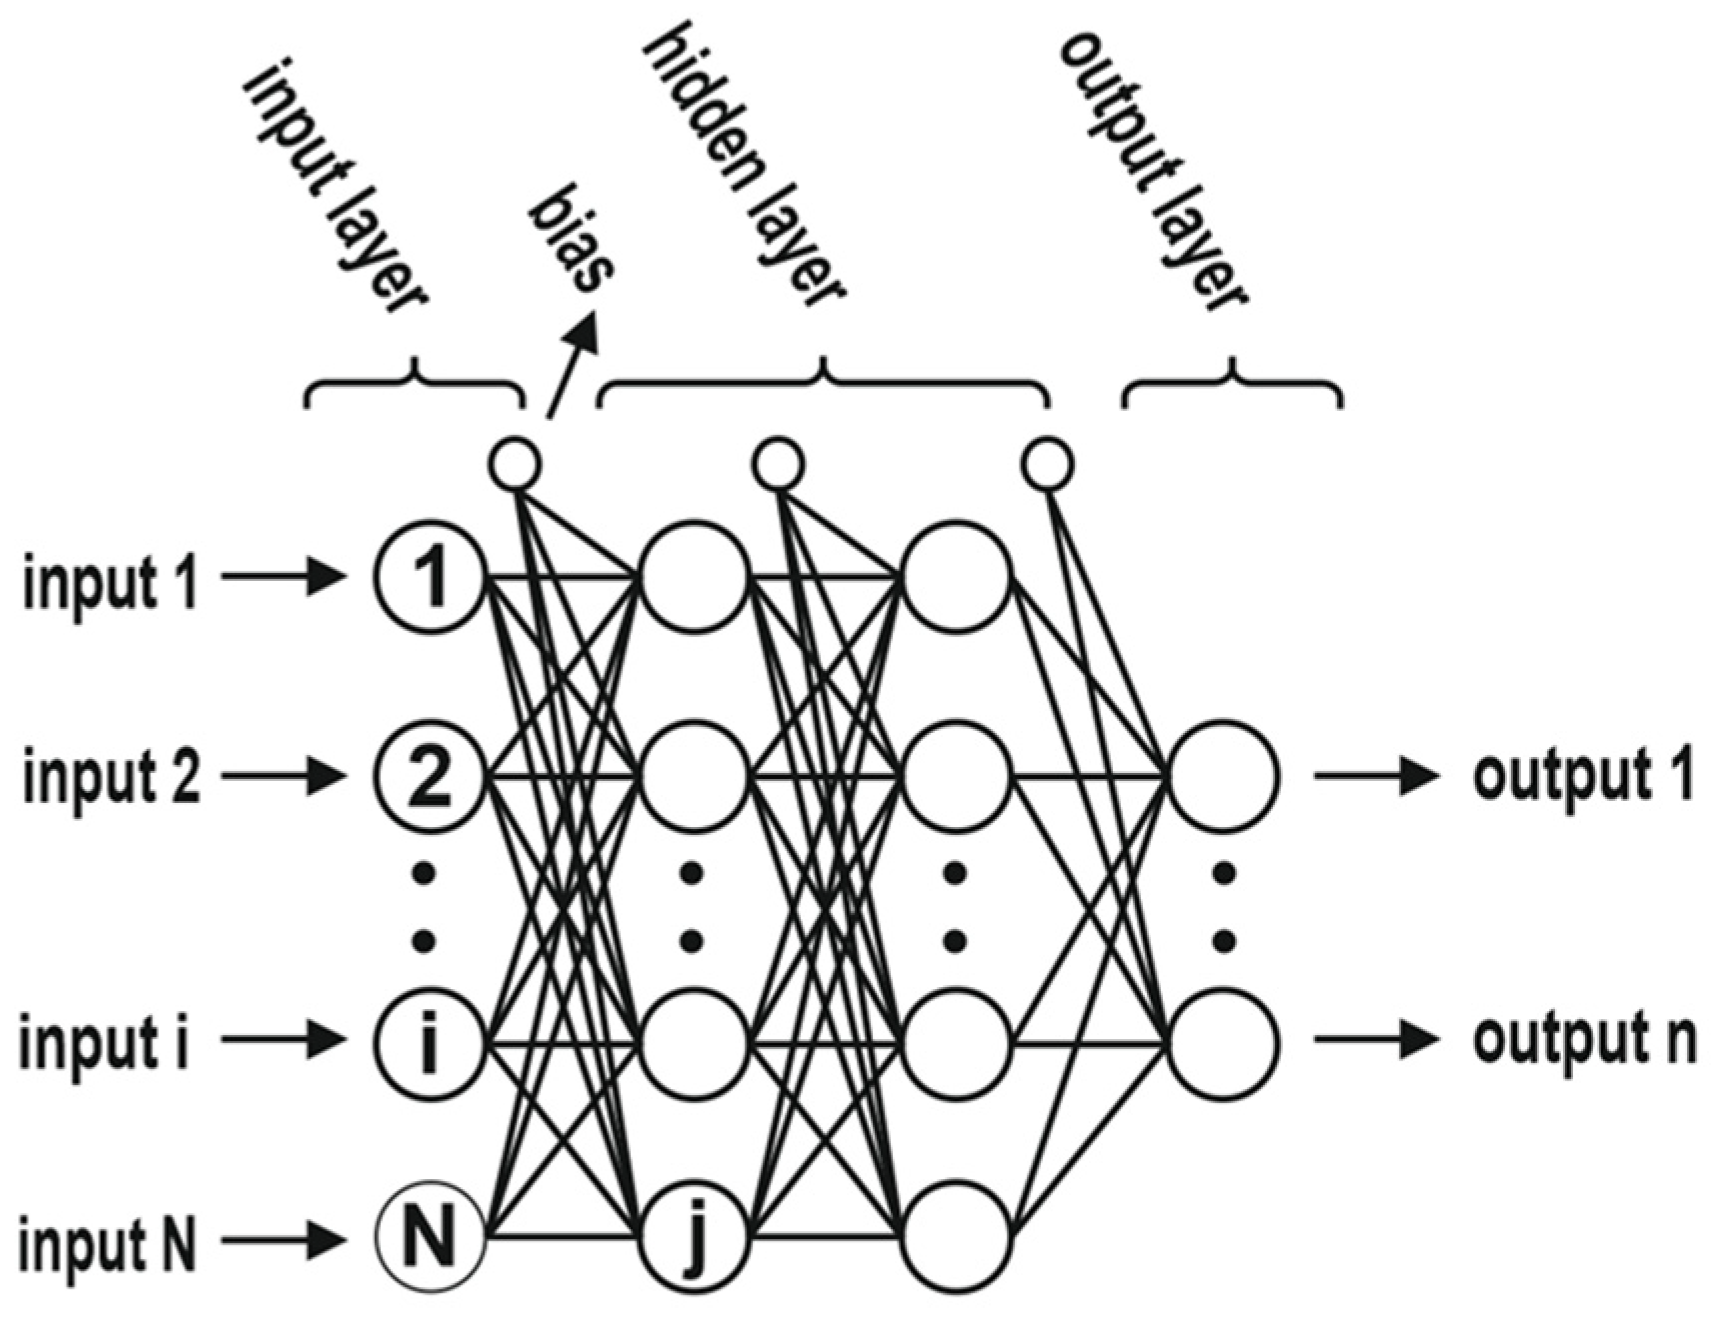
In this work, a typical Multi-Layer Perceptron (MLP) architecture was chosen (Figure 5). This architecture contains an input layer, one or more hidden layers, and an output layer. More information about this kind of network architecture can be found in the literature [16,17,18].

Figure 5.
The general aspect of a Multi-Layer Perceptron architecture.
The performance of designed ANN models was revealed through the coefficient of correlation (R) (Equation (3)), coefficient of determination (R2) (Equation (4)), root mean square error (RMSE) (Equation (5)), and mean absolute percentage error (MAPE) (Equation (6)) [12]. The corresponding equations are
where is the experimental value, is the predicted value of the ANN model, is the mean of experimental values; is the mean of predicted values, and n is the total number of values. In addition, the predicted values were plotted against experimental data [17].
The ANN models were designed though Neural Works Predict Software v.3.24.1 (Neural Ware Inc., Carnegie, PA, USA). More information about this software can be found in the literature [2,18].
The next step of the proposed modelling approach was to generate an experimental design based on the data presented in Table 1. The obtained experimental design is presented in Table 2. The experimental design was obtained by means of Design Expert Software (Version 9, Stat-Ease Inc., Minneapolis, MN, USA), according to an approach, which were presented in a previous work [4].

Table 1.
The name, levels, and type of analyzed factors (independent variables).
Table 2.
The experimental design that was used in this study.
Based on the experimental design presented in Table 2, for each response, a polynomial model that best describes the relation between factors and analyzed responses was revealed. Its general form is described by Equation (7) [19].
where Y is the response or the dependent variable; and are the analyzed independent variables or factors; is the constant; , , and are the coefficients of the equation; is the error term; and represents the number of analyzed factors. The coeficient of determination (R2) describes the model accuracy. ANOVA was used to reveal the factors that significantly affect the responses. The analysis was performed at a significance level of 5% (α = 0.05).
3. Results and Discussion
3.1. Designed Neural Networks
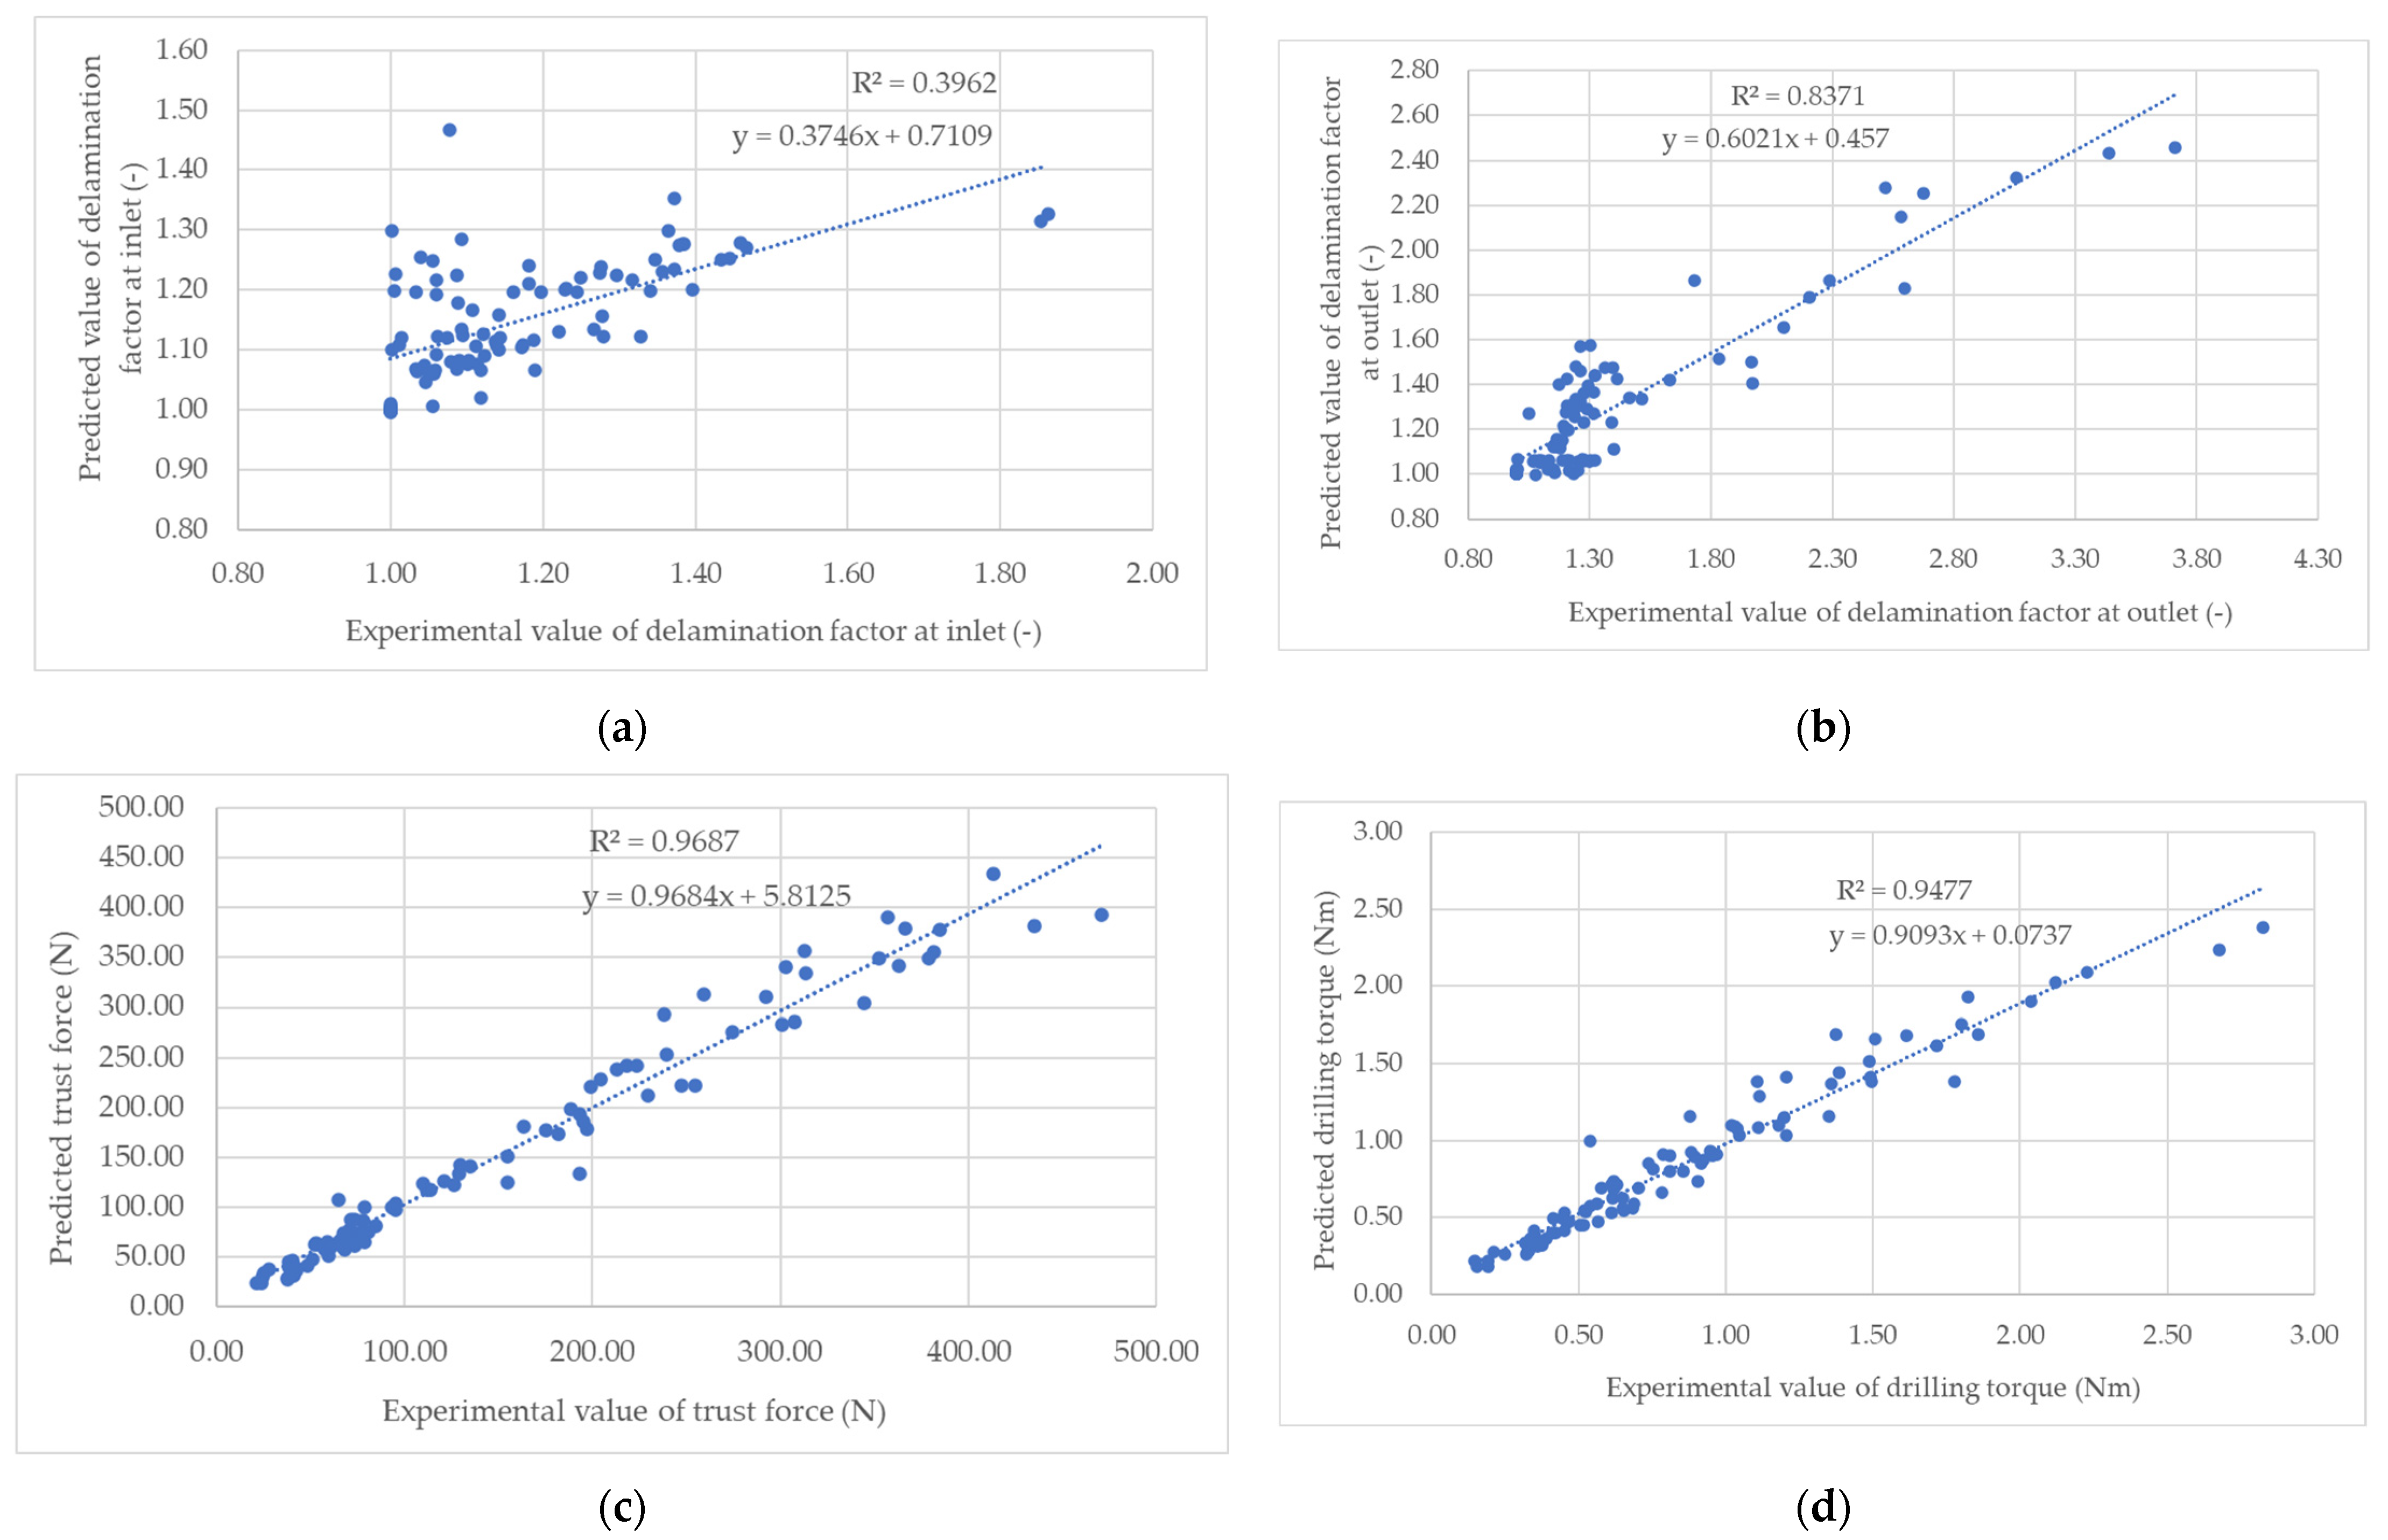
In Table 3, the characteristics of designed networks and value of performance indicators are presented. The number of neurons in the hidden layers varies between 4 and 23. The designed ANN models have a reasonable accuracy, namely, a high R or R2, and a low RMSE or MAPE. The scatter-plots, which are presented in Figure 6, show, also, that ANN models perform well with an unknown data set.
Table 3.
The performance indicators of designed ANN during the validation phase.
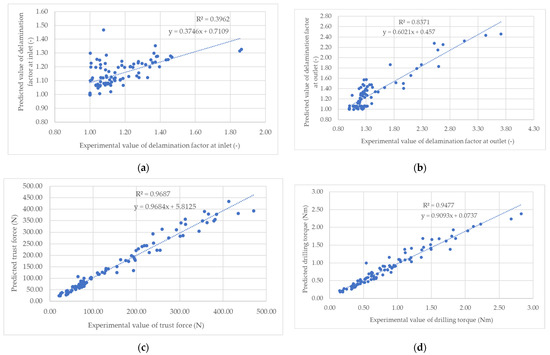
Figure 6.
Comparation regarding the experimental and predicted values by the ANN models. (a) delamination factor at inlet; (b) delamination factor at outlet; (c) thrust force; (d) drilling torque.
3.2. Response Surface Methodology
3.2.1. Delamination Factor at Inlet
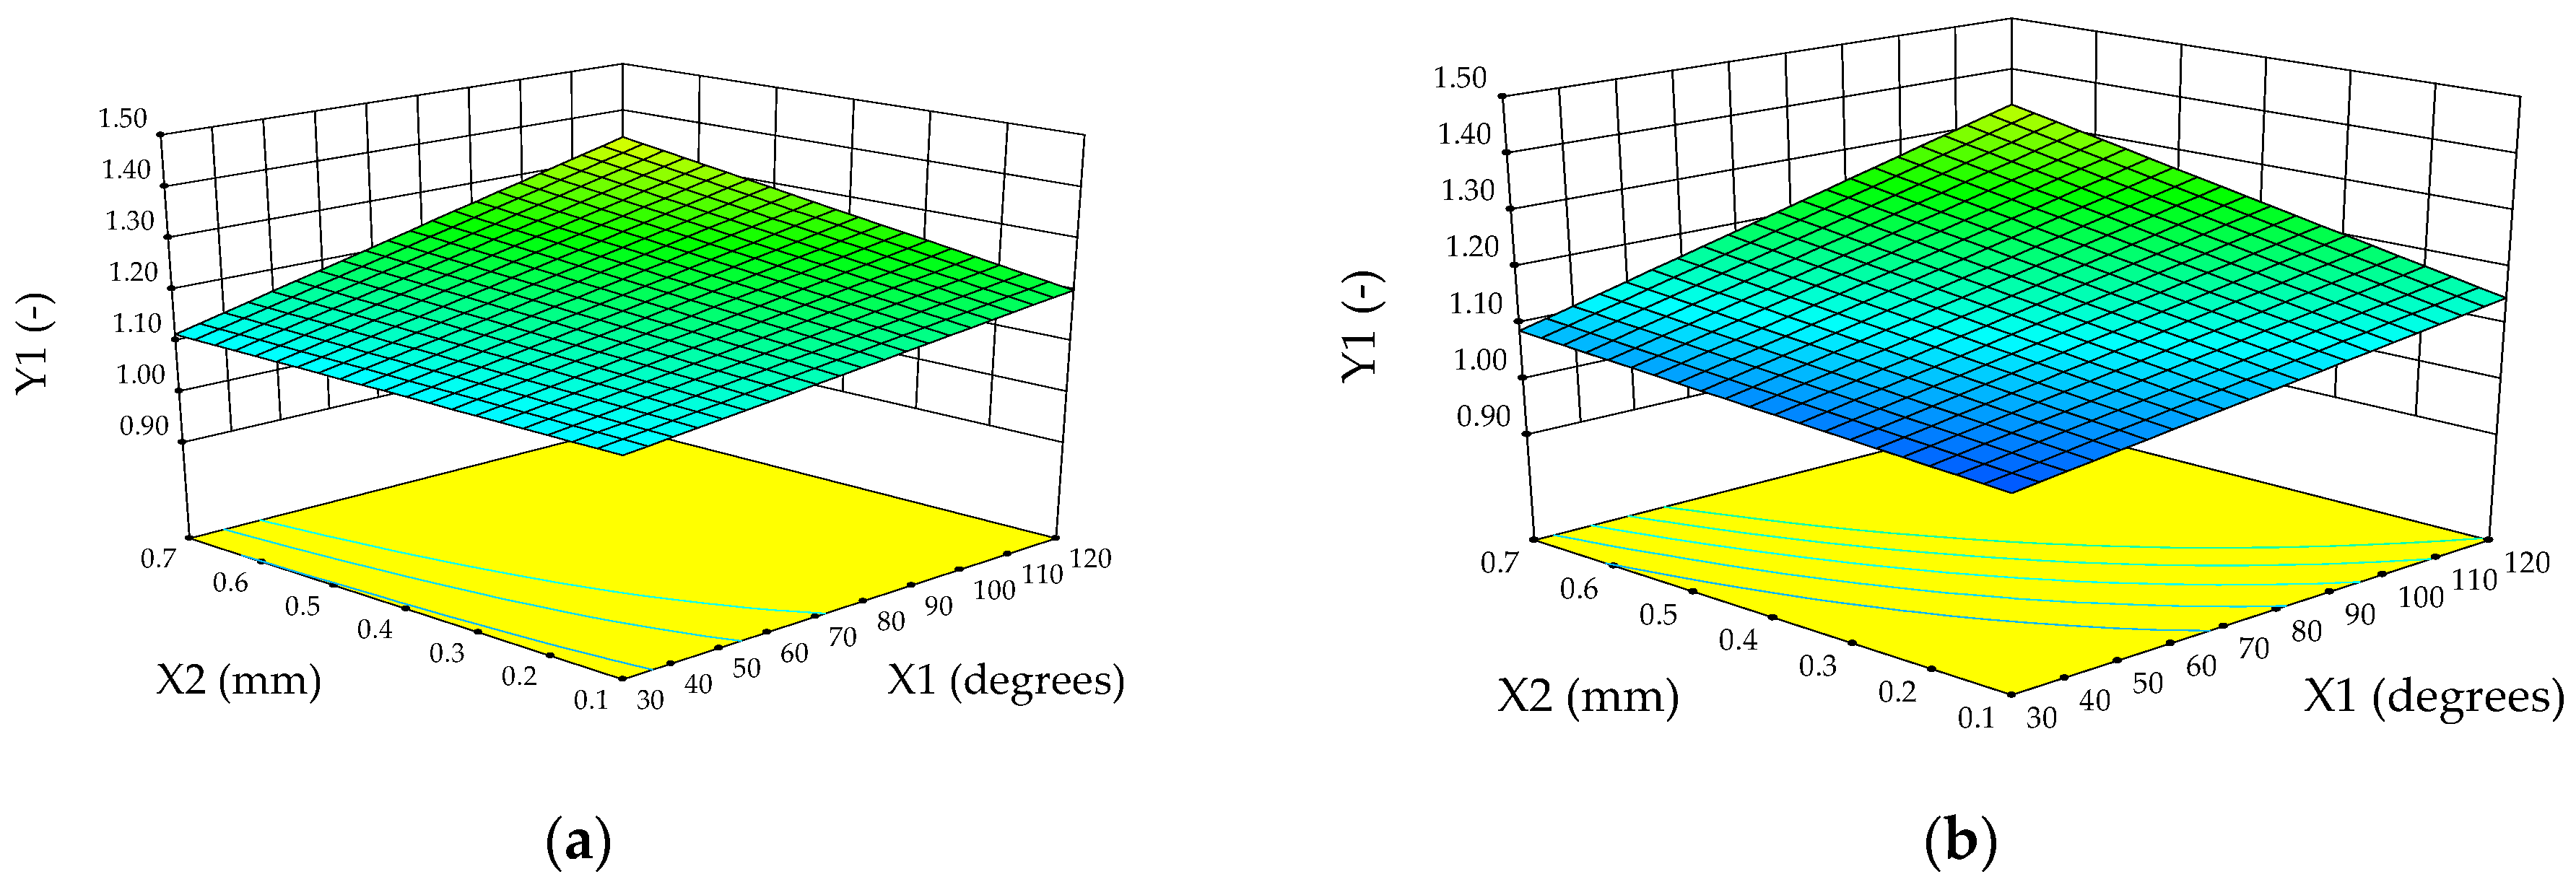
The ANOVA results regarding the factors that affect the delamination factor at the inlet of the drill in the material are presented in Table 4. The model (2FI) that best describes the relation between the inputs and the outputs is presented by Equation (8). Based on the factor coefficients, it could be stated that the delamination factor at the inlet (Y1) is most affected by the type material (X4) that is processed. This result is supported by the data presented in the literature [9]. The influence is bigger in the case of a twist drill than in the case of a spade drill. The second factor that affects the delamination at the inlet is the chipload (X2). The third one is the drill tip angle (X1) and the fourth one is the drill type (X3). There is a synergetic effect of analyzed factors. These interactions can be observed in Figure 7, Figure 8 and Figure 9. The most important effect is between the drill tip angle (X1) and the chipload (X2). Equations (9)–(14) could be used to make a prediction about the delamination factor at the inlet (response) based on the analyzed input factors. The values of factors must be in the original units.
Table 4.
The results of ANOVA regarding the factors that affect the delamination factor at the inlet.
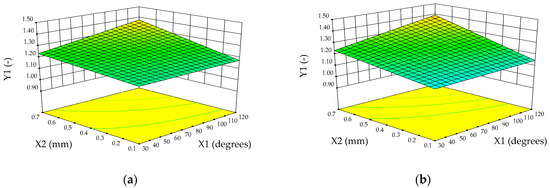
Figure 7.
The influence of the drill tip angle (X1) and chipload (X2) on the delamination factor at the inlet in the case of prelaminated particleboards: (a) spade drill; (b) twist drill.
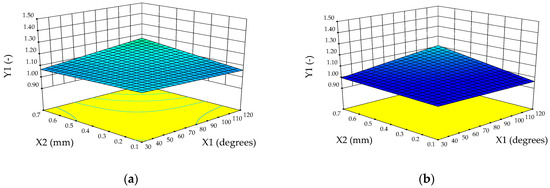
Figure 8.
The influence of the drill tip angle (X1) and chipload (X2) on the delamination factor at the inlet in the case of MDF: (a) spade drill; (b) twist drill.

Figure 9.
The influence of the drill tip angle (X1) and chipload (X2) on the delamination factor at the inlet in the case of plywood: (a) spade drill; (b) twist drill.
3.2.2. Delamination Factor at Outlet
A 2FI polynomial model was revealed by the Design expert software version 9 to describe the relation between the independent variables and the delamination factor at the outlet (Y2). Its coded form is presented in Equation (15). The delamination factor at the outlet is most influenced by the drill type (X3). The next factor that affects the delamination factor at the output is the material type (X4). The influence of the material on the delamination factor at the output is greater in the case of a twist drill, compared with a spade one. This finding is the same as that obtained in the case of the delamination factor at the inlet. The third factor that affects the delamination factor at the outlet is the drill tip bit angle (X1) and the fourth one is the chipload (X2). Also, there are some interactions among factors (Figure 10, Figure 11 and Figure 12). The most important interaction is between the drill tip bit angle (X1) and the drill type (X3). The ANOVA results are presented in Table 5. The obtained results are supported by the data presented in the literature; namely, the feed rate, material type, drill type (spade or twist), and drill tip angle influence the value of the delamination factor [1,6,9,10,20].
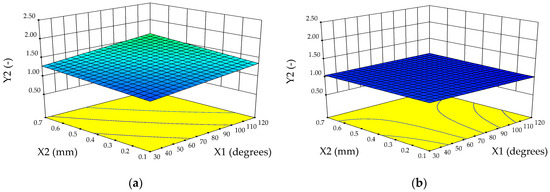
Figure 10.
The influence of the drill tip angle (X1) and chipload (X2) on the delamination factor at the outlet in the case of prelaminated particleboards: (a) spade drill; (b) twist drill.
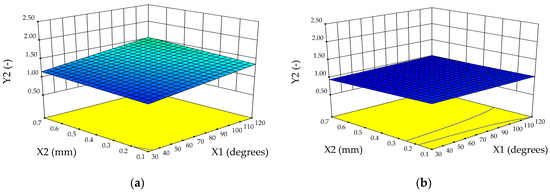
Figure 11.
The influence of the drill tip angle (X1) and chipload (X2) on the delamination factor at the outlet in the case of MDF: (a) spade drill; (b) twist drill.
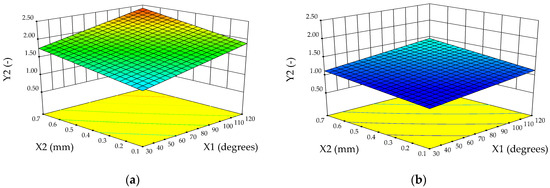
Figure 12.
The influence of the drill tip angle (X1) and chipload (X2) on the delamination factor at the outlet in the case of plywood: (a) spade drill; (b) twist drill.
Table 5.
The results of ANOVA regarding the factors that affect the delamination factor at the outlet.
3.2.3. Thrust Force
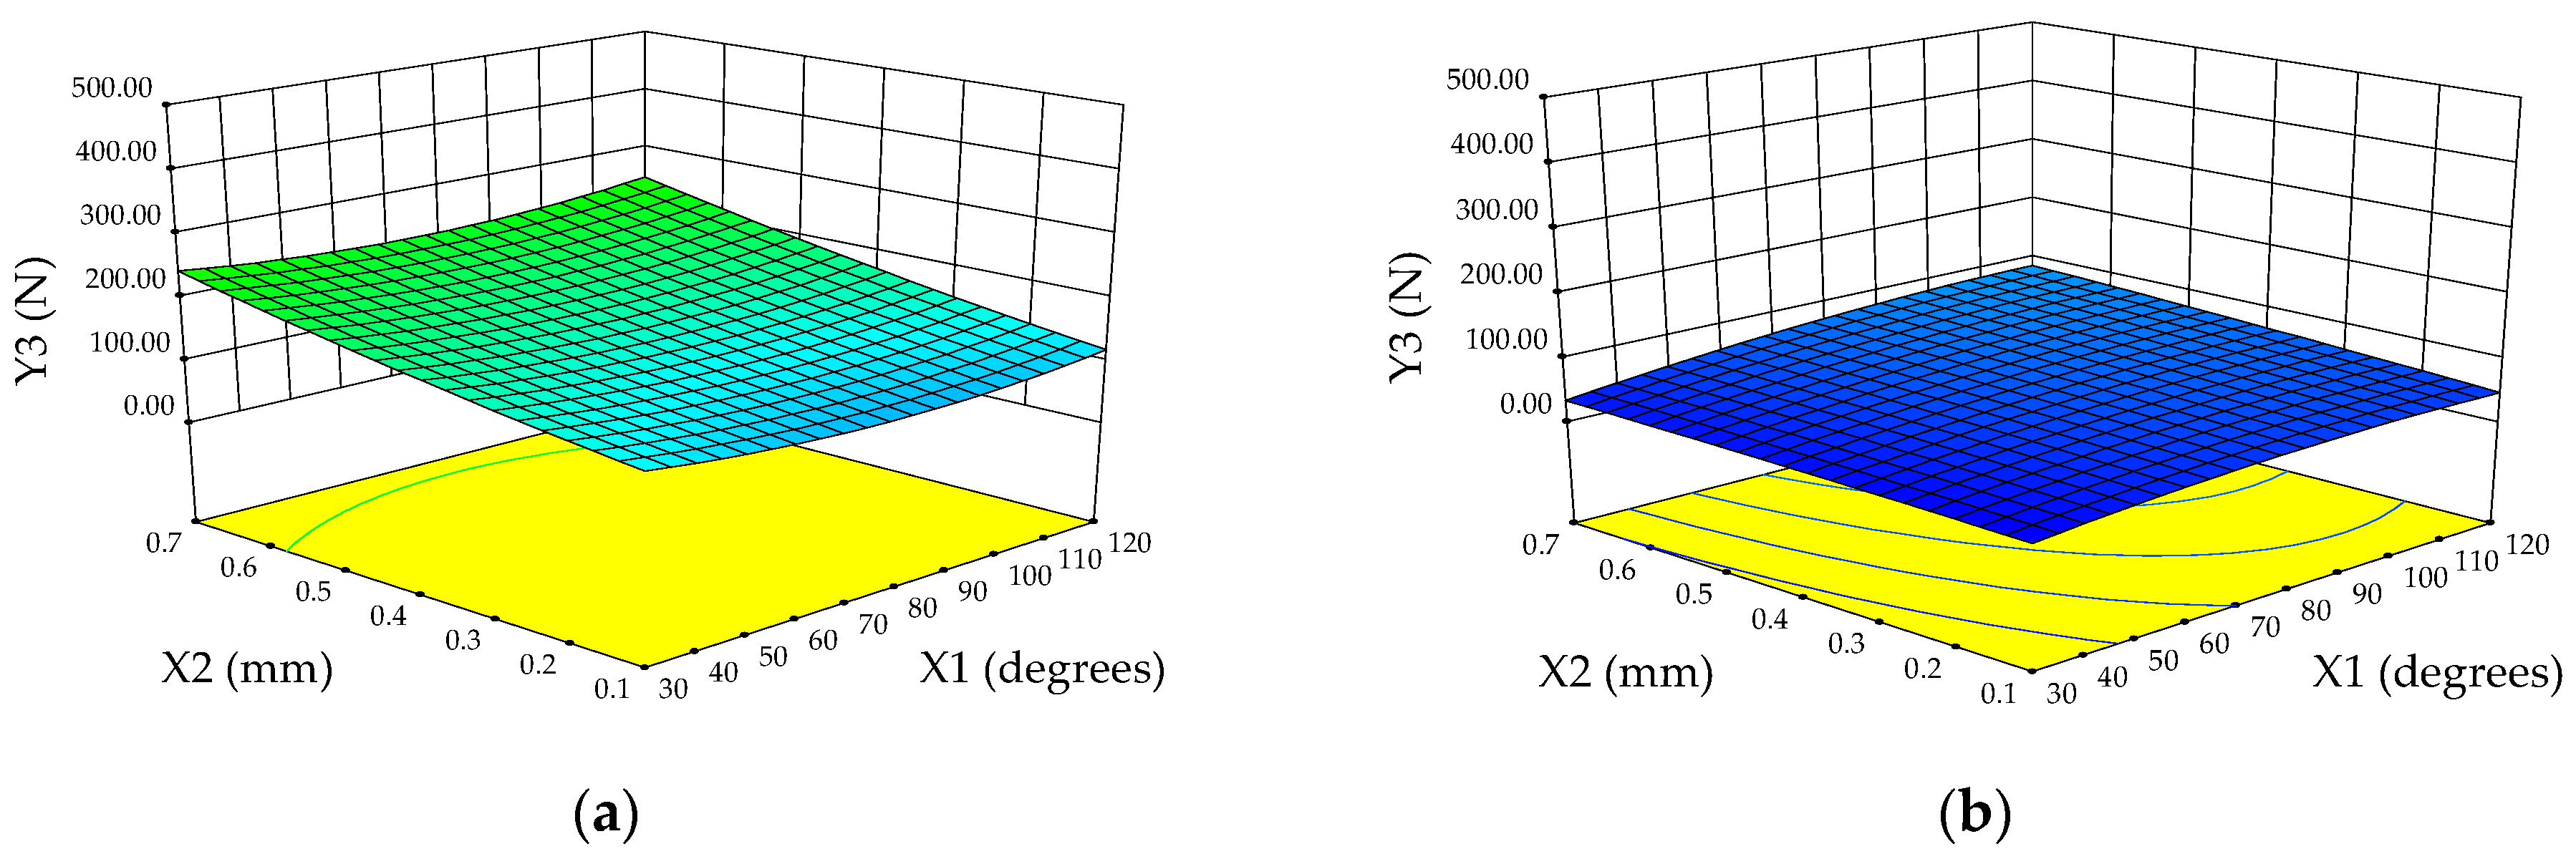
The most important factor that influences the thrust force (Y3) during drilling of wood-based composites is the drill type (X3). The second one is the chipload (X2). The third one and fourth one are the material type (X4) and the drill tip bit angle (X1), respectively. There are also interactions among these factors (Table 6). The most important interaction is between the drill type (X3) and material type (X4). The coded and real form of the obtained quadratic polynomial model are presented in Equations (22)–(28). The influence of the drill tip angle and the chipload on the thrust force is pictured in Figure 13, Figure 14 and Figure 15. These findings are also correlated with the data available in the literature, namely, that the drill type, feed speed, and drill tip angle affect the value of thrust force during drilling of wood-based composites [1,21,22].
Table 6.
The results of ANOVA regarding the factors that affect the thrust force.

Figure 13.
The influence of the drill tip angle (X1) and chipload (X2) on the thrust force in the case of prelaminated particleboards: (a) spade drill; (b) twist drill.
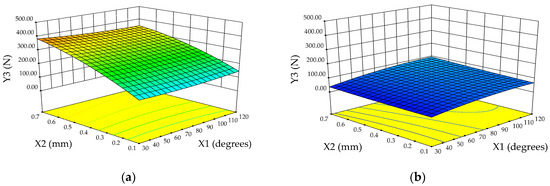
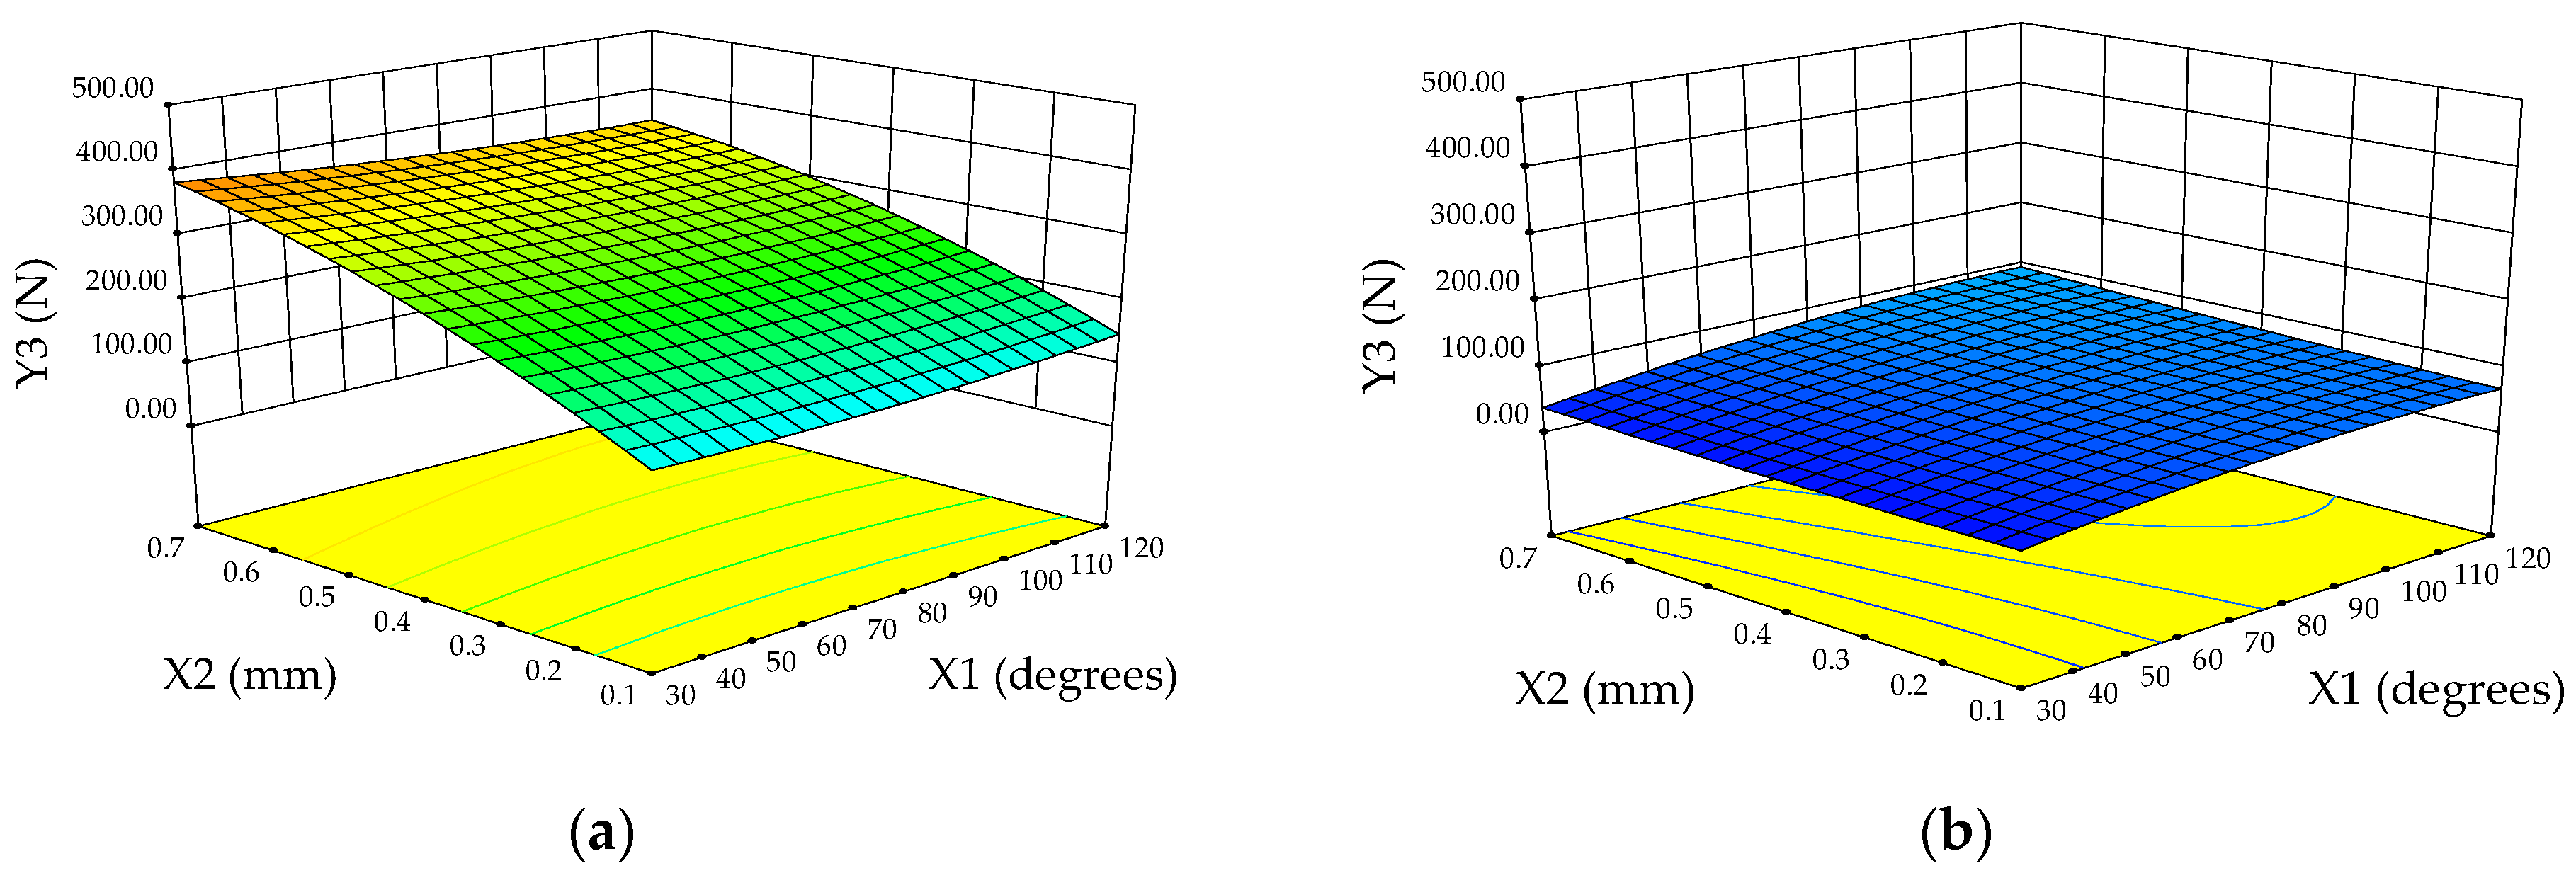
Figure 14.
The influence of the drill tip angle (X1) and chipload (X2) on the thrust force in the case of MDF: (a) spade drill; (b) twist drill.
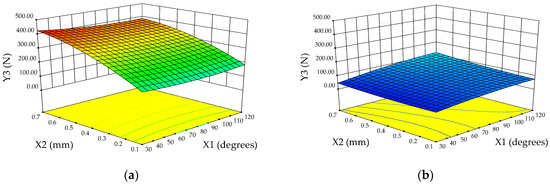
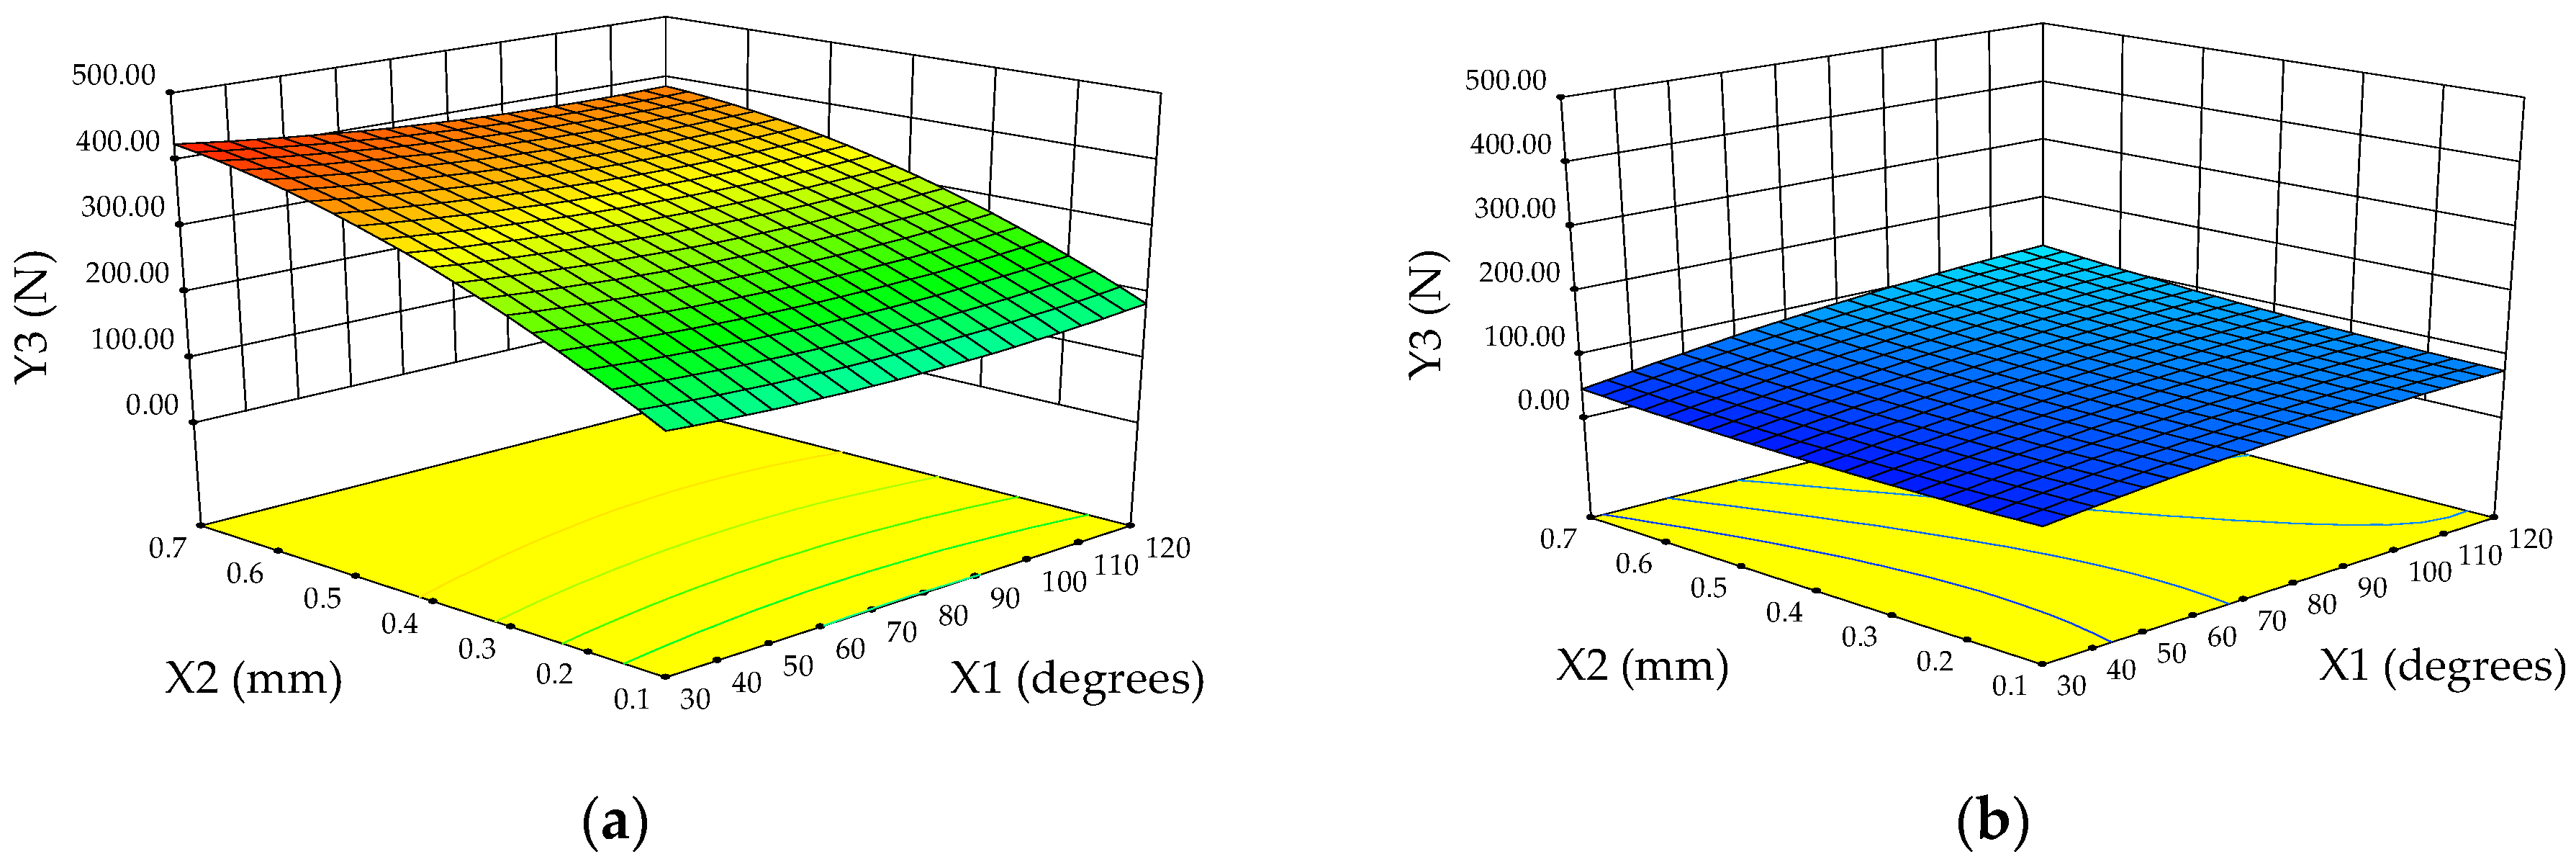
Figure 15.
The influence of the drill tip angle (X1) and chipload (X2) on the thrust force in the case of plywood: (a) spade drill; (b) twist drill.
3.2.4. Drilling Torque
The factors that statistically affect the drilling torque (Y4) are presented in Table 7.
Table 7.
The results of ANOVA regarding the factors that affect the drilling torque.
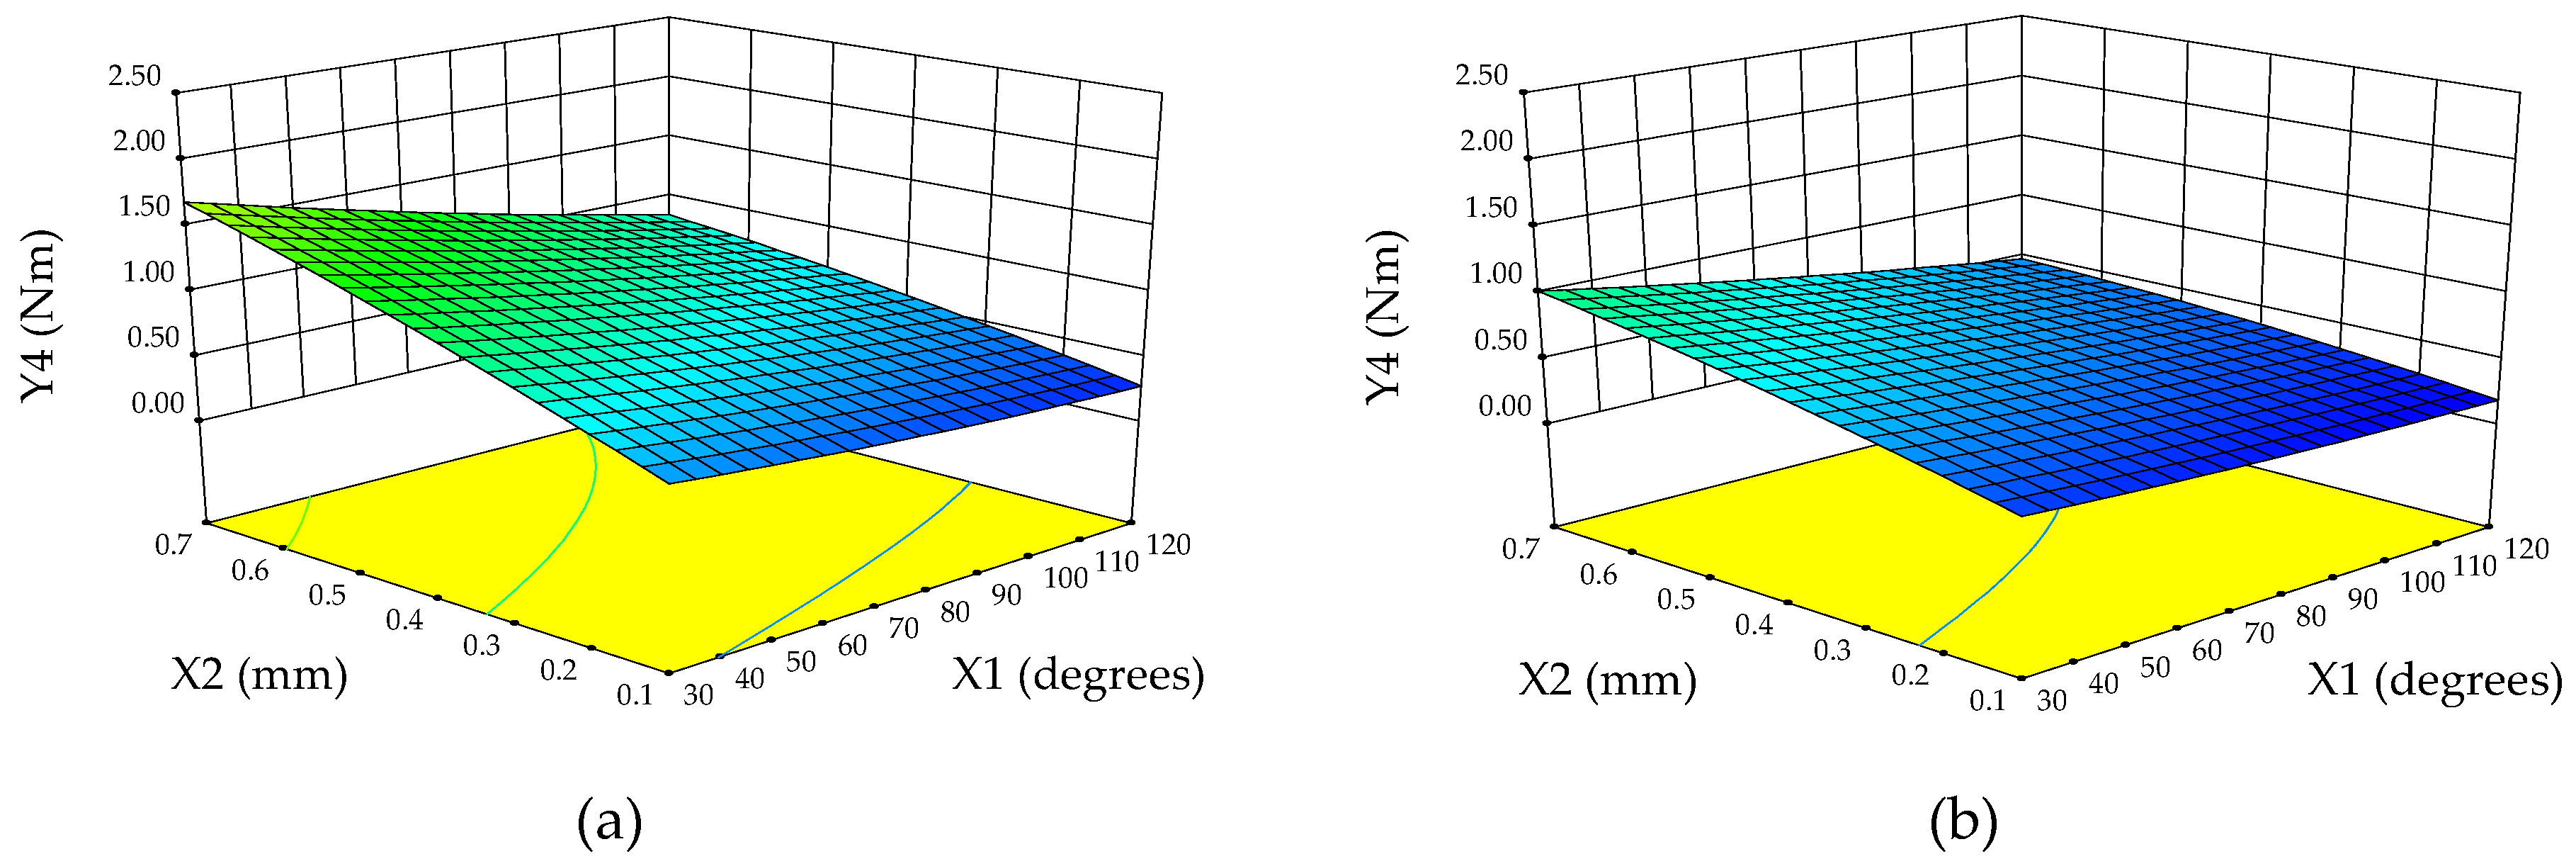
The quadratic model that explains the relation between the analyzed inputs and outputs (in coded form) is presented in Equation (29). The equations in real form are presented in Equations (30)–(35). The most important factor that affects the drilling torque is the chipload (X2). The second one is the drill tip angle (X1). The third one is the drill type (X3) and the fourth one is the material type (X4). The influence of the drill tip angle (X1) and chipload (X2) on the drilling torque is presented in Figure 16, Figure 17 and Figure 18. Also, these results are correlated with data presented in the literature; namely, the drilling torque is influenced by the feed rate, drill type, material type, and tip angle of the drilling tool [1,21,22].
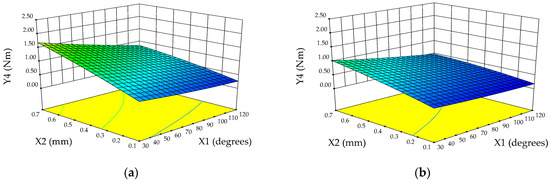
Figure 16.
The influence of the drill tip angle (X1) and chipload (X2) on the drilling torque in the case of prelaminated particleboards: (a) spade drill; (b) twist drill.
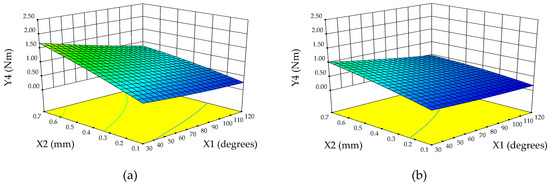
Figure 17.
The influence of the drill tip angle (X1) and chipload (X2) on the drilling torque in the case of MDF: (a) spade drill; (b) twist drill.
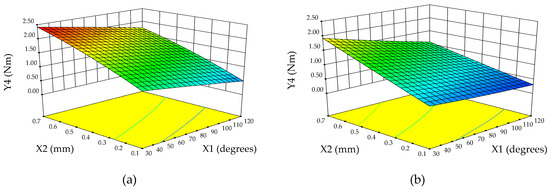
Figure 18.
The influence of the drill tip angle (X1) and chipload (X2) on the drilling torque in the case of plywood: (a) spade drill; (b) twist drill.
In Table 8, the criteria are presented that were defined in the Design Expert Software version 9 (Stat-Ease Inc., Minneapolis, MN, USA), which used the desirability function approach during this multiple response optimization study, to reveal the optimum values of factors during drilling of wood-based composites. The optimization algorithm starts by assigning to each response (Yi) an individual desirability function (di). The assigned value is between 0 and 1. When the analyzed output or dependent variable fulfills the optimization goal, the di is equal to 1. These individual desirabilities are pooled by means of the geometric mean, which represents the overall desirability (D) and it is calculated by Equation (36) [23].
where n represents the number of dependent variables during the optimization study.
Table 8.
Criteria for different factors and responses defined in the optimization study.
The obtained results are presented in Table 9. One could observe that a twist drill assures a high coefficient of desirability compared to a spade drill in the case of the analyzed wood-based materials (PB, MDF, and plywood). Therefore, it could be stated that a twist drill leads to a more efficient drilling than a spade drill. The same results were obtained by Kumar and Jayakumar [10]. In addition, it can be observed that a twist drill tip equal to 30° with a chipload of 0.1 mm/rev. could be used to drill the prelaminated particleboard, MDF, or plywood. A twist drill with α = 120° and a chipload of 0.1 mm/rev. could be used to efficiently drill both the PB and MDF boards. A drill tip angle of 90° and a chipload of 0.1 mm/rev. also assure an optimal drill both for plywood and PB when the drill type is either twist or spade.
Table 9.
The optimum solution regarding the drilling of wood-based composites.
Since the relative error between experimental and predicted values, which was calculated with Equation (37), has reasonable values, it could be stated that the proposed methodology represents a tool that could be used to optimize the drilling process of wood-based composites like prelaminated wood-particleboard, MDF, and plywood.
where ER is the relative error (%), Y is the experimental value, and is the predicted value.
The obtained results regarding the delamination factor during drilling of wood-based composites are correlated with the data published in the literature; namely, a small tip angle with a low feed rate assures a lower delamination factor and a lower thrust force during drilling of wood-based composites [1,6]. The drill type and chipload affect both the thrust force and drilling torque [2,21,22]. The material type influences both the quality of holes and cutting forces during drilling of wood-based composites [9].
4. Conclusions
- Artificial neural networks (ANNs) and response surface methodology (RSM) were successfully applied to predict drilling parameters to optimize the delamination factor, thrust force, and drilling torque in a particleboard, MDF, and plywood. Compared to experimental data, both the ANN and RSM models demonstrated reasonable accuracy, as evidenced by their high coefficient of determination (R2), which indicates their effectiveness in revealing the individual influence of factors on the drilling process.
- The material type was found to significantly impact the delamination factor.
- The drill type (twist vs. spade) primarily influenced the thrust force.
- The chipload (feed rate) was identified as the most critical factor affecting drilling torque.
The proposed method can be used as an effective optimization tool for drilling wood and wood-based composites. Further research could explore additional factors influencing the drilling process and integrate online monitoring techniques for real-time process optimization.
Author Contributions
Conceptualization, B.B. and M.I.; methodology, B.B., M.I., and S.R.; experiment, M.I. and S.R.; software, B.B.; validation, B.B.; resources, M.I. and S.R.; writing—original draft preparation, B.B. and M.I.; writing—review and editing, B.B. and M.I.; visualization, S.R. All authors have read and agreed to the published version of the manuscript.
Funding
This research received no external funding.
Data Availability Statement
The data presented in this study are available on request from the corresponding author. The data are not publicly available due to the fact that other studies are underway.
Conflicts of Interest
The authors declare no conflicts of interest.
References
- Szwajka, K.; Trzepiecinski, T. On the machinability of medium density fiberboard by drilling. Bioresources 2019, 13, 8263–8278. [Google Scholar] [CrossRef]
- Bedelean, B.; Ispas, M.; Răcășan, S. Artificial neural networks as a predictive tool for thrust force and torque during drilling of wood-based composites. In Proceedings of the 11th Hardwood Conference, Sopron, Hungary, 30–31 May 2024. [Google Scholar] [CrossRef]
- Górski, J. The review of new scientific developments in drilling in wood-based panels with particular emphasis on the latest research trends in drill condition monitoring. Forests 2022, 13, 242. [Google Scholar] [CrossRef]
- Bedelean, B.; Ispas, M.; Răcășan, S. Applying the Artificial Neural Network and Response Surface Methodology to Optimize the Drilling Process of Plywood. Appl. Sci. 2023, 13, 11343. [Google Scholar] [CrossRef]
- Patel, P.; Chaudhary, V. Delamination evaluation in drilling of composite materials—A review. Mater. Today Proc. 2022, 56, 2690–2695. [Google Scholar] [CrossRef]
- Agarwal, G.; Mishra, A. Fatigue Behavior of Wooden Fiber Reinforced Epoxy Composites. AIP Conf. Proc. 2021, 2317, 020024. [Google Scholar] [CrossRef]
- Sydor, M.; Rogoziński, T.; Stuper-Szablewska, K.; Starczewski, K. The accuracy of holes drilled in the side surface of plywood. BioResources 2020, 15, 117–129. [Google Scholar] [CrossRef]
- Sydor, M.; Potok, Z.; Pędzik, M.; Hitka, M.; Rogoziński, T. The influence of feed rate during pilot hole drilling on screw withdrawal resistance in particleboard. Eur. J. Wood Prod. 2024, 82, 5–13. [Google Scholar] [CrossRef]
- Podziewski, P.; Szymanowski, K.; Gorski, J.; Czarniak, P. Relative Machinability of Wood-Based Boards in the Case of Drilling—Experimental Study. BioResources 2018, 13, 1761–1772. [Google Scholar] [CrossRef]
- Kumar, M.; Jayakumar, K. Drilling studies on particle board composite using HSS twist drill and spade drill. IOP Conf. Ser. Mater. Sci. Eng. 2018, 402, 012029. [Google Scholar] [CrossRef]
- Szwajka, K.; Zielińska-Szwajka, J.; Trzepieciński, T. Experimental Analysis of Smart Drilling for the Furniture Industry in the Era of Industry 4.0. Materials 2024, 17, 2033. [Google Scholar] [CrossRef]
- Kurek, J.; Antoniuk, I.; Swiderski, B.; Jegorowa, A.; Bukowski, M. Application of Siamese Networks to the Recognition of the Drill Wear State Based on Images of Drilled Holes. Sensors 2020, 20, 6978. [Google Scholar] [CrossRef] [PubMed]
- Jegorowa, A.; Kurek, J.; Kruk, M.; Górski, J. The Use of Multilayer Perceptron (MLP) to Reduce Delamination during Drilling into Melamine Faced Chipboard. Forests 2022, 13, 933. [Google Scholar] [CrossRef]
- Kurek, J.; Krupa, A.; Antoniuk, I.; Akhmet, A.; Abdiomar, U.; Bukowski, M.; Szymanowski, K. Improved Drill State Recognition during Milling Process Using Artificial Intelligence. Sensors 2023, 23, 448. [Google Scholar] [CrossRef] [PubMed]
- Zbieć, M. Application of Neural Network in Simple Tool Wear Monitoring and Identification System in MDF Milling. Drv. Ind. 2011, 62, 43–54. [Google Scholar] [CrossRef]
- Özşahin, S.; Singer, H. Prediction of noise emission in the machining of wood materials by means of an artificial neural network. N. Z. J. For. Sci. 2022, 52, 1–10. [Google Scholar] [CrossRef]
- Tiryaki, S.; Özşahin, Ş.; Aydin, A. Employing artificial neural networks for minimizing surface roughness and power con-sumption in abrasive machining of wood. Eur. J. Wood Wood Prod. 2017, 75, 347–358. [Google Scholar] [CrossRef]
- Watanabe, K.; Korai, H.; Matsushita, Y.; Hayashi, T. Predicting internal bond strength of particleboard under outdoor exposure based on climate data: Comparison of multiple linear regression and artificial neural network. J. Wood Sci. 2015, 61, 151–158. [Google Scholar] [CrossRef]
- Hazir, E.; Koc, K.H.; Baray, S.A.; Esnaf, S. Improvement of adhesion strength for wood-based material coating process using design of experiment methodology. Eur. J. Wood Wood Prod. 2020, 78, 301–312. [Google Scholar] [CrossRef]
- Prakash, S.; LillyMercy, J.; Manoj, K.S.; Vineeth, K.S.M. Optimization of drilling characteristics using Grey Relational Analysis (GRA) in Medium Density Fiber Board (MDF). Mater. Today Proc. 2015, 2, 1541–1551. [Google Scholar] [CrossRef]
- Bedelean, B.; Ispas, M.; Răcășan, S. Combining Artificial Neural Network and Response Surface Methodology to Optimize the Drilling Operating Parameters of MDF Panels. Forests 2023, 14, 2254. [Google Scholar] [CrossRef]
- Podziewski, P.; Górski, J. Effect of the feed rate on the cutting forces during drilling in a standard hardwood plywood. Ann. Wars. Univ. Life Sci.-SGGW For. Wood Technol. 2012, 79, 170–172. [Google Scholar]
- Whitcomb, P.J.; Anderson, M.J. RSM Simplified: Optimizing Processes Using Response Surface Methods for Design of Experiments, 1st ed.; Productivity Press: Indianapolis, IN, USA, 2016. [Google Scholar]


Disclaimer/Publisher’s Note: The statements, opinions and data contained in all publications are solely those of the individual author(s) and contributor(s) and not of MDPI and/or the editor(s). MDPI and/or the editor(s) disclaim responsibility for any injury to people or property resulting from any ideas, methods, instructions or products referred to in the content. |
© 2024 by the authors. Licensee MDPI, Basel, Switzerland. This article is an open access article distributed under the terms and conditions of the Creative Commons Attribution (CC BY) license (https://creativecommons.org/licenses/by/4.0/).