Article

Preparing for the Worst: Enhancing Seedling Traits to Reduce Transplant Shock in Semi-Arid Regions †

by
Douglas E. Mainhart
1,2,
Bradley O. Christoffersen
1,*,
R. Alexander Thompson
3,
Charlotte M. Reemts
4 and
Alejandro Fierro-Cabo
1,2,*
1
School of Integrative Biological and Chemical Sciences, University of Texas Rio Grande Valley, 1201 West University Drive, Edinburg, TX 78539, USA
2
School of Earth, Environmental, and Marine Sciences, University of Texas Rio Grande Valley, 1 West University Boulevard, Brownsville, TX 78520, USA
3
Department of Life and Environmental Sciences, University of California Merced, 5200 North Lake Rd, Merced, CA 95343, USA
4
The Nature Conservancy, 2632 Broadway 2015, San Antonio, TX 78215, USA
*
Authors to whom correspondence should be addressed.
This manuscript is part of a M.S. thesis by the first author, available online at link: https://www.proquest.com/pqdtglobal/docview/2803266486/5725360B9D8B4AF4PQ/1?accountid=7119&sourcetype=Dissertations%20&%20Theses (accessed on 29 July 2024).
Forests 2024, 15(9), 1607; https://doi.org/10.3390/f15091607
Submission received: 26 July 2024 / Revised: 22 August 2024 / Accepted: 9 September 2024 / Published: 12 September 2024
(This article belongs to the Section Forest Ecophysiology and Biology)

Abstract

:
The spatial extent of semi-arid hot regions is forecasted to grow through the twenty-first century, complicating restoration and reforestation plans. In arid and semi-arid climates, seedlings are more susceptible to transplant shock due to lower soil moisture throughout the year. Determining strategies to reduce seedling stress and improve survival post-planting will be paramount to continued reforestation efforts in a changing climate. We quantified seedling physiological, morphological, and field performance (mortality and growth) response for five species native to the semi-arid region of South Texas (Erythrina herbacea L., Celtis pallida Torr., Fraxinus berlandieriana DC, Malpighia glabra L., and Citharexylum berlandieri B.L Rob) to an antitranspirant (abscisic acid), drought, and elevated CO2. We examined post-treatment seedling gas exchange, non-structural carbohydrates, osmolality, root structure, and stomatal density and evaluated mortality and growth rate on a sample of the treatment population. For elevated CO2 and drought hardening treatments, seedling gas exchange, solute content, specific root length, and stomatal density varied by species, while abscisic acid strongly reduced transpiration and stomatal conductance in all species. However, these physiological and morphological differences did not translate to reduced mortality or improved growth rate due to high herbivory and above-normal precipitation after planting precluding seedlings from stress. We conclude that the simpler antitranspirant approach, rather than the more logistically challenging eCO2, has the potential to reduce drought-related transplant shock but requires more widespread testing.

1. Introduction

Seedling-based restoration and reforestation can improve ecosystem services and biodiversity in degraded lands [1,2]. The success of these efforts hinges on seedling survival [3]. Seedling mortality is linked to both biotic (herbivory and invasive species competition) and abiotic (water availability and climate) factors [4,5,6]. Abiotic factors pose challenges for practitioners because they can occur at different timescales and cannot always be addressed directly. In the short term, seedlings may die from transplant shock if they cannot connect to soil resources and continue photosynthesis while minimizing water loss. In the long term, if plants cannot resume growth and accrue resources, they may die once subsequent stressful conditions are encountered [7,8]. In semi-arid regions, high temperatures and low precipitation contribute greatly to low seedling survival after planting [5,9,10].
Through the late twentieth and early twenty-first century, the extent of semi-arid hot Köppen–Geiger climate zones has increased [11,12,13,14]. This is expected to continue through the twenty-first century [11]. Practitioners in these regions need to use strategies that maximize seedling survival in the face of high temperatures and low soil moisture where transplant shock and seedling mortality will be amplified. Pre-planting treatments aimed at modifying traits associated with stress resistance have shown promise in many temperate regions, including semi-arid areas, but studies evaluating efficacy in subtropical semi-arid regions, where winters remain warm and dry, are limited [6,8,14,15,16,17,18,19,20,21,22]. Evaluating pre-planting treatments’ ability to reduce transplant shock will be valuable for restoration and forestry in subtropical semi-arid regions moving forward.
Transplant shock is defined as the mortality or reduced growth of seedlings following relocation to novel conditions and occurs in the following days and weeks [4,23]. Post-establishment mortality occurs when plants survive the initial shock but do not perform well and succumb to seasonal stressors like dry seasons and/or cold temperatures [8,24]. Transplant shock can occur due to low water availability, excess light, and nutrient deficiency [4,25]. Plants have multiple physiological processes that are impacted by this shock, such as photosynthesis [4,23,25]. To survive this period of high stress, plants must connect to soil resource pools, resume photosynthesis before exhausting carbohydrates, and deal with other internal stress that results from the halting of important plant processes [4,23,26]. Root growth potential after planting is key to transplant success because it allows plants to establish a connection to soil water and nutrients [3,26,27,28,29]. This is complicated in semi-arid regions by the unpredictability of soil moisture throughout the year, suggesting the need for practitioners to prepare plants for dry conditions.
The ability of plants to respond to stressors after transplanting is dependent on morphological balance and physiological status [4,7,30]. Plants can use drought avoidance or drought tolerance strategies to address water stress [6]; these strategies include low shoot–root ratios, osmotic adjustment, increased water use efficiency (WUE), improved stomatal control, high specific root length (SRL), and lowered residual transpiration (E) [17,31,32,33]. Further, seedlings with ample stores of nutrients and non-structural carbohydrates (NSCs) like starch and sugar may have more resources to invest in new growth and stress response [4,34,35,36]. Growing plant stock with such physiological and morphological characteristics might maximize survival and improve performance in the field [6,37]. Therefore, modifying seedling physiology and morphology to enhance growth potential and minimize mortality could make sizeable impacts when implemented with large numbers of seedlings and at large scales.
Pre-planting exposure to drought hardening (DH) and abscisic acid (ABA) has been shown to increase seedling outplanting success [18,20,32,38]. While no evaluation of how exposure to elevated CO2 (eCO2) impacts outplanting success has been performed, it has been shown to increase NSCs and modify leaf traits that reduce stomatal conductance (gsw). [39,40]. Drought hardening is a common practice where seedlings are subjected to repeated non-lethal water stress prior to transplanting to bolster stress resistance [6,21,28,41]. This method can improve stomatal control, reduce E, stimulate osmotic adjustment, and increase WUE, non-structural carbohydrate concentrations (NSCs), and root growth potential [8,15,22,32]. Elevated CO2 (eCO2) drives changes in plant physiology and morphology that in theory would benefit seedlings post-planting. Plants exposed to eCO2 can have reduced gsw driven by lowered stomatal density (SD) [39,42,43,44]. Plants exposed to elevated CO2 in nutrient-limited settings, like container growth, may accrue NSCs as sink limitation occurs [40,45,46,47,48]. Plant antitranspirants are used for reducing transplant shock, improving drought avoidance, extending shelf life and cold tolerance, and modifying fruit quality [49]. Abscisic acid is a plant hormone commonly associated with plant stress response. Under drought, plants upregulate the synthesis of ABA which induces ion efflux from the guard cells of stomata and leads to guard cells losing turgor, closing the stomata [50,51]. The use of abscisic acid (ABA) allows practitioners to reduce gsw for a short period of time after application to improve drought resistance after transplanting [52,53,54,55,56,57,58].
Here, we quantify the mechanistic effect of pre-outplanting exposure to ABA, eCO2, and drought on the growth and survival of five Tamaulipan thornscrub species commonly utilized in reforestation efforts in the Rio Grande Valley of south Texas. We hypothesized that pre-planting treatments would improve seedling physiological and morphological characteristics related to drought resistance, reduce transplant shock and latent mortality in the field, and bolster growth. We had two objectives: (1) quantify the physiological and morphological responses of seedlings exposed to abscisic acid, drought, and eCO2 and (2) determine if these modified characteristics reduce mortality and increase growth in the field.

2. Materials and Methods

2.1. Study Site

The nursery and field study site are located at The Nature Conservancy’s Southmost Preserve in Cameron County, Texas (25.847812, −97.398622). This location is situated within the former floodplain of the river and less than 200 m from the Rio Grande/Rio Bravo. The preserve consists of fragments of primary and restored Tamaulipan thornscrub mixed palm and floodplain forests as described in [59]. These fragments are interspersed by abandoned agriculture fields. The soil type is 85% Rio Grande silt loam. The slope gradient of the site ranges from 0 to 1% [60]. Seedling planting (described below) took place on a plot previously used for organic citrus orchard which was cleared in 2016 due to disease [61](Post-clearing, the area had been left fallow and colonized by the invasive grass Megathyrsus maximus, (Jacq.) B.K. Simon & S.W.L. Jacobs. Native early successional species like Leucaena pulverulenta (Schltdl.) Benth. and Bacharis neglecta Britton were also present. This history of disturbance and abandonment makes the site a viable comparison to other possible areas along the Rio Grande/Rio Bravo, as well as subtropical semi-arid areas more broadly.
Climate in the region is characterized as sub-humid to semi-arid [62]. Average monthly and annual temperatures, precipitation, and study period weather conditions were obtained from a MesoWest (University of Utah, Salt Lake City, UT, USA) data station located at the Brownsville South Padre Island International Airport about 1.6 km north-northwest of the study site. Annual temperatures on average range from a minimum of about −1 °C to 38 °C. Average annual rainfall is about 688 mm. For the study period from September 2021 to August 2022, the total rainfall was higher than the average (887 mm). Notably, the total rainfall for two months post-planting (October and November 2021) was higher than average historic levels (Figure S1).

2.2. Plant Species and Nursery Practices

We used five native thornscrub species for this study: Citharexylum berlandieri B.L Rob (CIBE), Malpighia glabra L. (MAGL), Erythrina herbacea L. (ERHE), Fraxinus berlandieriana DC (FRBE), and Celtis pallida Torr. (CEPA). These species have simple/large leaves and were selected to facilitate gas exchange measurements and because these species tend to suffer greater rates of water loss relative to compound leaved species (e.g., Fabaceae) and higher mortality due to transplant shock [63,64,65,66,67].
Seedlings were grown from seeds collected locally and sown in 295 cm3 plant paper band containers following the United States Fish and Wildlife Service (USFWS) guidelines for growing containerized thornforest seedlings. Seedlings were grown at the nursery present at Southmost Preserve. Thirty seedlings were grown per species-treatment group totaling 600 individual plants. Most species were sown in late April 2021, but ERHE quickly outgrew the containers. To address this, ERHE seedlings were re-sown in late August, about 1.5 months, and reached adequate size (10–20 cm) before treatments began. The growing substrate was a 50:50 mix of screened local sandy loam soil and medium-grade vermiculite, supplemented with Osmocote 14:14:14 slow-release fertilizer (ICL Fertilizers, Dublin, OH, USA) at 364 mL per 38 L of the soil/vermiculite mixture. About 4 months into the growing period, CIBE and FRBE seedlings taller than 25 cm were top-trimmed to about 20 cm height, the typical target size according to USFWS guidelines. Seedlings were watered daily. Two months into the growing period, Peters® Professional 24-8-16 NPK fertilizer (Everris NA Inc., Dublin, OH, USA) at 200 ppm nitrogen was applied weekly. Fertilizer was applied as foliar spray through conclusion of treatments, except for the DH treatment (see below).

2.3. Experimental Design

Logistic and funding constraints limited our study to a total of 600 seedlings across the five species (120 per species). There were four treatment groups: elevated CO2 (eCO2), drought hardening (DH), abscisic acid (ABA), and control. For post-treatment measurements, 10 randomly selected seedlings per species-treatment combination remained in the nursery, while the remaining 20 were used in the field experiment to assess out-planting performance (mortality and growth). Timeline of treatment application differed for field vs. nursery groups (Table 1). Five censuses over a period of seven months after planting were used to collect growth and mortality data (Figure S1). Abscisic acid was applied to nursery plants the day measurements began and to field plants the day prior to out-planting (Table 1). Treatment methods are summarized in Figure 1 and Table 1.

2.4. Elevated CO2

To elevate CO2 around seedlings, we constructed a clear polyethylene chamber (Figure 1a). Carbon dioxide was supplied by bacterial decomposition of 12 cm layer of mulch fertilized with 46-0-0 (N-P-K) urea pellet fertilizer. Seedlings were elevated a few inches above the mulch layer to prevent contact with plant containers. On hot days, the chamber was opened in late morning (11:00–12:00) and left open until late afternoon (17:00–18:00) to prevent overheating. Chamber CO2 and water vapor concentrations were monitored using an Ultra-Portable Greenhouse Gas Analyzer (Los Gatos Research, Mountain View, CA, USA). We monitored CO2 for 10 mornings, and CO2 levels were maintained above 1000 ppm when chamber was closed (Figure 1a).
Chamber temperature was measured with two Cooper Atkins Data Logger GL100 (Cooper Atkins, Gainesville, FL, USA) sensors and ambient temperature taken from the MesoWest© sensor described above. Chamber temperatures peaked in the late morning (Figure S2). The chamber was on average 2.0 °C (±0.3) warmer when closed. The chamber also elevated humidity (Figure S3) and reduced light levels by about 30% despite the clear polyethylene cover; possibly due to condensation accumulating on the inside. Light levels were measured using a Traceable® Dual Range Light Meter (Fisher Scientific, Waltham, MA, USA).

2.5. Drought Hardening

Seedlings were exposed to 5 drought cycles. Each drought cycle began with seedlings being watered to substrate saturation. Then, watering was suspended until one-third of each species group (10 plants) showed signs of drought stress [18]. This process typically took 5–7 days, after which the process was repeated. Seedlings in the DH treatment were placed under clear polyethylene to prevent interference from rainfall.

2.6. Abscisic Acid

The ABA used was Conshape™ (Valent BioSciences LLC., Libertyville, IL, USA). Preliminary tests on our species found the ideal concentration of ABA to be 1000 ppm. Higher concentrations had negative side effects such as defoliation. Abscisic acid was applied as a foliar spray. Leaves were allowed to dry before measurements were performed.

2.7. Control Group

The control group was grown in full sun under ambient CO2 and received irrigation by hand as needed along with twice daily water aspersion irrigation in the early mornings and late afternoons, the same as treatment groups (except DH). Due to limited resources, controls failed to capture humidity and light modifications that were present in the eCO2 treatment, and results should be interpreted with this caveat in mind. Ideally, a positive control of a chamber without CO2 increase would have been implemented.

2.8. Physiological and Morphological Measurements

After the treatment period, 10 seedlings from each species-treatment group were kept in the nursery for physiological data collection. Response variables were chosen to represent characteristics that influence transplant shock, drought resistance, and growth and included day zero and post-treatment gsw, light-saturated photosynthetic rate, i.e., rate of CO2 assimilation (Asat; indicative of growth potential), transpiration and water use efficiency (E and WUE, respectively; indicative of water loss and drought resistance), non-structural carbohydrates (NSCs), and leaf osmolality (osmleaf). Morphological variables measured included stomatal density (SD), height relative growth rate during treatment (RGRt), and specific root length (SRL). Due to different hypothesized impacts, response variables measured differed across treatments (Table 1). For plants in the field, height relative growth rate (RGRf) and mortality were measured.

2.8.1. Gas Exchange

Day zero photosynthesis and gas exchange data (Asat, gsw, E, and WUE) were collected with a LI-COR 6400xt (LI-COR Biosciences, Lincoln, NE, USA) for CIBE, FRBE, and ERHE for all treatments. Only these three species had leaves large enough to measure with the gas exchange chamber. For each species-treatment group, ten individuals were measured. Measurements occurred in the morning from 08:00 until 13:00. For eCO2, only leaves developed during the treatment were measured, except for CIBE since leaves were too small to measure. For ABA and DH treatments, pre-existing fully expanded leaves were measured. For the control group, new leaves (developed during eCO2 treatment period) and old leaves (present before treatment periods) were measured (Table S1). To prevent temporal bias as conditions changed throughout the morning, treatment groups for each species were measured in an alternating order (e.g., ABA, eCO2, DH, control, and thus repeated). Readings of photosynthesis parameters were allowed to stabilize for 45–70 s before data were recorded by calculating the mean of five instantaneous points over 5 s for 120 s (Table S1). Chamber conditions of LI-COR 6400xt were set to 2000 PAR, 400 ppm CO2 with the humidity scrubber set to halfway. The WUE was calculated from values of Asat and E (WUE = Asat/E).
Stomatal conductance was measured during a post-treatment period lasting 4–6 days (referred to as post-treatment gsw hereafter) with the LI-COR 600 porometer (LI-COR Biosciences, Lincoln, NE, USA). Ten individuals were measured for each species-treatment group. Data collection occurred in the mornings from 08:00 to 13:00. Before measurement, leaves were allowed to sit in full sun for at least one minute. Different age classes of leaves were measured depending on the treatment (Table S1). The smaller aperture size of this device allowed post-treatment gsw to be measured on all species studied, except for CEPA due to scale insect damage. Seedlings were measured in the same alternating pattern and leaf age groups as mentioned above (Tables S2 and S3).

2.8.2. Osmotic Adjustment

We quantified osmotic adjustment through leaf osmolality (osmleaf). Data were collected on DH, eCO2, and control treatments. One fully expanded leaf was removed for five seedlings from each species-treatment group (n = 5) and placed in deionized water to achieve full saturation. A 5 mm diameter leaf disk was cut and wrapped in aluminum foil, then submerged in liquid nitrogen for at least two minutes to allow for lysing following the approach of [68], which allowed us to standardize the cooling and measurement time consistent osmleaf measurements. Leaf disks were individually removed from the liquid nitrogen before sampling, and disks yet to be sampled were left within the liquid nitrogen. After freezing, leaf disks were removed from the aluminum foil, and ten holes were made in the leaf disk on each side using forceps. The disk was then inserted into a VAPRO® Vapor Pressure Osmometer (Wescor Inc., Logan, UT, USA). The osmometer was set to auto mode and allowed to make 6 consecutive measurements of osmolality. The final sixth point was taken as the final data point. Due to the time needed for each sample, osmolality was only measured for three species: ERHE, FRBE, and CIBE.

2.8.3. Stomatal Density

Stomatal density was measured in the control and eCO2 treatments. This was because most seedlings subjected to the DH did not reliably produce new leaves, and the ABA treatment time scale was too short to induce change in stomatal density. One leaf was collected from 10 plants in each species-treatment group. Only new leaves developed during the treatment period were collected when eCO2 treatment concluded. Leaves were stored in plastic zip-lock bags with a moistened paper towel at 4 °C for 1 week before sample preparation. Imprints of the leaf surface were made with clear nail polish gently applied to the abaxial surface and allowed to dry (acetate). Using clear tape, the imprints were peeled off and placed on a microscope slide. Not all imprints were successful, and sample size varied (n = 6–10). The high density of trichomes on CEPA leaves prevented successful imprints, and no SD data were collected. Slides were examined at 100× magnification, and 3 fields of few were photographed for each leaf. The image analysis software ImageJ [69] was used to calculate the area of the images and count the number of stomata on the underside of the leaves.

2.8.4. Non-Structural Carbohydrates

To understand the influence of eCO2 on NSC accumulation, a second round of treatment was applied. For this experiment, only one species was used, ERHE. Seedlings were sewn in mid-October following the growing regime as above. Ten seedlings were placed under eCO2 and CTRL treatments from 2 December 2021 to 22 January 2022. To address lower light levels being experienced by the eCO2 treatment, the CTRL group was also placed underneath a canopy of polyethylene identical to that covering the eCO2 chamber. We randomly selected five seedlings for plant tissue harvesting. This was separated into two tissue groups: roots and stem. Soil was washed off, and all fine roots were removed. Within five minutes of samples being taken, plant tissues were oven-dried at 70 °C for 3 days. After drying, samples were ground using a Wiley Mini-mill (Thomas Scientific, Chadds Ford, PA, USA) and shipped to Washington State University for NSC analysis. Non-structural carbohydrates were measured using the phenol-sulfuric method [70]. Briefly, 50 mg of ground sample was weighed into 1.5 mL Eppendorf tubes and dried overnight at 65 °C. Using hot ethanol (90 °C), sugar was extracted, diluted, and then measured using phenol and concentrated sulfuric acid. The remaining pellet was open-air dried and analyzed 24 h later using enzymatic digestion, PGO, and 75% sulfuric acid. Starch and sugar concentrations were measured colorimetrically using a spectrophotometer. Data were recorded as NSC percentage of dry mass.

2.8.5. Root Metrics

To understand treatment impacts on seedling resource allocation, data were collected on fine specific root length (SRL) and root length. Due to the destructive nature of data collection, samples were prepared and measured after all gas exchange data were collected. Five plants from the DH, control, and eCO2 treatment groups for each species were measured. Roots were cleaned, placed in clear plastic trays, partially submerged in water, and scanned. Root length was calculated using the WinRhizo application (Regent Instruments, Quebec, QC, Canada). Fine and coarse root samples were oven-dried at 60 °C for 48 h and at 105 °C for 48 h, respectively, and weighed. SRL was calculated for both root types as root length/dry mass.

2.8.6. Treatment Relative Growth Rates

To understand seedling responses during treatments, relative height growth rate for ten individuals was measured for all species under the DH, eCO2, and control treatments. Due to a labeling error, CIBE eCO2 treatment growth data were not collected. The height was measured from the soil surface to the highest photosynthetic point of the plant rounded to the nearest half centimeter. Relative growth rate during the treatment period (RGRt) was calculated as natural log of the post-treatment height minus the natural log of the pre-treatment height divided by the treatment duration in fractional year (i.e., ln(after_height) − ln(before_height)/0.08; [71]).

2.9. Field Experiment

Planting site preparation began in October 2021 with an initial mowing of the site to remove the herbaceous layer. Two weeks later, Glyphosate was applied to suppress invasive grasses. Between mowing and spraying, heavy precipitation events occurred in mid-October. Prior to planting, soil was disked, and plow lines were established for planting of the seedlings. Seedlings were planted in the field site on 15 November 2021. In total, 400 seedlings were planted in the 15 m by 75 m site, in a randomized block design (Figure 1c). Five blocks were established, each containing five plots, one for each species; species were randomly assigned to a plot. Each plot contained four rows, one for each treatment; treatments were randomly assigned to a row. Within each row were four seedlings (Figure 1b). Rows were numbered from one to eight in the direction south to north. The space between individual plants was 1 m, space between plots was 2 m, and space between blocks was 3 m. Planting began at least 3 m away from the site’s edge to reduce competition from neighboring sites overgrown with vegetation.

Field Survival and Growth

Survival and growth of seedlings were recorded over 8 months post-planting in the field. The first census occurred one week post-planting to record initial height of seedlings. Height was measured for two seedlings within each plot row, one on the edge of the plot, and one on the interior of the row (starting n = 200). Height measurement was conducted 4 times, initially in November 2021 after planting, then January, March, and June 2022. Survival was assessed in January, March, April, May, and June of 2022 for each individual seedling (Figure S1).
Mortality, mortality rate, and relative height growth rate in the field (RGRf) were calculated from these data. Mortality was taken as the percentage of plants dead at the block level (100 × (1 − Ni/N0), where Ni and N0 represent seedlings alive at the current census (i) and initial number of seedlings planted, respectively. Mortality rate was estimated as 1 N i 1 N i 1 1 / t , where Ni and Ni−1 are the number of live seedlings at current census and previous census, respectively, and ∆t represents time between two censuses in fractional years [72]. Field relative growth rate for census i was calculated as RGRf = (ln(Hi) − ln(Hi−1))/(titi−1) according to [71].

2.10. Data Analysis

All statistical analysis was performed in R version 4.3.1 [73]. Due to their continuous nature, response variables were analyzed using linear models with treatment as a predictor. ANOVA statistics were performed on model objects using anova() from the “car” package [74]. Post hoc tests were performed using a Tukey honest significant difference (HSD) test with the tukey_hsd function from “rstatix” package [75]. To assess normality, a Shapiro–Wilk test was run on model residuals with the shapiro.test function in base R. A Breusch–Pagan test was used to assess homoscedasticity via the bptest function from the “lmtest” package [76]. Influential points were detected by evaluation of Cook’s distance values with a cutoff calculated by 4 / ( N k 1 ) , where N is the number of observations, and k is the number of independent variables [77]. Data points that passed this cutoff were removed in cases where sample size was greater than 5. If parametric assumptions were not met, square-root, fourth-root, or natural log transformations were used where possible. In cases where transformations were ineffective or could not be used, a Kruskal–Wallis test replaced the ANOVA, and a Wilcoxon rank sum test replaced Tukey HSD test. This was done using the kruskal_test and wilcox_test functions from “rstatix” [75]. Analyses for day 0 gas exchange parameters were compared between each treatment and corresponding control group within species (e.g., for ERHE eCO2 plants, young leaf gas exchange measurements were compared against control group young leaf measurements) due to circumstances in measurement timings or leaf types preventing direct comparisons between all treatments. To understand duration of post-treatment effects on gsw, comparisons were analyzed using a student t-test (Wilcoxon test when assumptions not met) to compare treatment to controls within species for each day, and then a Bonferroni correction was applied to account for sampling multiple days of the same plants consecutively.
Due to the binary nature of survival data, the influence of treatment was analyzed within species with generalized linear models using data from the final census in June. We initially attempted to use a mixed logistic regression model with treatment as the fixed effect and block as a random effect. However, due to singularities occurring in some blocks, a mixed model approach was not feasible. We opted for an advanced logistic regression. The model used seedling mortality (binary variable) as the response; predictors were treatment (four-level factor) and block (five-level factor). For each species, a full model was built including treatment and block as interaction, and a null model with just block as a predictor. We then employed step function, from the base R stats package, to step forward and backward to find the model with the lowest AIC value. If the ideal model did not include treatment, it was added back to the model. We then fed the model object to the Anova() function from the Car package to perform an analysis with type III sums of squares. Overall model significance was tested with the nagelkerke() function from the “rcompanion” package [78]. Where predictors were significant, we attempted to perform post hoc tests with the cld() function from the “multcomp” package [79], but low sample size prevented differences from being detected.

3. Results

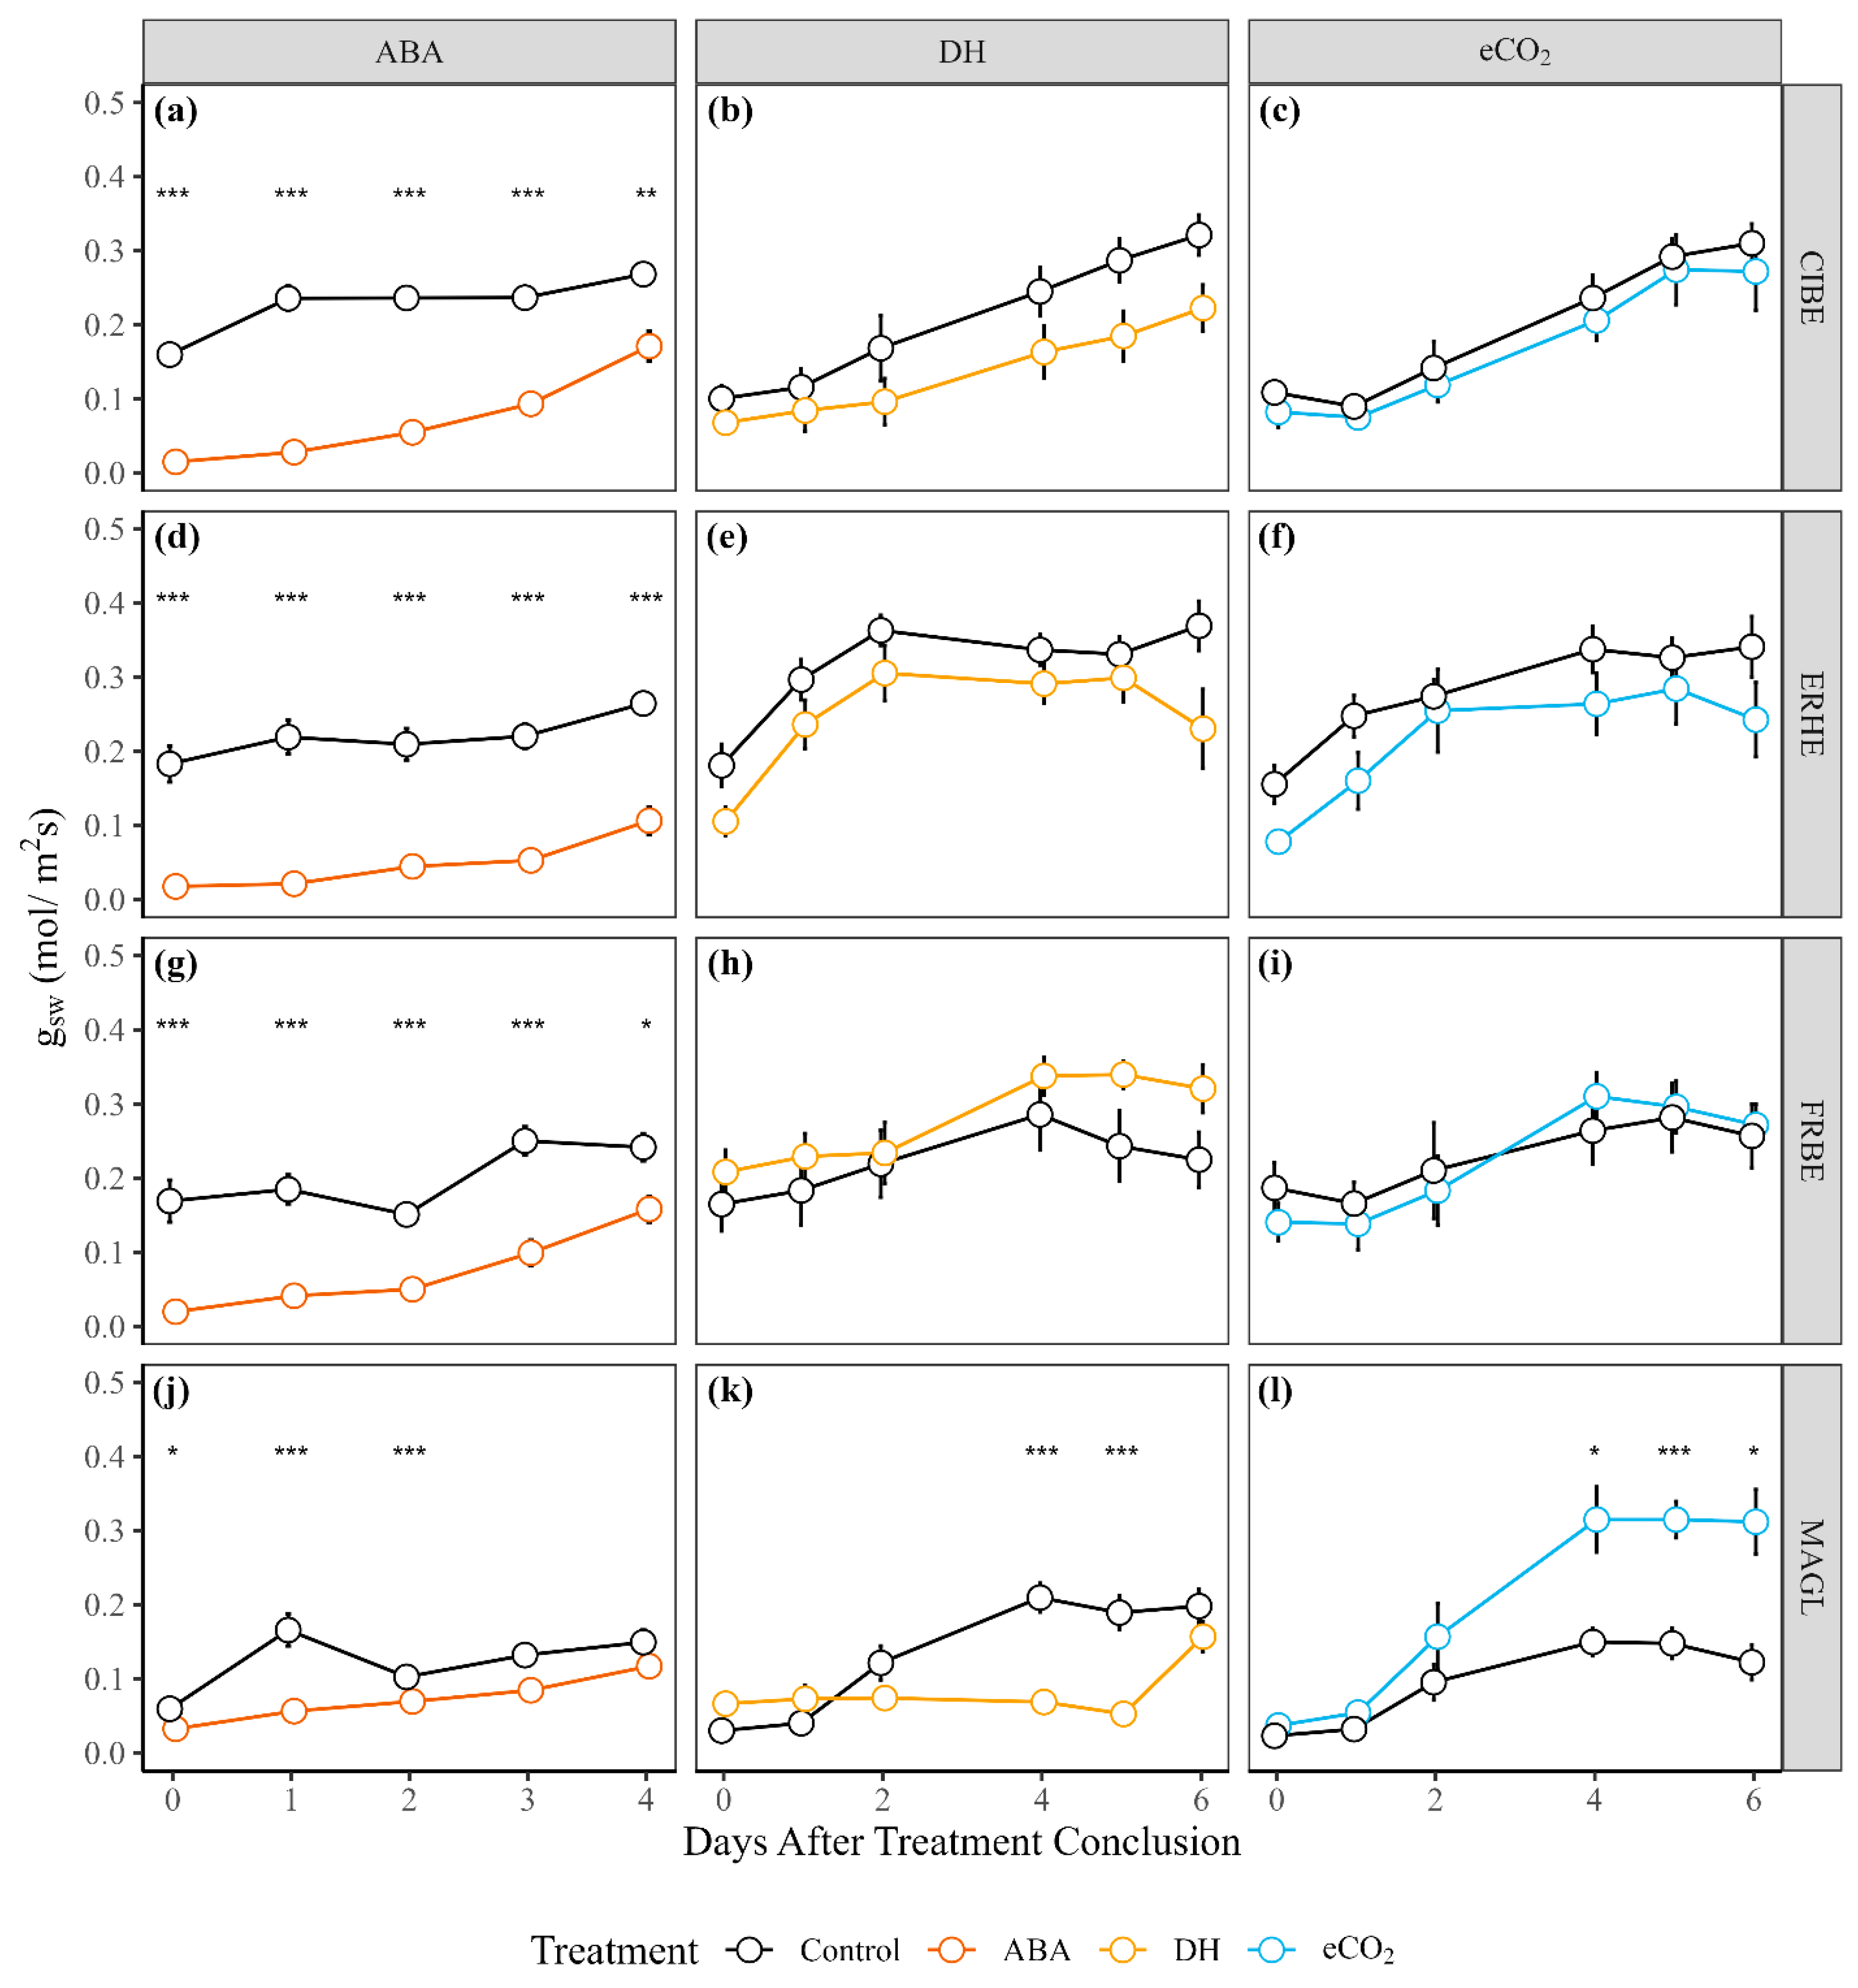
3.1. Photosynthesis and Gas Exchange Parameters

For day-zero gsw, CIBE saw a significant reduction in the ABA (Kruskal–Wallis; p < 0.001, Figure 2a) and DH (ANOVA; p < 0.05, Figure 2b) treatments. For ERHE, significant reductions in day-zero gsw in the ABA (Kruskal–Wallis; p < 0.001, Figure 2a) and eCO2 (ANOVA; p < 0.01, Figure 2c) treatments occurred with no difference in the DH group (ANOVA; p = 0.068, Figure 2b). ABA significantly decreased day-zero gsw in FRBE as well (Kruskal–Wallis; p < 0.001, Figure 2a). FRBE eCO2 and DH seedlings did not differ from controls (ANOVA; p-values: 0.310 and 0.910, respectively, Figure 2b,c).
Transpiration (E) was heavily affected by the ABA treatment but varied in response to eCO2 and DH. Abscisic acid significantly reduced E for CIBE (Kruskal–Wallis; p < 0.001, Figure 2d), while DH had no effect (ANOVA; p = 0.098, Figure 2e). Abscisic acid, eCO2, and DH significantly lowered E in ERHE (Kruskal–Wallis and ANOVA; p < 0.001, <0.01, <0.05, respectively, Figure 2d–f). Transpiration was lowered by ABA in FRBE (Kruskal–Wallis; p < 0.001, Figure 2d), while eCO2 and DH had no significant effect (ANOVA; p-values: 0.462 and 0.874, respectively, Figure 2e,f).
Photosynthetic rate (Asat) was not affected by ABA or DH for CIBE (Kruskal–Wallis, p = 0.112, and ANOVA, p = 0.098, Figure 2g,h). Both ABA and eCO2 significantly reduced Asat in ERHE (Kruskal–Wallis, p <0.001, and ANOVA, p < 0.01; Figure 2g,i), while differences in DH were insignificant (ANOVA; p = 0.239, Figure 2h). Abscisic acid significantly reduced Asat for FRBE (Kruskal–Wallis; p < 0.001, Figure 2g), but neither eCO2 nor DH had an effect (ANOVA; p = 0.315 and 0.346, respectively, Figure 2h,i).
In CIBE, there was no difference in WUE for any treatment (DH: ANOVA; p = 0.134, ABA: Kruskal–Wallis; p = 0.257, Figure 2j–l). This was the same for FRBE (ABA: Kruskal–Wallis, p = 0.070; DH: ANOVA, p = 0.741; eCO2: ANOVA, p = 0.972) and ERHE (ABA: Kruskal–Wallis, p = 0.597; DH: ANOVA, p = 0.100; eCO2: ANOVA, p = 0.630, Figure 2j–l).
Post-treatment gsw was reduced over a four-day period with the abscisic acid treatment for CIBE (Wilcoxon; corrected p-values < 0.001, Figure 3a, Table S1). Neither DH nor eCO2 effected post-treatment gsw in CIBE (t-test and Wilcoxon; p-values > 0.05, Figure 3b,c, Tables S2 and S3). For ERHE, ABA significantly reduced post-treatment gsw for the entire 4-day measurement period (t-test and Wilcoxon; p-values < 0.001, Figure 3d, Table S1), while DH and eCO2 saw no significant differences (t-test Wilcoxon; p-values > 0.05, Figure 3e,f, Tables S2 and S3). Abscisic acid had a similar result in FRBE (t-test and Wilcoxon; p-values < 0.001, Figure 3g, Table S1), while DH and eCO2 had no significant effects (t-test and Wilcoxon; p-values > 0.05, Figure 3h,i, Tables S2 and S3). Abscisic acid reduced post-treatment gsw in MAGL day zero through day two post-treatment (t-test and Wilcoxon; p-values < 0.05) while days three and four saw no differences (t-test and Wilcoxon; p-values > 0.05, Figure 3j, Table S1). For MAGL, DH reduced post-treatment gsw on days four and five post-treatment (t-test; p-values < 0.001, Figure 3k, Table S2). In MAGL, eCO2 plants had higher post-treatment gsw in the final three days of measurement (t-test; p-values < 0.05, Figure 3l, Table S3).

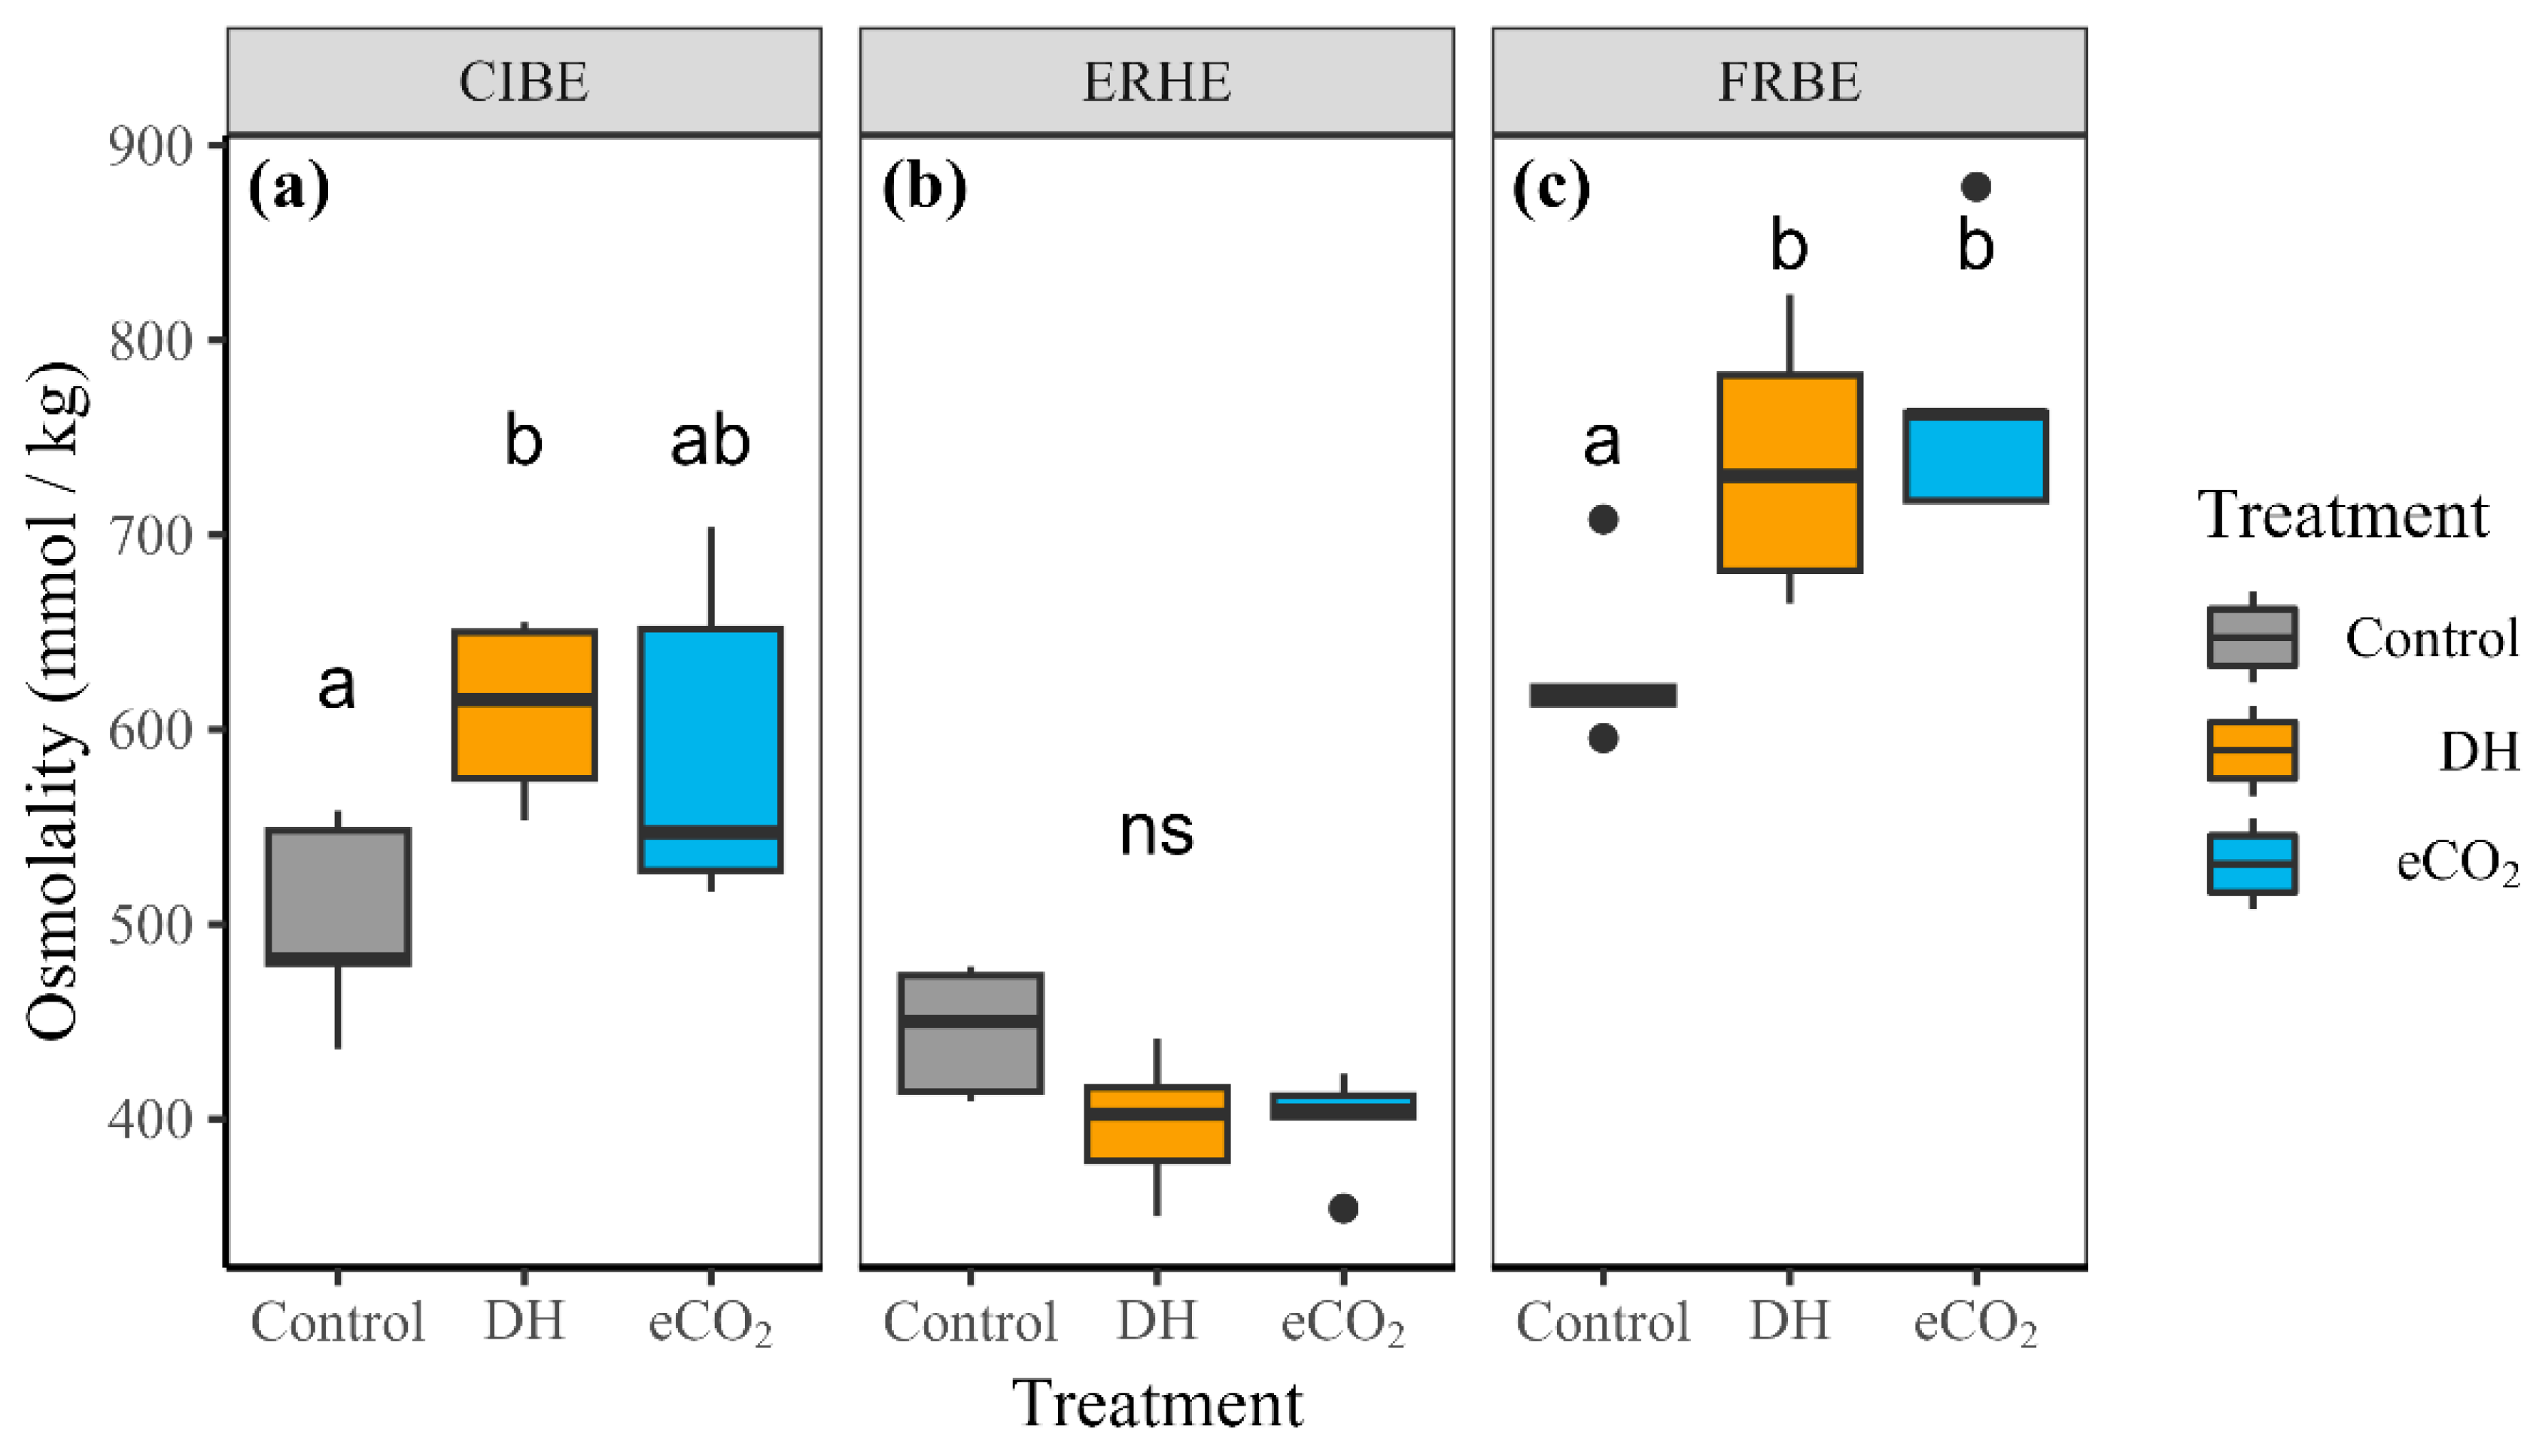
3.2. Leaf Osmolality and Non-Structural Carbohydrates

Drought-hardened CIBE had significantly higher osmleaf than controls (ANOVA with Tukey post hoc; padj < 0.05, Figure 4a), while eCO2-treated plants were not significantly different from either DH or CTRL (ANOVA with Tukey post hoc; padj > 0.05, Figure 4b). None of the ERHE treatment groups showed any significant differences in osmleaf (ANOVA with Tukey post hoc; padj-values > 0.05, Figure 4c). For FRBE, both DH and eCO2 osmleaf were significantly higher than controls (ANOVA with Tukey post hoc; padj < 0.05, Figure 5) and were not different from each other. Starch and sugar levels in stems and roots did not differ between eCO2 and control treatments in ERHE (ANOVA and Kruskal–Wallis; p > 0.05; Figure S2).

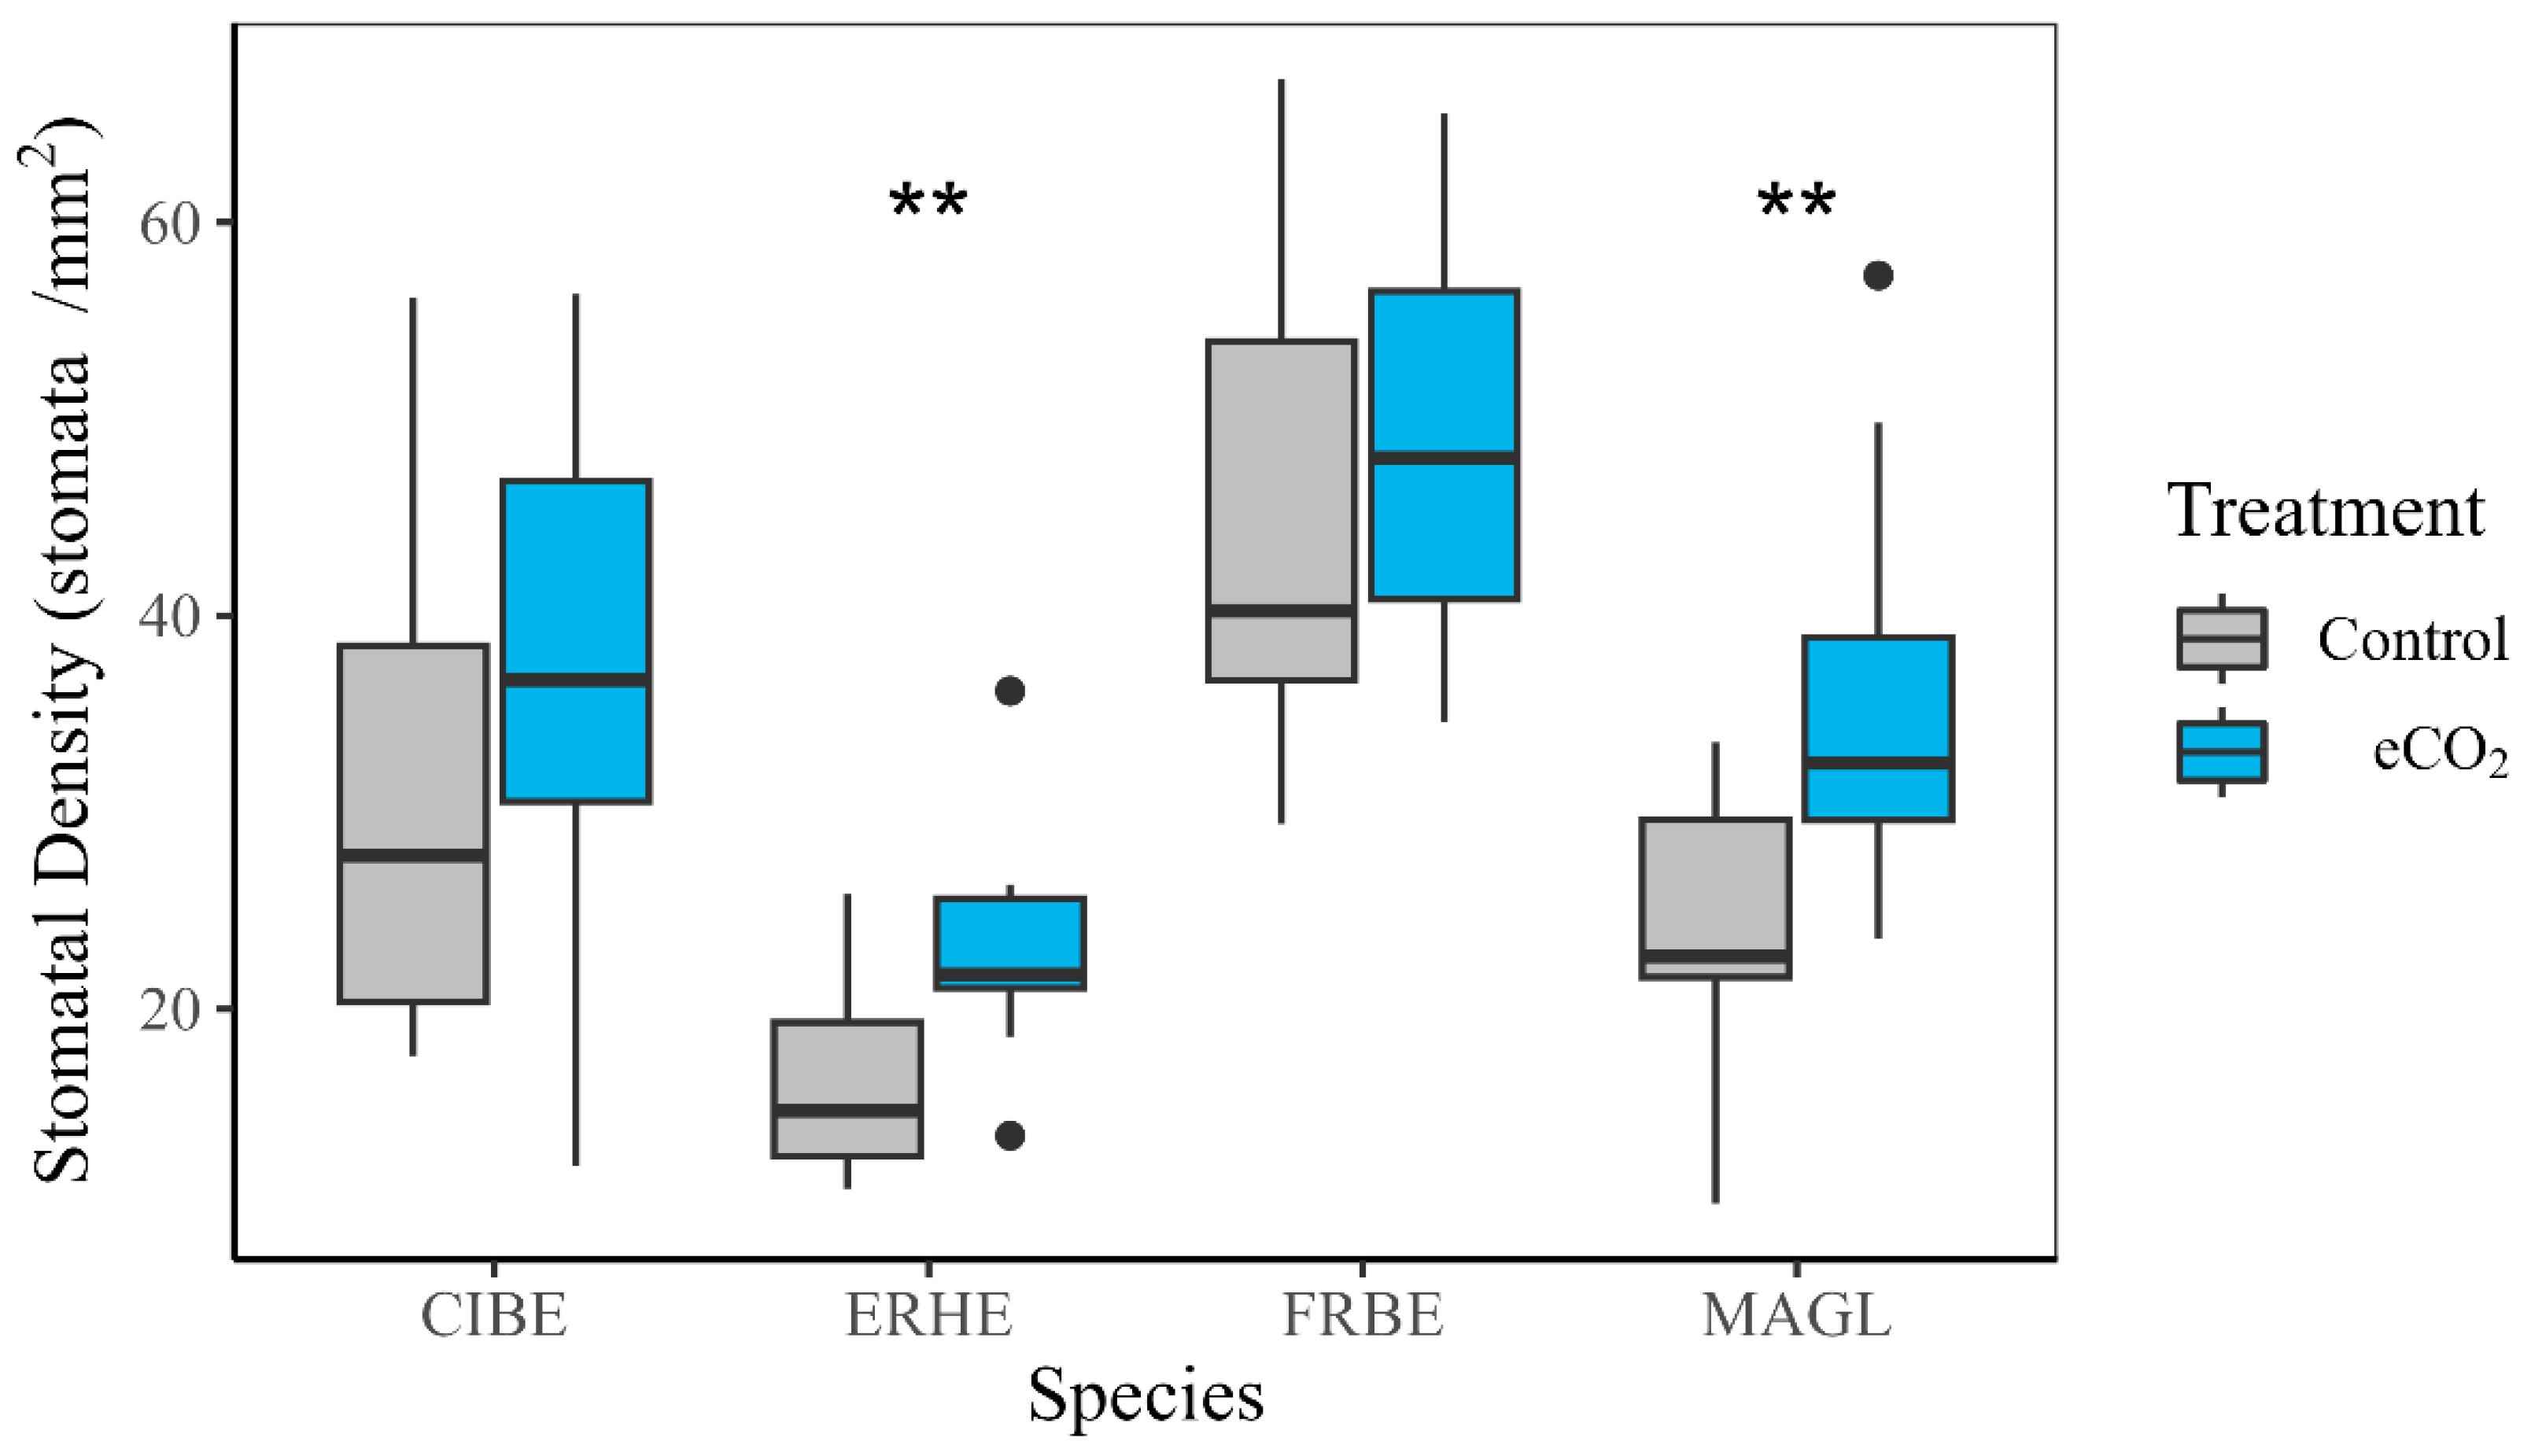
3.3. Root Morphology and Stomatal Density

For CEPA, neither RL nor SRL showed differences between any of the treatments (ANOVA; p-values > 0.05, Figure 5a,b). The same was also found for CIBE, ERHE, and MAGL (ANOVA; p-values > 0.05, Figure 5c–f,i,j). Total root length significantly increased in eCO2 compared to other treatments (ANOVA; padj < 0.05, Figure 5g). Even so, FRBE showed no differences in SRL between treatments (ANOVA; padj > 0.05, Figure 5h).
Overall, eCO2 tended to increase stomatal density in all species (Figure 6), but differences were not always significant. Elevated CO2 significantly increased stomatal density in ERHE and MAGL (ANOVA; p-values < 0.01), while CIBE and FRBE differences were not significant (ANOVA; p = 0.502 and 0.478, respectively).

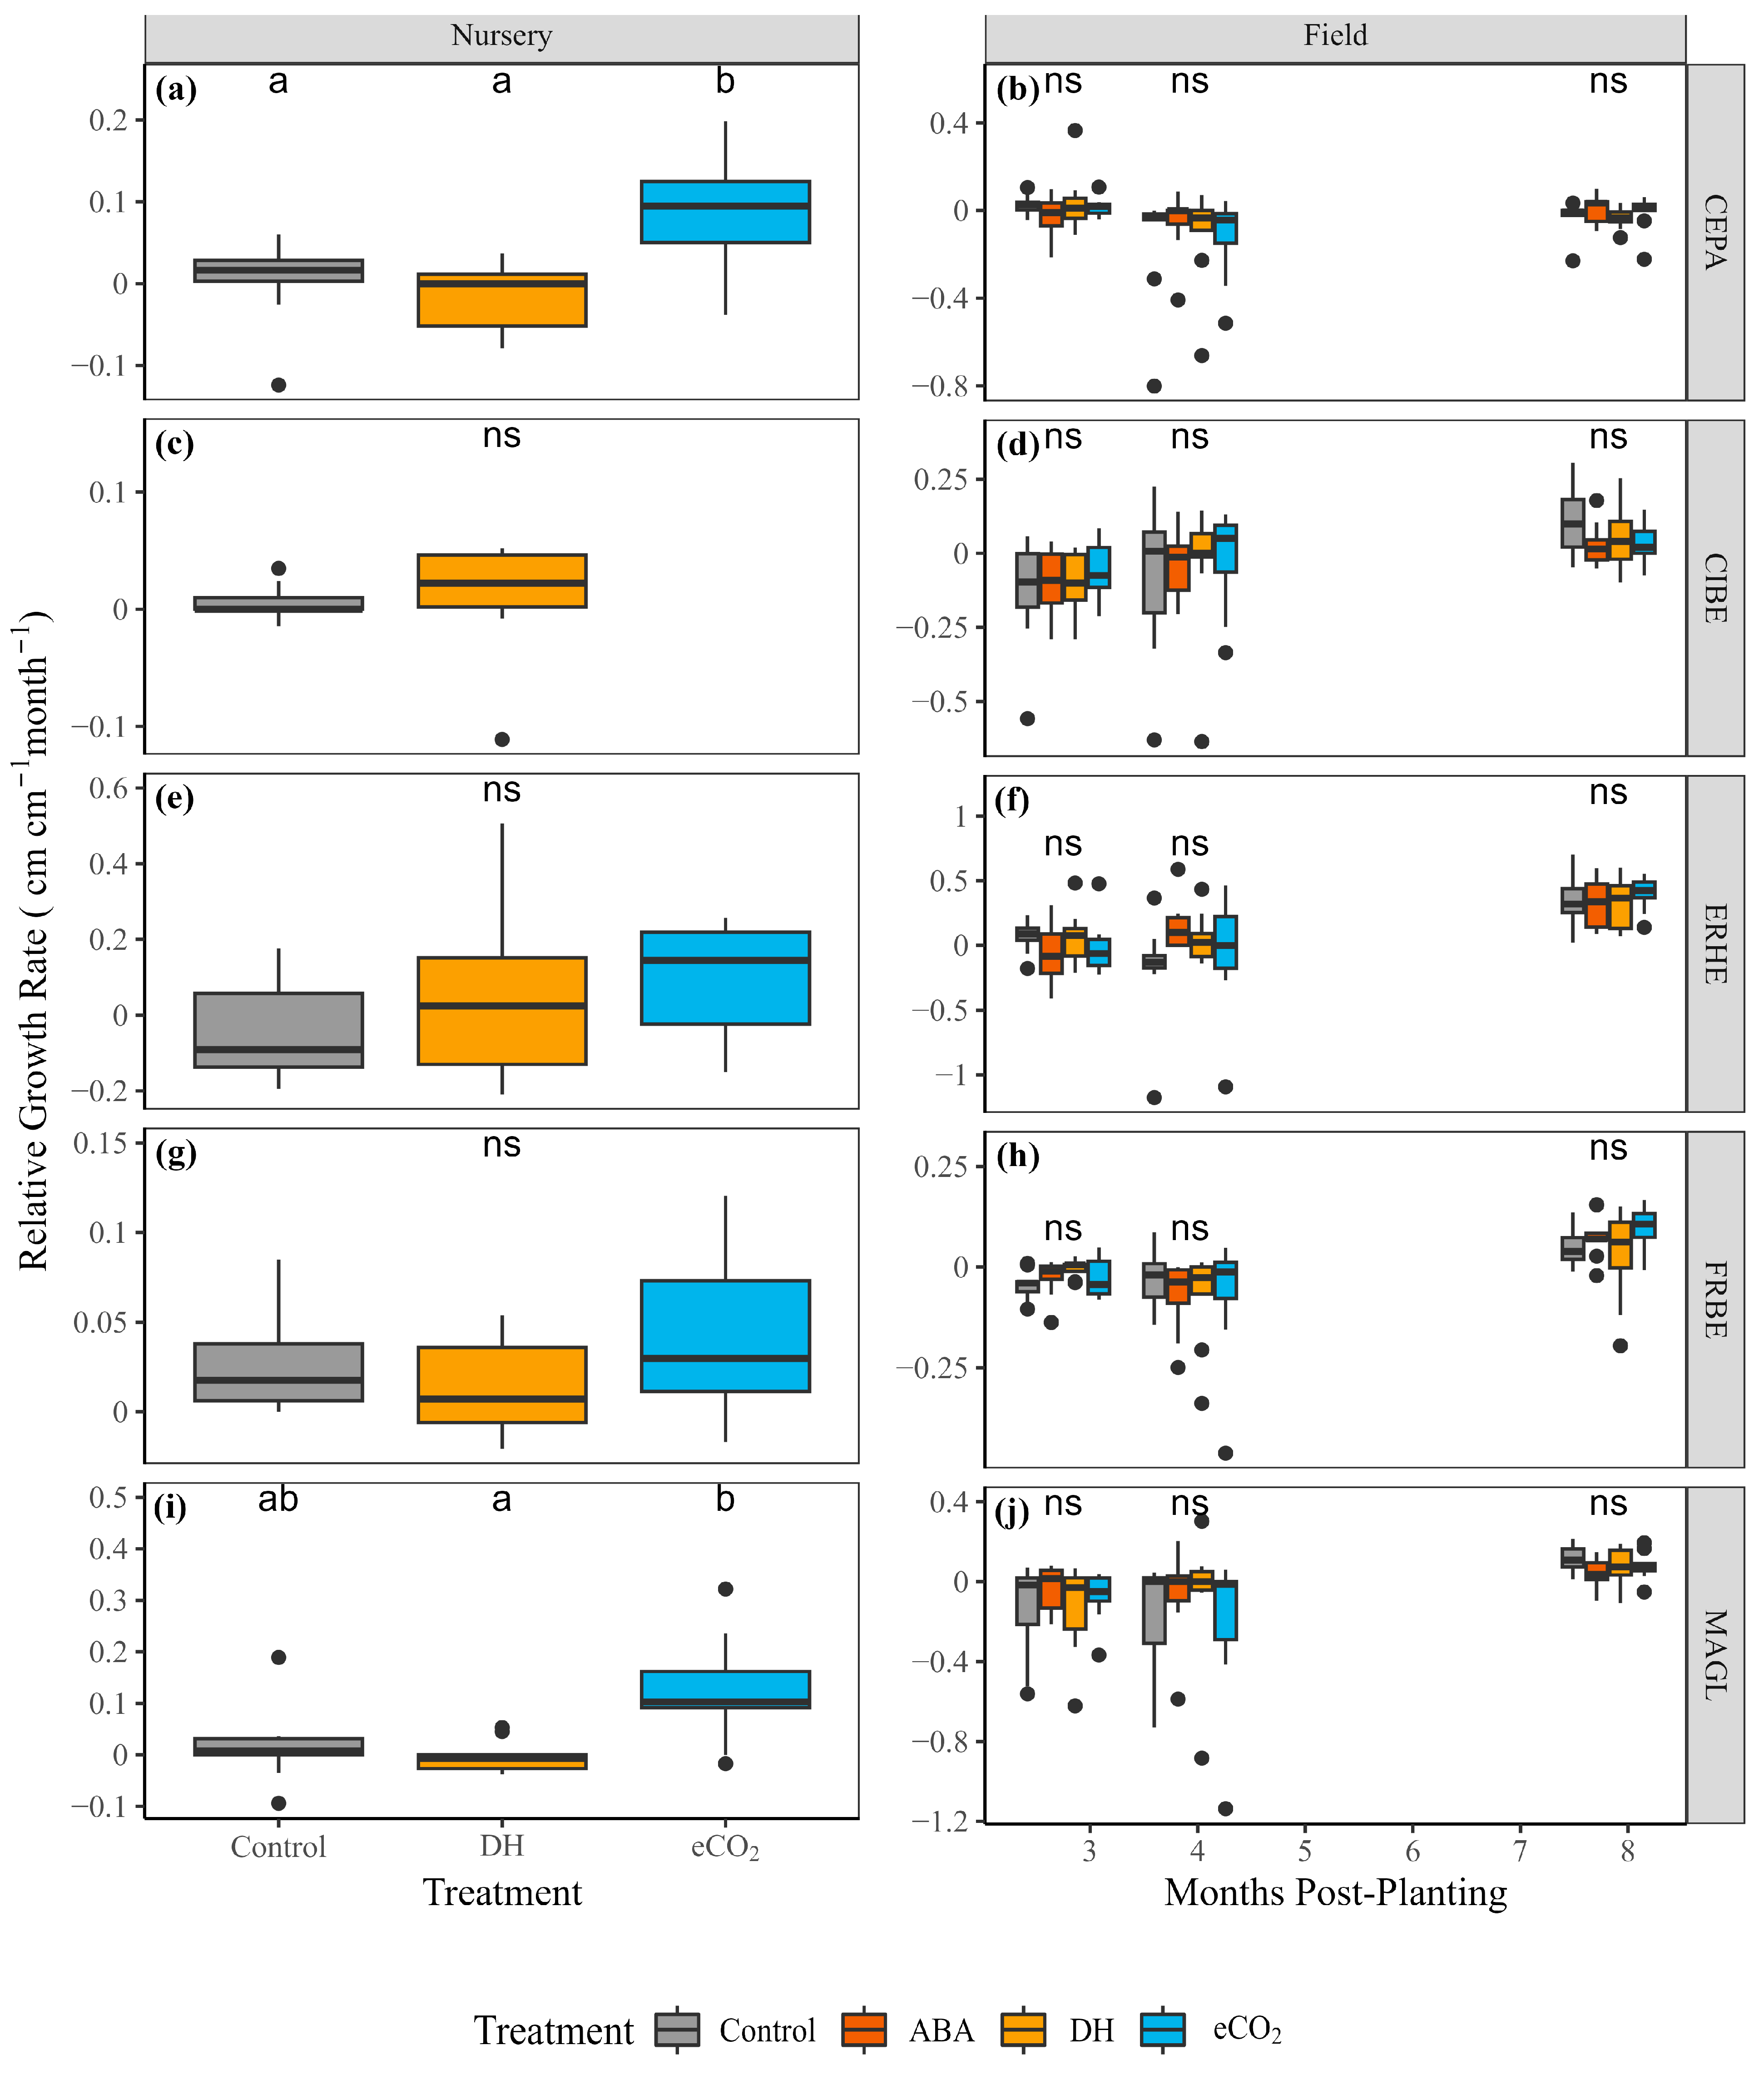
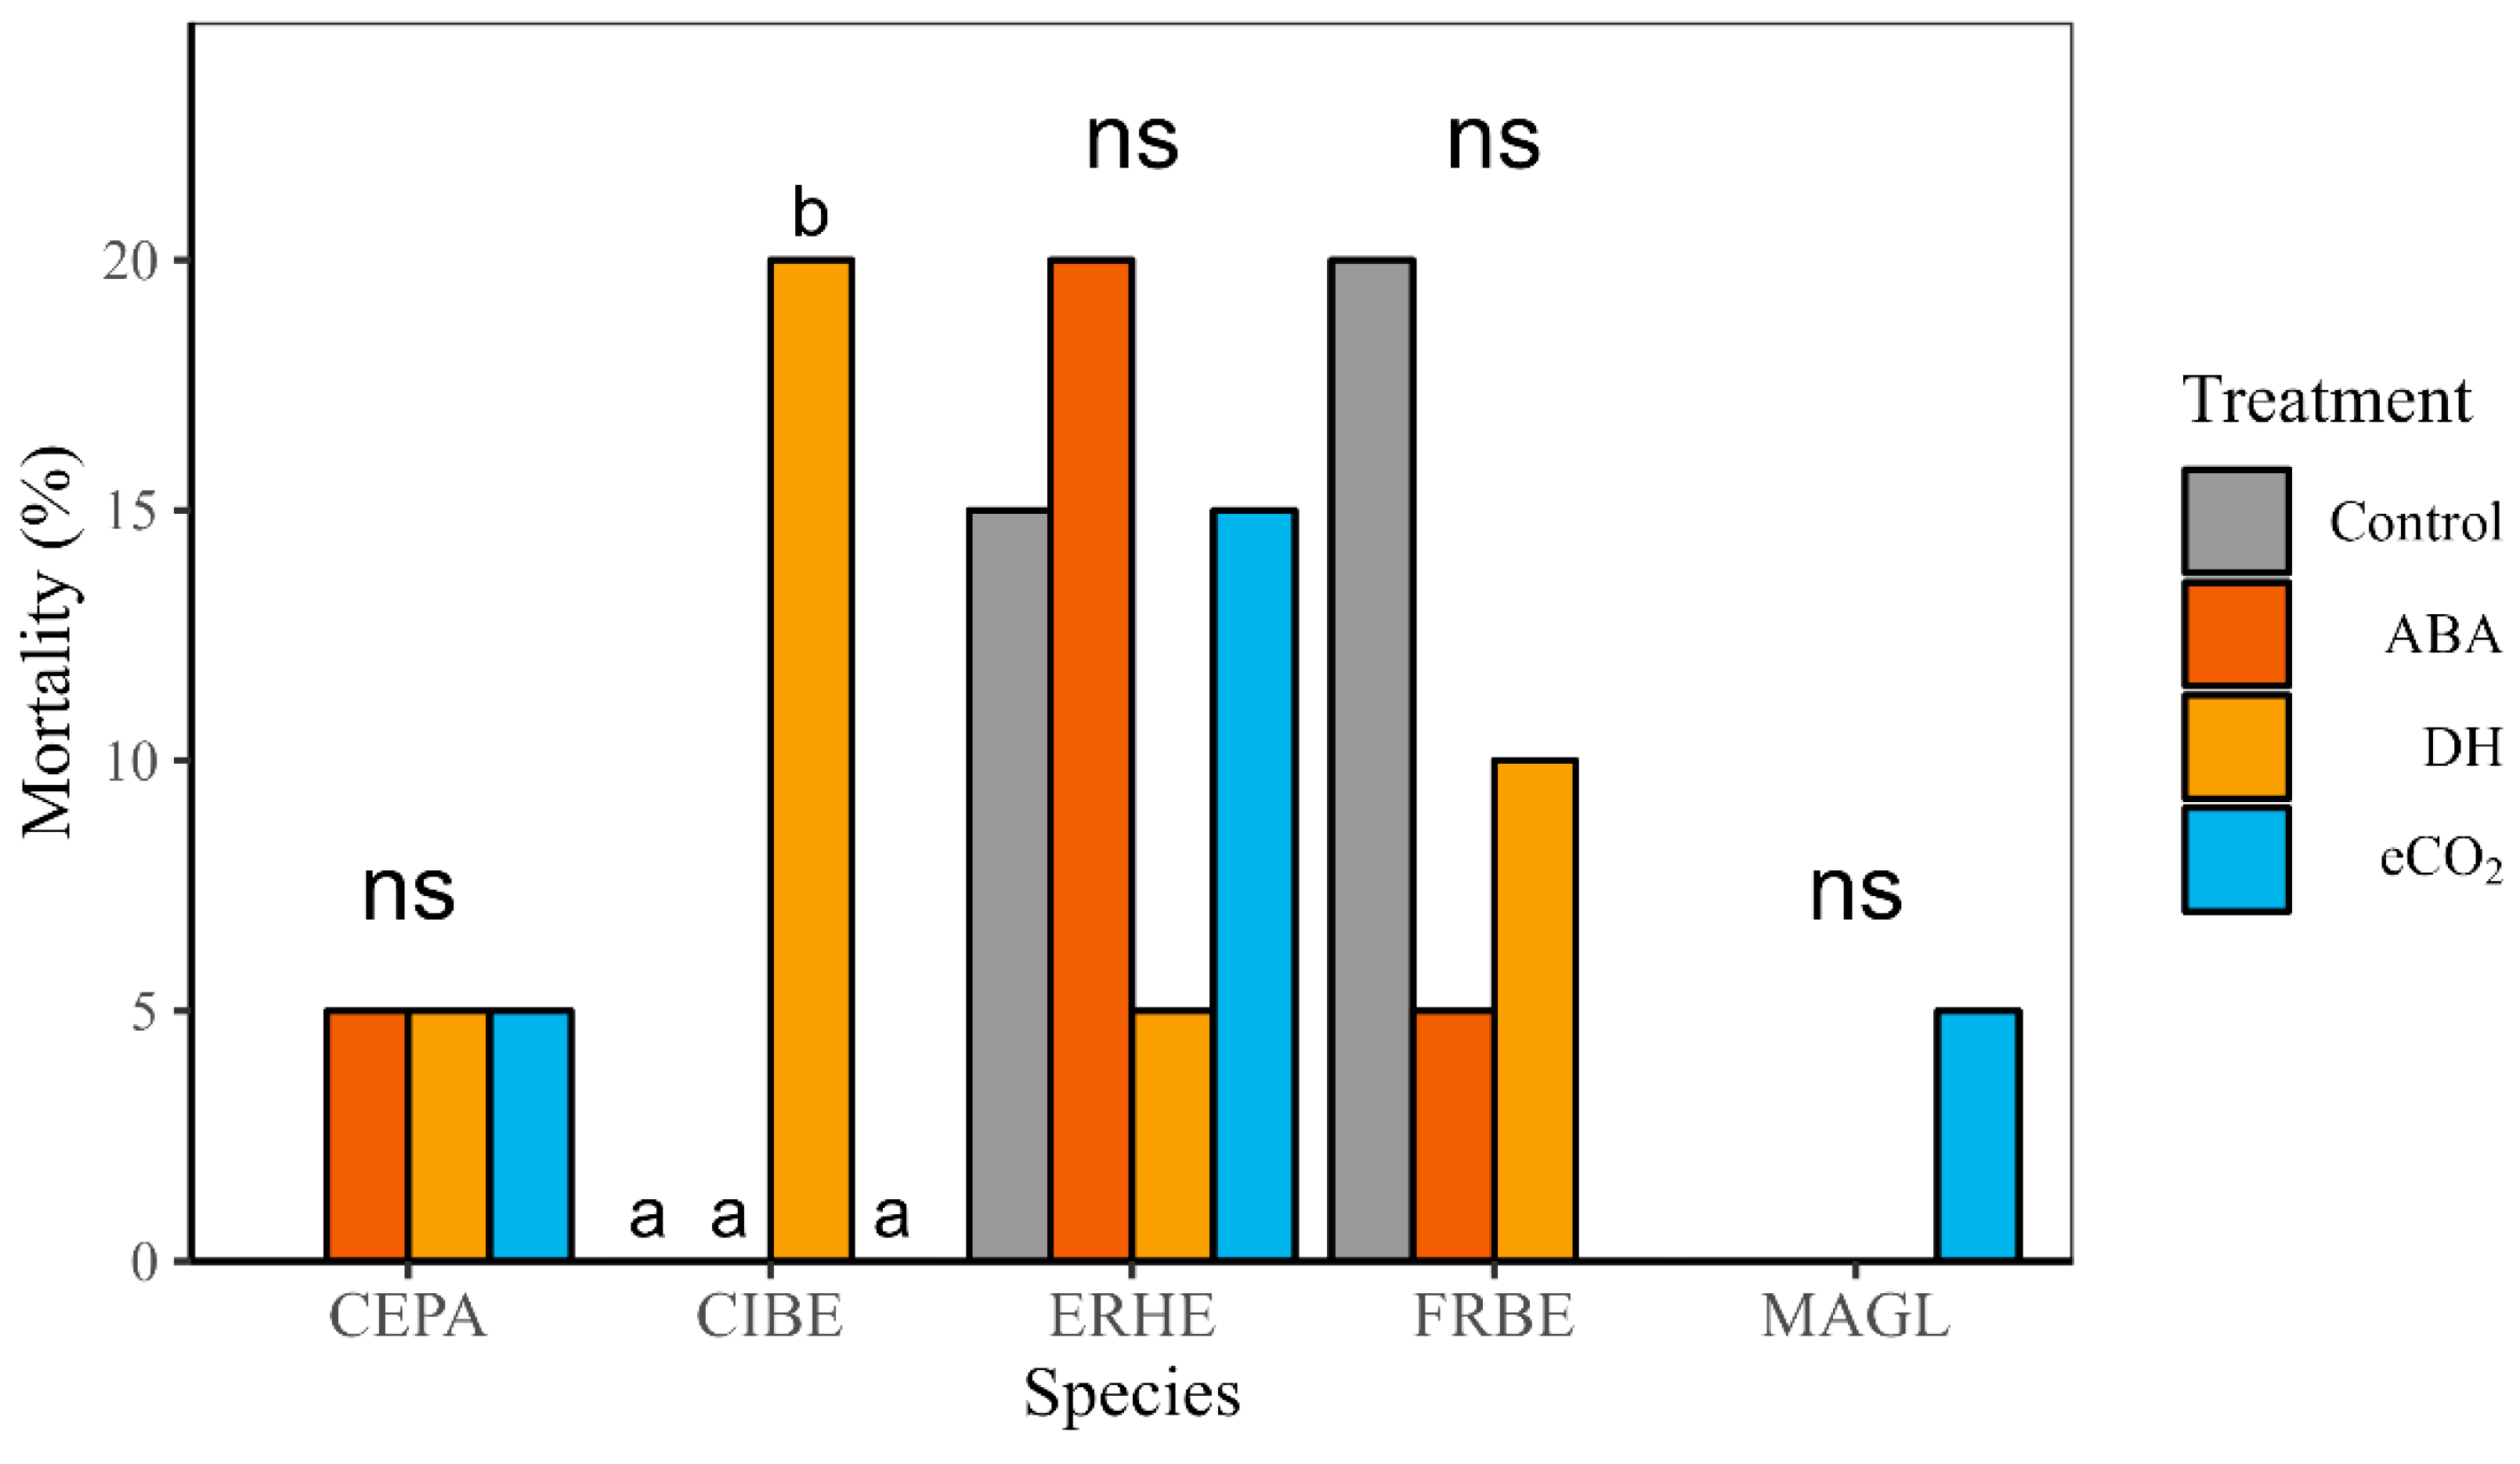
3.4. Field and Post-Treatment Growth and Mortality

Relative growth rate in the nursery during the treatment period for CEPA was significantly higher in eCO2 compared to DH and control (ANOVA and Tukey post hoc; padj < 0.05, Figure 7a), while RGRf showed no differences throughout the monitoring period in the field (ANOVA; padj > 0.05, Figure 7b). For CIBE, ERHE, and FRBE, there were no differences in RGRn and RGRf among treatment groups (ANOVA; padj > 0.05, Figure 7c–h). The eCO2 MAGL group had significantly higher RGRn than the DH treatment but was not significantly different from the control (ANOVA and Tukey post hoc; padj < 0.05 and >0.05, respectively, Figure 7i).
Field relative growth rates of the field experiment were not different among treatments (ANOVA; padj-values > 0.05, Figure 7j). Differences in mortality in response to treatment varied based on species (Figure 8). The ideal GLMs fit for two of the five species were significant (CIBE: Nagelkerke pseudo r2 = 1.00; p < 0.0001; FRBE: Nagelkerke pseudo r2 = 0.43; p < 0.05), while the other three were insignificant (ERHE: Nagelkerke pseudo r2 = 0.13, p = 0.54; CEPA: Nagelkerke pseudo r2 = 0.34; p = 0.34; MAGL: Nagelkerke pseudo r2 = 0.60, p = 0.51). Both block and treatment had a significant effect on mortality for CIBE (Χ2 = 20.01, p < 0.001, and Χ2 = 17.995, p < 0.001, respectively). For FRBE, mortality between blocks was significantly different (Χ2 = 10.68, p < 0.1), and treatment differences were marginally different (Χ2 = 7.25, p = 0.06). All results from this study are summarized in Table 2.

4. Discussion

We tested the effects of drought hardening (DH), elevated CO2 (eCO2), and abscisic acid (ABA) as potential nursery practices that improve the field survival of common species native to a semi-arid hot climate region. Our aim was to reduce plant processes and traits associated with water loss and enhance those tied to stress resistance (transpiration, conductance, WUE, stomatal density, osmleaf, NSC reserves, and SRL). Seedling preconditioning treatments have been explored in forestry for both mesic and semi-arid environments mostly involving DH [8,16,18,20,22]. To our knowledge, this study is the first to document DH efficacy on species from a semi-arid hot region and evaluate ABA and eCO2 as pretreatments to improve transplanting performance in a reforestation context. Our results demonstrate that these treatments modified important physiological and morphological parameters related to drought resistance. Species responded differently to DH and eCO2 likely due to variation in adaptive strategies between species. Abscisic acid had a strong effect that was consistent across species. Despite successful modification of drought resistance characteristics, mortality was increased in the DH group for CIBE and otherwise unaffected in other species-treatment groups likely due to favorable conditions in the field at transplanting time precluding seedlings from stress. Relative growth rate post-planting was not influenced by treatments, possibly due to higher herbivory and ideal field conditions masking differences in growth. Differences in field performance were only observed between species, highlighting a need to evaluate the relationship between species functional strategies and seedling performance.

4.1. Response to Elevated CO2

Exposure to eCO2 was expected to reduce gsw and E through the reduction of SD on newly developed leaves as reported in other studies [39,42,43,44]. We also expected increases in RGRt, NSCs, and osmleaf linked to enhanced photosynthesis accelerating growth while container resources are available and generating excess carbohydrates, once container resources become limited [40,45,46,47,80,81]. Since gas exchange and photosynthesis measurements were taken at ambient CO2 levels, we did not expect seedlings to exhibit increases in Asat and WUE that are often documented when seedling gas exchange is measured under eCO2 conditions [39,40,82]. However, in some cases, merely modifying stomatal density can result in improved water use efficiency [83].
For all species, stomatal density was on average higher in eCO2, and this difference was significant for two of the four species measured (MAGL and ERHE). This unexpected increase in SD under eCO2 was likely linked to higher temperatures within the chamber, possibly leading to reductions in specific leaf area and subsequently increasing stomatal density as plants adjusted to higher temperatures [84,85]. The species-specific changes in SD could be linked to respective heat tolerance corresponding to preferred growing conditions and climatic niches or variation in guard cell differentiation and leaf expansion [86,87,88,89]. The absence of WUE differences for eCO2 was linked to no relative increases in Asat compared to E in any species. Transpiration and gsw were significantly lower on day zero for eCO2 ERHE, but this was likely a result of shock being removed from the conditions of the chamber as post-treatment-period gsw was not statistically different from controls. Furthermore, MAGL saw significant increases in gsw in the post-treatment period, which may have been linked to increased SD also recorded in the species.
During treatment, eCO2 seedling growth was increased for two of the five species measured (CEPA and MAGL). This can be attributed to the high humidity and CO2 of the chamber likely providing favorable growing conditions. In greenhouse studies, plants have been shown to have improved growth when vapor pressure deficit is reduced [90]. The high levels of CO2 present may have counteracted photorespiration typical under high temperatures through competitive exclusion of oxygen around RUBISCO [45,82]. The lack of increased growth in all species could be linked to container resources at the time of treatment. Species that began the treatment with on average smaller seedlings (MAGL and CEPA) likely had not depleted container resources. Even though ERHE was also one of the smaller species at the time of treatment, it did not exhibit improved growth possibly due to less ability to tolerate temperature stress. Often, ERHE was observed with modified leaf angles to reduce incoming radiation and leaf temperature, a strategy this species is known to employ [91]. Species that were on average larger at outset (CIBE and FRBE) did not see improved shoot growth but instead saw increased osmleaf, indicating possible sink limitation and acclimation to eCO2 causing a buildup of osmotically active carbohydrates [40,45]. Both sugars and stress molecules are osmotically active, and both may have driven this increase in osmleaf [80,81]. Only FRBE saw root changes with a modest increase in fine root length which has been demonstrated in some species under eCO2 [92]. If the increase in osmleaf was driven by the buildup of NSCs during treatment, treating plants with eCO2 may be a useful way to improve drought survival as increasing seedling NSC contents has been linked to improved survival under drought conditions [36]. However, a lapse in irrigation subjected ERHE seedlings used in the NSC experiment to extreme drought conditions and made results inconclusive.
Measuring additional leaf variables like leaf area, specific leaf area, stomatal size, stomatal index, and leaf thickness might have enabled a better understanding of how plants were responding to the conditions present in the eCO2 chamber. This treatment may show promise in adjusting seedling physiology and morphology to better cope with transplanting stress, but the development of practical approaches to cost-effectively expose seedlings to eCO2 at the nursery scale would need to be explored.

4.2. Drought Hardening Increased Osmolality and Lowered Stomatal Conductance

Plants respond to drought stress through mechanisms typically divided into drought avoidance (optimizing water loss and uptake) and tolerance (withstanding dehydration) strategies [93,94]. Drought avoidance is achieved through a variety of ways including reductions in gsw and E, improvements in WUE, alterations to the root–shoot ratio, and high SRL to name a few [28,30,37,95]. Plant tolerance to drought is derived from osmotic adjustment, increased cell elasticity, and chloroplast drought resistance [96,97,98]. We expected DH to increase seedlings’ overall drought resistance by modifying these traits as reported in other studies [17,18,22,31,33,93]. Of the variables we measured, we predicted a reduction in post-treatment gsw and E and an increase in WUE, osmleaf, and SRL. Drought hardening had a limited impact on post-treatment gsw and increased osmleaf, while RGRt, WUE, SRL, and fine root length were unaffected. Response to DH varied across species like other studies and was likely caused by differences in drought resistance strategies and seedling ontogeny [18,99].
The species that responded most to DH were CIBE, FRBE, and MAGL. Both CIBE and FRBE showed increases in osmleaf under DH aligning with other studies [16,31,93]. MAGL showed significant reductions in post-treatment gsw while CIBE, ERHE, and FRBE saw no significant differences from controls. The investment into increased osmleaf and little change in gas exchange parameters like gsw in CIBE and FRBE indicate these species may primarily exhibit drought tolerance strategies. MAGL responded to DH with reduced post-treatment gsw, indicating this species may favor drought avoidance strategies. ERHE showed no differences in any of the parameters measured and may have responded with a strategy not quantified in this study. Alternatively, the lack of response could be related to the age of the ERHE cohort (1.5 months vs. 6.5 months of other species). The developmental stage of seedlings has been shown to modify responses to environmental stressors [99,100,101]. ERHE also forms a woody caudex that acts as a storage organ for sugars and water, and water stress strategies may center around this mechanism [102]. Further understanding of this species’ drought response is needed for appropriate hardening methods. Future DH studies in the LRGV should aim to include other important species in thornscrub reforestation along with testing differing intensities and durations of drought treatments which have been deemed important parameters in successful hardening [99].

4.3. Abscisic Acid Reliably Reduced gsw, E, and Asat

Abscisic acid application resulted in large, consistent reductions in day-zero and post-treatment gsw, Asat, and E, which agreed with previous research [53,56,58]. This is in consensus with the literature which shows ABA to be an effective means of reducing leaf surface water loss across a variety of species [49,52,53,54,55,56,57,58]. For all species except MAGL, this reduction in post-treatment gsw lasted for the entirety of the post-treatment measurement period. The reduction in Asat observed was likely due to lowered plant access to CO2 via stomatal closure and not a result of damage to the photosynthetic apparatus, as indicated by no change in WUE. At the end of the post-treatment period, gsw had begun to return to values like control for most species. This aligns with previous studies showing the effects of ABA typically last from 1.7 to 7 days post-treatment [52,53,55]. These results suggest that ABA would be applicable to a wider range of species and provide a reduction in water loss via stomatal closure which may relieve transplant shock-related water loss during the early days after planting. Despite these obvious benefits, the lack of post-planting survival and growth differences in the ABA treatment indicate that more research is needed to determine if ABA can improve post-planting performance. Research evaluating other plant hormones such as those known to spur root growth [103,104] may provide practitioners with more options for bolstering field performance.

4.4. Modifications to Plant Traits Had Little Influence on Field Performance Due to Favorable Field Conditions

We expected species-treatment groups that saw benefits from treatments to show improvements on two timescales: (1) reduced mortality in the near term during the days and weeks post-planting when transplant shock results in death and reduced growth and (2) reduced mortality and increased growth in the mid-term during the harsh conditions of the summer. We predicted ABA would have the largest effect in the near term as our results and those of other studies show benefits typically wane after several days [38,52,53]. Drought hardening was expected to reduce mortality post-planting in the mid- to long term by improving seedling establishment and resistance to drought [8,18,20]. Due to most benefits of eCO2 being linked to increased NSC contents, we anticipated benefits manifest as better seedling establishment with increased NSCs having more resources to invest in stress response and new growth post-planting [4].
Despite the physiological and morphological responses to our treatments related to drought resistance, the only treatment to impact mortality was DH, which increased mortality for CIBE seedlings. No differences in RGRf among treatments were detected during the field study. This increase in mortality may indicate DH methodologies may need to be tailored to species, and hardening may have surpassed the stress tolerance of CIBE. Low mortality for other species-treatment groups was likely a result of above-average rainfall in the months following planting, precluding seedlings from water stress. Consequently, the overall mortality of the planting was much lower than in other studies in the region [65,105,106]. Precipitation events such as these can contribute to a loss of physiological differences among seedlings quickly after planting [8,16]. Even under ideal field conditions, the eCO2 treatment could have increased seedling growth with higher stores of NSCs without limitation associated with ABA and DH treatments like reduced CO2 and water uptake through reduced gsw and increased root suberization [23]. However, seedlings saw high herbivory, and mechanical damage likely disguised differences in RGRf among species if present. The only difference detected in field performance was between species with ERHE showing significantly higher growth rates than all other species likely driven by functional differences in life strategy. Previous work in the LRGV has shown that nitrogen-fixing species (like ERHE) possessed higher RGRf compared to other species [65].

5. Conclusions

For practitioners undertaking reforestation projects, seedling survival is of great importance to success. Methodologies to improve seedling survival must operate within the constraints of a project’s budget and be relatively straightforward. For these reasons, of the treatments evaluated in this paper, we recommend ABA as a consistent way to reduce transplant shock in the near term; however, this study failed to quantify benefits to field performance. Drought hardening may also be simple to implement; however, effectiveness and application strategy will vary by species. Exposure to eCO2 is not amicable to widespread adoption since it would require nurseries to invest in additional infrastructure and variably impact seedlings depending on species and size. In parallel to pre-planting treatments, practitioners could adopt planting strategies based on positive plant–plant interactions that can ameliorate microclimatic conditions for the seedlings (i.e., nurse plants, high-density planting). Additionally, proper species selection targeting functional traits known to be advantageous in a reforestation setting may be important. This application of trait-based restoration has been indirectly studied in the LRGV [65] but is gaining traction in other regions [107]. Future work assessing traits beneficial for specific contexts along with smart planting strategies and practical and effective pre-planting treatments may result in better outcomes in reaching restoration goals in semi-arid hot climates.

Supplementary Materials

The following supporting information can be downloaded at https://www.mdpi.com/article/10.3390/f15091607/s1, Figure S1: Monthly rainfall patterns and important dates during the study period including planting date and mortality and growth censuses. Figure S2: Temperature conditions within a CO2 chamber when the chamber is closed. (a) A 48 h period toward the beginning of the treatment period. (b) A 48 h period toward the end of the treatment period. Blue shading indicates time when the chamber was closed, and seedlings were being exposed to eCO2. Figure S3: Humidity of the eCO2 chamber over the course of a morning prior to the chamber being opened. Black = ambient air, Blue = air within the eCO2 chamber. Figure S4: Non-structural carbohydrate results for eCO2 treatment. This experiment was performed only on ERHE (n = 5). Table S1: Post-treatment period statistical results for ABA treatment. Table S2: Post-treatment period results for the drought hardening (DH) treatment. Table S3: Post-treatment period results for eCO2 treatment.

Author Contributions

Conceptualization, A.F.-C. and B.O.C.; Methodology, D.E.M., C.M.R., A.F.-C. and B.O.C. Software, D.E.M., B.O.C. and R.A.T.; Validation, C.M.R., R.A.T., A.F.-C. and B.O.C.; original draft preparation D.E.M., A.F.-C. and B.O.C.; review and editing, R.A.T. and C.M.R. All authors have read and agreed to the published version of the manuscript.

Funding

This study was supported by The Nature Conservancy (TNC) through a cooperative grant agreement with the University of Texas Rio Grande Valley (UTRGV).

Data Availability Statement

Data are contained within the article and Supplementary Materials.

Acknowledgments

We are grateful to TNC staff who provided logistical assistance (Marcos Ruiz, Sonia Najera) and UTRGV faculty who gave access to scientific equipment and volunteers (Boris Ermolinsky, Saydur Rahman, and Lucia Carreon). Further help from UTRGV students Asael Rodriguez, Jessica Ayala, Jamie Langbein, Natalia Moore, Edward Gniffke, Zarek Contreras, and Caitlin Brett.

Conflicts of Interest

The authors declare no conflicts of interest.

References

  1. Derhé, M.A.; Murphy, H.; Monteith, G.; Menéndez, R. Measuring the Success of Reforestation for Restoring Biodiversity and Ecosystem Functioning. J. Appl. Ecol. 2016, 53, 1714–1724. [Google Scholar] [CrossRef]
  2. Evans, D.M.; Zipper, C.E.; Burger, J.A.; Strahm, B.D.; Villamagna, A.M. Reforestation Practice for Enhancement of Ecosystem Services on a Compacted Surface Mine: Path toward Ecosystem Recovery. Ecol. Eng. 2013, 51, 16–23. [Google Scholar] [CrossRef]
  3. Grossnickle, S.C. Seedling Establishment on a Forest Restoration Site-An Ecophysiological Perspective. Reforesta 2018, 6, 110–139. [Google Scholar] [CrossRef]
  4. Close, D.C.; Beadle, C.L.; Brown, P.H. The Physiological Basis of Containerised Tree Seedling ‘Transplant Shock’: A Review. Aust. For. 2005, 68, 112–120. [Google Scholar] [CrossRef]
  5. Duniway, M.C.; Petrie, M.D.; Peters, D.P.C.; Anderson, J.P.; Crossland, K.; Herrick, J.E. Soil Water Dynamics at 15 Locations Distributed across a Desert Landscape: Insights from a 27-Yr Dataset. Ecosphere 2018, 9, e02335. [Google Scholar] [CrossRef]
  6. Grossnickle, S.C.; Kiiskila, S.B.; Haase, D.L. Seedling Ecophysiology: Five Questions to Explore in the Nursery for Optimizing Subsequent Field Success. Tree Plant. Notes 2020, 63, 112–127. [Google Scholar]
  7. Villar-Salvador, P.; Puértolas, J.; Cuesta, B.; Peñuelas, J.L.; Uscola, M.; Heredia-Guerrero, N.; Rey Benayas, J.M. Increase in Size and Nitrogen Concentration Enhances Seedling Survival in Mediterranean Plantations. Insights from an Ecophysiological Conceptual Model of Plant Survival. New For. 2012, 43, 755–770. [Google Scholar] [CrossRef]
  8. Luo, N.; Grossnickle, S.C.; Li, G. The Effect of Nursery Drought Preconditioning on Summer Plantation Performance of Pinus tabuliformis: High Winter Mortality Mediated by Trade off between Seedling Carbohydrate and Field Growth. New For. 2022, 53, 301–317. [Google Scholar] [CrossRef]
  9. Breton, V.; Crosaz, Y.; Rey, F. Effects of Wood Chip Amendments on the Revegetation Performance of Plant Species on Eroded Marly Terrains in a Mediterranean Mountainous Climate (Southern Alps, France). Solid. Earth 2016, 7, 599–610. [Google Scholar] [CrossRef]
  10. Castro, J.; Zamora, R.; Hódar, J.A.; Gómez, J.M. Use of Shrubs as Nurse Plants: A New Technique for Reforestation in Mediterranean Mountains. Restor. Ecol. 2002, 10, 297–305. [Google Scholar] [CrossRef]
  11. Rajaud, A.; de Noblet-Ducoudré, N. Tropical Semi-Arid Regions Expanding over Temperate Latitudes under Climate Change. Clim. Chang. 2017, 144, 703–719. [Google Scholar] [CrossRef]
  12. Belda, M.; Holtanová, E.; Halenka, T.; Kalvová, J. Climate Classification Revisited: From Köppen to Trewartha. Clim. Res. 2014, 59, 1–13. [Google Scholar] [CrossRef]
  13. Chan, D.; Wu, Q. Significant Anthropogenic-Induced Changes of Climate Classes since 1950. Sci. Rep. 2015, 5, 13487. [Google Scholar] [CrossRef]
  14. Beck, H.E.; Zimmermann, N.E.; McVicar, T.R.; Vergopolan, N.; Berg, A.; Wood, E.F. Present and Future Köppen-Geiger Climate Classification Maps at 1-Km Resolution. Sci. Data 2018, 5, 180214. [Google Scholar] [CrossRef]
  15. Coopman, R.E.; Jara, J.C.; Bravo, L.A.; Sáez, K.L.; Mella, G.R.; Escobar, R. Changes in Morpho-Physiological Attributes of Eucalyptus globulus Plants in Response to Different Drought Hardening Treatments. Electron. J. Biotechnol. 2008, 11, 30–39. [Google Scholar] [CrossRef]
  16. Villar-Salvador, P.; Planelles, R.; Oliet, J.; Peñuelas-Rubira, J.L.; Jacobs, D.F.; González, M. Drought Tolerance and Transplanting Performance of Holm Oak (Quercus Ilex) Seedlings after Drought Hardening in the Nursery. Tree Physiol. 2004, 24, 1147–1155. [Google Scholar] [CrossRef] [PubMed]
  17. Villar-Salvador, P.; Peñuelas, J.L.; Jacobs, D.F. Nitrogen Nutrition and Drought Hardening Exert Opposite Effects on the Stress Tolerance of Pinus pinea L. Seedlings. Tree Physiol. 2013, 33, 221–232. [Google Scholar] [CrossRef] [PubMed]
  18. Valliere, J.M.; Zhang, J.; Sharifi, M.R.; Rundel, P.W. Can We Condition Native Plants to Increase Drought Tolerance and Improve Restoration Success? Ecol. Appl. 2019, 29, e01863. [Google Scholar] [CrossRef]
  19. Vilagrosa, A.; Cortina, J.; Gil-Pelegrín, E.; Bellot, J. Suitability of Drought-Preconditioning Techniques in Mediterranean Climate. Restor. Ecol. 2003, 11, 208–216. [Google Scholar] [CrossRef]
  20. Van Den Driessche, R. Influence of Container Nursery Regimes on Drought Resistance of Seedlings Following Planting. I. Survival and Growth. Can. J. For. Res. 1991, 21, 555–565. [Google Scholar] [CrossRef]
  21. Jacobs, D.F.; Francis Salifu, K.; Davis, A.S. Drought Susceptibility and Recovery of Transplanted Quercus rubra Seedlings in Relation to Root System Morphology. Ann. Sci. 2009, 66, 504. [Google Scholar] [CrossRef]
  22. Van Den Driessche, R. Influence of Container Nursery Regimes on Drought Resistance of Seedlings Following Planting: II. Stomatal Conductance, Specific Leaf Area, and Root Growth Capacity. Can. J. For. Res. 1991, 21, 566–572. [Google Scholar] [CrossRef]
  23. Rietveld, W.J. Transplanting Stress in Bareroot Conifer Seedlings: Its Development and Progression to Establishment. North. J. Appl. For. 1989, 6, 99–107. [Google Scholar] [CrossRef]
  24. Galvez, D.A.; Landhäusser, S.M.; Tyree, M.T. Low Root Reserve Accumulation during Drought May Lead to Winter Mortality in Poplar Seedlings. New Phytol. 2013, 198, 139–148. [Google Scholar] [CrossRef] [PubMed]
  25. Chaves, M.M. Effects of Water Deficits on Carbon Assimilation. J. Exp. Bot. 1991, 42, 1–16. [Google Scholar] [CrossRef]
  26. Grossnickle, S. Seedling Size and Reforestation Success. How Big Is Big Enough? In Proceedings of the Thin Green Line: A Symposium on the State-of-the-Art in Reforestation, Thunder Bay, ON, Canada, 26–28 July 2005; pp. 138–143. [Google Scholar]
  27. Burdett, A.N. Physiological Processes in Plantation Establishment and the Development of Specifications for Forest Planting Stock. Can. J. For. Restor. 1990, 20, 415–427. [Google Scholar] [CrossRef]
  28. Kozlowski, T.; Pallardy, S. Acclimation and Adaptive Responses of Woody Plants to Environmental Stresses. Bot. Rev. 2002, 68, 270–334. [Google Scholar] [CrossRef]
  29. Grossnickle, S.C. Why Seedlings Survive: Influence of Plant Attributes. New For. 2012, 43, 711–738. [Google Scholar] [CrossRef]
  30. Folk, R.S.; Grossnickle, S.C. Stock-Type Patterns of Phosphorus Uptake, Retranslocation, Net Photosynthesis and Morphological Development in Interior Spruce Seedlings. New For. 2000, 19, 27–49. [Google Scholar] [CrossRef]
  31. Ruiz-Sánchez, M.C.; Domingo, R.; Torrecillas, A.; Pérez-Pastor, A. Water Stress Preconditioning to Improve Drought Resistance in Young Apricot Plants. Plant Sci. 2000, 156, 245–251. [Google Scholar] [CrossRef]
  32. Thomas, D.S. Survival and Growth of Drought Hardened Eucalyptus pilularis Sm. Seedlings and Vegetative Cuttings. New For. 2009, 38, 245–259. [Google Scholar] [CrossRef]
  33. Zhang, S.H.; Xu, X.F.; Sun, Y.M.; Zhang, J.L.; Li, C. zhou Influence of Drought Hardening on the Resistance Physiology of Potato Seedlings under Drought Stress. J. Integr. Agric. 2018, 17, 336–347. [Google Scholar] [CrossRef]
  34. Ritchie, G.A. Carbohydrate Reserves and Root Growth Potential in Douglas-Fir Seedlings before and after Cold Storage. Can. J. For. Res. 1982, 12, 905–912. [Google Scholar] [CrossRef]
  35. Cuesta, B.; Vega, J.; Villar-Salvador, P.; Rey-Benayas, J.M. Root Growth Dynamics of Aleppo Pine (Pinus halepensis Mill.) Seedlings in Relation to Shoot Elongation, Plant Size and Tissue Nitrogen Concentration. Trees Struct. Funct. 2010, 24, 899–908. [Google Scholar] [CrossRef]
  36. O’Brien, M.J.; Burslem, D.F.R.P.; Caduff, A.; Tay, J.; Hector, A. Contrasting Nonstructural Carbohydrate Dynamics of Tropical Tree Seedlings under Water Deficit and Variability. New Phytol. 2015, 205, 1083–1094. [Google Scholar] [CrossRef]
  37. Mexal, J.G.; Landis, T.D. Target Seedling Concepts: Height and Diameter. In Proceedings of the Western Forest Nursery Associations; Rose, R., Campbell, S.J., Landis, T.D., Eds.; Gen. Tech. Rep RM-200; U.S. Department of Agriculture, Forest Service, Rocky Mountain Research Station: Fort Collins, CO, USA, 1990; pp. 17–36. [Google Scholar]
  38. Leskovar, D.I.; Goreta, S.; Jifon, J.L.; Agehara, S.; Shinohara, T.; Moore, D. ABA to Enhance Water Stress Tolerance of Vegetable Transplants. Acta Hortic. 2008, 782, 253–263. [Google Scholar] [CrossRef]
  39. Habermann, E.; Dias de Oliveira, E.A.; Contin, D.R.; San Martin, J.A.B.; Curtarelli, L.; Gonzalez-Meler, M.A.; Martinez, C.A. Stomatal Development and Conductance of a Tropical Forage Legume Are Regulated by Elevated [CO2] under Moderate Warming. Front. Plant Sci. 2019, 10, 609. [Google Scholar] [CrossRef]
  40. Li, W.; Hartmann, H.; Adams, H.D.; Zhang, H.; Jin, C.; Zhao, C.; Guan, D.; Wang, A.; Yuan, F.; Wu, J. The Sweet Side of Global Change-Dynamic Responses of Non-Structural Carbohydrates to Drought, Elevated CO2 and Nitrogen Fertilization in Tree Species. Tree Physiol. 2018, 38, 1706–1723. [Google Scholar] [CrossRef]
  41. Landis, T.D. Chapter 2—Irrigation and Water Management. In The Container Tree Nursery Manual; US Department of Agriculture Forest Service: Washington, DC, USA, 1989; Volume 4, pp. 69–119. [Google Scholar]
  42. Lin, J.; Jach, M.E.; Ceulemans, R. Stomatal Density and Needle Anatomy of Scots Pine (Pinus sylvestris) Are Affected by Elevated CO2. New Phytol. 2001, 150, 665–674. [Google Scholar] [CrossRef]
  43. Teng, N.; Wang, J.; Chen, T.; Wu, X.; Wang, Y.; Lin, J. Elevated CO2 Induces Physiological, Biochemical and Structural Changes in Leaves of Arabidopsis thaliana. New Phytol. 2006, 172, 92–103. [Google Scholar] [CrossRef]
  44. Habermann, E.; San Martin, J.A.B.; Contin, D.R.; Bossan, V.P.; Barboza, A.; Braga, M.R.; Groppo, M.; Martinez, C.A. Increasing Atmospheric CO2 and Canopy Temperature Induces Anatomical and Physiological Changes in Leaves of the C4 Forage Species Panicum maximum. PLoS ONE 2019, 14, e0212506. [Google Scholar] [CrossRef] [PubMed]
  45. Drake, B.G.; Gonzàlez-Meler, M.A.; Long, S.P. More Efficient Plants: A Consequence of Rising Atmospheric CO2? Annu. Rev. Plant Biol. 1997, 48, 609–639. [Google Scholar] [CrossRef] [PubMed]
  46. Körner, C. Carbon Limitation in Trees. J. Ecol. 2003, 91, 4–17. [Google Scholar] [CrossRef]
  47. Sala, A.; Woodruff, D.R.; Meinzer, F.C. Carbon Dynamics in Trees: Feast or Famine? Tree Physiol. 2012, 32, 764–775. [Google Scholar] [CrossRef]
  48. Martínez-Vilalta, J.; Sala, A.; Asensio, D.; Galiano, L.; Hoch, G.; Palacio, S.; Piper, F.I.; Lloret, F. Dynamics of Non-Structural Carbohydrates in Terrestrial Plants: A Global Synthesis. Ecol. Monogr. 2016, 86, 495–516. [Google Scholar] [CrossRef]
  49. Mphande, W.; Kettlewell, P.S.; Grove, I.G.; Farrell, A.D. The Potential of Antitranspirants in Drought Management of Arable Crops: A Review. Agric. Water Manag. 2020, 236, 106143. [Google Scholar] [CrossRef]
  50. Kim, J.; Malladi, A.; van Iersel, M.W. Physiological and Molecular Responses to Drought in Petunia: The Importance of Stress Severity. J. Exp. Bot. 2012, 63, 6335–6345. [Google Scholar] [CrossRef]
  51. Munemasa, S.; Hauser, F.; Park, J.; Waadt, R.; Brandt, B.; Schroeder, J.I. Mechanisms of Abscisic Acid-Mediated Control of Stomatal Aperture. Curr. Opin. Plant Biol. 2015, 28, 154–162. [Google Scholar] [CrossRef]
  52. Hebert, C.J.; LeBude, A.V.; Campbell, C. Effects of S-ABA on the Physiology and Marketability of Various Container-Grown Taxa During Short-Term Desiccation. J. Environ. Hortic. 2010, 28, 202–208. [Google Scholar] [CrossRef]
  53. Waterland, N.L.; Campbell, C.A.; Finer, J.J.; Jones, M.L. Abscisic Acid Application Enhances Drought Stress Tolerance in Bedding Plants. HortScience 2010, 45, 409–413. [Google Scholar] [CrossRef]
  54. Racsko, J.; Marmor, F.; Hopkins, C.R.; Petracek, P.; Silverman, F.P.; Fritts, R.; Liu, X.; Woolard, D.; Lopez, J.; Leep, D.; et al. Use of S-Abscisic Acid (ConTegoTM SL) in Vegetable Production. Acta Hortic. 2014, 1042, 243–253. [Google Scholar] [CrossRef]
  55. Shinohara, T.; Leskovar, D.I. Effects of ABA, Antitranspirants, Heat and Drought Stress on Plant Growth, Physiology and Water Status of Artichoke Transplants. Sci. Hortic. 2014, 165, 225–234. [Google Scholar] [CrossRef]
  56. Park, S.; Mills, S.A.; Moon, Y.; Waterland, N.L. Evaluation of Antitranspirants for Enhancing Temporary Water Stress Tolerance in Bedding Plants. Horttechnology 2016, 26, 444–452. [Google Scholar] [CrossRef]
  57. Zhang, X.; Zhang, X.; Liu, X.; Shao, L.; Sun, H.; Chen, S. Improving Winter Wheat Performance by Foliar Spray of ABA and FA Under Water Deficit Conditions. J. Plant Growth Regul. 2016, 35, 83–96. [Google Scholar] [CrossRef]
  58. Huang, X.; Lin, S.; He, S.; Lin, X.; Liu, J.; Chen, R.; Li, H. Characterization of Stomata on Floral Organs and Scapes of Cut ‘Real’ Gerbaras and Their Involvement in Postharvest Water Loss. Postharvest Biol. Technol. 2018, 142, 39–45. [Google Scholar] [CrossRef]
  59. Leslie, D.M., Jr. An International Borderland of Concern: Conservation of Biodiversity in the Lower Rio Grande Valley Scientific Investigations Report, 2016-5078; US Geological Survey: Reston, VA, USA, 2016. [Google Scholar]
  60. Ruiz, M. Personal Communication; The Nature Conservancy: Brownsville, TX, USA, 2021. [Google Scholar]
  61. Soil Survey Staff Web Soil Survey. Available online: https://www.nrcs.usda.gov/resources/data-and-reports/web-soil-survey (accessed on 14 August 2024).
  62. Thornthwaite, C.W. An Approach toward a Rational Classification of Climate. Geogr. Rev. 1948, 38, 55. [Google Scholar] [CrossRef]
  63. Stowe, L.G.; Brown, J.L. A Geographic Perspective on the Ecology of Compound Leaves. Evolution 1981, 35, 818–821. [Google Scholar] [CrossRef]
  64. Xu, F.; Guo, W.; Xu, W.; Wei, Y.; Wang, R. Leaf Morphology Correlates with Water and Light Availability: What Consequences for Simple and Compound Leaves. Prog. Nat. Sci. 2009, 19, 1789–1798. [Google Scholar] [CrossRef]
  65. Givnish, T.J. Comparative Studies of Leaf Form: Assessing the Relative Roles of Selective Pressures and Phylogenetic Constraints. New Phytol. 1987, 106, 131–160. [Google Scholar] [CrossRef]
  66. Mohsin, F.; Arias, M.; Albrecht, C.; Wahl, K.; Fierro-Cabo, A.; Christoffersen, B. Species-Specific Responses to Restoration Interventions in a Tamaulipan Thornforest. Ecol. Manag. 2021, 491, 119–154. [Google Scholar] [CrossRef]
  67. Bartlett, M.K.; Scoffoni, C.; Ardy, R.; Zhang, Y.; Sun, S.; Cao, K.; Sack, L. Rapid Determination of Comparative Drought Tolerance Traits: Using an Osmometer to Predict Turgor Loss Point. Methods Ecol. Evol. 2012, 3, 880–888. [Google Scholar] [CrossRef]
  68. Albrecht, C.; Contreras, Z.; Wahl, K.; Sternberg, M.; Christoffersen, B. Winners and Losers in Dryland Reforestation: Species Survival, Growth, and Recruitment along a 33-Year Planting Chronosequence. Restor. Ecol. 2022, 30, e13559. [Google Scholar] [CrossRef]
  69. Schneider, C.; Rasband, W.; Eliceiri, K. NIH Image to ImageJ: 25 years of image analysis. Nat Methods 2012, 9, 671–675. [Google Scholar] [CrossRef] [PubMed]
  70. Landhäusser, S.M.; Chow, P.S.; Turin Dickman, L.; Furze, M.E.; Kuhlman, I.; Schmid, S.; Wiesenbauer, J.; Wild, B.; Gleixner, G.; Hartmann, H.; et al. Standardized Protocols and Procedures Can Precisely and Accurately Quantify Non-Structural Carbohydrates. Tree Physiol. 2018, 38, 1764–1778. [Google Scholar] [CrossRef]
  71. Hunt, R.; Causton, D.R.; Shipley, B.; Askew, A.P. A Modern Tool for Classical Plant Growth Analysis. Ann. Bot. 2002, 90, 485–488. [Google Scholar] [CrossRef]
  72. Sheil, D.; May, R.M. Mortality and Recruitment Rate Evaluations in Heterogenous Tropical Forests. J. Ecol. 1996, 84, 91–100. [Google Scholar] [CrossRef]
  73. R, version 4.3.1; A Language and Environment for Statistical Computing; Windows; R Foundation for Statistical Computing: Vienna, Austria, 2023.
  74. Fox, J.; Weisberg, S. An R Companion to Applied Regression, 3rd ed.; Sage: Thousand Oaks, CA, USA, 2019. [Google Scholar]
  75. Rstatix, version 0.7.2, Pipe-Friendly Framework for Basic Statistical Tests; R Package; Datanovia: Marseille, France, 2023. [CrossRef]
  76. Zeileis, A.; Hothorn, T. Diagnostic Checking in Regression Relationships. R. News 2002, 2, 7–10. [Google Scholar]
  77. Fox, J. Regression Diagnostics: An Introduction; Sage Publications Inc.: Thousand Oaks, CA, USA, 1991. [Google Scholar]
  78. Rcompanion, version 2.4.36, Functions to Support Extension Education Program Evaluation; R package; Rutgers Cooperative Extension: New Brunswick, NJ, USA, 2024.
  79. Hothorn, T.; Bretz, F.; Westfall, P. Simultaneous Inference in General Parametric Models. Biom. J. 2008, 50, 346–363. [Google Scholar] [CrossRef]
  80. Seemann, J.R.; Downton, W.J.S.; Berry, J.A. Temperature and Leaf Osmotic Potential as Factors in the Acclimation of Photosynthesis to High Temperature in Desert Plants. Plant Physiol. 1986, 80, 926–930. [Google Scholar] [CrossRef]
  81. Iba, K. Acclimative Response to Temperature Stress in Higher Plants: Approaches of Gene Engineering for Temperature Tolerance. Annu. Rev. Plant Biol. 2002, 53, 225–245. [Google Scholar] [CrossRef]
  82. Ainsworth, E.A.; Long, S.P. What Have We Learned from 15 Years of Free-Air CO2 Enrichment (FACE)? A Meta-Analytic Review of the Responses of Photosynthesis, Canopy Properties and Plant Production to Rising CO2. New Phytol. 2005, 165, 351–372. [Google Scholar] [CrossRef] [PubMed]
  83. Franks, P.J.; Doheny-Adams, T.W.; Britton-Harper, Z.J.; Gray, J.E. Increasing Water-Use Efficiency Directly through Genetic Manipulation of Stomatal Density. New Phytol. 2015, 207, 188–195. [Google Scholar] [CrossRef] [PubMed]
  84. Jumrani, K.; Bhatia, V.S.; Pandey, G.P. Impact of Elevated Temperatures on Specific Leaf Weight, Stomatal Density, Photosynthesis and Chlorophyll Fluorescence in Soybean. Photosynth. Res. 2017, 131, 333–350. [Google Scholar] [CrossRef] [PubMed]
  85. Zhu, J.; Zhu, H.; Cao, Y.; Li, J.; Zhu, Q.; Yao, J.; Xu, C. Effect of Simulated Warming on Leaf Functional Traits of Urban Greening Plants. BMC Plant Biol. 2020, 20, 139. [Google Scholar] [CrossRef] [PubMed]
  86. Ceulemans, R.; van Praet, L.; Jiang, X.N. Effects of CO2 Enrichment, Leaf Position and Clone on Stomatal Index and Epidermal Cell Density in Poplar (Populus). New Phytol. 1995, 131, 99–107. [Google Scholar] [CrossRef]
  87. Poole, I.; Lawson, T.; Weyers, J.D.B.; Raven, J.A. Effect of Elevated CO2 on the Stomatal Distribution and Leaf Physiology of Alnus glutinosa. New Phytol. 2000, 145, 511–521. [Google Scholar] [CrossRef]
  88. Feeley, K.; Martinez-Villa, J.; Perez, T.; Silva Duque, A.; Triviño Gonzalez, D.; Duque, A. The Thermal Tolerances, Distributions, and Performances of Tropical Montane Tree Species. Front. For. Glob. Chang. 2020, 3, 1–11. [Google Scholar] [CrossRef]
  89. Kullberg, A.T.; Feeley, K.J. Limited Acclimation of Leaf Traits and Leaf Temperatures in a Subtropical Urban Heat Island. Tree Physiol. 2022, 42, 2266–2281. [Google Scholar] [CrossRef]
  90. Lu, N.; Nukaya, T.; Kamimura, T.; Zhang, D.; Kurimoto, I.; Takagaki, M.; Maruo, T.; Kozai, T.; Yamori, W. Control of Vapor Pressure Deficit (VPD) in Greenhouse Enhanced Tomato Growth and Productivity during the Winter Season. Sci. Hortic. 2015, 197, 17–23. [Google Scholar] [CrossRef]
  91. Herbert, T.J. Axial Rotation of Erythrina herbacea Leaflets. Am. J. Bot. 1984, 71, 76–79. [Google Scholar] [CrossRef]
  92. Ostonen, I.; Püttsepp, Ü.; Biel, C.; Alberton, O.; Bakker, M.R.; Lõhmus, K.; Majdi, H.; Metcalfe, D.; Olsthoorn, A.F.M.; Pronk, A.; et al. Specific Root Length as an Indicator of Environmental Change. Plant Biosyst. 2007, 141, 426–442. [Google Scholar] [CrossRef]
  93. Abrams, M.D. Sources of Variation in Osmotic Potentials with Special Reference to North American Tree Species. For. Sci. 1988, 34, 1030–1046. [Google Scholar] [CrossRef]
  94. McDowell, N.; Pockman, W.T.; Allen, C.D.; Breshears, D.D.; Cobb, N.; Kolb, T.; Plaut, J.; Sperry, J.; West, A.; Williams, D.G.; et al. Mechanisms of Plant Survival and Mortality during Drought: Why Do Some Plants Survive While Others Succumb to Drought? New Phytol. 2008, 178, 719–739. [Google Scholar] [CrossRef] [PubMed]
  95. Garbowski, M.; Avera, B.; Bertram, J.H.; Courkamp, J.S.; Gray, J.; Hein, K.M.; Lawrence, R.; McIntosh, M.; McClelland, S.; Post, A.K.; et al. Getting to the Root of Restoration: Considering Root Traits for Improved Restoration Outcomes under Drought and Competition. Restor. Ecol. 2020, 28, 1384–1395. [Google Scholar] [CrossRef]
  96. Saliendra, N.Z.; Meinzer, F.C. Symplast Volume, Turgor, Stomatal Conductance and Growth in Relation to Osmotic and Elastic Adjustment in Droughted Sugarcane. J. Exp. Bot. 1991, 42, 1251–1259. [Google Scholar] [CrossRef]
  97. Sanders, G.J.; Arndt, S.K. Osmotic Adjustment under Drought Conditions. In Plant Responses to Drought Stress: From Morphological to Molecular Features; Springer: Berlin/Heidelberg, Germany, 2012; pp. 199–229. ISBN 9783642326530. [Google Scholar]
  98. Martins, J.; Neves, M.; Canhoto, J. Drought-Stress-Induced Changes in Chloroplast Gene Expression in Two Contrasting Strawberry Tree (Arbutus unedo L.) Genotypes. Plants 2023, 12, 4133. [Google Scholar] [CrossRef]
  99. Von Moler, E.R.; Nelson, A.S. Perspectives on Drought Preconditioning Treatments With a Case Study Using Western Larch. Front. Plant Sci. 2021, 12, 741027. [Google Scholar] [CrossRef]
  100. Zhou, S.X.; Medlyn, B.E.; Prentice, I.C. Long-Term Water Stress Leads to Acclimation of Drought Sensitivity of Photosynthetic Capacity in Xeric but Not Riparian Eucalyptus Species. Ann. Bot. 2016, 117, 133–144. [Google Scholar] [CrossRef]
  101. Von Moler, E.R.; Kolb, T.; Brady, A.; Palmiero, B.N.; Wallace, T.R.; Waring, K.M.; Whipple, A.V. Plant Developmental Stage Influences Responses of Pinus strobiformis Seedlings to Experimental Warming. Plant-Environ. Interact. 2021, 2, 148–164. [Google Scholar] [CrossRef]
  102. Neyland, R. Wildflowers of the Coastal Plain; LSU Press: Baton Rouge, LA, USA, 2009. [Google Scholar]
  103. Tanimoto, E. Regulation of Root Growth by Plant Hormones—Roles for Auxin and Gibberellin. CRC Crit. Rev. Plant Sci. 2005, 24, 249–265. [Google Scholar] [CrossRef]
  104. Dickinson, A.J.; Lehner, K.; Mi, J.; Jia, K.P.; Mijar, M.; Dinneny, J.; Al-Babili, S.; Benfey, P.N. β-Cyclocitral Is a Conserved Root Growth Regulator. Proc. Natl. Acad. Sci. USA 2019, 116, 10563–10567. [Google Scholar] [CrossRef] [PubMed]
  105. Ewing, K.; Best, C. South Texas Tamaulipan Thornscrub Restoration Experiment Measures Growth of Planted Woody Vegetation. Ecol. Restor. 2004, 22, 11–17. [Google Scholar] [CrossRef]
  106. Dick, K.; Alexander, H.D.; Moczygemba, J.D. Use of Shelter Tubes, Grass-Specific Herbicide, and Herbivore Exclosures to Reduce Stressors and Improve Restoration of Semiarid Thornscrub Forests. Restor. Ecol. 2016, 24, 785–793. [Google Scholar] [CrossRef]
  107. Zirbel, C.R.; Brudvig, L.A. Trait–Environment Interactions Affect Plant Establishment Success during Restoration. Ecology 2020, 101, e02971. [Google Scholar] [CrossRef] [PubMed]
Figure 1. Experimental setup. (a) The chamber used to subject seedlings to elevated CO2 and levels of CO2 in the chamber over the treatment period and abscisic acid and drought hardening application methodology. (b) Field experiment species block setup with each dot representing a single plant and each row a treatment. (c) Field plot and orientation of blocks.
Forests 15 01607 g001
Figure 2. Gas exchange parameters at end of treatment (day zero) for each species-treatment group measured. Asterisks mark significant difference in means (*: p < 0.05, **: p < 0.01, ***: p < 0.001; ANOVA) between treatment and controls within each species. DH (drought hardening) and ABA (abscisic acid) treatments measurements performed on old leaves (n = 9–10) and eCO2 (elevated CO2) performed on young leaves (n = 8–10). CIBE eCO2 leaves were too small to measure and excluded. WUE (water use efficiency), Asat (assimilation rate), E (transpiration), gsw (stomatal conductance). Black circles represent outliers outside of 1.5 times interquartile range. Species are Citharexylum berlandieri (CIBE), Erythrina herbacea (ERHE), and Fraxinus berlandieriana (FRBE).
Forests 15 01607 g002
Figure 3. Post-treatment impacts on stomatal conductance (gsw, mean ± standard error). DH (drought hardening) treatment measurements were on old leaves, eCO2 (elevated CO2) on new leaves, ABA (abscisic acid) on both leaf age groups. ABA leaf-age groups pooled in this graphic due to similar response. Asterisks indicate indicated significant difference of means (*: p < 0.05, **: p < 0.01, ***: p < 0.001) among treatment and control within each species for each day from individual t-tests (n = 7–10 for each treatment on each day). Species include Citharexylum berlandieri (CIBE), Erythrina herbacea (ERHE), Fraxinus berlandieriana (FRBE), and Malpighia glabra (MAGL). gsw, stomatal conductance.
Forests 15 01607 g003
Figure 4. Leaf osmolality response to each treatment within three species. Treatments are drought hardening (DH), elevated CO2 (eCO2), and control. Lettering indicates significant differences among treatment means within species (adjusted p < 0.05) from individual ANOVA and Tukey HSD tests (ns = no significant differences). Samples collected on 5 fully expanded leaves from 5 different plants (n = 5). Black circles represent outliers outside of 1.5 times interquartile range. Species include Citharexylum berlandieri (CIBE), Erythrina herbacea (ERHE), and Fraxinus berlandieriana (FRBE).
Forests 15 01607 g004
Figure 5. Fine root (<2 mm) morphology responses of nursery-grown seedlings for each species-treatment group (n = 5). Only DH (drought hardening) and eCO2 (elevated eCO2) treatments were evaluated. Lettering indicates significant differences among treatments within species (adjusted p < 0.05) from individual ANOVA and Tukey HSD tests (ns = no significant difference between treatments). Black circles represent outliers outside of 1.5 times interquartile range. Species include Celtis pallida (CEPA), Citharexylum berlandieri (CIBE), Erythrina herbacea (ERHE), Fraxinus berlandieriana (FRBE), and Malpighia glabra (MAGL).
Forests 15 01607 g005
Figure 6. Effects of eCO2 on newly developed leaf stomatal density by species. Asterisks indicate significant difference between treatment group means within each species (**: p <0.01, ANOVA; lack of asterisks indicates no significant difference) (n = 6–10). Black circles represent outliers outside of 1.5 times interquartile range. Species include Citharexylum berlandieri (CIBE), Erythrina herbacea (ERHE), Fraxinus berlandieriana (FRBE), and Malpighia glabra (MAGL).
Forests 15 01607 g006
Figure 7. Relative growth rates (height) during treatment period (Nursery, 4 weeks) and over 8 months post-planting for each species (Field). Treatments are abscisic acid (ABA), drought hardening (DH), elevated CO2 (eCO2), and control Lettering indicates significant differences among treatments within species (adjusted p < 0.05) from individual ANOVA and Tukey HSD tests (ns = no significant difference between treatment groups). Black circles represent outliers outside of 1.5 times interquartile range. Nursery n = 10, eCO2 CIBE not collected due to lost labels. Field n = 7–10. Species include Celtis pallida (CEPA), Citharexylum berlandieri (CIBE), Erythrina herbacea (ERHE), Fraxinus berlandieriana (FRBE), and Malpighia glabra (MAGL).
Forests 15 01607 g007
Figure 8. Field mortality at 6 months for each species-treatment group (n = 20) and results from multi-variate logistic regression. Treatments are abscisic acid (ABA), drought hardening (DH), elevated CO2 (eCO2), and control. Lettering indicates significant differences between treatments within each species; “ns” indicates no significant difference between treatments for particular species. Species include Celtis pallida (CEPA), Citharexylum berlandieri (CIBE), Erythrina herbacea (ERHE), Fraxinus berlandieriana (FRBE), and Malpighia glabra (MAGL).
Forests 15 01607 g008
Table 1. Durations, exposure, and target response variables for each treatment. ABA was applied twice to nursery plants due to interruption of data collection. Exposure is elapsed time seedlings experienced treatment conditions (eCO2 had non-continuous application). gsw: day zero and post-treatment stomatal conductance; Asat: light-saturated photosynthetic rate; E: transpiration; WUE: water use efficiency; NSCs: non-structural carbohydrates; osmleaf: leaf osmolality; SD: stomatal density; SRL: specific root length.
TreatmentDuration (n)Duration (f)Total Exposure (n)Total Exposure (f)Response Variables (n)Response Variables (f)
ABA (abscisic acid)Applied Dec. 13Applied Nov. 14NANAgsw, E, Asat, WUEmortality and growth
DR (drought hardening)Oct. 14–Nov. 29Oct. 14–Nov. 14NANAgsw, E, Asat, WUE, osmleaf, growth, SRLmortality and growth
eCO2
(elevated CO2)
Oct. 14–Nov. 29Oct. 14–Nov. 14747.3 h547.4 hgsw, E, Asat, WUE, osmleaf, growth, SRL, SD, NSCsmortality and growth
(f) refers to seedlings used in field outplanting. (n) refers to seedlings kept in nursery for physiological measurements.
Table 2. Summary of physiological and morphological responses to: abscisic acid (ABA), drought hardening (DH), elevated CO2 (eCO2), and control treatments. Results from ANOVA or Kruskal–Wallis tests are shown. Arrows indicate significant change with respect to controls (p < 0.05): upward arrow = increased, downward arrow = decreased. Non-significant results are noted with “ns”, and dashes (-) indicate no data collected. Species include Celtis pallida (CEPA), Citharexylum berlandieri (CIBE), Erythrina herbacea (ERHE), Fraxinus berlandieriana (FRBE), and Malpighia glabra (MAGL).
ResponseTreatmentCIBEERHEFRBEMAGLCEPA
gswDHnsnsns-
eCO2nsnsns-
ABA-
TDHnsnsns--
eCO2-nsns--
ABA--
AsatDHnsnsns--
eCO2-ns--
ABAns--
WUEDHnsnsns--
eCO2-nsns--
ABAnsnsns--
SDeCO2nsns-
osmleafDHns--
eCO2nsns--
SRL *DHnsnsnsnsns
eCO2nsnsnsnsns
RL *DHnsnsnsnsns
eCO2nsnsnsns
RGRnDHnsnsnsnsns
eCO2nsnsns
RGRfDHnsnsnsnsns
eCO2nsnsnsnsns
ABAnsnsnsnsns
MortalityDHnsnsnsns
eCO2nsnsnsnsns
ABAnsnsnsnsns
* Variables calculated for fine root length.
Disclaimer/Publisher’s Note: The statements, opinions and data contained in all publications are solely those of the individual author(s) and contributor(s) and not of MDPI and/or the editor(s). MDPI and/or the editor(s) disclaim responsibility for any injury to people or property resulting from any ideas, methods, instructions or products referred to in the content.

