Abstract
Climate change has significantly altered in the distribution of plant and animal species, potentially resulting in either species expansion or extinction. The genus Chimonanthus, an economically significant and endemic group in China, holds substantial medicinal and ornamental value; however, its wild resources are limited. There is a paucity of knowledge regarding the distribution characteristics of the genus Chimonanthus species and the critical ecological factors influencing habitat suitability. Utilizing species distribution data and environmental variables, we performed simulations and analyses to identify suitable habitats, evaluate the primary environmental factors influencing distribution, determine potential distribution areas and centroids, and predict changes in suitable areas under three future climate scenarios (SSP-126, SSP-245, SSP-585) employing MaxEnt and ArcGIS. These findings indicated that the Area Under Curve (AUC) values exceeded 0.97 for all five Chimonanthus species, suggesting that the model predictions are highly accurate. The primary environmental variables influencing the distribution of C. grammatus are temperature, particularly isothermality (BIO3), and the mean temperature of warmest quarter (BIO10). However, precipitation of warmest quarter (BIO18) was an important environmental factor limiting the distributions of C. praecox, C. nitens, C. salicifolius and C. zhejiangensis. In the current period, the area of habitat suitability for C. praecox is the largest, at 2,498,600 km2, while that for C. zhejiangensis is the smallest, at 700,400 km2. The five Chimonanthus species are distributed mainly in southern China under the current climate scenario and will migrate to higher latitudes under future climate scenarios. C. nitens had high niche overlap and range overlap with C. zhejiangensis and C. salicifolius, respectively. A similar situation occurs between C. zhejiangensis and C. salicifolius. These findings suggest that there may be strong interspecific competition among adjacent species. Our results indicate that the establishment of nature reserves at current distribution sites within optimal areas is crucial for the conservation of germplasm resources, particularly for C. grammatus and C. salicifolius. The data generated from this research can serve as a valuable reference for the selection of in situ conservation sites, the determination of appropriate planting locations, the scientific introduction of species, and the development of long-term conservation and management strategies for Chimonanthus.
1. Introduction
Chimonanthus Lindl. (1819) of Calycanthaceae is an endemic genus in China that consists of six species: C. grammatus M. C. Liu. (1984), C. nitens Oliv. (1887), C. praecox (L.) Link. (1822), C. salicifolius H. H. Hu. (1954), C. zhejiangensis M. C. Liu. (1984) and C. campanulatus R. H. Chang & C. S. Ding. (1980), with winter-blooming flowers widely cultivated as ornamental plants with high economic value, and several species of this genus are also utilized for their medicinal properties [1]. They represent one of the most ancient and valuable epibiotic species, with a history dating back to the Tertiary period [2], and C. praecox have been cultivated for nearly a thousand years, with almost 300 cultivars [3]. These species have even been introduced into East Asia, Europe, America, and Australia as ornamental plants [4]. However, the wild resources of Chimonanthus are exclusively distributed in China and possess significant medicinal value, exhibiting antibacterial, anticancer, anti-inflammatory, hypoglycemic, hypolipidemic, and other biological activities. These properties enable its use in the treatment of coughs, measles, burns, and heatstroke, among other conditions [5,6]. Additionally, essential oils can be extracted from the flowers, leaves, and stems of Chimonanthus for application in industries such as cosmetics and fragrances [7,8]. At present, except for C. praecox, which is cultivated in large quantities, the other species are mainly wild resources, and some of them are listed on the Red List of Endangered Species (IUCN), with C. grammatus at the EN level, which is distributed only in Anyuan County, Jiangxi Province, and C. salicifolius at the NT level. Although C. campanulatu is not listed on the Red List, there are fewer records of wild resources. Wild populations are important for germplasm collection and conservation [9]. Therefore, an investigation into the impacts of climate change and human activities on the spatial distribution of Chimonanthus could strengthen its management and conservation.
Climate change is one of the global threats to biodiversity [10,11,12], influencing the spatial distribution patterns of species [13,14,15], which results in the expansion or contraction of species’ range areas and may even heighten the risk of extinction [16,17,18,19]. For instance, tropical organisms are extending their ranges northward in response to global warming [20]. The honeybee, a crucial pollinating insect, has experienced an average decline of 46% in North America and 17% in Europe, concurrently shifting towards the poles [13,16]. These shifts are predominantly driven by changes in temperature and precipitation [21], with anthropogenic activities further exacerbating these trends [22]. The main driver of current and future climate change is anthropogenic increases in atmospheric greenhouse gas concentrations, which has been quantified for shared socioeconomic pathway (SSP) scenarios [23]. These data provide favorable conditions for studying the impacts of future climate change.
The effects of climate change on species distribution patterns have been investigated through two primary approaches. The first approach involves analyzing species migration patterns using long-term field observation experiments [13], which is time consuming. The second approach employs ecological niche models (ENMs), such as MaxEnt [24], GARP [25], and BIOCLIM [26], in conjunction with species distribution data and climatic data to predict potential range shifts. Ecological niche modeling represents a robust methodology for assessing the impacts of climatic and environmental changes on species habitat suitability [27,28]. Notably, the MaxEnt model is extensively employed in distribution prediction, particularly for endangered species, due to its high accuracy, user-friendliness, and capability to generate precise results even with limited data [11,29].
In this study, we analyzed the effects of climate change on the potential distribution areas of five Chimonanthus species. The aim of this study was to answer the following questions: (1) What are the main environmental factors influencing the distribution of Chimonanthus species? (2) How will the potential distribution area of Chimonanthus species be affected under future climate scenarios? and (3) Is there any niche convergence among different Chimonanthus species? These findings will improve our understanding of the adaptability of Chimonanthus species to varying habitat conditions and lay a theoretical foundation for the practical application of Chimonanthus in wild resource conservation and gardening.
2. Materials and Methods
2.1. Species Distribution Data
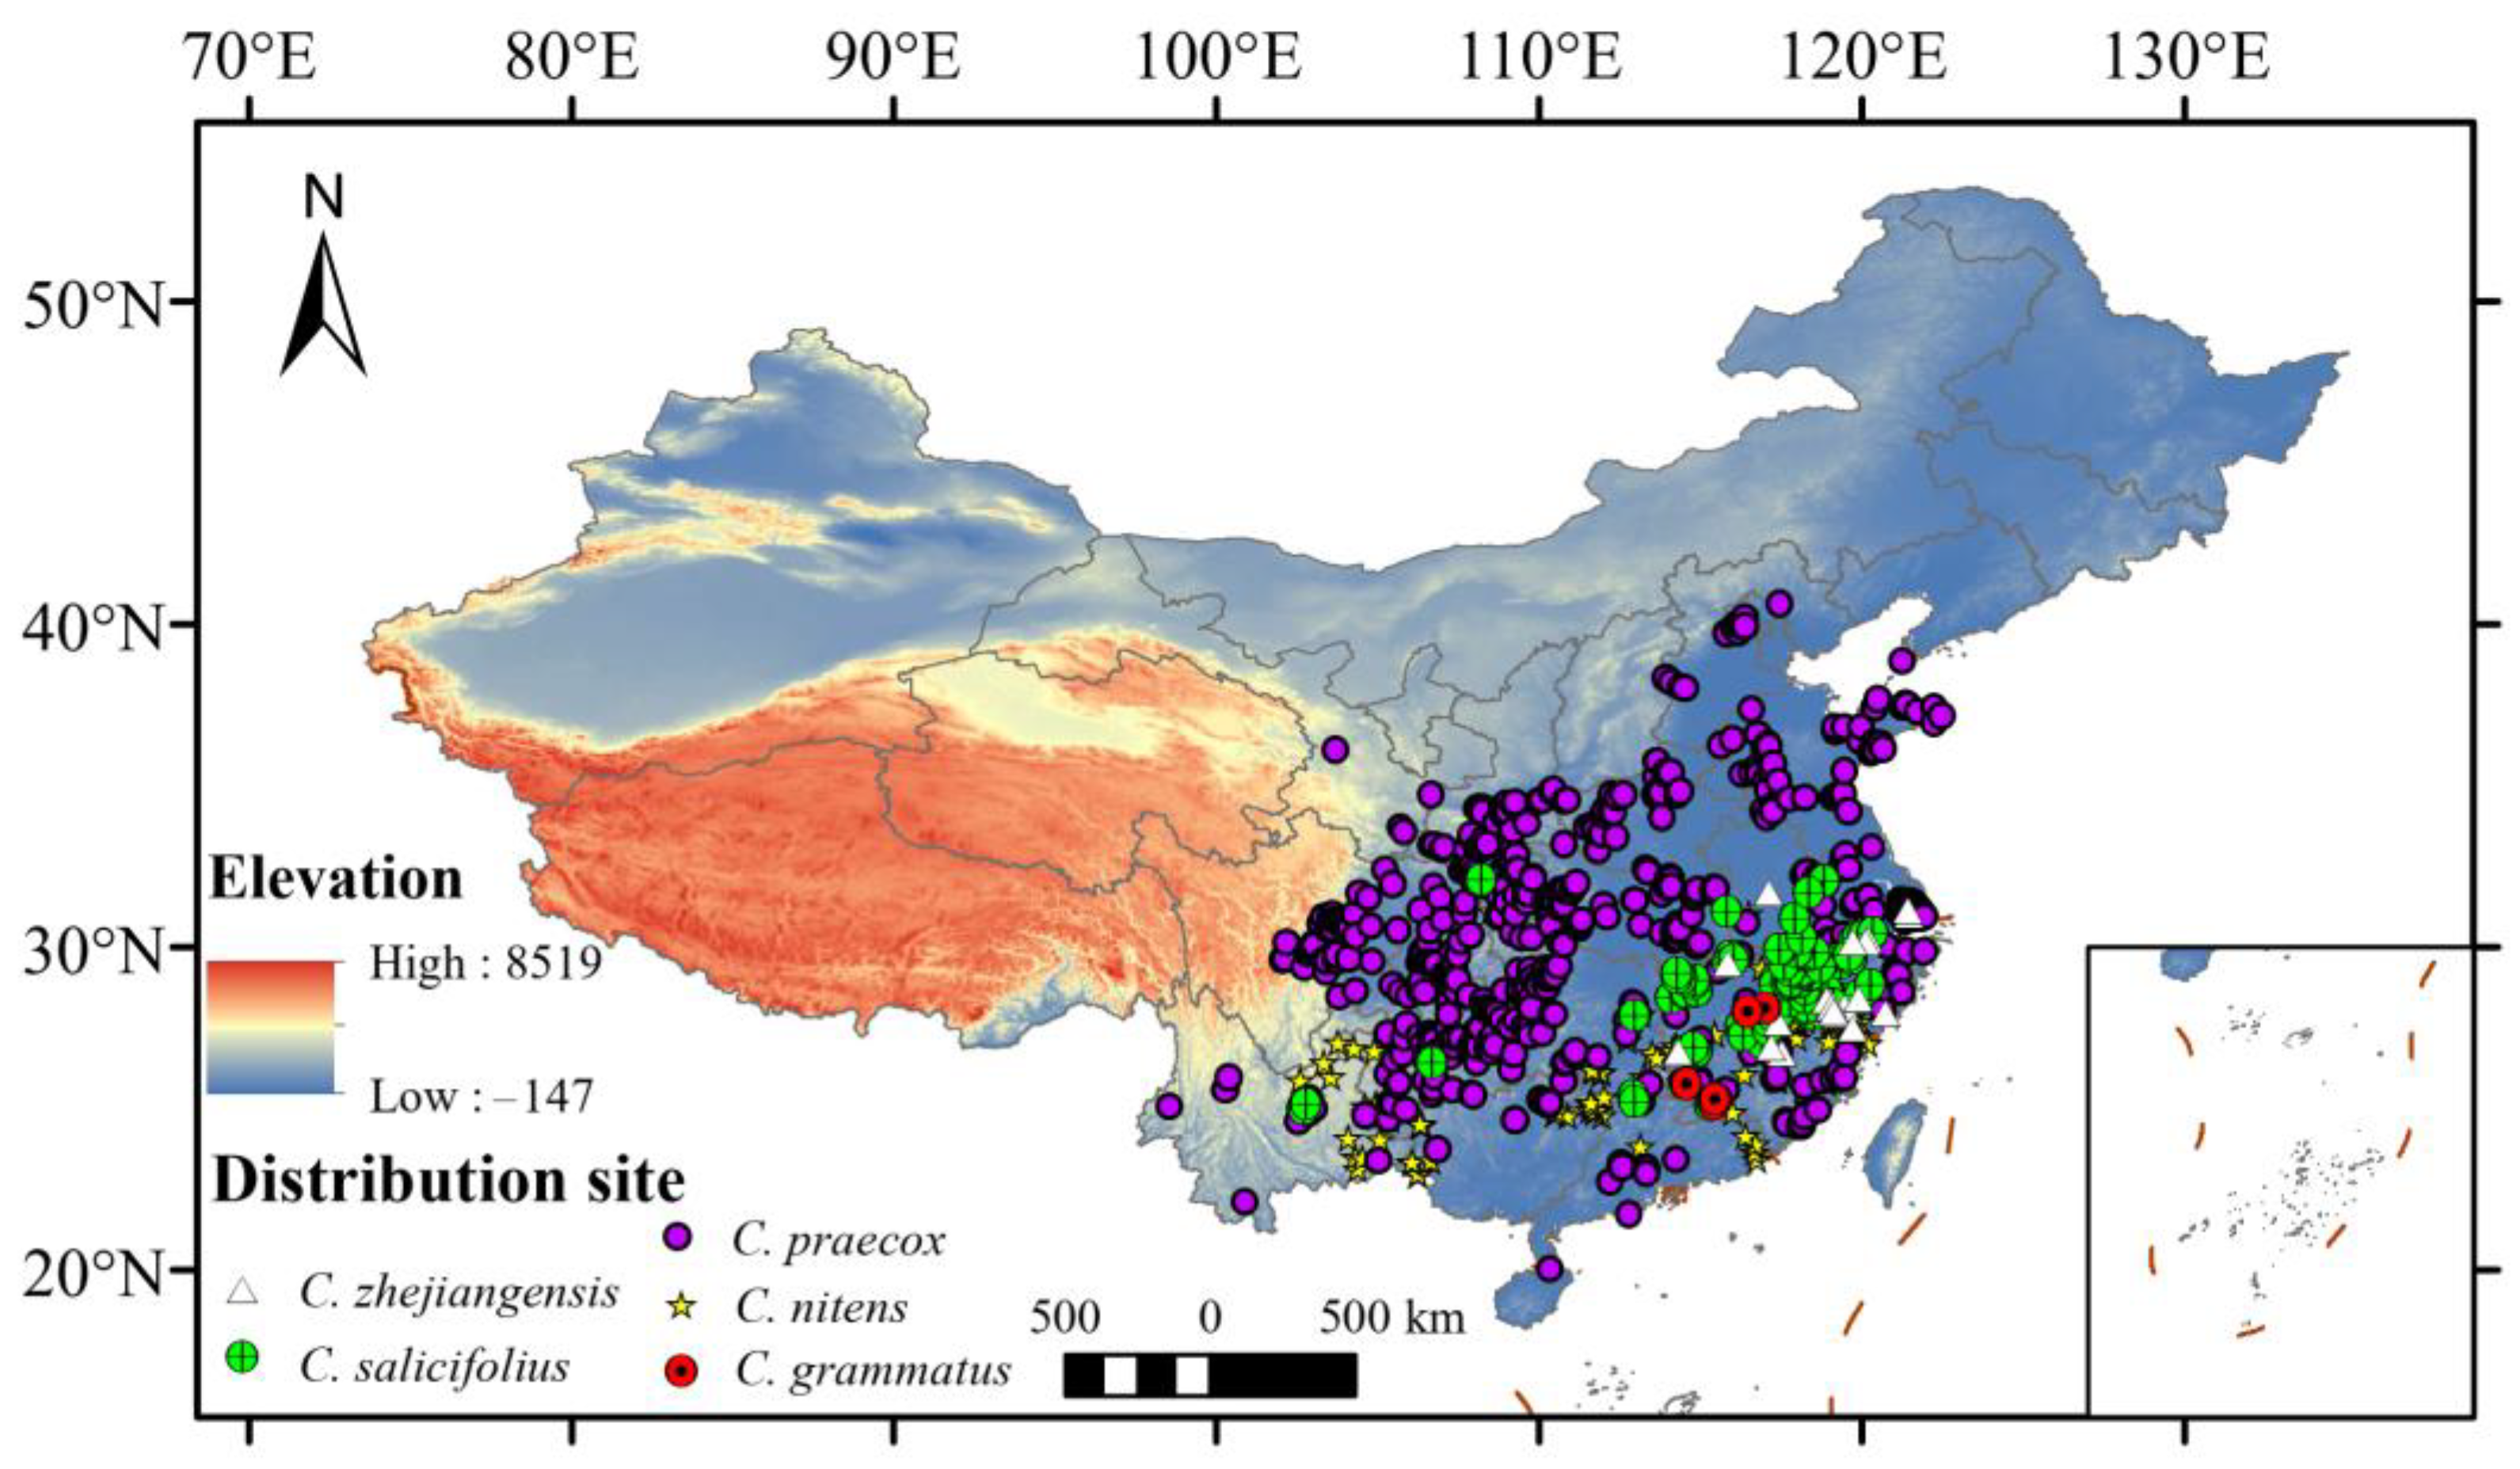
A total of six Chimonanthus species were collected and five species were used in this analysis (Figure 1) (C. campanulatu was excluded in this analysis, because it only had three records). Species occurrence records were obtained from the Global Biodiversity Information Facility database (GBIF: https://www.gbif.org/, accessed on 13 May 2023), the Chinese Virtual Herbarium database (CVH: https://www.cvh.ac.cn/, accessed on 13 May 2023), the National Specimen Information Infrastructure database (NSII: http://nsii.org.cn/2017/home.php, accessed on 13 May 2023), and our field surveys. To improve data accuracy and avoid overfitting, ENMTools was used to remove information such as duplicate or similarly distributed points (within 1 km) and no coordinate points [30].
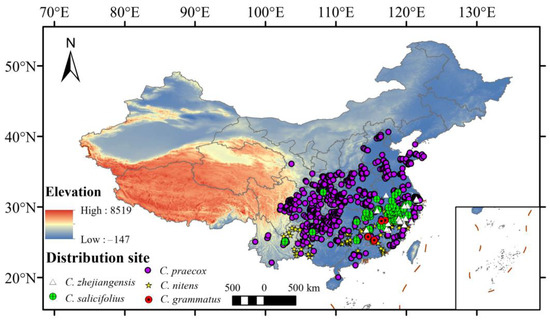
Figure 1.
The distribution records of Chimonanthus in China. (6 records of C. grammatus, 237 records of C. nitens, 730 records of C. praecox, 110 records of C. salicifolius, and 25 records of C. zhejiangensis).
2.2. Environmental Variables
Environmental variables were obtained from the World Climate Database (https://www.worldclim.org/, accessed on 23 April 2023), and 19 environmental climate factors (Table S1) related to the near-current climate and future climate (averages for 2041–2060, 2081–2100) were obtained at a spatial resolution of 2.5 arc-minute (approximately 5 km2) with CMIP6. The future climate data were selected from the Beijing Climate Center Climate System Model 2 Medium Resolution (BCC-CSM2-MR) with three shared socio-economic pathways (SSPs): SSP126 (increase 1.0–2.4 °C by 2100), SSP245 (increase 3.3–7.6 °C by 2100), and SSP585 (increase 1.7–3.8 °C by 2100) [31]. Elevated surface temperatures under the three future climate scenarios can be due to different greenhouse gas emissions [23]. The elevation, slope, and slope direction were obtained from digital elevation models (DEMs) with an accuracy of 25 m, which were obtained from the Computer Network Information Center of the Chinese Academy of Sciences (CAS) and the International Scientific Data Website (http://www.gscloud.cn/, accessed on 23 April 2023). Human active (HA) data, which means the global human influence index, were obtained from the Socioeconomic Data and Applications Center (SEDAC: http://sedac.ciesin.columbia.edu/wildareas/, accessed on 23 April 2023).
2.3. Ecological Niche Modeling
MaxEnt (Version 3.4.1) was used to model the potential distributional prediction of five Chimonanthus species under the current climate model for each of the 23 environmental variables. In this study, the knife-cut method (Do Jackknife) was utilized, and 25% of the distribution data as the test data and 75% as the training data were randomly selected, with the other parameters defaulted to confirm the importance of each environmental variable [32]. Receiver operating characteristic curves (ROCs) were calculated for all the environmental variables, and the model predictions were tested by applying the area under curve (AUC) [24], which has a value between 0 and 1, where the AUC is between 0.5 and 0.6 (poor), 0.6 and 0.7 (fair), 0.7 and 0.8 (good), 0.8 and 0.9 (very good), and 0.9 and 1.0 (excellent) [33].
2.4. Suitable Area Division
The MaxEnt model results were imported into ArcMapsoftware (Version 10.8) and the reclassification method in the software was used to divide suitable area. The maximum training sensitivity plus specificity (MTSS) was used as a standard for the delineation of suitable and unsuitable areas of a species because it represents the most conservative threshold for dividing suitable and unsuitable areas [27,34], which minimizes co-omission and omission errors. MTSS data were combined to divide the potential distribution area into three categories: unsuitable area (<MTSS), suitable area (MTSS-0.60), and highly suitable area (>0.60). Similar methods have also been used in previous studies [27,32,35]. Thereafter, we used the pixel points of the suitable area in ArcGIS (Version 10.8) to convert the area.
2.5. Distribution Centroid Analysis
The SDMtoolbox v 2.4 in ArcGIS was used to analyses the distribution centroid in the potential distribution area of the five Chimonanthus species between current and future climate change scenarios [18,32]. Subsequently, the distribution centroid coordinates of the suitable areas for each Chimonanthus species in ArcGIS were calculated. Additionally, the distribution centroid distances between each future period and current period were calculated and analyzed [32].
2.6. Niche Overlap and Range Overlap Analysis
ENMTools is a set of comparative similarity measures and statistical tests that permit quantitative comparison and can be used to measure niche overlap among species distributions [30,36]. To quantify the similarity of niches among the five Chimonanthus species, ENMTools v1.3 software was used to calculate the interspecific niche overlap and range overlap in the near current [30,37]. The degree of niche overlap is represented by Schoener’s D(D) [38] and Hellinger-based I(I) [37] and quantified by comparing habitat suitability estimates calculated using Maxent-generated ENMs for each grid cell in the study area [30]. The D and I values range from 0 to 1, with higher values indicating greater niche overlap. The range overlap values also range from 0 to 1, and most scores mean more range overlap.
3. Results
3.1. Model Performance and Important Environmental Variables
The model accuracy for Chimonanthus plants was assessed using receiver operating characteristic (ROC) curve analysis. The area under the curve (AUC) values for the predictive distribution models of the five Chimonanthus species, constructed by MaxEnt software, all exceeded 0.97 (Table 1), indicating high model accuracy and reliable prediction results. The main environmental variables constraining the presence of Chimonanthus were analyzed using the MaxEnt model (Figure 2), along with the values of each key environmental variable suitable for the presence of Chimonanthus (existence probability >0.5) (Table 1). Table 2 demonstrates that the principal environmental variables influencing the distribution of C. grmmatus are temperature, particularly isothermality (BIO3), and the mean temperature of warmest quarter (BIO10), which collectively accounted for 60.7% of the total variance explained by all analyzed variables. This result indicates that thermal conditions are more important than moisture conditions among the environmental variables constraining the geographic distribution of C. grmmatus. The precipitation of warmest quarter (BIO18) was an important environmental factor limiting the distribution of the other four Chimonanthus species, with 48% in C. nitens, 42.9% in C. praecox, 35.3% in C. salicifolius, and 29.9% in C. zhejiangensis. For these four species, humidity conditions were found to be more critical than thermal conditions in determining their geographic distribution. In addition, human activities also affected the geographical distributions of C. praecox (20.3%), C. nitens (10.1%), and C. zhejiangensis (8.7%).

Table 1.
Number of effective records, the AUC value of Chimonanthus, and the threshold for delineating suitable from unsuitable areas.
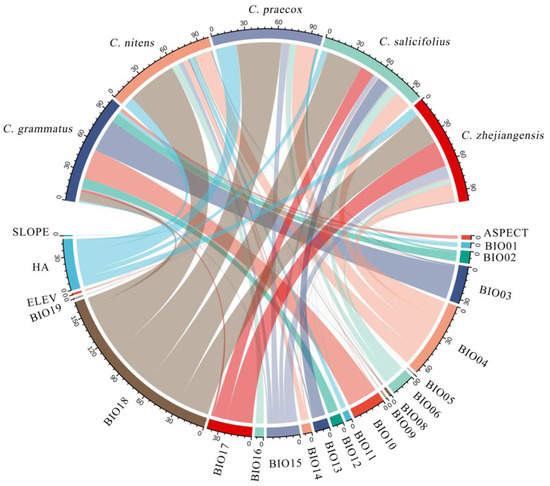
Figure 2.
Chord diagram of the cumulative contribution of dominant climatic factors in Chimonanthus.
Table 2.
The major environmental variables (Top 5) that determine the distribution of Chimonanthus.
3.2. Predictions of Potential Distributions under the Current Climate Scenario
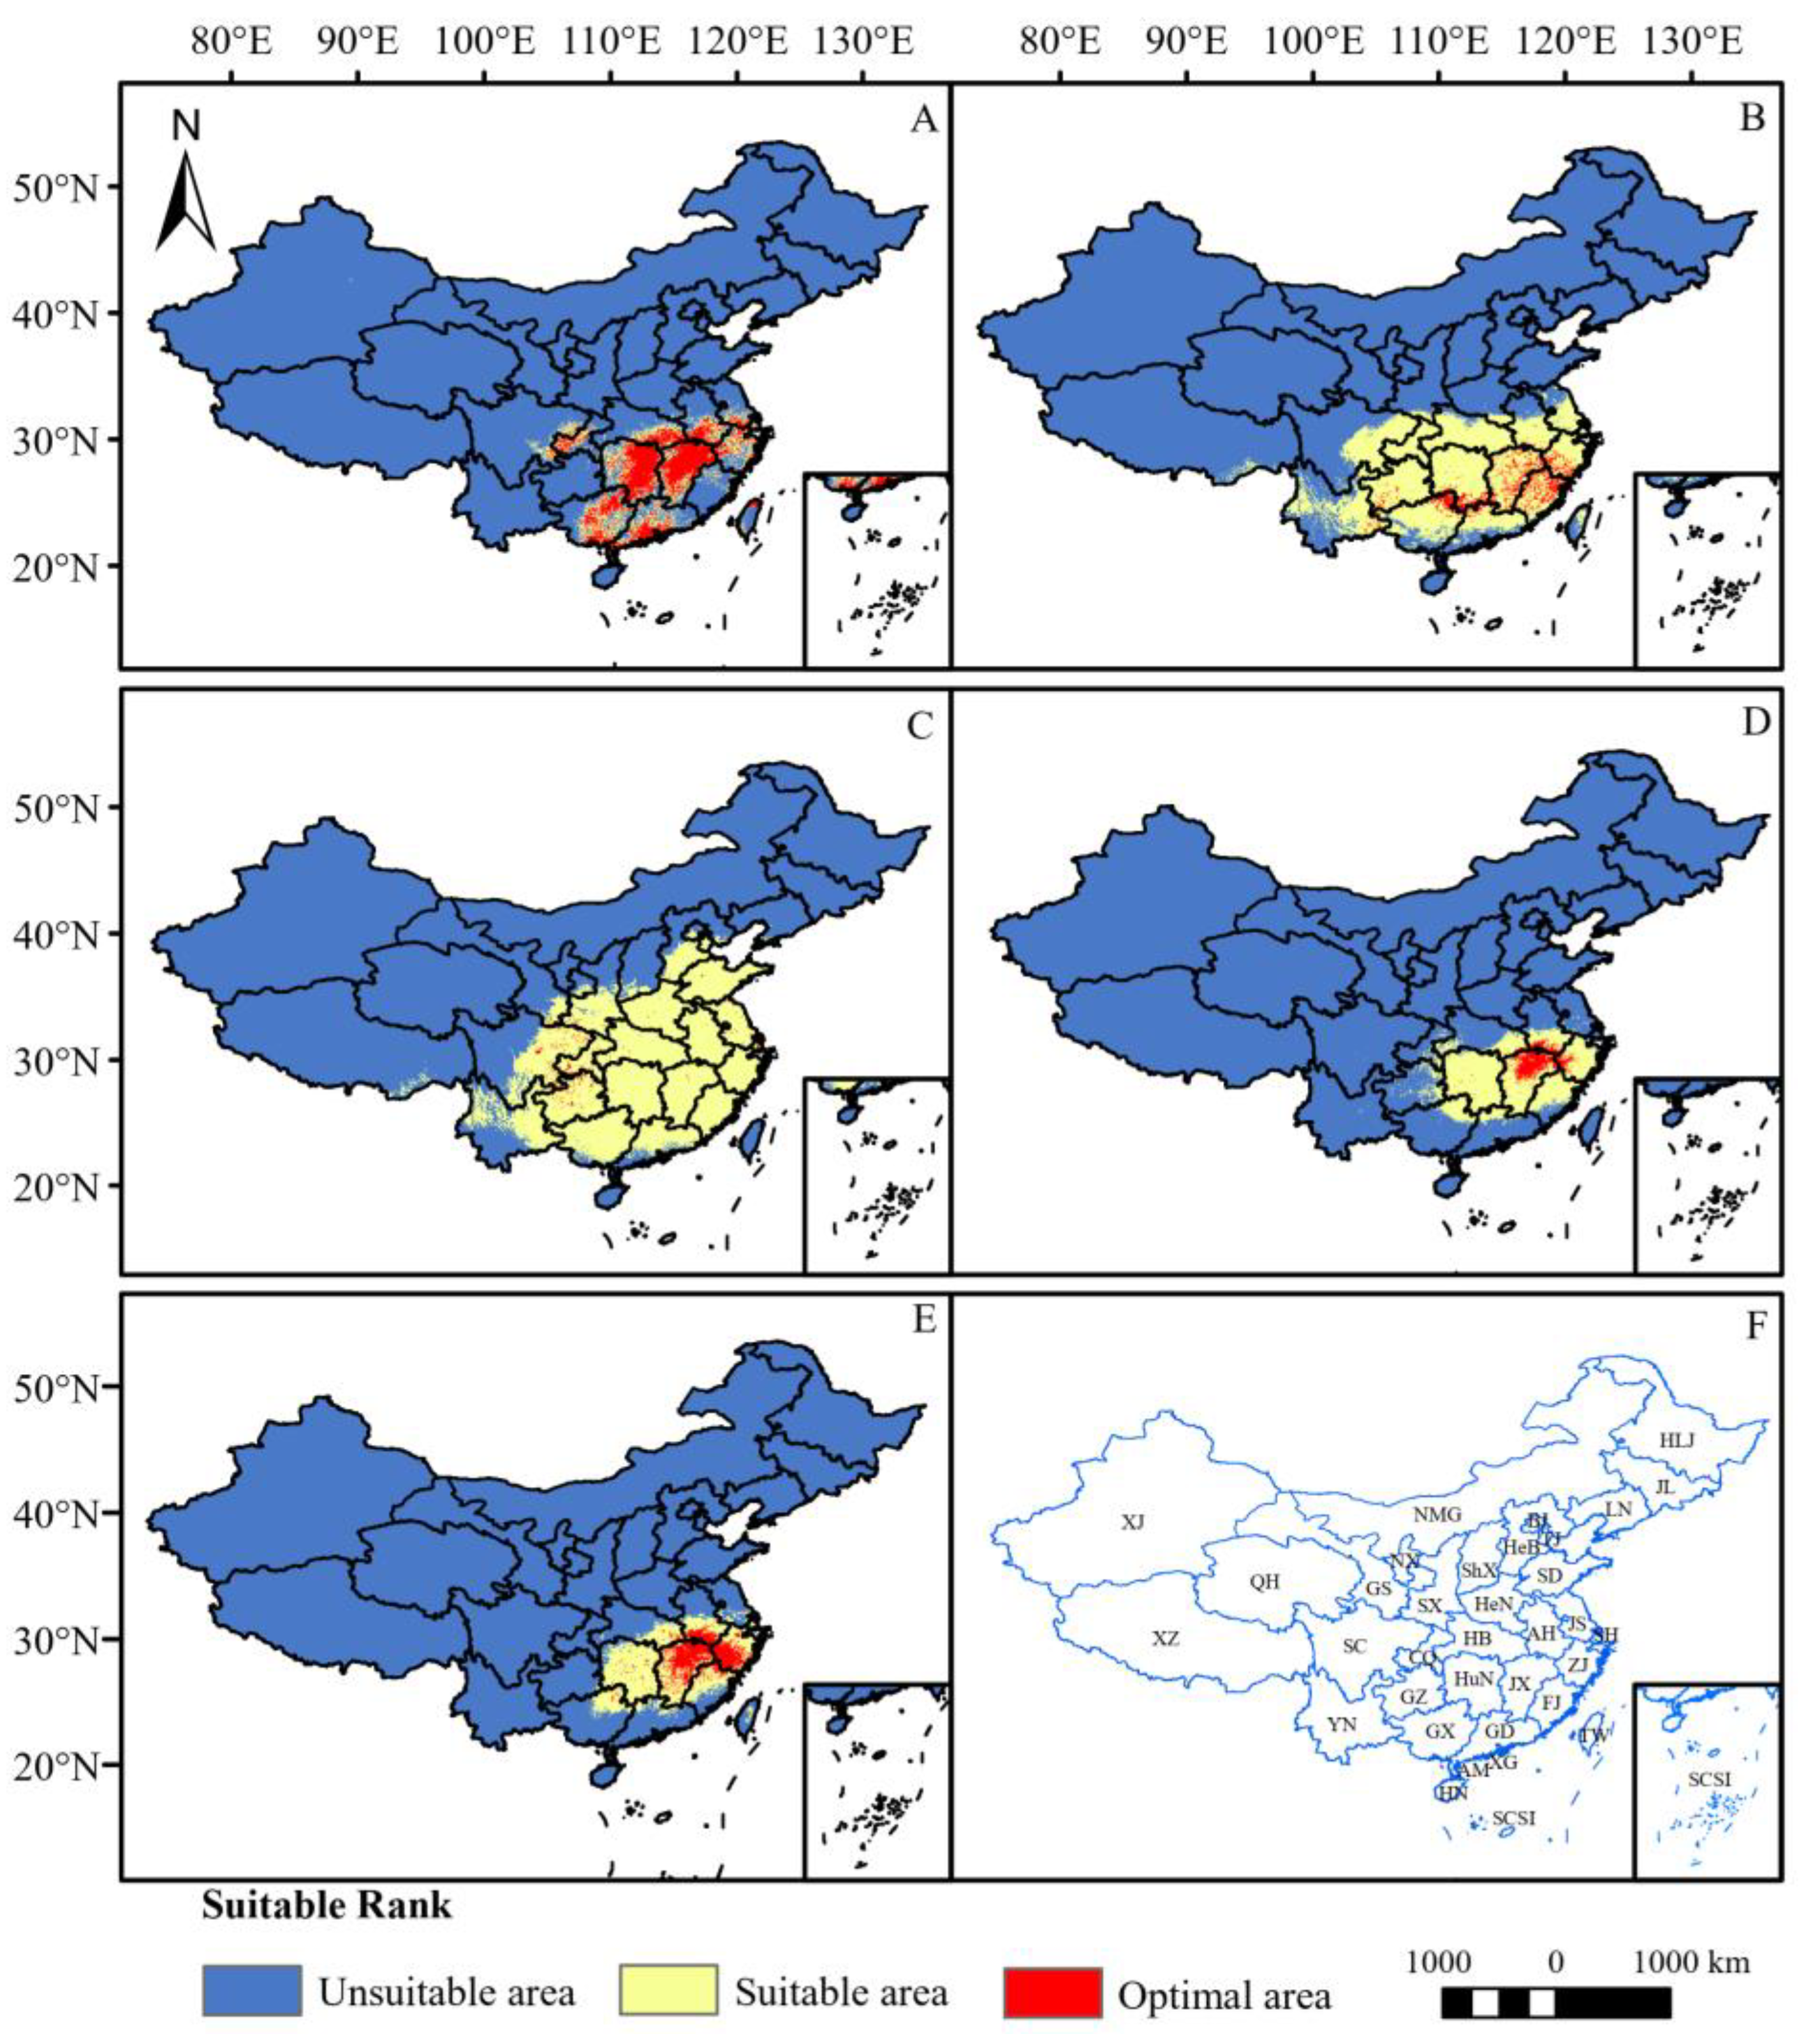
The potential distribution areas of the five Chimonanthus species are predominantly concentrated in the southern region of China under the current climate scenario (Figure 3). Among them, C. praecox has the largest habitat suitability area of 2,498,600 km2 (Table 3), which is found in all provinces in China except Jilin, Heilongjiang, Nei Mongol, Xinjiang, Qinghai, and Hainan provinces. Nevertheless, its optimal area is limited and sporadically distributed within the temperate zone (Figure 3C). It is followed by C. nitens, with a habitat suitability area of 1,705,100 km2 (Table 3), which is distributed mainly south of the Yellow River, while the optimal area is concentrated mainly in Fujian, Jiangxi, southwest Zhejiang and the junction of Guangxi, Guangdong, and Hunan Provinces (Figure 3B). The habitat suitability area of C. grammatus is 786,800 km2 (Table 3), and it is distributed mainly in Hunan, Jiangxi, Guangxi, Guangdong, and Zhejiang Provinces, southeastern Hubei, southwestern Anhui, northern Taiwan Provinces, and the border between Sichuan Province and Chongqing city (Figure 3A), of which the optimal area is the largest among these five species, reaching 418,500 km2. C. salicifolius has a habitat suitability area of 746,100 km2 (Table 3), which is mainly concentrated in central and southern China. The optimal area is distributed only in the northern part of Jiangxi Province and the border area of Jiangxi, Anhui, and Zhejiang Provinces (Figure 3D). C. zhejiangensis has the smallest habitat suitability area of 700,400 km2 (Table 3), which is distributed mainly in central and south China, with the optimal area distributed mainly in Jiangxi, southwest Zhejiang, southern Anhui, and northern Fujian Provinces, with sporadic distributions in Hunan, Hubei, and Guangxi Provinces (Figure 3E).

Figure 3.
Potential distribution areas of five Chimonanthus species under current climate scenario. ((A): C. grammatus; (B): C. nitens; (C): C. praecox; (D): C. salicifolius; (E): C. zhejiangensis; (F): Distribution of administrative regions in China (XJ: Xinjiang Uygur Autonomous Region; XZ: Tibet Autonomous Region; QH: Qinghai Province; SC: Sichuan Province; YN: Yunnan Province; GS: Gansu Province; NMG: Nei Monggol Autonomous Region; NX: Ningxia Hui Autonomous Region; SX: Shaanxi Province; CQ: Chongqing municipality; GZ: Guizhou Province; GX: Guangxi Zhuang Autonomous Region; HN: Hainan Province; ShX: Shanxi Province; HeN: Henan Province; HB: Hubei Province; HuN: Hunan Province; GD: Guangdong Province; XG: Hong Kong Special Administrative Region; AM: Macao Special Administrative Region; AH: Anhui Province; JX: Jiangxi Province; HLJ: Heilongjiang Province; JL: Jilin Province; LN: Liaoning PRovince; BJ: Beijing; TJ: Tianjin; HeB: Hebei Province; SD: Shandong Province; JS: Jiangsu Province; SH: Shanghai; ZJ: Zhejiang Province; FJ: Fujian Province; TW: Taiwan; SCSI: South China See Island), the distribution of regions also applies to the other illustrations).
Table 3.
Potential distribution area and range changes (104 km2) of five Chimonanthus species from the near-current period (1970–2000) to future period (2081–2100) under three climate scenarios (SSP126, SSP245, and SSP585).
3.3. Range Changes in Chimonanthus under Future Climate Change
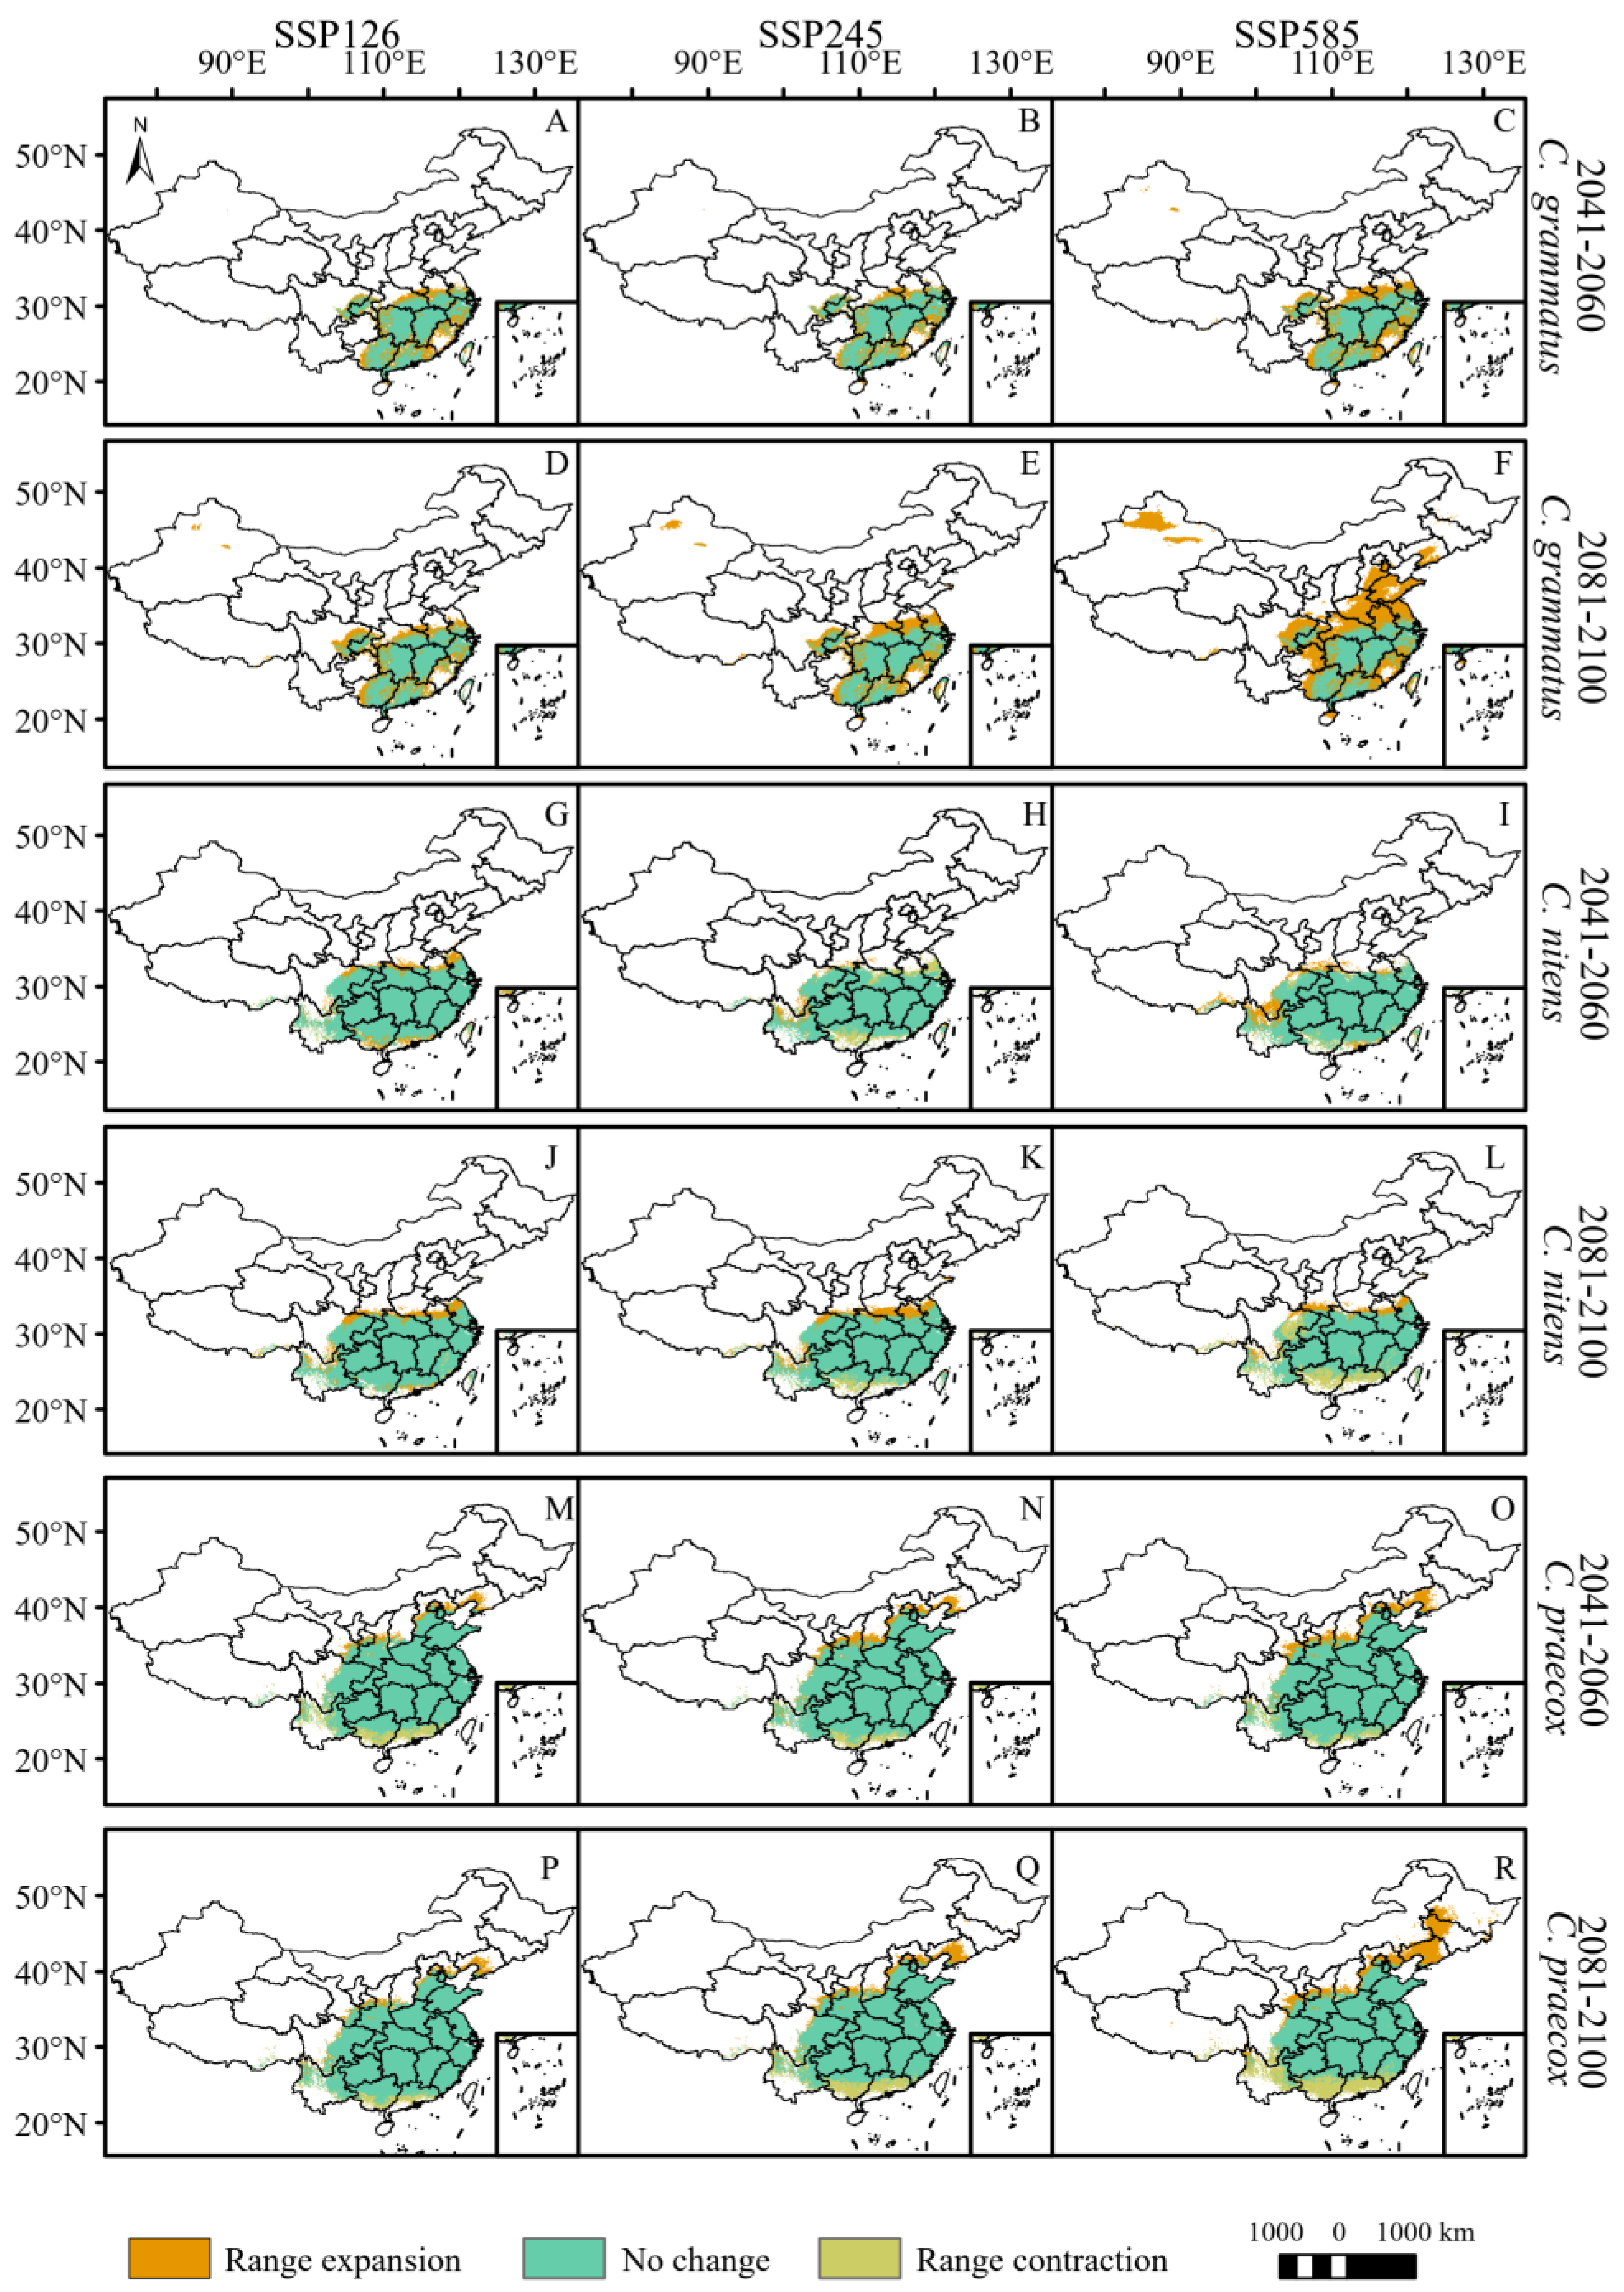
By 2060, the total potential distribution areas of C. grammatus and C. salicifolius will expand under the three climate scenarios (Figure 3 and Figure 4, Table 3). C. grammatus will expand mainly around existing distribution areas. A suitable area for the Xinjiang Uygur Autonomous Region also emerged under the SSP585 scenario (Figure 4A–C). C. salicifolius will expand northward (mainly high latitudes), while SSP126 will expand southwestward (Figure 5A–C). The total potential distribution areas of C. nitens and C. praecox will decrease under the SSP245 and SSP126 climate scenarios, respectively, and increase under the other climate scenarios (Figure 4, Table 3), and their potentially suitable areas will expand mainly to high latitudes but contract in low latitudes (Figure 4G,H,M–O). C. zhejiangensis will contract the potentially suitable areas under the SSP245 and SSP126 climate scenarios, and the lost potential habitat area will be mainly concentrated at low latitudes. However, the potential suitable areas for C. zhejiangensis will expand under the SSP585 climate scenario and expand mainly to high latitudes (Figure 5G–I, Table 3).
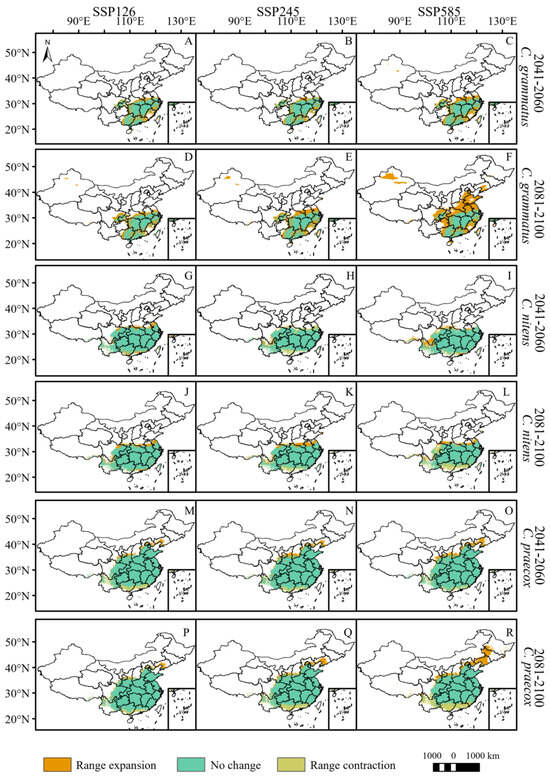
Figure 4.
Potential range changes of C. grammatus, C. nitens, and C. praecox from near-current period (1970–2000) to future period (2081–2100) under three scenarios (SSP126, SSP245, and SSP585). ((A–F): C. grammatus; (G–L): C. nitens; (M–R): C. praecox).
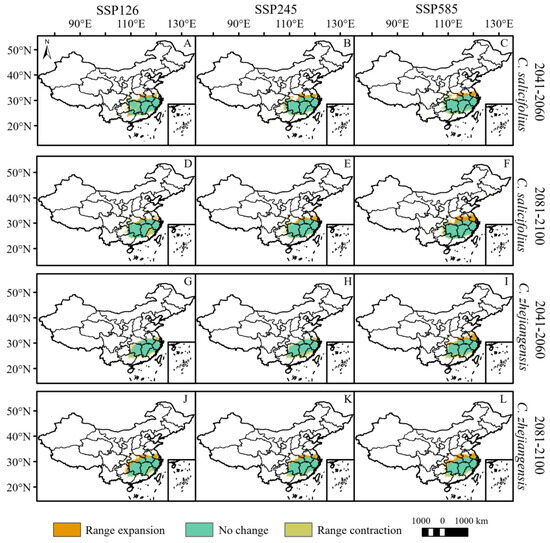
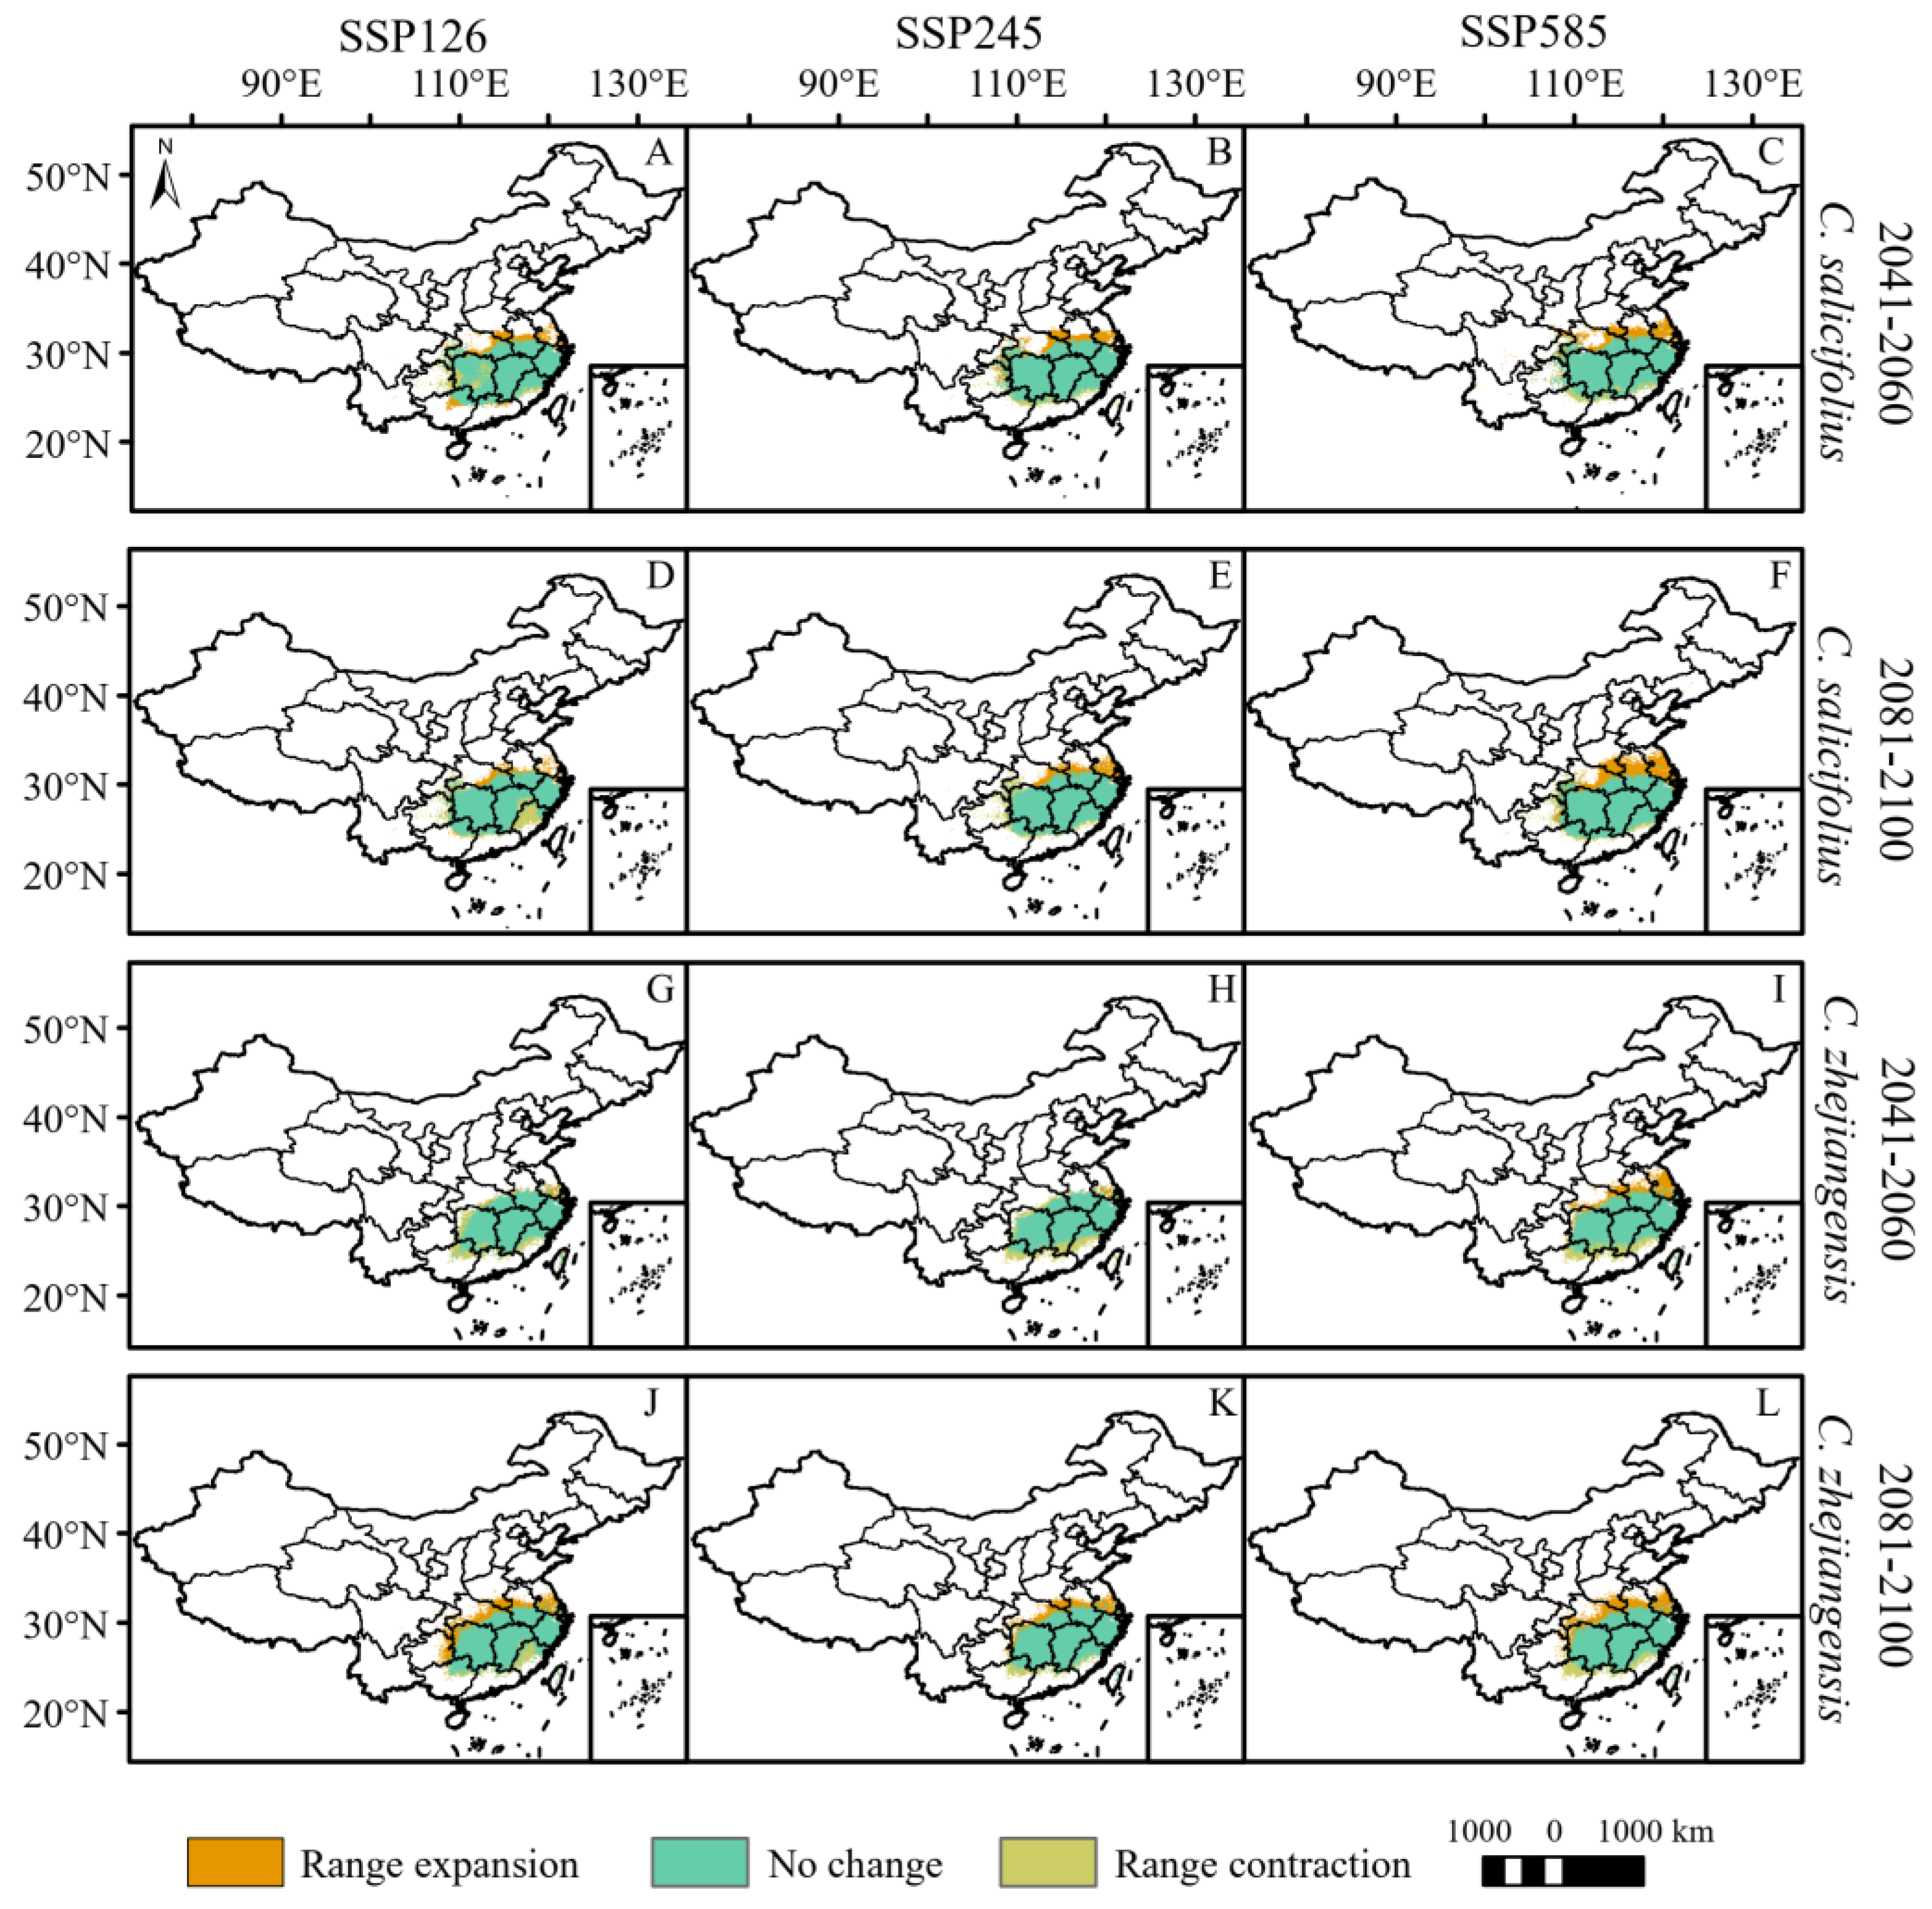
Figure 5.
Potential range changes of C. salicifolius and C. zhejiangensis from near-current period (1970–2000) to future period (2081–2100) under three scenarios (SSP126, SSP245 and SSP585). ((A–F): C. salicifolius; (G–L): C. zhejiangensis).
By 2100, the total potentially suitable areas for C. grammatus, C. salicifolius and C. zhejiangensis will expand under different climate scenarios (Figure 4 and Figure 5, Table 3). C. grammatus will expand mainly to high-latitude areas, especially North China, while the potential distribution area of Xinjiang Uygur Autonomous Region will also gradually expand (Figure 4D–F). C. salicifolius and C. zhejiangensis will expand mainly to high latitudes (Figure 5D–F,J–L). The total potentially suitable areas for C. nitens and C. praecox will contract under the SSP-585 and SSP-245 climate scenarios, respectively, whereas they will expand under the remaining climate scenarios (Figure 4, Table 3). C. nitens and C. praecox will expand to the high latitude region under the three climate scenarios, whereas C. praecox will expand to the northeast region under the SSP585 scenario and the potential distribution area will contract at low latitudes under both the SSP245 and SSP585 climate scenarios (Figure 4J–L,P–R).
3.4. Migration of the Distribution Centroid in the Potential Distribution Area of Chimonanthus under Different Climate Change Scenarios
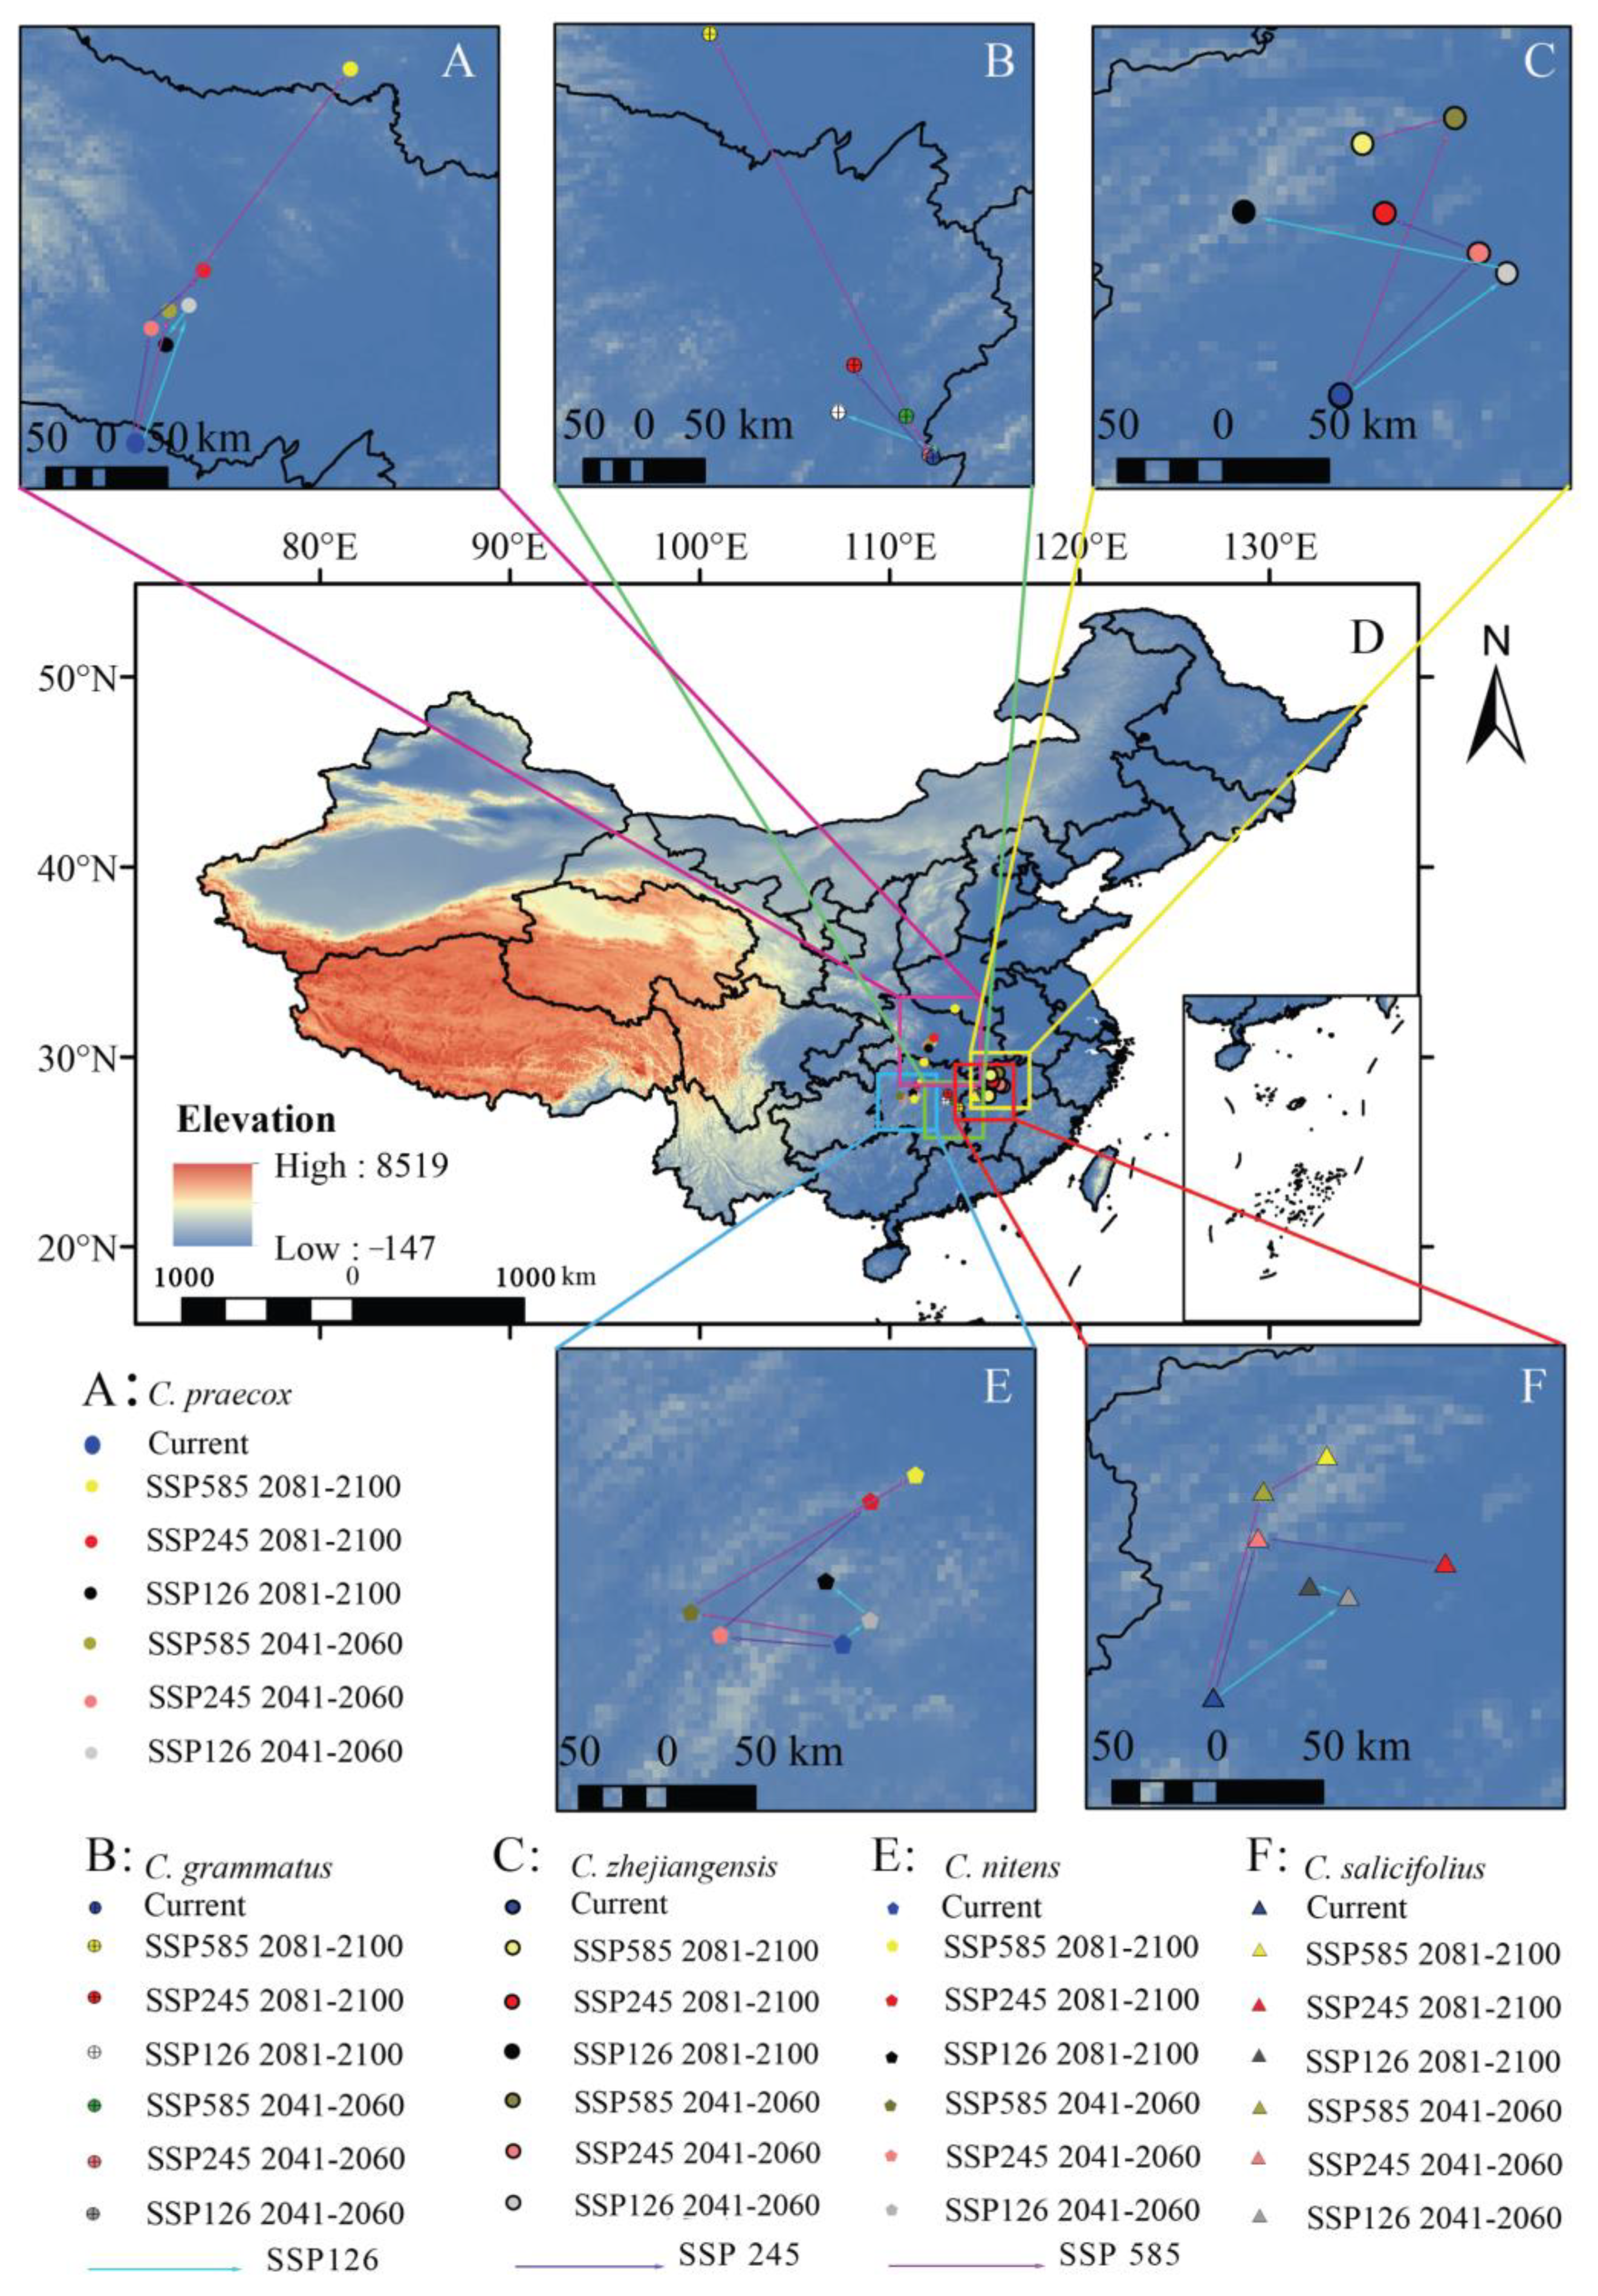
We found that the potential distribution centroids of the five Chimonanthus species migrated to higher latitudes to different degrees under the three future climate scenarios (Figure 6, Table S2). Under the current climate scenario, the distribution centroid of C. praecox is located in northern Hunan Province, and it will move to the northeast by 0.86–2.79° in future periods, and the northernmost point is located in southern Hubei Province, which is 342.59 km away from the current distribution centroid (Figure 6A). The distribution centroid of C. grsammatus is located in central Jiangxi Province and will shift to the northwest in the future. The maximum migration to high latitudes is 3.15°, and the northernmost distribution centroid will shift to southern Hubei Province, which is 103.56 km away from the current centroid (Figure 6B). C. zhejiangensis is currently located northwest of Jiangxi Province and will migrate to higher latitudes under the three future climate scenarios, with a migration range of 0.53–1.18°. The northernmost point of the distribution centroid will reach 141.70 km from the current position (Figure 6C). C. nitens is located in the center Hunan Province and will migrate to the northwest overall from 2041 to 2060 and to the northeast from 2081 to 2100. The distribution centroid will migrate 0.04–0.86° to higher latitudes (Figure 6E). C. salicifolius is currently located in the central–western region of Jiangxi Province under the current climate conditions. In the context of the three future climate scenarios, the distribution centroid is projected to shift northwards by 0.43–1.03°, which is approximately 124.46 km away from its current location (Figure 6F).

Figure 6.
Distribution centroid of Chimonanthus under different climate change scenarios. ((A): C. praecox; (B): C. grammatus; (C): C. zhejiangensis; (D): Distribution centroid of five species in China; (E): C. nitens; (F): C. salicifolius).
3.5. Niche Comparisons
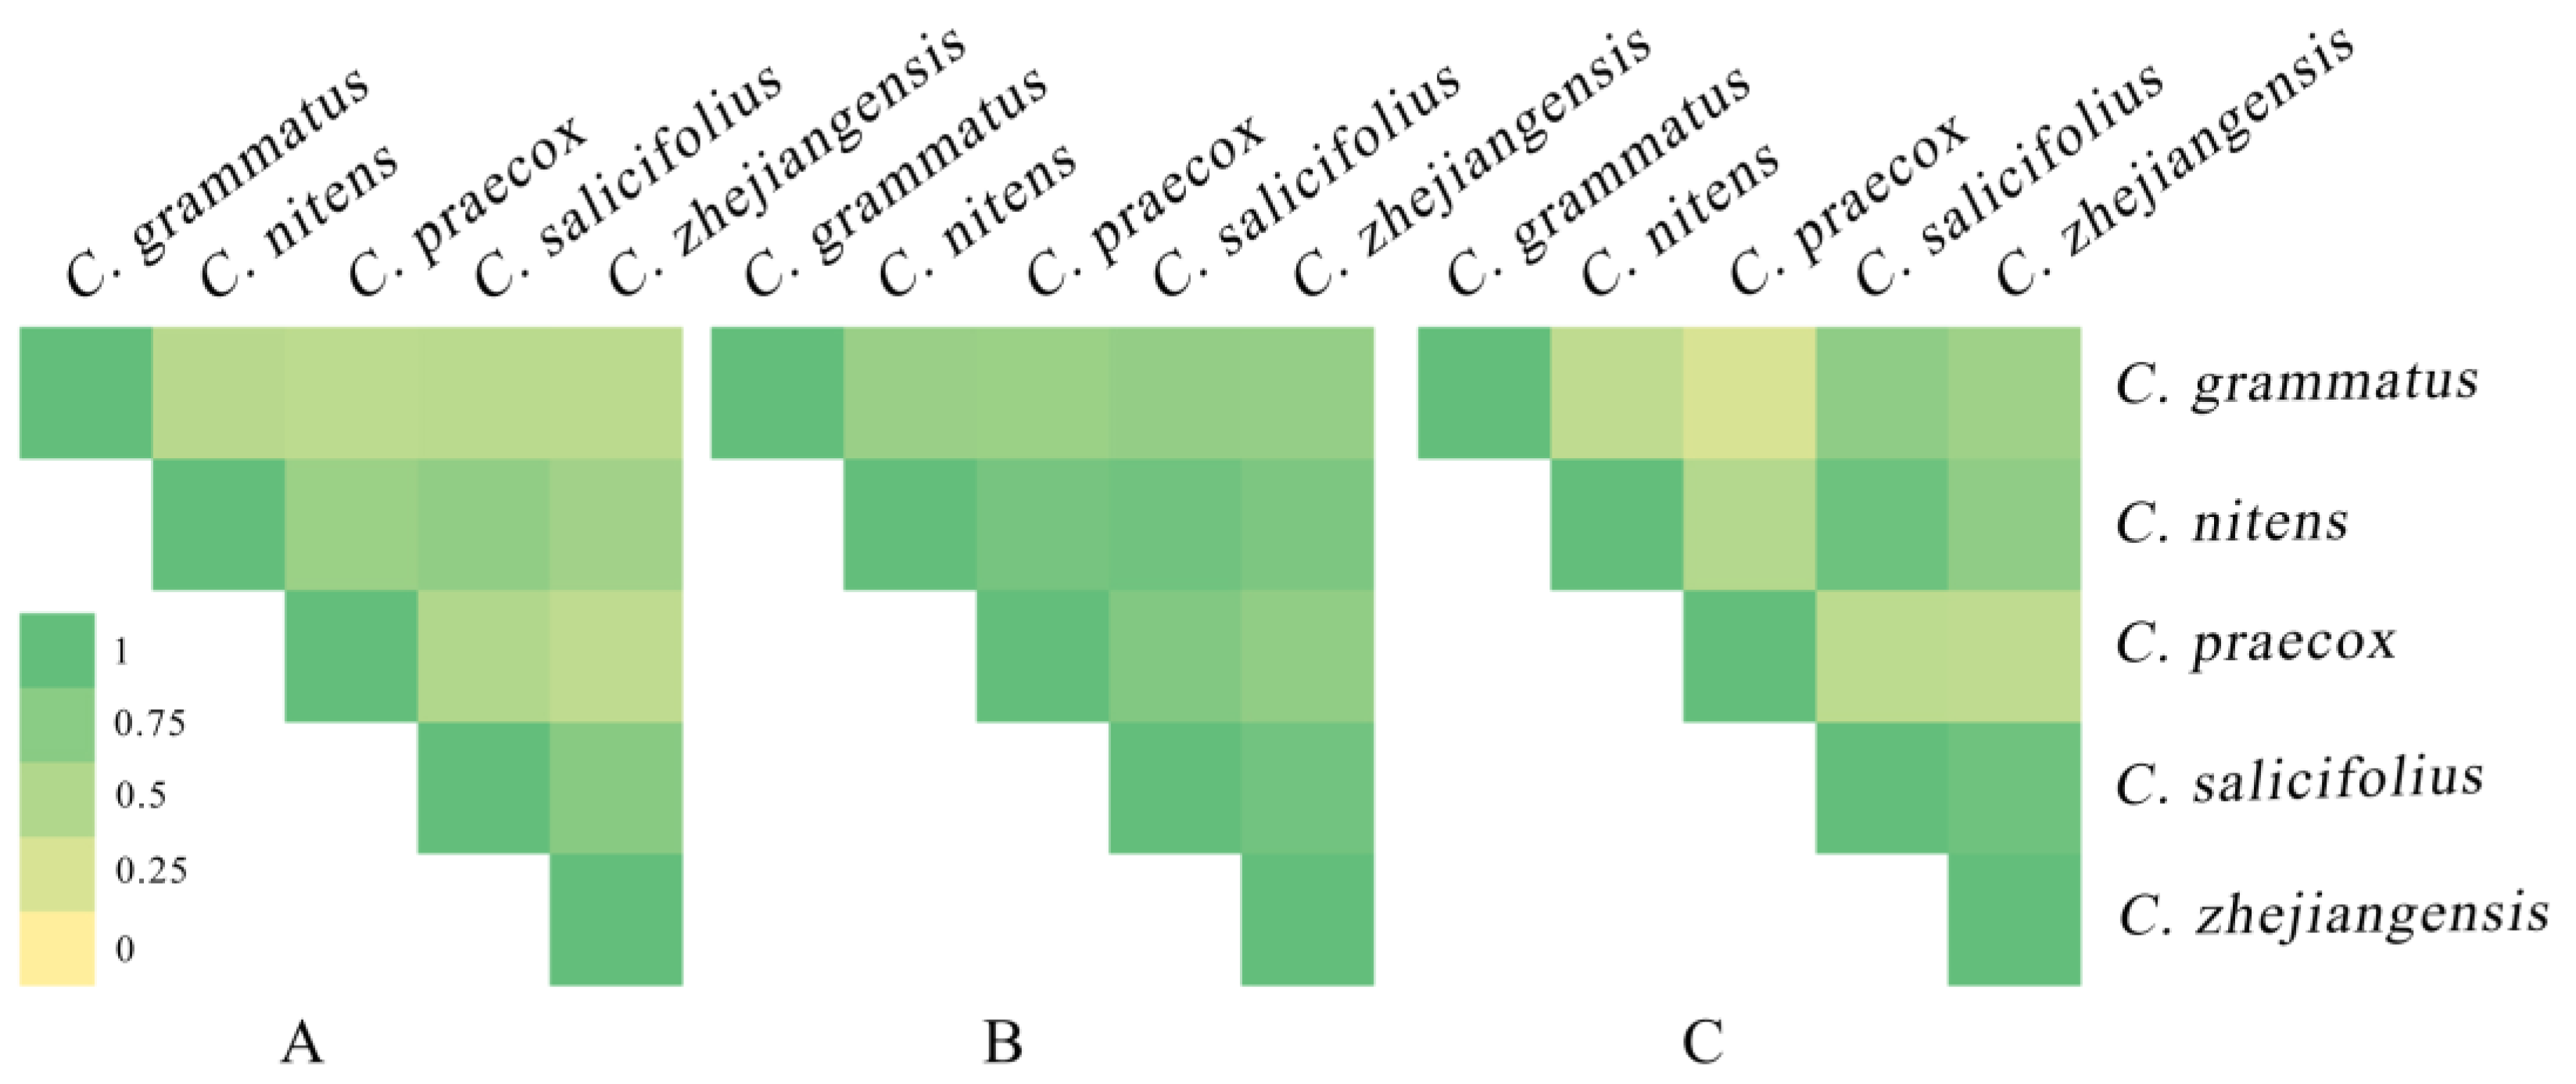
The ENMTools software was used to analyze the niche overlap and range overlap of five Chimonanthus species under the current climate scenario (Figure 7) and revealed that C. nicens with C. praecox (D:0.65, I:0.88), C. zhejiangensis (D:0.70, I:0.92), and C. salicifolius (D:0.60, I:0.84) presented high niche overlap, respectively. C. zhejiangensis and C. Salicifolius (D:0.76, I:0.91) also presented a high niche overlap. C. nitens had a high degree of range overlap with C. salicifolius (0.94) and C. zhejiangensis (0.72), respectively. C. grammatus and C. salicifolius (0.72) and C. zhejiangensis (0.62) presented a high range overlap, respectively. C. salicifolius and C. zhejiangensis (0.93) also had a high range overlap.
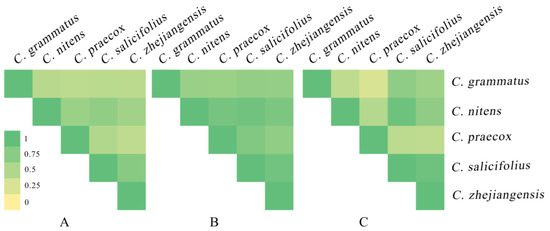
Figure 7.
Niche overlap and range overlap among Chimonanthus species at near-current period. ((A): D of Chimonanthus species; (B): I of Chimonanthus species; (C): range overlap of Chimonanthus species).
4. Discussion
Environmental factors usually affect the spatial distribution of species through the comprehensive action of multiple factors [27,39]. We analyzed the effects of environmental factors on the spatial distribution of the genus Chimonanthus in the current period and found that both temperature and precipitation could limit its distribution. Temperature conditions have a greater influence than precipitation does on C. grammatus, especially isothermality (BIO03) and the mean temperature of warmest quarter (BIO10), whereas annual precipitation (BIO12) and precipitation of wettest month (BIO18) are the main precipitation factors. The wild population of C. grammatus is distributed mainly in Jiangxi Province, which has a subtropical monsoon climate with warm winters and warm summers. The strong isothermality ensures that C. grammatus makes better use of daytime temperatures for photosynthesis throughout its life history, whereas the low temperature at night reduces the consumption of respiration and promotes the accumulation of nutrients, which is conducive to population reproduction [39,40]. However, the spatial distributions of the other four Chimonanthus species were more responsive to precipitation conditions, especially the precipitation in the wettest month (BIO18). Previous studies have shown that plants can use water conditions to control their growth, and most Chimonanthus species grow in wetter areas; water conditions are among the key factors regulating plant growth [39,41]. Moreover, the four Chimonanthus species strongly respond to temperature seasonality (BIO04), because temperature is the main environmental factor affecting plant growth and development [42]. By analyzing the main environmental factors affecting the distributions of these five Chimonanthus species, we speculate that the main environmental factors affecting the distribution of C. campanulatus may be isothermality (BIO03), temperature seasonality (BIO04), the mean temperature of warmest quarter (BIO10), annual precipitation (BIO12), and precipitation of wettest month (BIO18). In addition, we found that human activities (global human influence index) also interfered with the spatial distribution of Chimonanthus species, especially in C. praecox (20.3%), C. nitens (10.1%), and C. zhejiangensis (8.7%), but topographic factors had little effect.
The MaxEnt model was used to predict the potential distribution areas of the Chimonanthus species in the current period, and it was found that the Chimonanthus species were distributed mainly in southern China (Figure 3), with a large overlap with the actual distribution area (Figure 1) [41]. Under future climate scenarios, the potential distribution area of C. grmmatus will expand around the potential distribution area during the current period, and most of the distribution area will expand to the high latitudes, with little contraction area (Figure 5A–F), indicating that future climate change is conducive to the survival of C. grammatus. C. praecox, C. zhejiangensis, C. nitens, and C. salicifolius. The potential distribution areas of five Chimonanthus species were expanded mainly to higher latitudes, while the low-latitude suitable regions were contracted (Figure 5 and Figure 6). The contraction of the latter may have been caused by climatic heterogeneity, which resulted in increased environmental pressure and ultimately led to the regional extinction of the species [43,44]. The different responses of Chimonanthus species to climate change also suggest that large plant populations may disintegrate in the future, which could affect the function and structure of the large plant assemblages they form. A similar result was also reported in the case of fir Ottelia species [27]. However, southern China, characterized by a predominance of hilly and mountainous areas, exhibits a more complex climate, and many places are prone to the formation of microclimates due to differences in topography. The impact of climate change on these microclimates is substantial, with the potential to disrupt the survival of small shrubs in the undergrowth [45,46].
Previous studies have shown that relict plants possess strong adaptability, due to long-term evolutionary processes, to cope with the threat of climate change [47]. Our results indicated that the total suitable area of C. nitens and C. praecox could be contracted slightly under the SSP245 and SSP126 climate scenarios, respectively, while C. zhejiangensis could be contracted under both SSP126 and SSP245 climate scenarios by 2060, which may be influenced by local microclimatic variations in temperature and precipitation. Moreover, the total suitable habitat area for the majority of Chimonanthus species is anticipated to expand by the year 2100, with only a slight reduction predicted for C. nitens (SSP585) and C. praecox (SSP245). The predicted results indicated that the suitable area of populations will remain stable overall under future climate models, suggesting that Chimonanthus species exhibit a robust adaptability to climate change. The distribution centroid of the five Chimonanthus species migrated to higher latitudes under future climate scenarios, while the contribution of the altitude factor (ELEV) was minor (Figure 3), indicating that future climate change would drive the species to migrate to higher latitudes rather than higher elevations. Based on our results, we proposed that the major drive forces leading Chimonanthus species to the higher latitudes would be the precipitation of the wettest month and temperature seasonality. Similar conclusions have been reached for Chinese landscape plants [48]. As global temperatures continue to rise, the northward shift of the snow line, accompanied by changes in precipitation patterns, will result in a tendency for many plants to migrate to higher latitudes and elevations [13,18,32].
Climate change induces shifts in the thermal niches of species toward higher altitudes or polar regions [49], potentially resulting in the overlap of niches among closely related species [50]. Our findings indicated that C. nitens exhibits significant niche and range overlap with C. zhejiangensis and C. salicifolius, respectively. Additionally, there is considerable niche and range overlap between C. semicifolius and C. zjiangensis. Furthermore, C. nitens and C. praecox demonstrate high niche overlap, while C. grammatus shows substantial range overlap with both C. salicifolius and C. zhejiangensis, respectively (Figure 7). This observation implies a potential increase in resource competition among these species. When ecologically similar species exhibit niche overlap, they may utilize different resources to mitigate competition and facilitate coexistence [51,52]. Nevertheless, there is a paucity of research specifically addressing this aspect in Chimonanthus species. Consequently, future investigations into the competitive strategies among different Chimonanthus species are warranted, as such research could enhance the conservation of wild resources.
5. Conclusions
All species of Chimonanthus, which are considered highly valuable resources, are relicts from the Neogene period (late Tertiary) and diverged from Calycanthus during the early Pliocene. Our study has demonstrated the impact of climate change on the distribution of the genus Chimonanthus. According to our findings, the most suitable habitats for Chimonanthus under current climatic conditions are located in southern China. However, under future climate scenarios, these suitable areas are projected to shift to higher latitudes. Temperature and precipitation have been identified as the primary environmental factors influencing the potential distribution of the genus Chimonanthus. In conclusion, this study provides novel and robust evidence for the spatial distribution gradient and species diversity conservation of the genus Chimonanthus in the context of climate change. Concerning the primary distribution areas of Chimonanthus, it is imperative to delineate significant functional zones, conduct comprehensive surveys and research on representative habitats, investigate the key factors influencing the distribution and proliferation of the species, and collect germplasm resources to establish a germplasm database. For vulnerable species such as C. grammatus, C. salicifolius, etc., it is imperative to develop and execute precise conservation plans. These plans should include the establishment of conservation areas and the implementation of environmental monitoring and early warning systems to ensure refined conservation efforts at specific locations and regular intervals. The findings of this study offer valuable insights for the formulation of long-term conservation and management strategies for the genus Chimonanthus.
Supplementary Materials
The following supporting information can be downloaded at: https://www.mdpi.com/article/10.3390/f15091625/s1, Table S1. Description of the environment factors, Table S2. The coordinates of centroid locations and distance of movements (km) of Chimonanthus under different climate change scenarios.
Author Contributions
Q.S.: Data curation, Formal analysis, Methodology, Writing—original draft. Z.D.: Methodology, Formal analysis, Writing—original draft. Y.X. (Yuxi Xue): Formal analysis. H.L.: Software. Y.Z.: Methodology. S.Z.: Data curation. X.H.: Data curation. B.Z.: Writing—review and editing. H.Q.: Data curation. Y.X. (Yi’an Xiao): Conceptualization, Funding acquisition, Project administration, Writing—review and editing. Z.Z.: Conceptualization, Project administration, Funding acquisition, Supervision, Writing—review and editing. All authors have read and agreed to the published version of the manuscript.
Funding
This research was funded by the National Natural Science Foundation of China (41561012).
Data Availability Statement
Species occurrence records were obtained from the Global Biodiversity Information Facility database (GBIF: https://www.gbif.org/, accessed on 13 May 2023), the Chinese Virtual Herbarium database (CVH: https://www.cvh.ac.cn/, accessed on 13 May 2023), the National Specimen Information Infrastructure database (NSII: http://nsii.org.cn/2017/home.php, accessed on 13 May 2023), and our field surveys.
Acknowledgments
We thank Shanghai Tengyun Biotechnology Co., Ltd. for developing the Hiplot Pro platform (https://hiplot.com.cn/, accessed on 3 July 2024) and providing technical assistance and valuable tools for data analysis and visualization. We also thank American Journal Experts (www.aje.cn, accessed on 16 July 2023) for its linguistic assistance during the preparation of this manuscript.
Conflicts of Interest
The authors declare no conflicts of interest.
References
- Jamal, A.; Wen, J.; Ma, Z.Y.; Ahmed, I.; Abdullah; Chen, L.Q.; Nie, Z.; Liu, X.Q. Comparative Chloroplast Genome Analyses of the Winter-Blooming Eastern Asian Endemic Genus Chimonanthus (Calycanthaceae) With Implications for its Phylogeny and Diversification. Front. Genet. 2021, 12, 709996. [Google Scholar] [CrossRef] [PubMed]
- Zhao, K.G.; Zhou, M.Q.; Chen, L.Q.; Zhang, D.; Gituru, R.W. Genetic Diversity and Discrimination of Chimonanthus praecox (L.) Link Germplasm Using ISSR and RAPD Markers. Hortscience 2007, 42, 1144–1148. [Google Scholar] [CrossRef]
- Lu, J.G.; Du, L.J. RAPD Analyses of the Chimonanthus praecox Cultivars. J. Nanjing For. Univ. (Nat. Ences Ed.) 2007, 31, 109–112. [Google Scholar]
- Zhang, R.H.; Liu, H.E. Wax Shrubs in World (Calycanthaceae); China Science and Technology Press: Beijing, China, 1998. [Google Scholar]
- Shu, R.G.; Wan, Y.L.; Wang, X.M. Non-volatile constituents and pharmacology of Chimonanthus: A review. Chin. J. Nat. Med. 2019, 17, 9–34. [Google Scholar] [CrossRef] [PubMed]
- Zhang, Y.; He, J.; Chen, L.; Wang, W. Chimonanthus nitens Oliv leaves essential oil alleviates colitis induced by sodium dextran sulfate in BALB/C mice via MAPK/NF-κB/Nrf2 signaling pathway. J. Funct. Foods 2024, 115, 106095. [Google Scholar] [CrossRef]
- Azuma, H.; Toyota, M.; Asakawa, Y. Floral Scent Chemistry and Stamen Movement of Chimonanthus praecox (L.) Link (Calycanthaceae). Acta Phytotax. Geobot. 2005, 56, 197–201. [Google Scholar]
- Deng, C.; Song, G.; Hu, Y. Rapid determination of volatile compounds emitted from Chimonanthus praecox flowers by HS-SPME-GC-MS. Z. Für Naturforschung C J. Biosci. 2004, 59, 636–640. [Google Scholar] [CrossRef]
- Du, H.C.; Jiang, Y.T.; Tian, M.; Zhang, Y.; Wang, C.X. Morphological variation in flowers of wild populations of Chimonanthus praecox in Zhejiang Province and its correlation with environment factors. Acta Ecol. Sin. 2018, 38, 5800–5809. [Google Scholar]
- Dawson, T.P.; Jackson, S.T.; House, J.I.; Prentice, C.I.; Mace, G.M. Beyond Predictions: Biodiversity Conservation in a Changing Climate. Science 2011, 6025, 53–58. [Google Scholar] [CrossRef]
- Pillet, M.; Goettsch, B.; Merow, C.; Maitner, B.; Feng, X.; Roehrdanz, P.R.; Enquist, B.J. Elevated extinction risk of cacti under climate change. Nat. Plants 2022, 8, 366–372. [Google Scholar] [CrossRef]
- Wu, L.; Zhang, Y.; Guo, X.; Ning, D.; Zhou, X.; Feng, J.; Yuan, M.M.; Liu, S.; Guo, J.; Gao, Z. Reduction of microbial diversity in grassland soil is driven by long-term climate warming. Nat. Microbiol. 2022, 7, 1054. [Google Scholar] [CrossRef] [PubMed]
- Kerr, J.T.; Pindar, A.; Galpern, P.; Packer, L.; Potts, S.G.; Roberts, S.M.; Rasmont, P.; Schweiger, O.; Colla, S.R.; Richardson, L.L.; et al. Climate change impacts on bumblebees converge across continents. Science 2015, 349, 177–180. [Google Scholar] [CrossRef] [PubMed]
- Ehrlén, J.; Morris, W.F. Predicting changes in the distribution and abundance of species under environmental change. Ecol. Lett. 2015, 18, 303–314. [Google Scholar] [CrossRef] [PubMed]
- Pecl, G.T.; Araújo, M.B.; Bell, J.D.; Blanchard, J.; Bonebrake, T.C.; Chen, I.; Clark, T.D.; Colwell, R.K.; Danielsen, F.; Evengård, B. Biodiversity redistribution under climate change: Impacts on ecosystems and human well-being. Science 2017, 355, eaai9214. [Google Scholar] [CrossRef] [PubMed]
- Soroye, P.; Newbold, T.; Kerr, J. Climate change contributes to widespread declines among bumble bees across continents. Science 2020, 367, 685–688. [Google Scholar] [CrossRef] [PubMed]
- Castillo, E.M.D.; Zang, C.S.; Buras, A.; Hacket-Pain, A.; Esper, J.; Serrano-Notivoli, R.; Hartl, C.; Weigel, R.; Klesse, S.; de Dios, V.R.; et al. Climate-change-driven growth decline of European beech forests. Commun. Biol. 2022, 5, 163. [Google Scholar]
- Zhang, K.; Yao, L.; Meng, J.; Tao, J. Maxent modeling for predicting the potential geographical distribution of two peony species under climate change. Sci. Total Environ. 2018, 634, 1326–1334. [Google Scholar] [CrossRef]
- Weiskopf, S.R.; Rubenstein, M.A.; Crozier, L.G.; Gaichas, S.; Griffis, R.; Halofsky, J.E.; Hyde, K.J.W.; Morelli, T.L.; Morisette, J.T.; Muoz, R.C. Climate change effects on biodiversity, ecosystems, ecosystem services, and natural resource management in the United States. Sci. Total Environ. 2020, 733, 137782. [Google Scholar] [CrossRef]
- Osland, M.J.; Stevens, P.W.; Lamont, M.M.; Brusca, R.C.; Seminoff, J.A. Tropicalization of temperate ecosystems in North America: The northward range expansion of tropical organisms in response to warming winter temperatures. Glob. Chang. Biol. 2021, 27, 3009–3034. [Google Scholar] [CrossRef]
- IPCC. Climate Change 2013: The Physical Science Basis. Contribution of Working Group i to the Fifth Assessment Report of the Intergovernmental Panel on Climate Change; Cambridge University Press: Cambridge, NY, USA, 2013. [Google Scholar]
- Jaureguiberry, P.; Titeux, N.; Wiemers, M.; Bowler, D.E.; Coscieme, L.; Golden, A.S.; Guerra, C.A.; Jacob, U.; Takahashi, Y.; Settele, J.; et al. The direct drivers of recent global anthropogenic biodiversity loss. Sci. Adv. 2022, 8, eabm9982. [Google Scholar] [CrossRef]
- Malte, M.; Zebedee, R.J.N.; Jared, L.; Matthew, J.G.; Elisabeth, V.; Mandy, F.; Urs, B.; Claudia, G.; Alexander, N.; Nico, B.; et al. The shared socio-economic pathway (SSP) greenhouse gas concentrations and their extensions to 2500. Geosci. Model Dev. 2020, 13, 3571–3605. [Google Scholar]
- Phillips, S.J.; Anderson, R.P.; Schapire, R.E. Maximum entropy modeling of species geographic distributions. Ecol. Model. 2006, 190, 231–259. [Google Scholar] [CrossRef]
- Stockwell, D.; Peters, D.P. The GARP modelling system: Problems and solutions to automated spatial prediction. Int. J. Geogr. Inf. Sci. 1999, 13, 143–158. [Google Scholar] [CrossRef]
- Busby, J.R. BIOCLIM: A bioclimate analysis and prediction system. Plant Prot. Q. 1991, 6, 8–9. [Google Scholar]
- Ngarega, B.K.; Nzei, J.M.; Saina, J.K.; Halmy, M.W.A.; Chen, J.; Li, Z. Mapping the habitat suitability of Ottelia species in Africa. Plant Divers. 2022, 44, 468–480. [Google Scholar] [CrossRef]
- Fournier, A.; Penone, C.; Pennino, M.G.; Courchamp, F. Predicting future invaders and future invasions. Proc. Natl. Acad. Sci. USA 2019, 116, 7905–7910. [Google Scholar] [CrossRef]
- Rewicz, A.; Myśliwy, M.; Rewicz, T.; Adamowski, W.; Kolanowska, M. Contradictory effect of climate change on American and European populations of Impatiens capensis Meerb.—Is this herb a global threat? Sci. Total Environ. 2022, 850, 157959. [Google Scholar] [CrossRef]
- Warren, D.L.; Glor, R.E.; Turelli, M. ENMTools: A toolbox for comparative studies of environmental niche models. Ecography 2010, 33, 1230–1237. [Google Scholar] [CrossRef]
- Fick, S.E.; Hijmans, R.J. WorldClim 2: New 1-km spatial resolution climate surfaces for global land areas. Int. J. Climatol. 2017, 37, 4302–4315. [Google Scholar] [CrossRef]
- Qiu, L.; Jacquemyn, H.; Burgess, K.S.; Zhang, L.; Zhou, Y.; Yang, B.; Tan, S. Contrasting range changes of terrestrial orchids under future climate change in China. Sci. Total Environ. 2023, 895, 165128. [Google Scholar] [CrossRef]
- Yang, W.; Sun, S.; Wang, N.; Fan, P.; You, C.; Wang, R.; Zheng, P.; Wang, H. Dynamics of the distribution of invasive alien plants (Asteraceae) in China under climate change. Sci. Total Environ. 2023, 903, 166260. [Google Scholar] [CrossRef] [PubMed]
- Liu, C.; Newell, G.; White, M. On the selection of thresholds for predicting species occurrence with presence-only data. Ecol. Evol. 2016, 6, 337–348. [Google Scholar] [CrossRef] [PubMed]
- Hughes, A.C. Mapping priorities for conservation in Southeast Asia. Biol. Conserv. 2017, 209, 395–405. [Google Scholar] [CrossRef]
- Jiao, S.; Zeng, Q.; Sun, G.; Lei, G. Improving Conservation of Cranes by Modeling Potential Wintering Distributions in China. J. Resour. Ecol. 2016, 7, 44–50. [Google Scholar]
- Warren, D.L.; Glor, R.E.; Turelli, M. Environmental niche equivalency versus conservatism: Quantitative approaches to niche evolution. Evolution 2008, 62, 2868–2883. [Google Scholar] [CrossRef]
- Schoener, T.W. The Anolis lizards of Bimini: Resource partitioning in a complex fauna. Ecology 1968, 49, 704–726. [Google Scholar] [CrossRef]
- Li, X.; Chen, J.; Guo, W. A review of the influence factors of plant phenology under different climate types. J. Earth Environ. 2018, 9, 16–27. [Google Scholar]
- Zhang, Q.; Barnes, M.; Benson, M.; Burakowski, E.; Oishi, A.C.; Ouimette, A.; Sanders-Demott, R.; Stoy, P.; Wenzel, M.; Xiong, L.; et al. Reforestation and surface cooling in temperate zones: Mechanisms and implications. Glob. Chang. Biol. 2020, 26, 3384–3401. [Google Scholar] [CrossRef]
- Zhao, B.; Zhang, Q. Distribution and characteristic of Chimonanthus germplasm in China. Guihaia 2007, 27, 730–735. [Google Scholar]
- Li, S.; Yang, N.; Chen, L. Paraffin section observation of flower bud differentiation of Chimonanthus praecox in Kunming and comparison of the differentiation processes in different regions, China. Hortic. Plant J. 2022, 8, 221–229. [Google Scholar] [CrossRef]
- Camille, P.; Hanley, M.E. Plants and climate change: Complexities and surprises. Ann. Bot.-Lond. 2015, 116, 849–864. [Google Scholar]
- Loarie, S.R.; Duffy, P.B.; Hamilton, H.; Asner, G.P.; Field, C.B.; Ackerly, D.D. The velocity of climate change. Nature 2009, 462, 1052–1055. [Google Scholar] [CrossRef] [PubMed]
- Zellweger, F.; De Frenne, P.; Lenoir, J.; Vangansbeke, P.; Verheyen, K.; Bernhardt-Roemermann, M.; Baeten, L.; Hedl, R.; Berki, I.; Brunet, J.; et al. Forest microclimate dynamics drive plant responses to warming. Science 2020, 368, 772–775. [Google Scholar] [CrossRef]
- De Frenne, P.; Lenoir, J.; Luoto, M.; Scheffers, B.R.; Zellweger, F.; Aalto, J.; Ashcroft, M.B.; Christiansen, D.M.; Decocq, G.; De Pauw, K.; et al. Forest microclimates and climate change: Importance, drivers and future research agenda. Glob. Chang. Biol. 2021, 27, 2279–2297. [Google Scholar] [CrossRef]
- Lu, Y.; Zhang, B.; Zhang, M.; Jie, M.; Guo, S.; Wang, Y. Relict plants are better able to adapt to climate change: Evidence from desert shrub communities. Plants 2023, 12, 4065. [Google Scholar] [CrossRef] [PubMed]
- Wang, C.; Sheng, Q.; Zhao, R.; Zhu, Z. Differences in the suitable distribution area between northern and southern China landscape plants. Plants 2023, 12, 2710. [Google Scholar] [CrossRef]
- MacDonald, J.S.; Lutscher, F.; Bourgault, Y. Climate change fluctuations can increase population abundance and range size. Ecol. Lett. 2024, 27, e14453. [Google Scholar] [CrossRef]
- Krosby, M.; Wilsey, C.B.; Mcguire, J.L.; Duggan, J.M.; Nogeire, T.M.; Heinrichs, J.A.; Tewksbury, J.J.; Lawler, J.J. Climate-induced range overlap among closely related species. Nat. Clim. Chang. 2015, 5, 883–886. [Google Scholar] [CrossRef]
- Schoener, T.W. Resource partitioning in ecological communities. Science 1974, 185, 27–39. [Google Scholar] [CrossRef]
- Hardin, G. The Competitive Exclusion Principle. Science 1960, 131, 1292–1297. [Google Scholar] [CrossRef]

Disclaimer/Publisher’s Note: The statements, opinions and data contained in all publications are solely those of the individual author(s) and contributor(s) and not of MDPI and/or the editor(s). MDPI and/or the editor(s) disclaim responsibility for any injury to people or property resulting from any ideas, methods, instructions or products referred to in the content. |
© 2024 by the authors. Licensee MDPI, Basel, Switzerland. This article is an open access article distributed under the terms and conditions of the Creative Commons Attribution (CC BY) license (https://creativecommons.org/licenses/by/4.0/).