Article

A Novel Method for Extracting DBH and Crown Base Height in Forests Using Small Motion Clips

1
College of Mechanical and Electrical Engineering, Northeast Forestry University, Harbin 150040, China
2
Centre for Forest Operations and Environment, Northeast Forestry University, Harbin 150040, China
3
School of Public Administration & Law, Northeast Agricultural University, Harbin 150030, China
*
Author to whom correspondence should be addressed.
Forests 2024, 15(9), 1635; https://doi.org/10.3390/f15091635
Submission received: 18 August 2024 / Revised: 11 September 2024 / Accepted: 14 September 2024 / Published: 16 September 2024

Abstract

:
The diameter at breast height (DBH) and crown base height (CBH) are important indicators in forest surveys. To enhance the accuracy and convenience of DBH and CBH extraction for standing trees, a method based on understory small motion clips (a series of images captured with slight viewpoint changes) has been proposed. Histogram equalization and quadtree uniformization algorithms are employed to extract image features, improving the consistency of feature extraction. Additionally, the accuracy of depth map construction and point cloud reconstruction is improved by minimizing the variance cost function. Six 20 m × 20 m square sample plots were selected to verify the effectiveness of the method. Depth maps and point clouds of the sample plots were reconstructed from small motion clips, and the DBH and CBH of standing trees were extracted using a pinhole imaging model. The results indicated that the root mean square error (RMSE) for DBH extraction ranged from 0.60 cm to 1.18 cm, with relative errors ranging from 1.81% to 5.42%. Similarly, the RMSE for CBH extraction ranged from 0.08 m to 0.21 m, with relative errors ranging from 1.97% to 5.58%. These results meet the accuracy standards required for forest surveys. The proposed method enhances the efficiency of extracting tree structural parameters in close-range photogrammetry (CRP) for forestry. A rapid and accurate method for DBH and CBH extraction is provided by this method, laying the foundation for subsequent forest resource management and monitoring.

1. Introduction

Forests are limited, renewable, and important environmental resources that play a crucial role in the carbon cycle and daily production activities [1,2,3]. Forest resource surveys ensure that these resources are fully utilized in national economic development. Among these surveys, the diameter at breast height (DBH) and crown base height (CBH) are critical indicators. Currently, the measurement of DBH and CBH primarily relies on traditional manual techniques, such as using calipers and hypsometers. This process is tedious, time-consuming and prone to errors [4,5,6]. Therefore, the ability to quickly, efficiently, and accurately extract tree parameters is a fundamental requirement for forest resource surveys [7,8].
Cameras are ideal tools for forest resource surveys and are widely utilized due to their low cost, portability, and ease of use [9]. By employing cameras for close-range photogrammetry (CRP) on the sample plots [10,11,12], 3D structural information of the forest can be obtained through methods such as spatial forward intersection and structure from motion (SfM) [13,14]. These approaches allow for the estimation of spatial structure information such as DBH, CBH, and tree height, thereby greatly improving the efficiency and accuracy of forest structure parameter estimation [15].
The estimation of DBH and CBH are the crucial parameters in forest inventory. Various methods have been proposed to extract DBH from different data types, such as airborne laser scanning (ALS), terrestrial laser scanning (TLS), and even smartphone images. Popescu [16] developed a method using airborne lidar data to assess aboveground biomass and component biomass for individual trees in forests. Bucksch et al. [17] introduced a skeleton measurement methodology to extract DBH from forest airborne point clouds, showing good performance in different scenarios. Bu et al. [18] presented an adaptive circle–ellipse fitting technique for estimating DBH based on TLS data, correcting errors caused by basic circle fitting techniques. Liu et al. [5] explored methods for estimating individual tree height and DBH from TLS data at plot level, showing slight underestimation of DBH and tree height in complex terrain regions. Zhou et al. [19] used a handheld mobile light detection and ranging (LiDAR) system to extract DBH in an outdoor environment, while Corte et al. [20] tested machine learning approaches on unmanned aerial vehicle (UAV) lidar data for estimating DBH. Kaviriri et al. [21] investigated morphological characteristics, including DBH, in a clonal trial of Korean pine for wood yield selection index determination. Moreira et al. [22] employed the Hough transform algorithm to extract DBH from point cloud images generated by oblique photogrammetry. The relative error of the estimated DBH was 15%, and the RMSE was less than 3.5 cm. However, the photogrammetry process required strict conditions, specifically at a height of 30 m and an angle of 60°. Mokroš et al. [23] evaluated seven different CRP data collection methods for estimating DBH and found that only four of these methods were capable of generating dense point clouds suitable for DBH estimation using circle fitting algorithms. The accuracies of these methods ranged from 4.41 cm to 5.98 cm. The study concluded that future research should prioritize improving CRP data collection techniques. Popescu et al. [24] developed a voxel-based LiDAR method to estimate CBH for deciduous and pine trees in the southeastern United States. Vauhkonen et al. [25] applied Delaunay triangulations and alpha shapes to estimate tree-level CBH from airborne laser scanning data. Fu et al. [26] focused on developing nonlinear mixed-effects crown width models for individual trees of Chinese fir, evaluating stand and tree characteristics for model improvement.
Recent studies have focused on utilizing mobile phone technology for various forestry applications, including estimating tree parameters, such as DBH and CBH. Clark et al. [27] assessed the utility of a digital camera for measuring standing trees, highlighting the potential of digital cameras in tree measurement. Su et al. [28] developed algorithms to estimate tree position, DBH, and tree height in real-time using a mobile phone with monocular SLAM technology. This advancement allows for accurate and efficient measurement of tree parameters using augmented reality (AR) technology. Ferreira et al. [29] utilized digital camera images for parameter estimation, showcasing the effectiveness of digital analysis in quantifying tree characteristics. Fan et al. [30] focused on the relationship between tree height and DBH, introducing algorithms to estimate DBH and tree height in real-time using mobile phone cameras. Wu et al. [31,32] proposed a passive measurement method for tree DBH using smartphone cameras, highlighting the potential of machine vision and photogrammetry technology in tree measurement. Furthermore, Wells et al. [33] evaluated ground plane detection for estimating DBH in stereo images, emphasizing the importance of automation in forest operations. Trairattanapa et al. [34] compared different fitting algorithms for tree DBH extraction using stereo cameras, while Song et al. [35] developed a handheld device for DBH measurement using LiDAR and deep-learning based image recognition, showcasing advancements in contactless and automated tree measurement techniques. Overall, current methods mainly involve capturing multiple images from different perspectives with a mobile camera over a large scale, indirectly obtaining depth maps from these multi-view images. However, these methods have high requirements for image capture positions and still encounter challenges related to the complexity of data collection and inefficiencies in data processing, particularly in complex forest environments.
To address the challenges of CRP data collection and the efficiency requirements for forest parameter extraction, particularly for measuring DBH and CBH in forest resource surveys, the paper proposes a novel method that employs small motion clips for data collection. By making slight camera adjustments during recording, small motions are induced, generating a series of images with minimal angle variations. This approach produces a data format that lies between traditional video and still images. Unlike conventional CRP methods, small motion clip data collection eliminates the need for additional calibration plates or extensive camera movements, thereby improving collection efficiency. Smartphones can be used to capture these small motion clips in forest environments, facilitating feature point extraction, image registration, depth map recovery, and point cloud reconstruction, achieving precise DBH and CBH extraction. The proposed method offers a quick and efficient solution for forest resource surveys, providing valuable insights for the development and implementation of forest management policies.

2. Materials and Methods
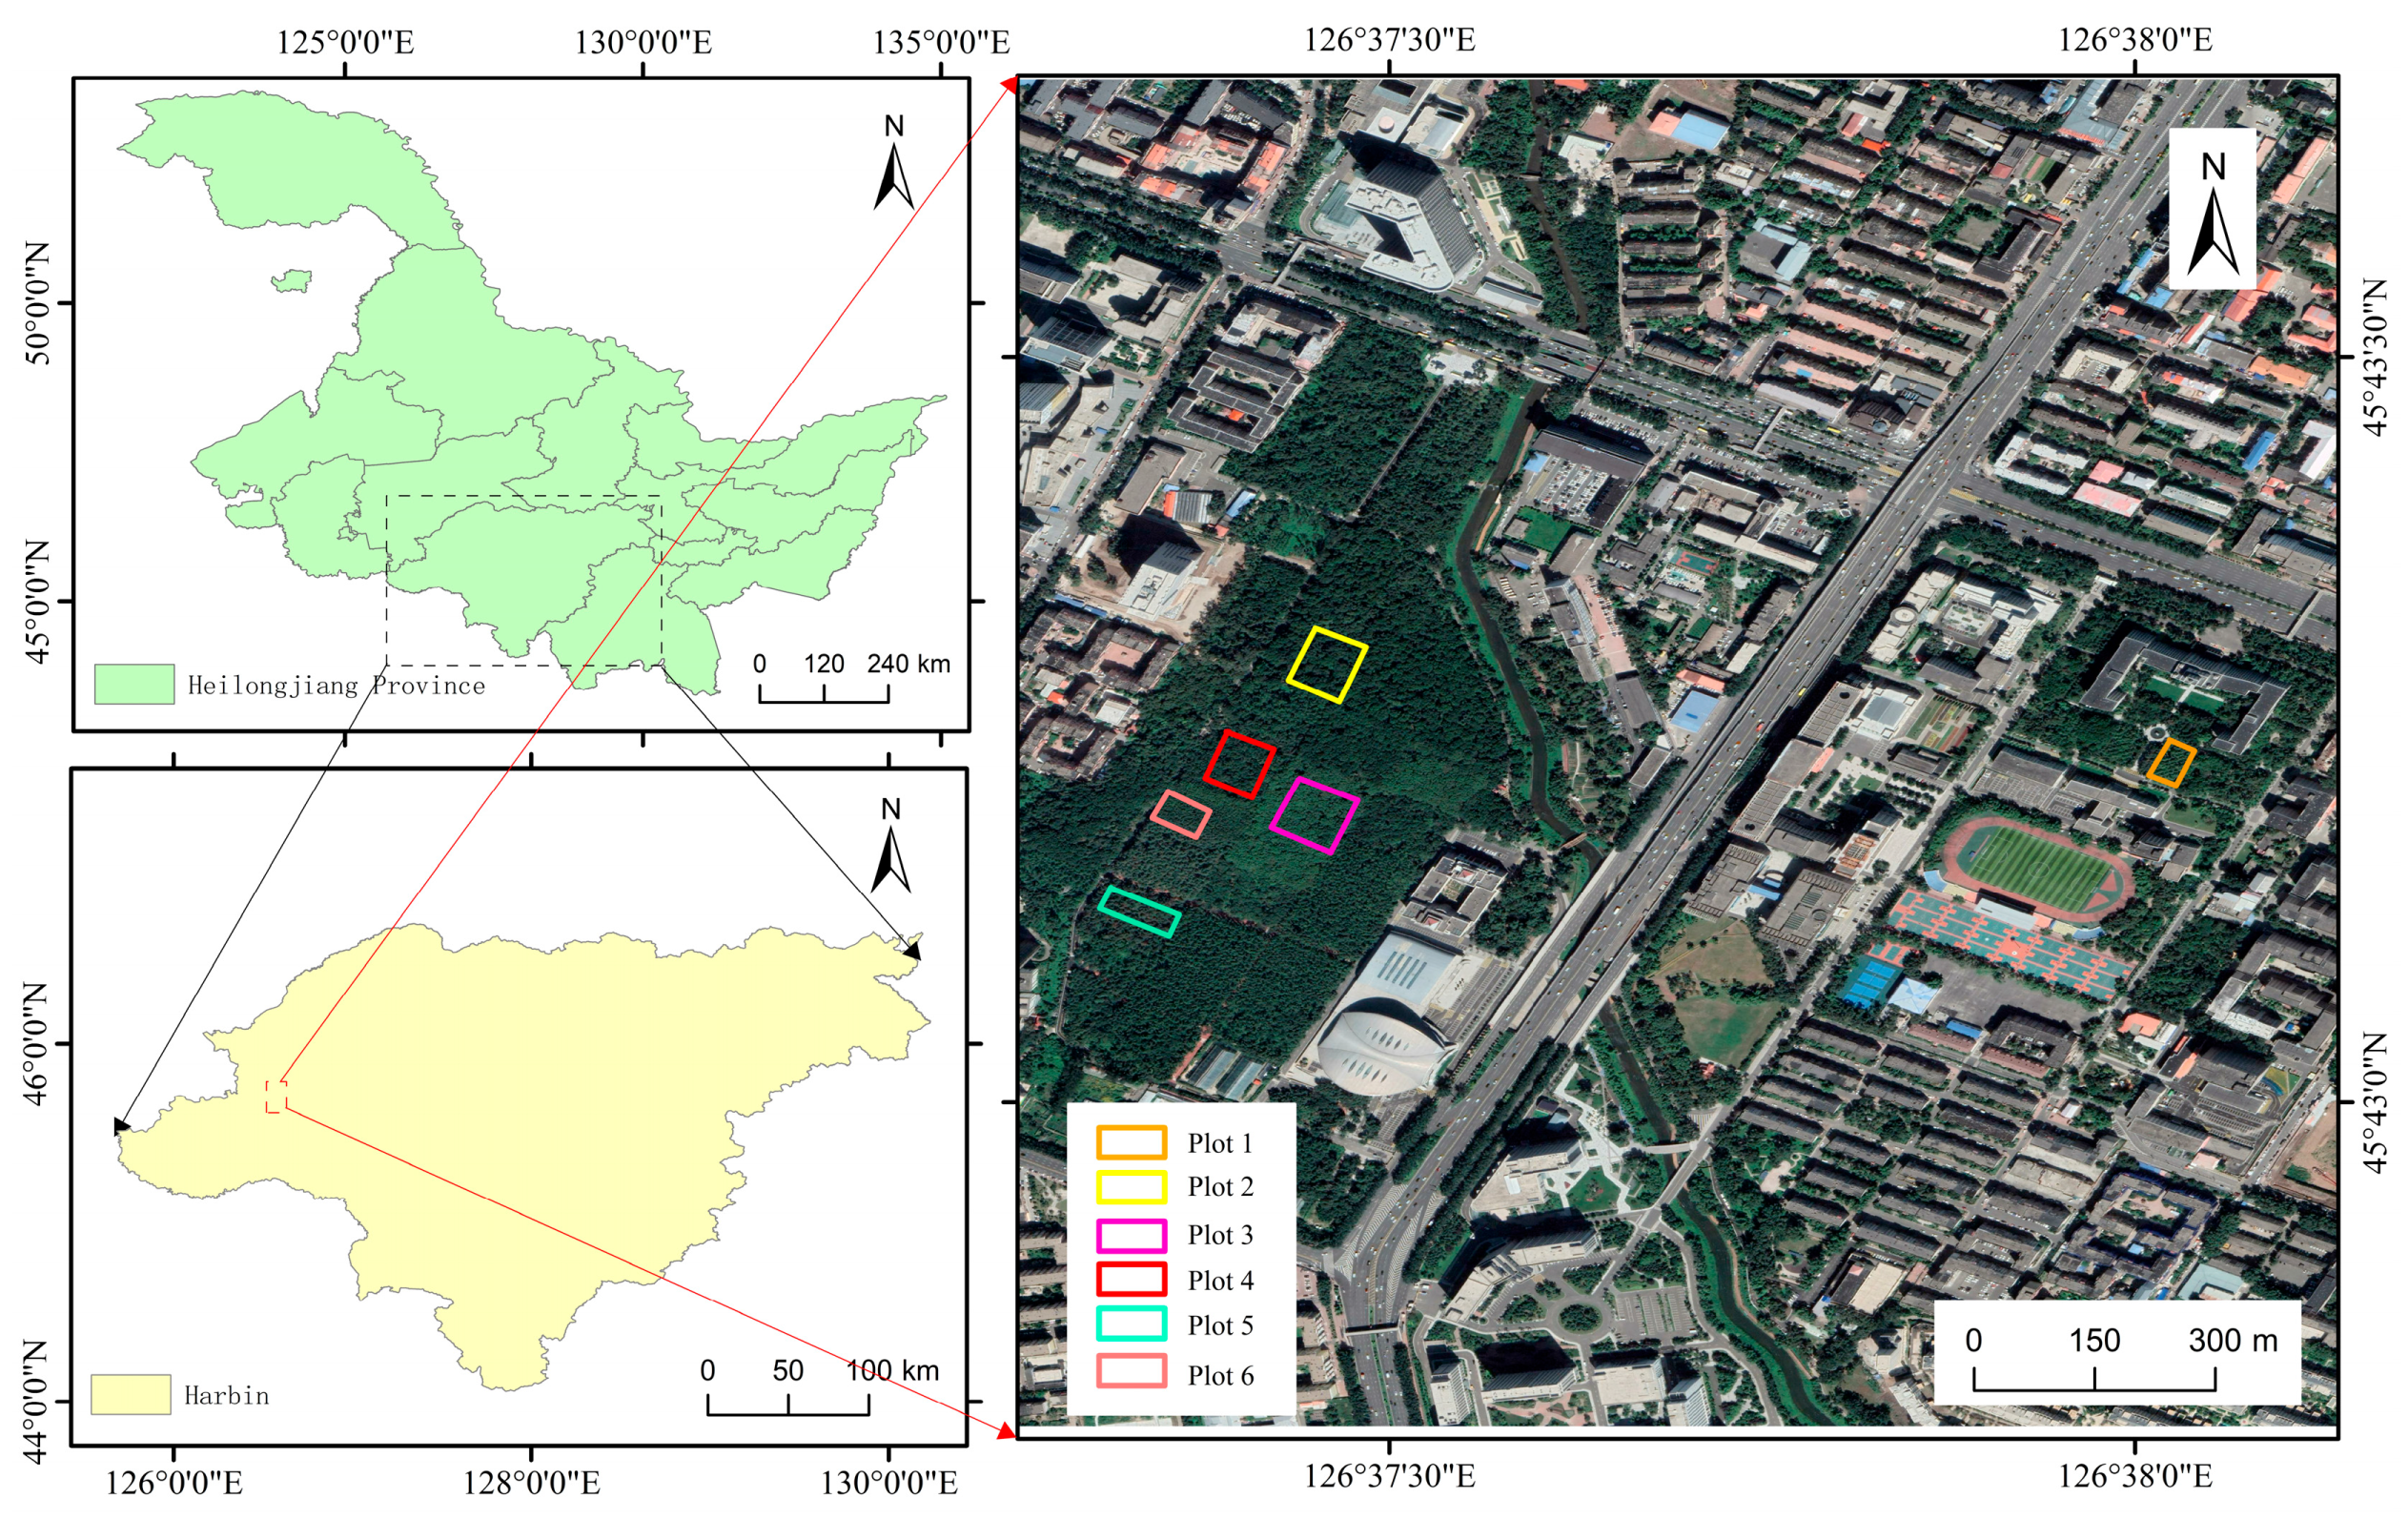
2.1. Study Area

The study area is the urban forestry demonstration base located in Harbin, Heilongjiang Province (45°43′10′′ N, 126°37′15′′ E), covering a total area of 43.95 hectares (hm2) with an elevation ranging from 136 m to 148 m (Figure 1). It is characterized by a typical temperate continental monsoon climate, with long, cold winters and short, hot summers, experiencing significant temperature differences between day and night and distinct seasonal changes. Precipitation is concentrated in the summer and autumn, with July’s average temperature around 25.9 °C and rainfall accounting for 60% of the annual total. In contrast, January’s average temperature is approximately −18.7 °C, with snowfall being predominant.

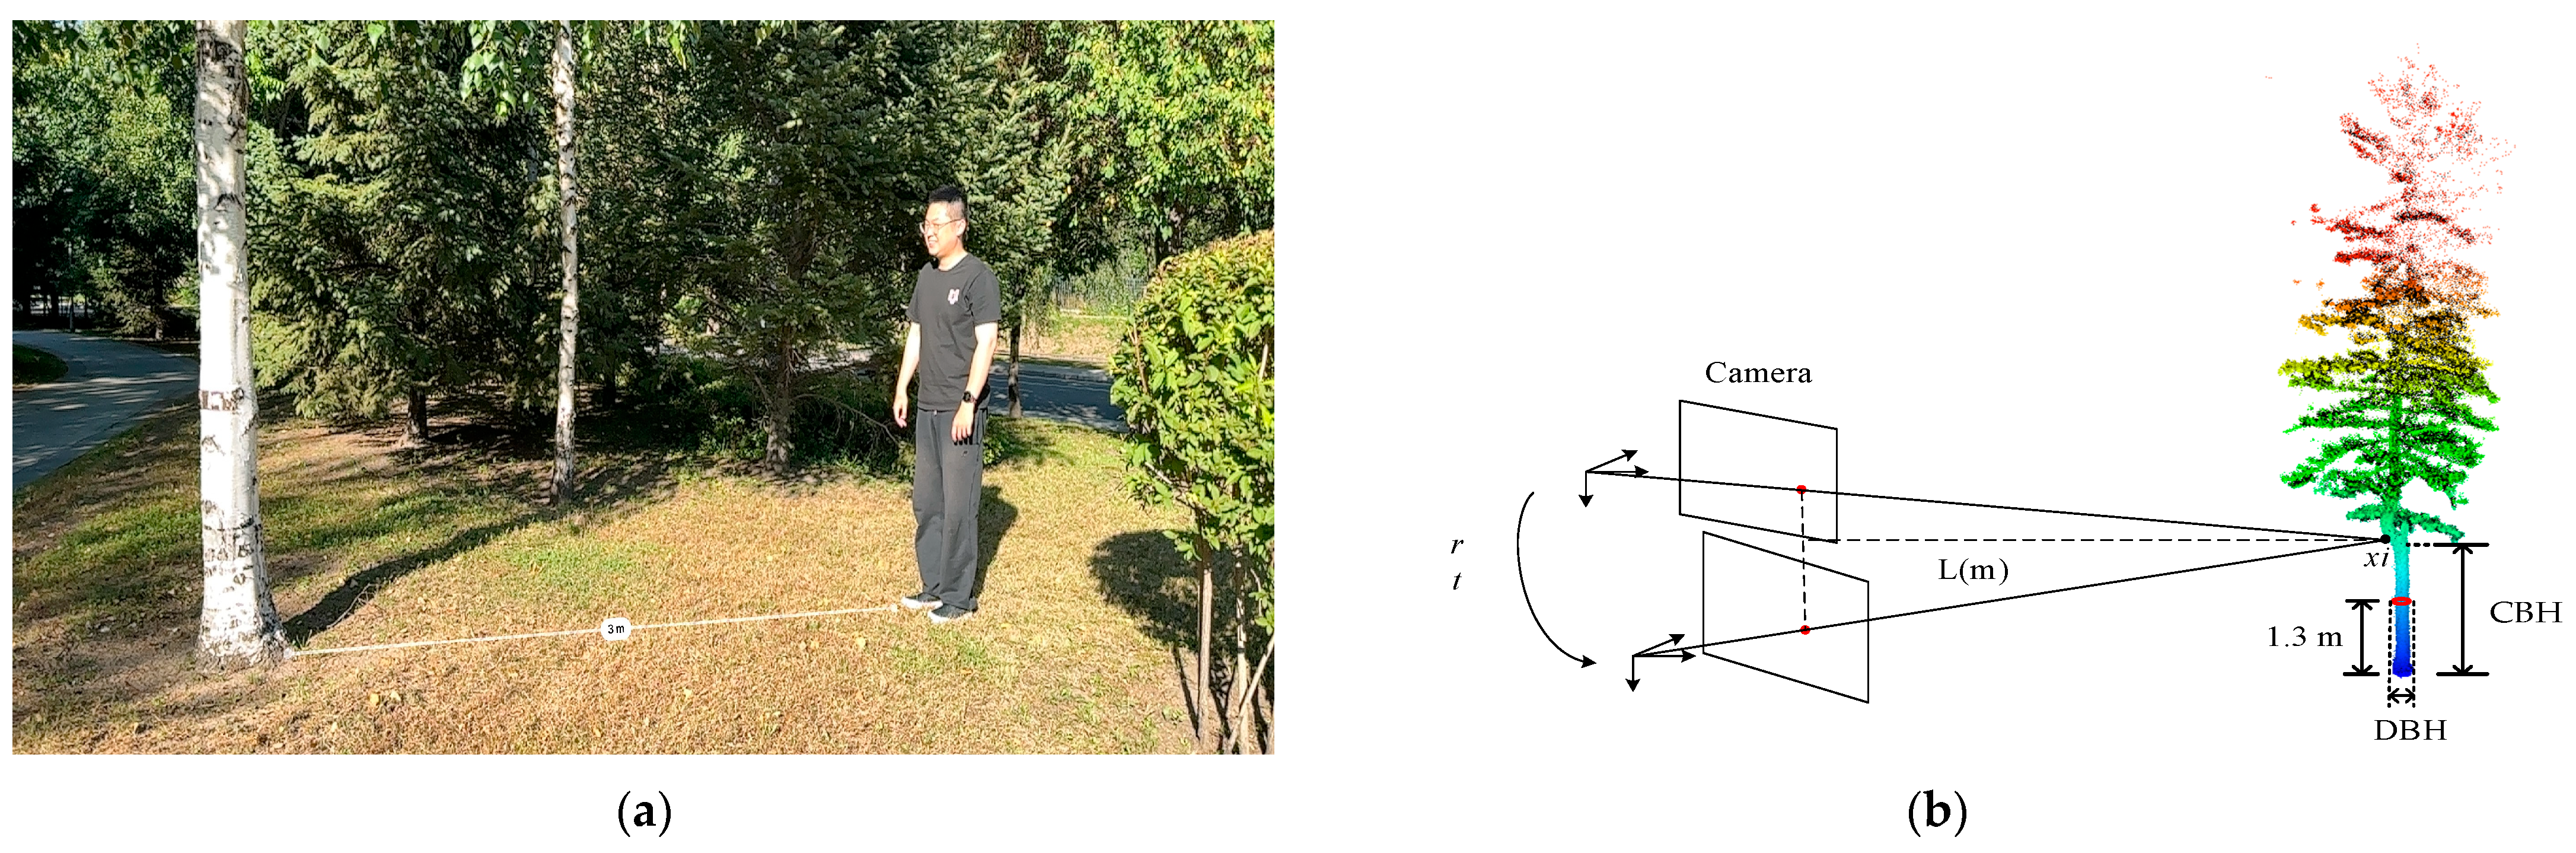
2.2. Collection Data

In the study, 6 sample plots were selected within the study area, each representing a distinct forest type: Betula platyphylla, Pinus tabuliformis var. mukdensis, Quercus mongolica, Fraxinus mandshurica, Picea and Pinus sylvestris var. mongolica. The size of each sample plot is 20 m × 20 m, characterized by uniformly distributed trees, minimal shrub interference, and sparse herbaceous vegetation. The DBH and CBH of all individual trees within each plot was measured using a diameter tapes and hypsometers. The reference data for each sample plot are provided in Table 1.

2.3. Small Motion Clip Data

In this study, we utilized the monocular camera of an iPhone 12 Pro smartphone to capture small motion clip images of individual trees within the sample plots. The key specifications of the device are detailed in Table 2.
On the day of data collection (11 May 2023), the weather was initially cloudy but cleared up later, with winds shifting from the southwest to the north at speeds of 3 to 4. The temperature ranged from 10 °C to 25 °C. During the image collection process, there were no pedestrians, and the forest floor was unobstructed, providing good brightness and visibility, making it suitable for image capture. To ensure more accurate depth images, the algorithm selected the first 50 frames from each small motion clip for depth calculation, requiring a frame rate of over 30 frames per second. The duration of each clip was at least 2 s, avoiding both overexposure and underexposure. The camera was positioned at an appropriate height and angle to capture the tree roots and branches, with small motion clips recorded from a certain distance L m from the target tree. The distance L m to the target tree was measured using the smartphone’s built-in measurement software (Figure 2a). During recording, the device was slightly rotated and moved horizontally or vertically (Figure 2b). In the study, the distance L m from the target tree is set to 3 m, with the camera’s rotation angle approximated within ±45°, and both horizontal and vertical movements approximated within 5 cm.
In forest resource monitoring, data collection is typically conducted in plots without mobile obstacles, such as pedestrians or vehicles. However, fixed obstacles like shrubs and obstructing trees can be present within these plots. These fixed obstacles can be avoided by collecting data from different perspectives around the trees, provided that at least one direction between the camera and the trees is free of obstacles. The proposed algorithm remains effective under these conditions. It is also important to note that obstacles below the DBH of 1.3 m can be ignored, as they do not impact the final mapping or the extraction of DBH and CBH parameters.
A total of 197 small motion clips were collected, distributed as follows: 29 clips for plot 1, 36 clips for plot 2, 33 clips for plot 3, 27 clips for plot 4, and 36 clips for plot 5 and 6.

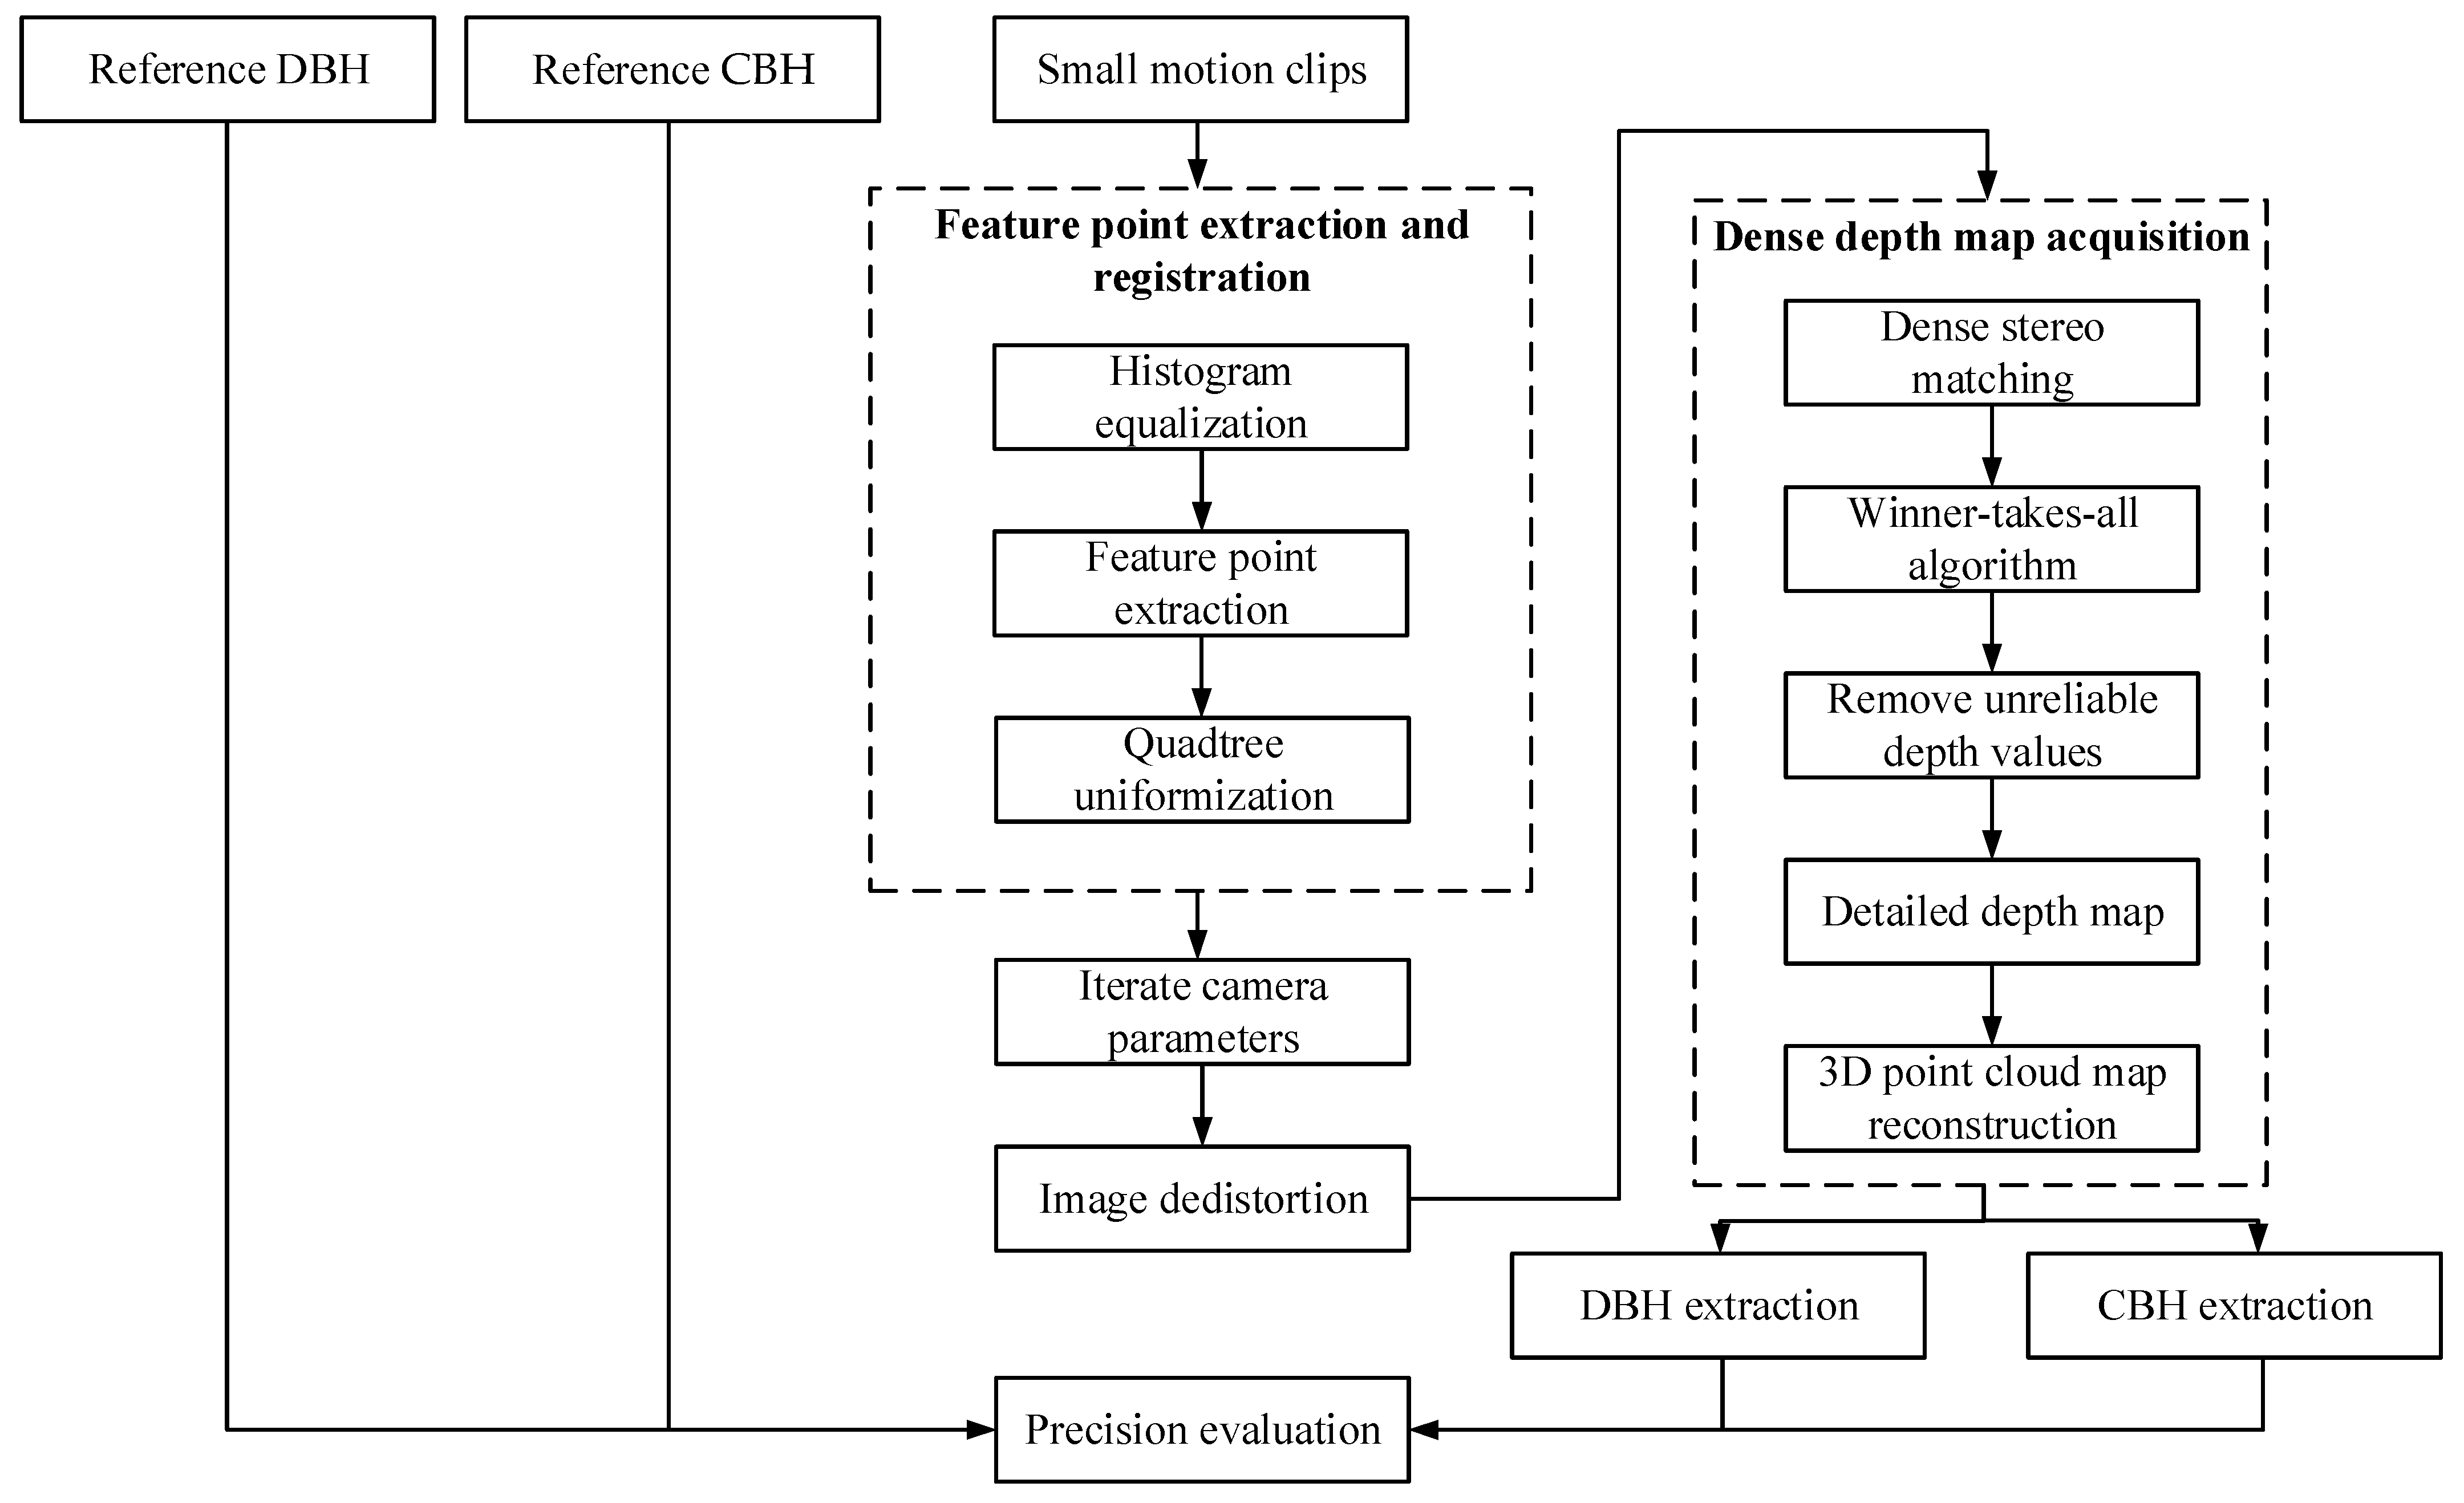
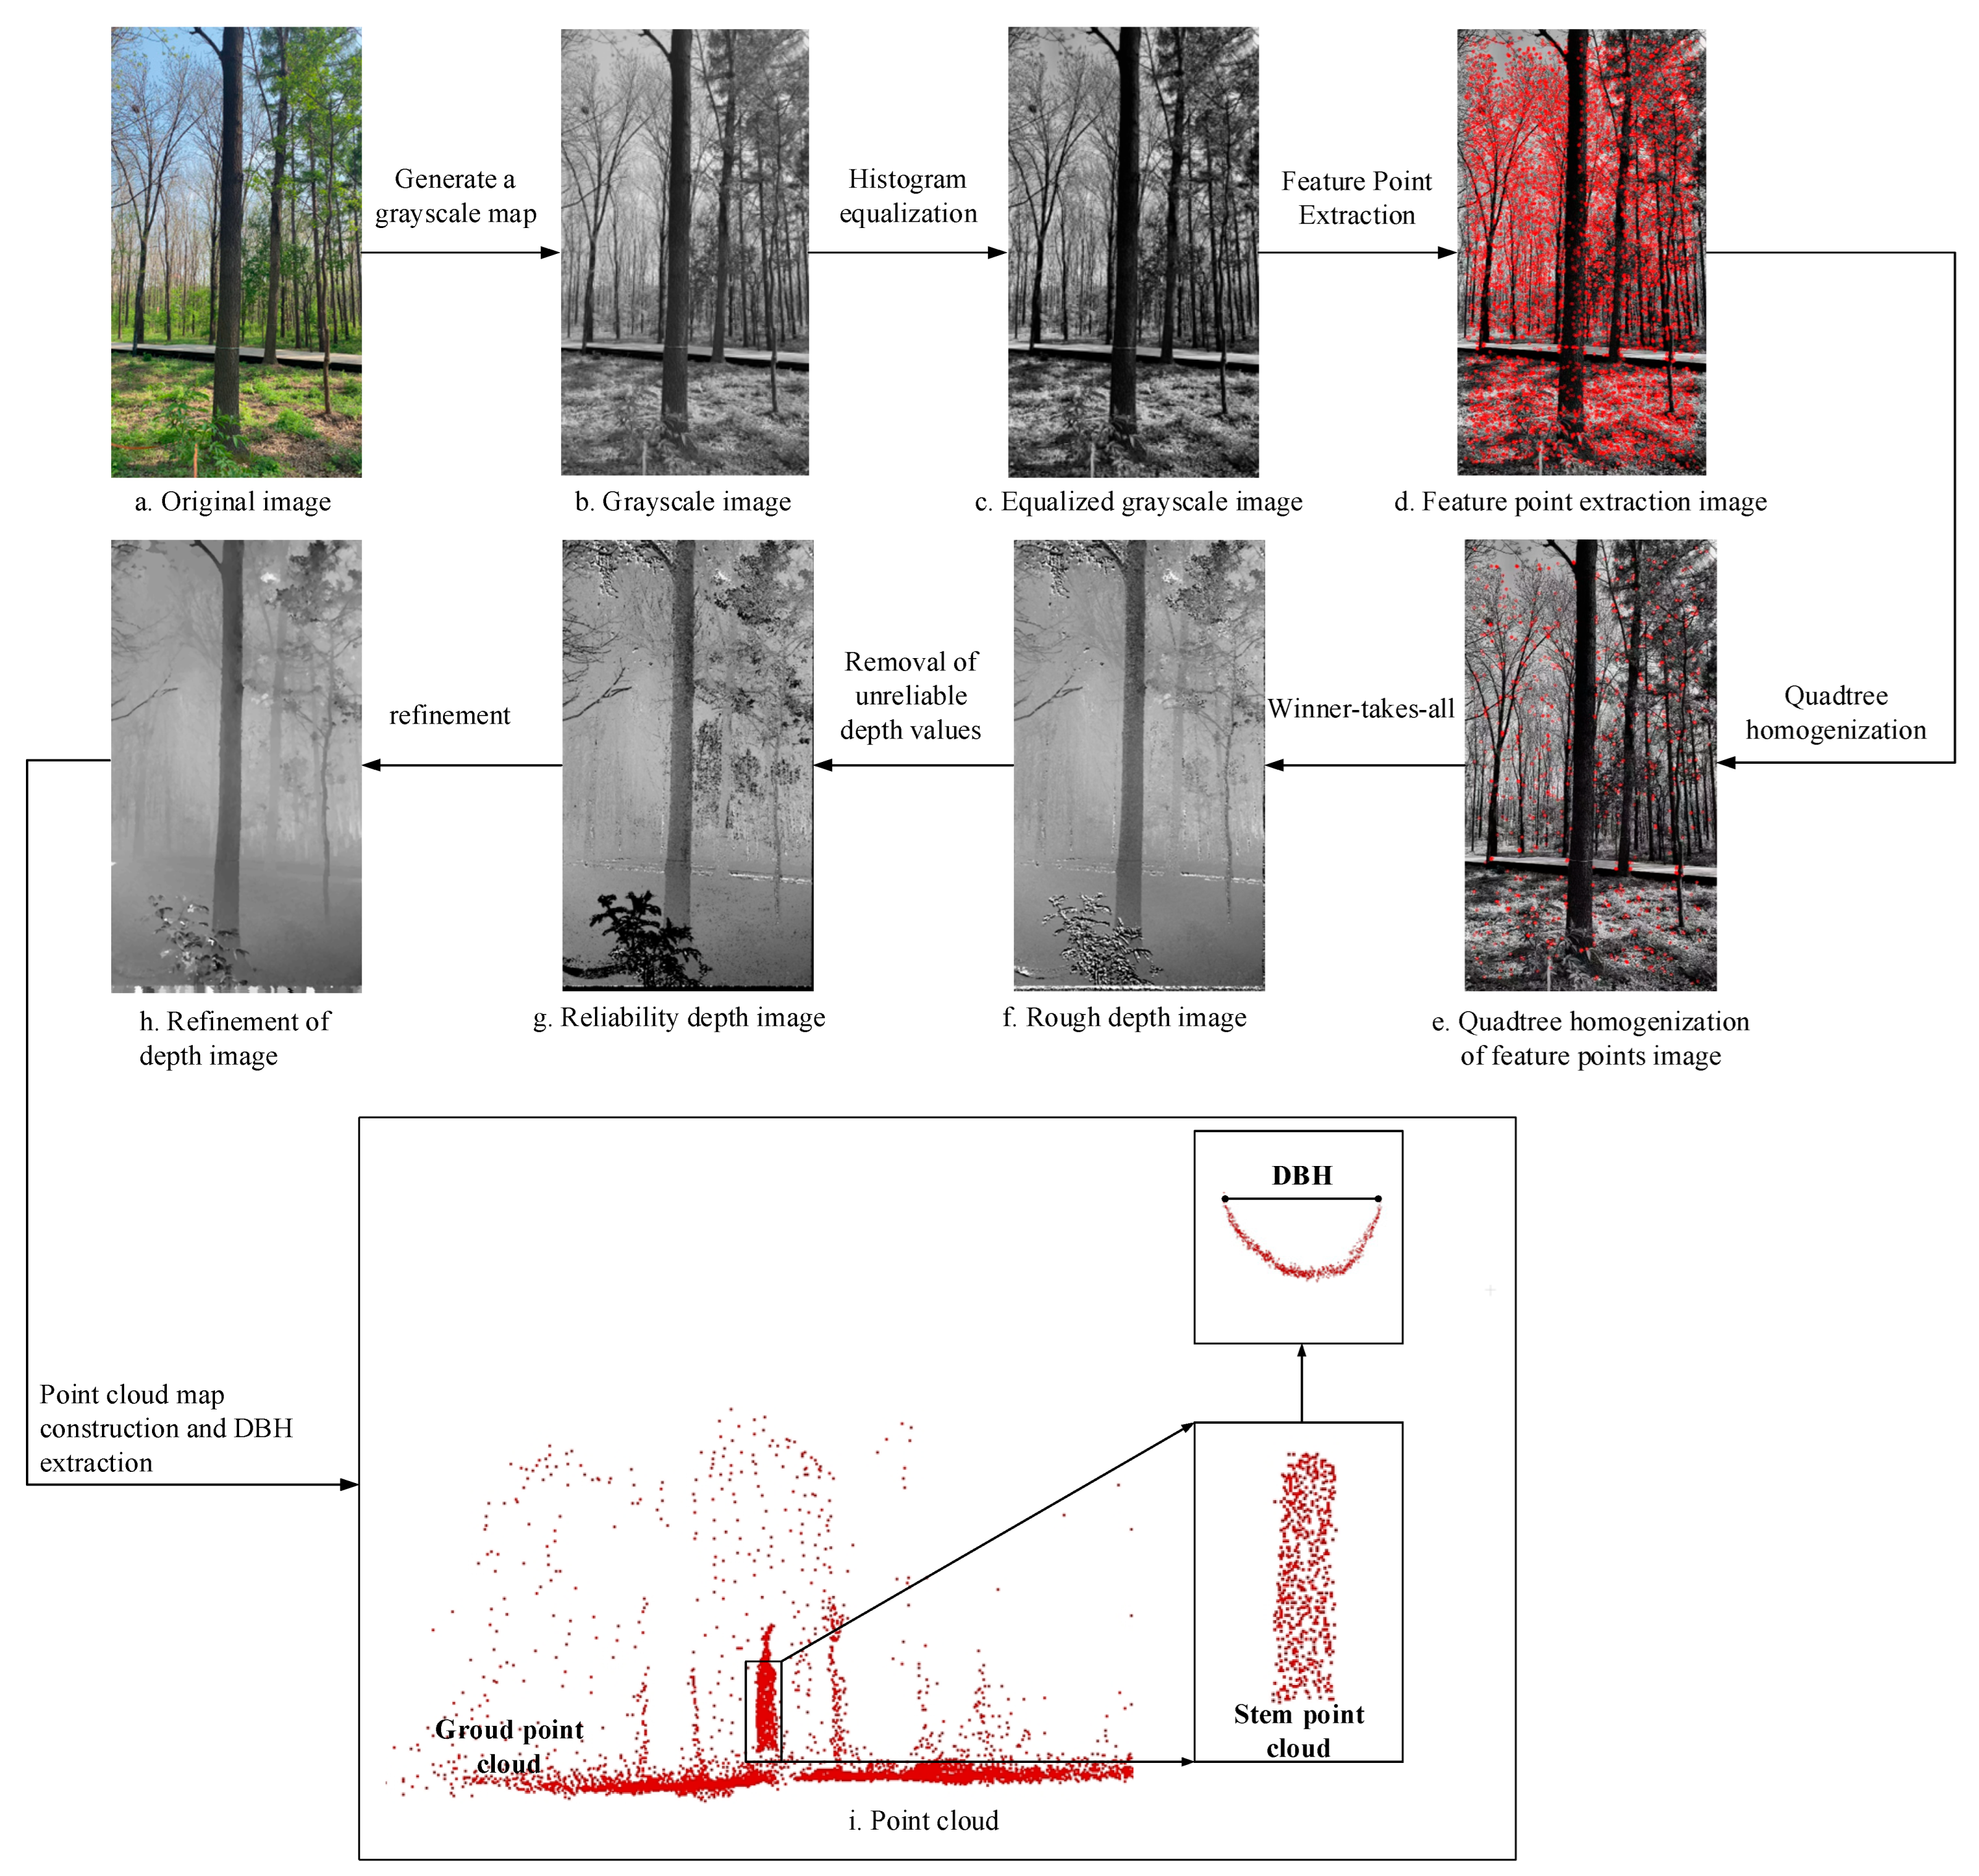
2.4. DBH and CBH Extraction Method Based on Small Motion Clip

The study aimed to extract structural parameters, such as DBH and CBH, from trees within the sample plots using small motion clips. The key steps in the process include feature point extraction and registration, depth image recovery from the small motion clips, point cloud reconstruction, DBH extraction, CBH extraction, and accuracy validation. The overall technical workflow is illustrated in Figure 3.

2.4.1. Feature Point Extraction and Registration

Oriented FAST and Rotated BRIEF (ORB) features [36] are widely used descriptors in computer vision, particularly for feature matching, object detection, and tracking. In corner detection, ORB utilizes the Features from Accelerated Segment Test (FAST) algorithm to identify key points, while the Binary Robust Independent Elementary Features (BRIEF) algorithm [37] is employed for feature description. ORB features are known for their excellent computational speed and feature matching accuracy, making it especially suitable for environments with limited computational resources. It has been widely applied in image stitching, Simultaneous Localization and Mapping (SLAM) and 3D reconstruction.
Traditional feature point extraction algorithms frequently encounter challenges, such as feature point mismatching and redundancy, largely due to variations in canopy leaf gaps caused by wind and the repetitive textures of understory trees. To address these issues, the paper employs histogram equalization using the cumulative distribution function (CDF) for image preprocessing. Histogram equalization enhances image quality by improving contrast and detail visibility, which in turn aids in better image visualization. The method redistributes the grayscale levels of the input image pixels, achieving a more uniform brightness and improved contrast. The cumulative distribution function is defined by Equation (1):
f D A = L d A 0 0 D A H A D d D
where L d represents the grayscale depth; D denotes the grayscale value of a pixel; A 0 stands for the number of pixels; f D A is the grayscale value of the corresponding pixel after histogram equalization of image A; and H A D represents the histogram distribution function of image A.
Traditional ORB algorithms often extract feature points concentrated in texture-rich areas, leading to feature point redundancy, which negatively impacts pose estimation and the accuracy of depth images. The more evenly the feature points and the more layers distributed in space, the more accurately feature matching can express spatial geometric relationships, resulting in more accurate depth images and extracted forest structure parameters. To increase the uniformity of feature extraction, the study proposes using the quadtree method to average and distribute feature points within image layers.
During the feature point extraction process, a pixel p is selected, assuming its brightness is I p . A threshold T is set and 16 pixels on a circle with a radius of 3 centered on the pixel p are considered. To ensure the real-time performance of the algorithm, the improved method only selects 4 corner points out of the 16 peripheral pixels as surrounding points. If the number of surrounding points that meet the brightness condition specified by Equation (2) exceeds 3, the pixel p can be determined as a feature point. This process is repeated iteratively, applying the same operation to each pixel, thereby extracting all feature points in the image.
I p + T I p Pending   test or   I p Pending   test I p T

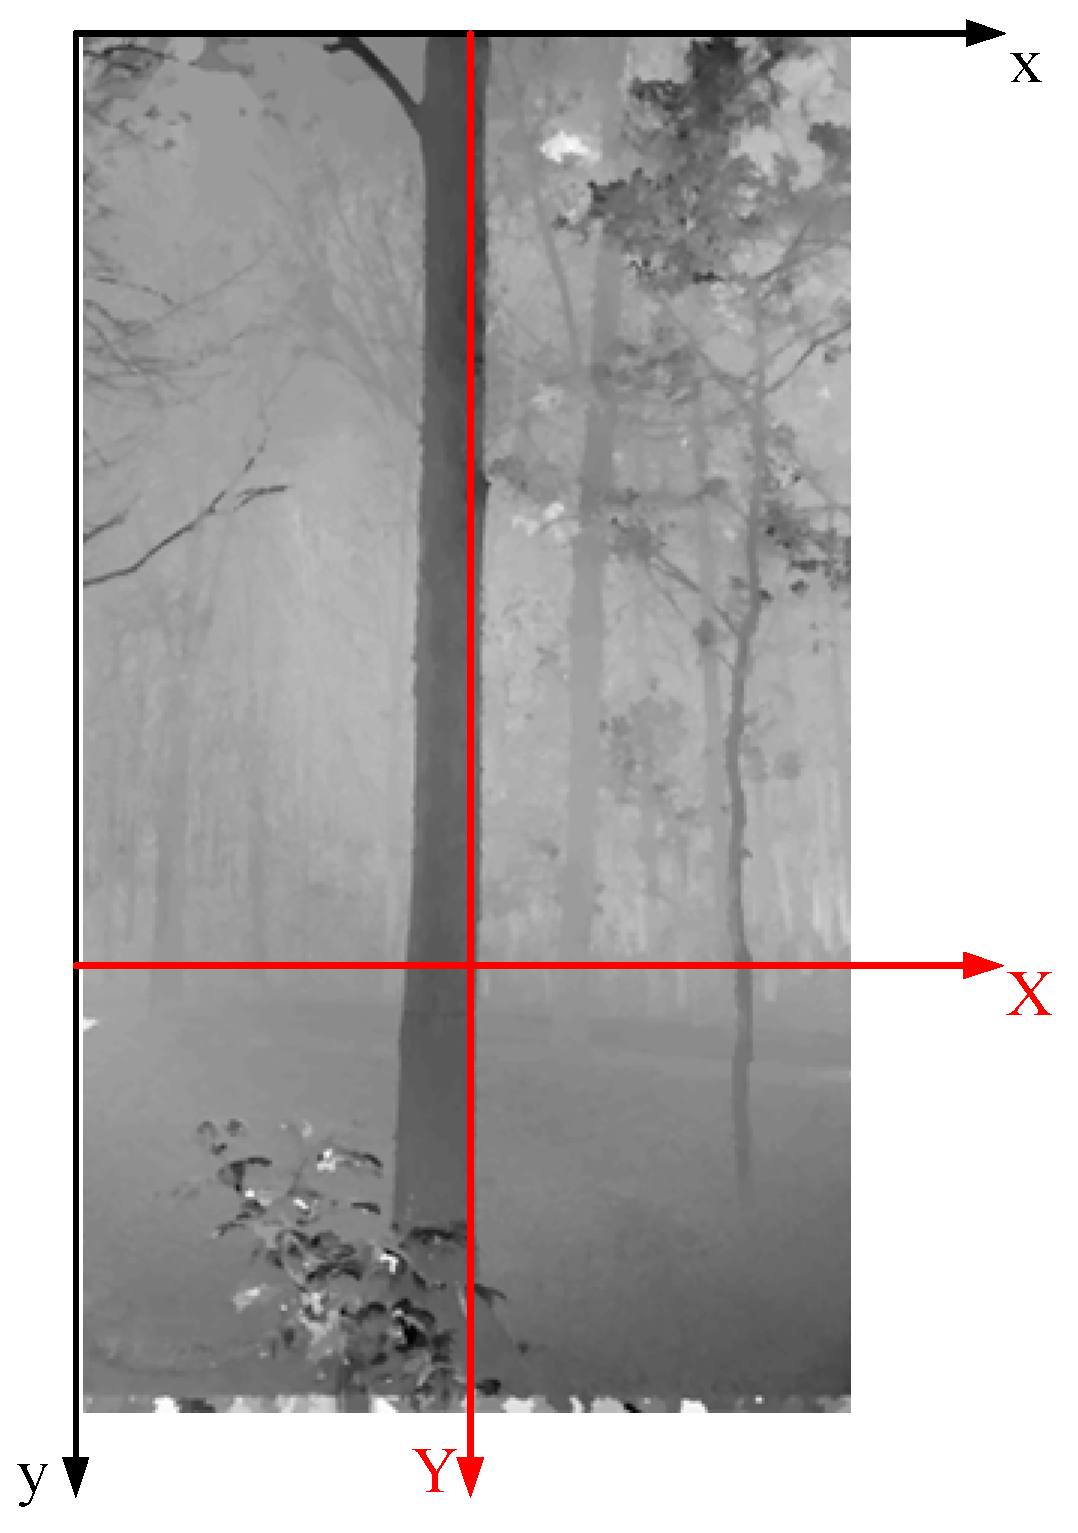
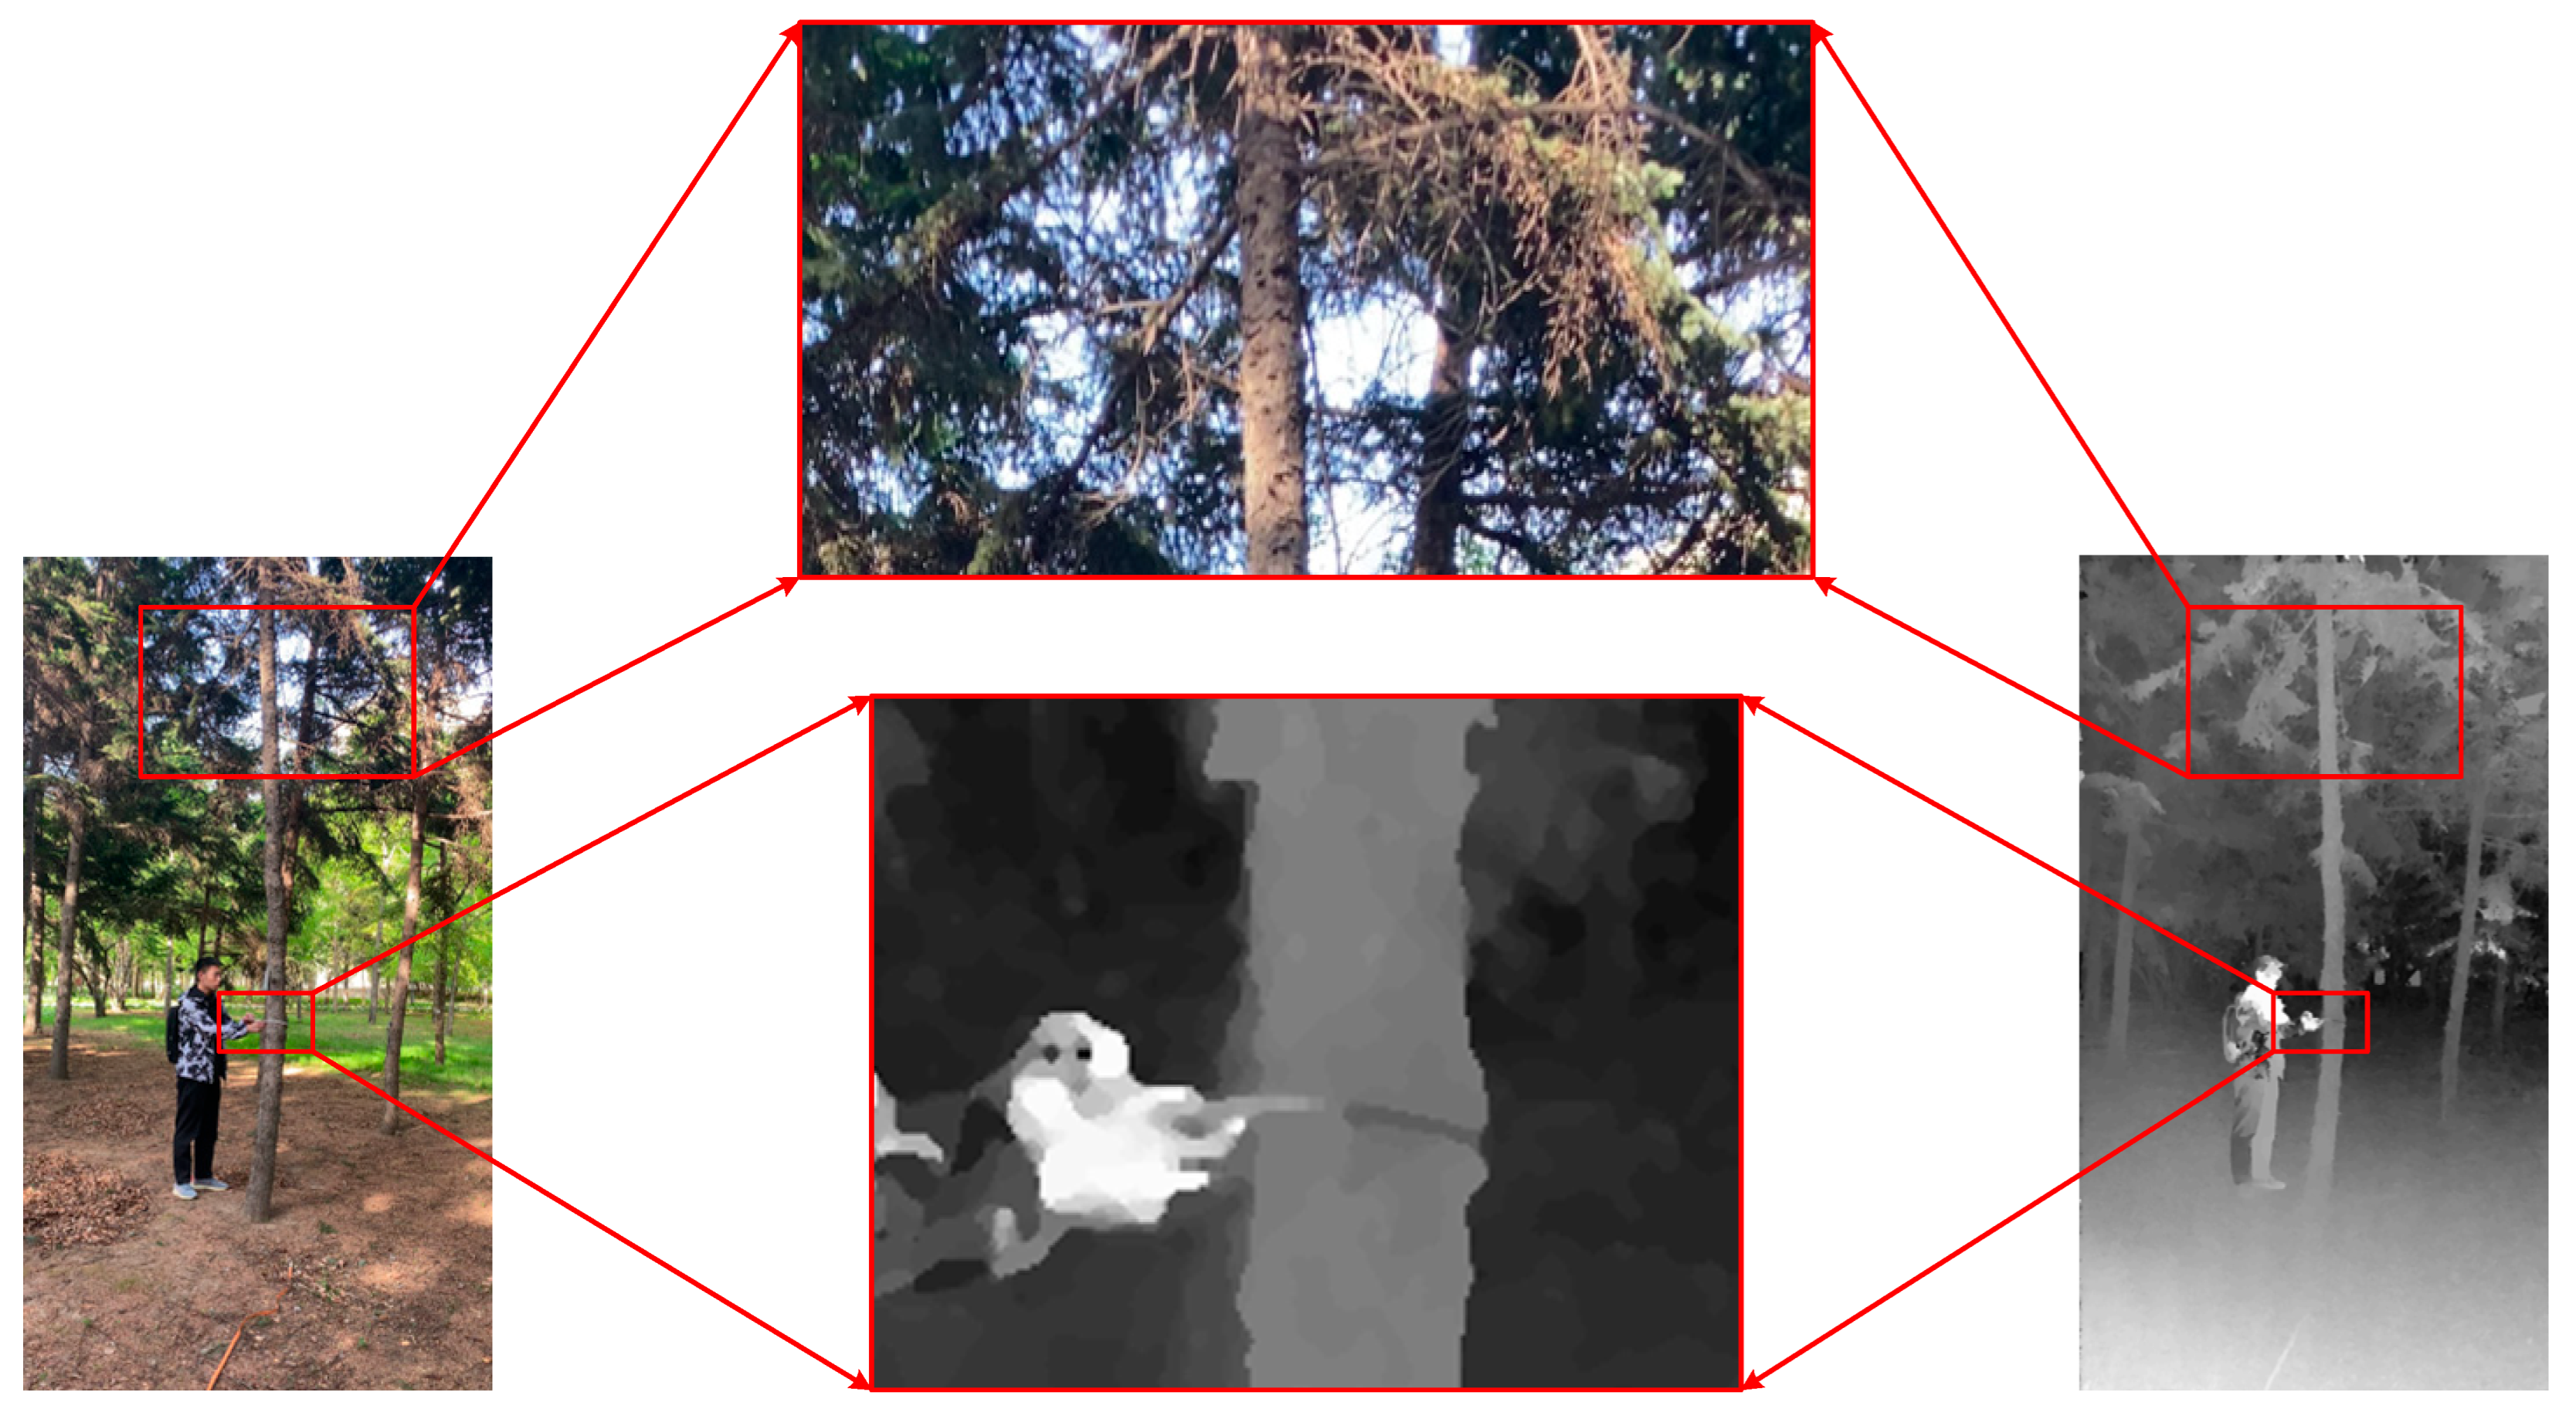
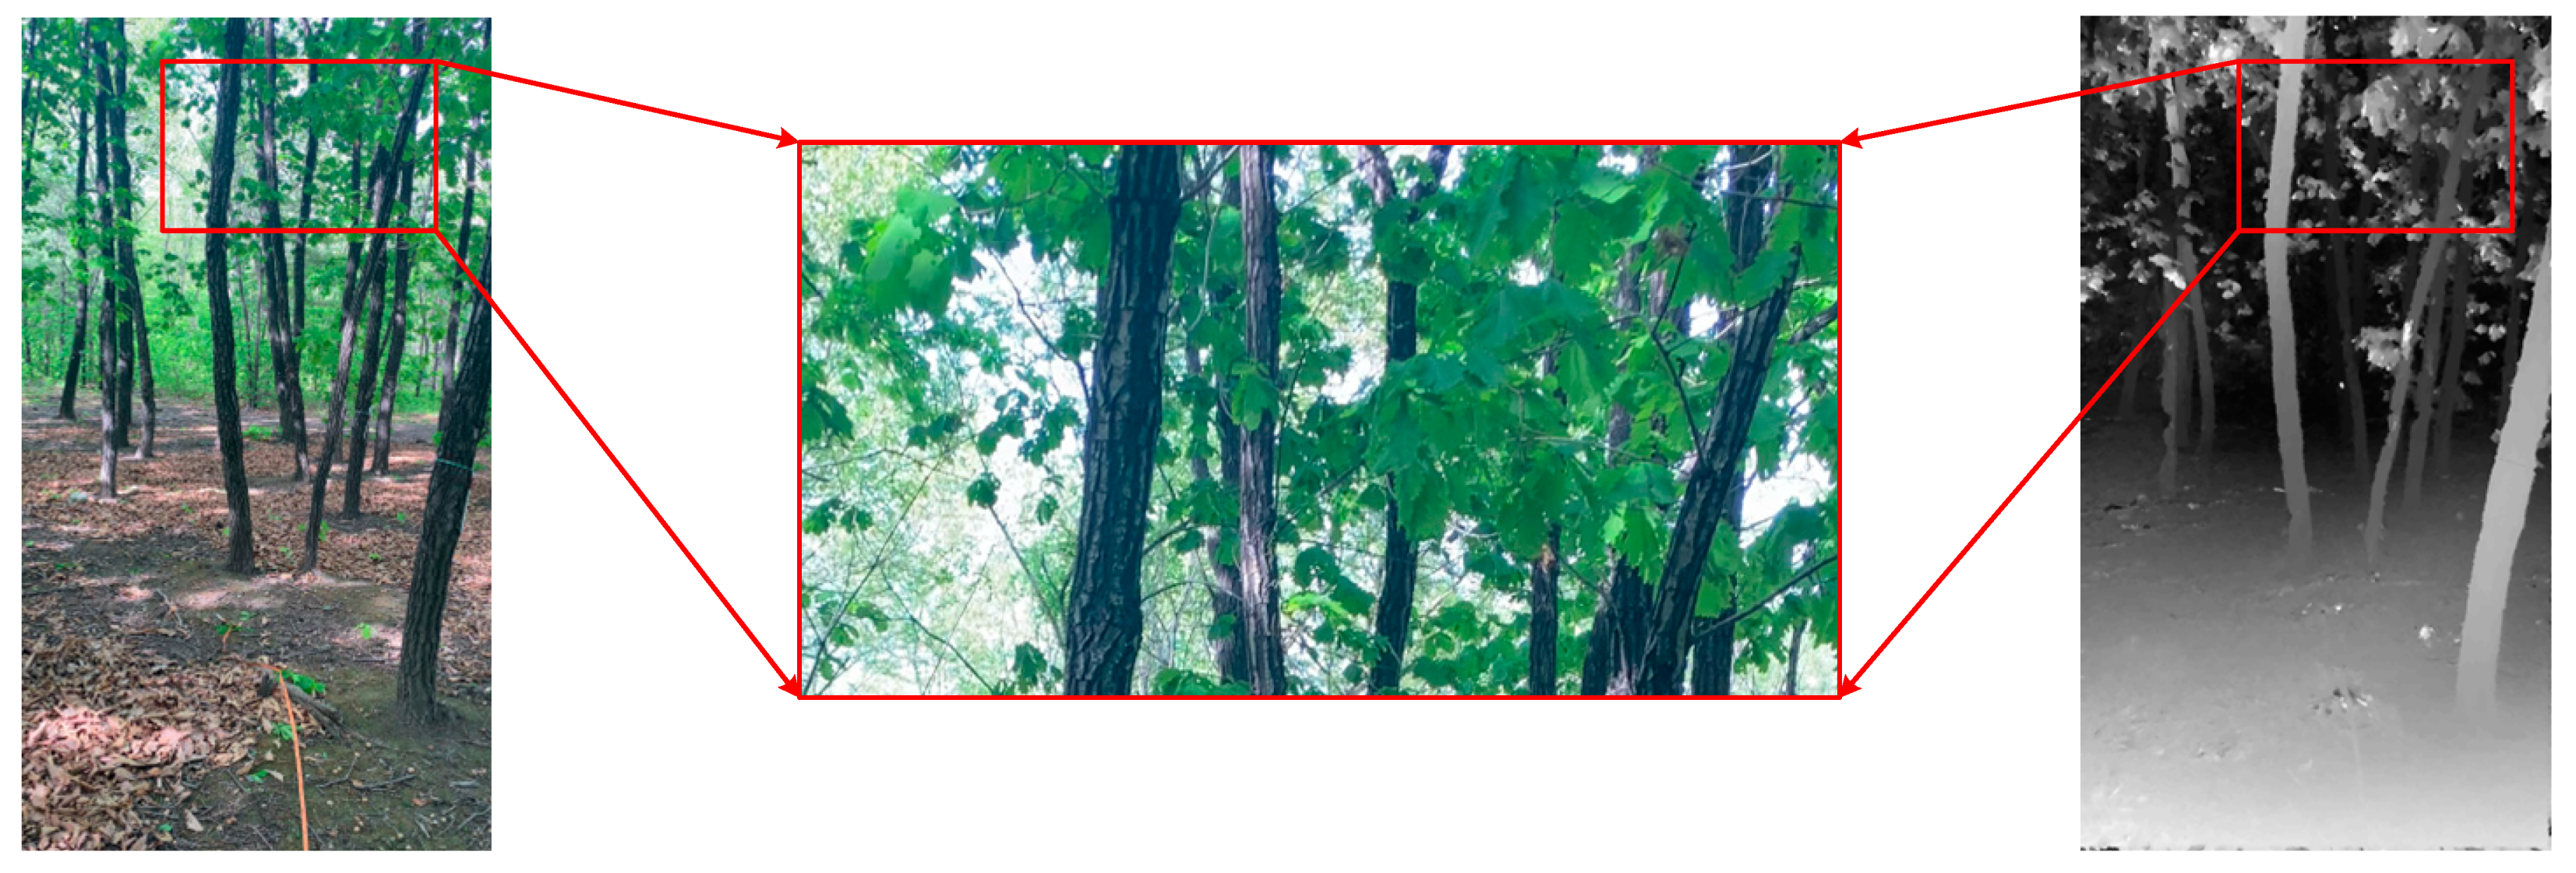
2.4.2. Depth Estimation of Small Motion Clip

In small motion clips, the movement distances between image sequences are minimal, which simplifies feature point matching but also increases the uncertainty in image depth. This results in suboptimal point cloud reconstruction when using traditional SfM algorithms. This results in suboptimal point cloud reconstruction when using traditional SfM algorithms. To address this issue, the study employs the D–U distortion model [38] to correct for camera distortion and reprojection errors. By assuming initial intrinsic parameters and distortion coefficients of the camera, bundle adjustment is used to iteratively minimize reprojection errors. This process refines the camera’s intrinsic and extrinsic parameters, as well as the corresponding 3D spatial coordinates of the feature points.
With the obtained intrinsic and extrinsic parameters, dense stereo matching is performed using the plane sweeping method. The Winner Takes All (WTA) strategy is then applied, which coarsely replaces row-by-row or column-by-column depth values with the best available depth value, creating an initial rough depth map. To further refine this depth map, a color image is used as a guide, ultimately leading to the reconstruction of the point cloud. This approach is designed to improve the accuracy and quality of the reconstructed 3D structure
The study employs the plane sweeping method based on a minimization variance cost function to generate depth images. The plane sweeping method [39] is a widely used algorithm in computer graphics for converting 2D graphics into bitmaps composed of pixel points. The algorithm begins by scanning the graphic from a fixed point along a straight line, creating a bitmap by scanning line by line and determining the position of each pixel point.
In the study, the plane sweeping method is applied for depth estimation and the construction of depth maps. Initially, a plane network is established between the camera and the object, divided into several small blocks, and scanned along the rows or columns of the plane. Depth estimation is performed for each small block, followed by smoothing the depth values to reduce noise. Finally, the depth information from all small blocks is combined to generate a complete depth image.
During the implementation of the plane sweeping method, a variance-based cost function is utilized to measure the depth variation between adjacent pixels. The variance-based cost function is defined as follows:
C = C I + λ C δ u + C δ v
C I u , w k = V A R I 0 k u , , I n 1 k u
C δ u u , w k = V A R δ I 0 k δ u u , , δ I n 1 k δ u u
where C δ u and C δ v are two additional costs introduced to enhance the fidelity of image edge region matching, corresponding to the horizontal and vertical gradient directions, respectively. V A R P represents the variance of the vector P . I i k denotes the k -th scan depth of the i -th image. δ I δ u indicates the image gradient in the horizontal direction. Similar to C δ u , C δ v is calculated using the vertical gradient.

2.4.3. Point Cloud Map Reconstruction and Parameter Extraction

The measurement device utilized in this study is a monocular camera, which generates depth maps containing relative depth values for each pixel. Consequently, scale recovery is required to convert these relative depth values into absolute measurements. Once the scale recovery process is completed, a coordinate system is established, as depicted in Figure 4. Using the pinhole imaging model, the coordinates corresponding to the image points are calculated, enabling the measurement of the tree’s diameter at any specified height. The formulas for the pinhole imaging model used in these calculations are provided below:
X i = L x i c x f x
Y i = L y i c y f y
where X i and Y i represent the offsets of the image pixel from the camera optical axis, x i and y i denote the image pixel coordinates, c x and c y are the coordinates of the image center, f x and f y are the focal lengths, and L m is the distance from the shooting point to the tree to be measured.
In this study, after acquiring the depth map of the corresponding image, the pixel coordinates and depth values from the depth map are transformed into 3D coordinates to generate a corresponding 3D point cloud map. By slicing the point cloud at a height of 1.3 m above the ground and measuring its diameter, the DBH can be determined. Converting the depth map into a 3D point cloud map enhances the visualization and accuracy of the forest model, enabling the direct extraction of tree stem characteristics, DBH, and CBH of the target trees. This method provides more scientific and effective support for the protection and management of forest resources.

2.5. Evaluation Indicators

To verify the accuracy of the DBH and CBH extraction method based on small motion clips under the forest canopy, the DBH is measured using a diameter tape as the measured value, and the CBH is measured using hypsometers as the measured value. The accuracy of the observed values was assessed using five metrics: Bias (BIAS), Root Mean Squared Error (RMSE), Relative Bias (rBIAS), Relative Root Mean Squared Error (rRMSE), and Relative Error ( η ). The calculation formulas are as follows:
B I A S = 1 n i = 1 n d i d i r
r B I A S = B I A S 1 n i = 1 n d i r
R M S E = i = 1 n d i d i r 2 n
r R M S E = R M S E 1 n i = 1 n d i r
η = 1 n i = 1 n d i d i r d i r × 100 %
where d i ,   d i r are the estimated and measured DBH (cm) or CBH (m) of the i -th tree, respectively.

3. Results

According to the method proposed in the paper for extracting DBH and CBH from small motion clips, the final point cloud results are displayed in Figure 5. The process begins by converting each frame of the small motion clip into images, with the original images being transformed into grayscale, as shown in Figure 5b. Next, the proposed histogram equalization preprocessing algorithm is applied to perform grayscale equalization on the images, as depicted in Figure 5c. Uniform feature point extraction is achieved through the feature point extraction and quadtree uniformization algorithm, as illustrated in Figure 5d,e. Subsequently, the D–U model is employed to generate the depth map. The initial rough depth map is obtained using the WTA strategy, as shown in Figure 5f, and unreliable depth values are filtered out, as indicated in Figure 5g. The original color image is then used as a guide image to further refine the depth map, as seen in Figure 5h. Ultimately, a detailed depth map and the corresponding point cloud are generated, as shown in Figure 5i. The DBH and CBH measurement results are obtained by performing elevation slicing on the point cloud.

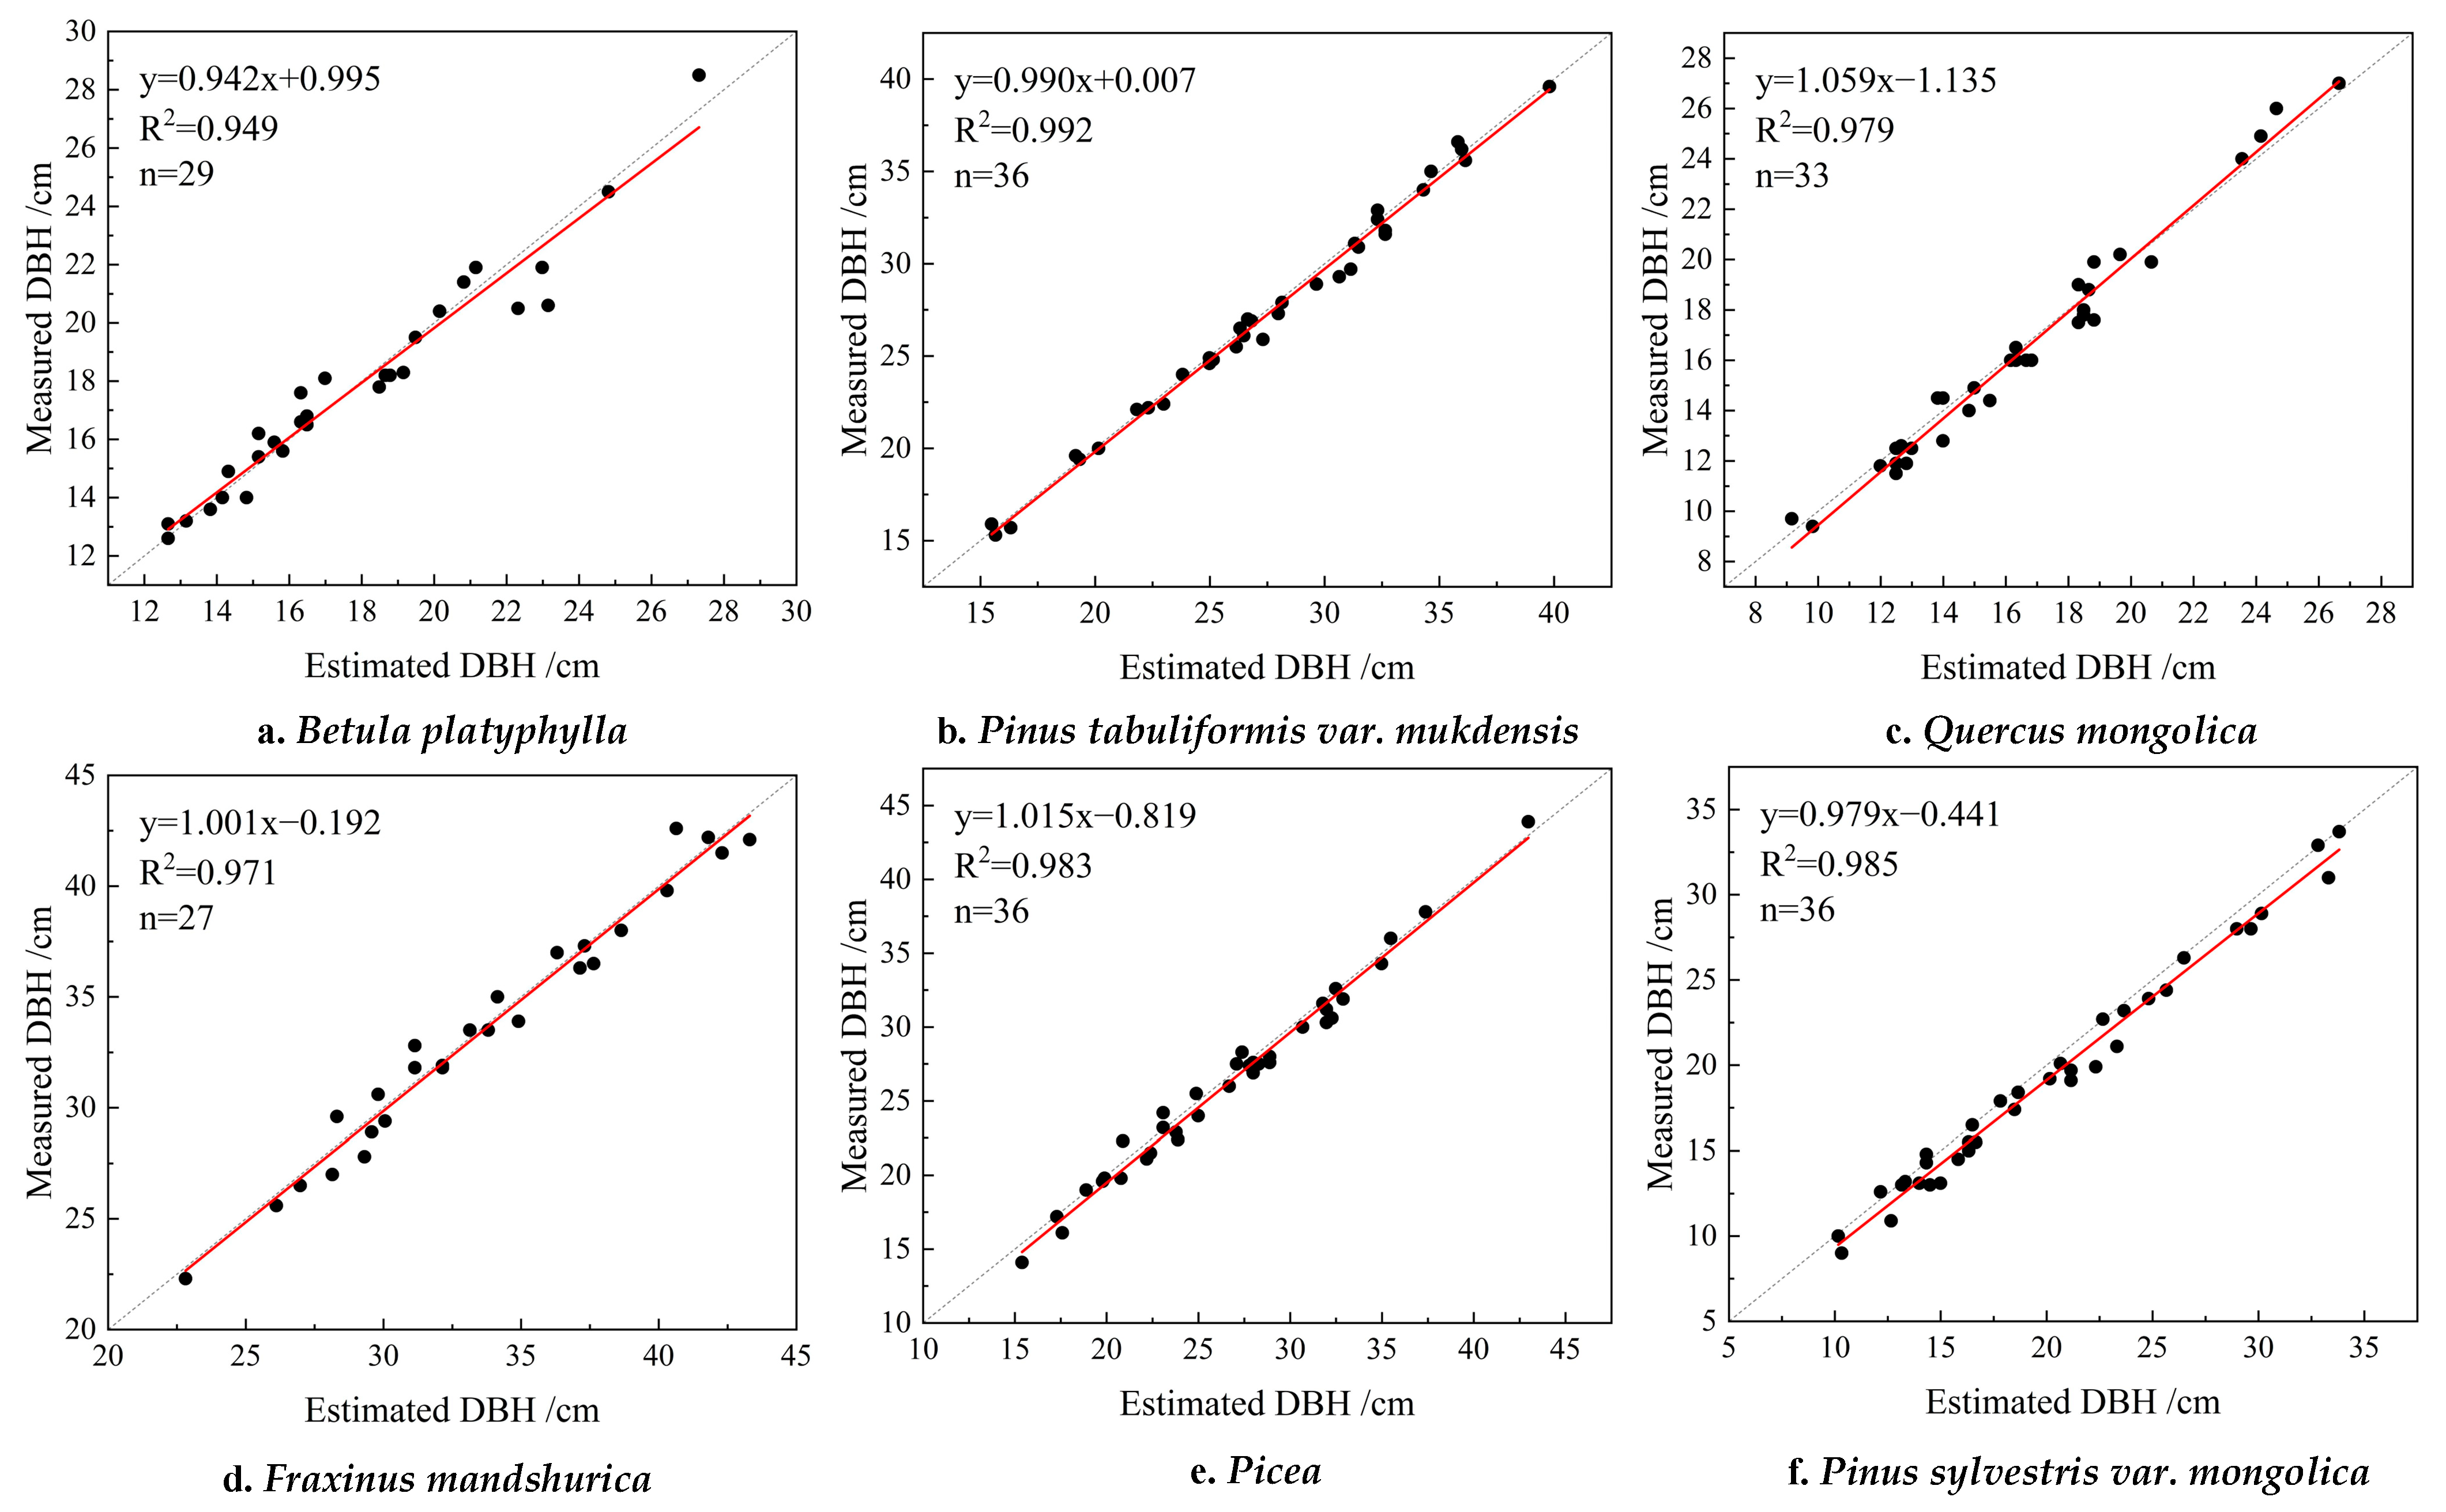
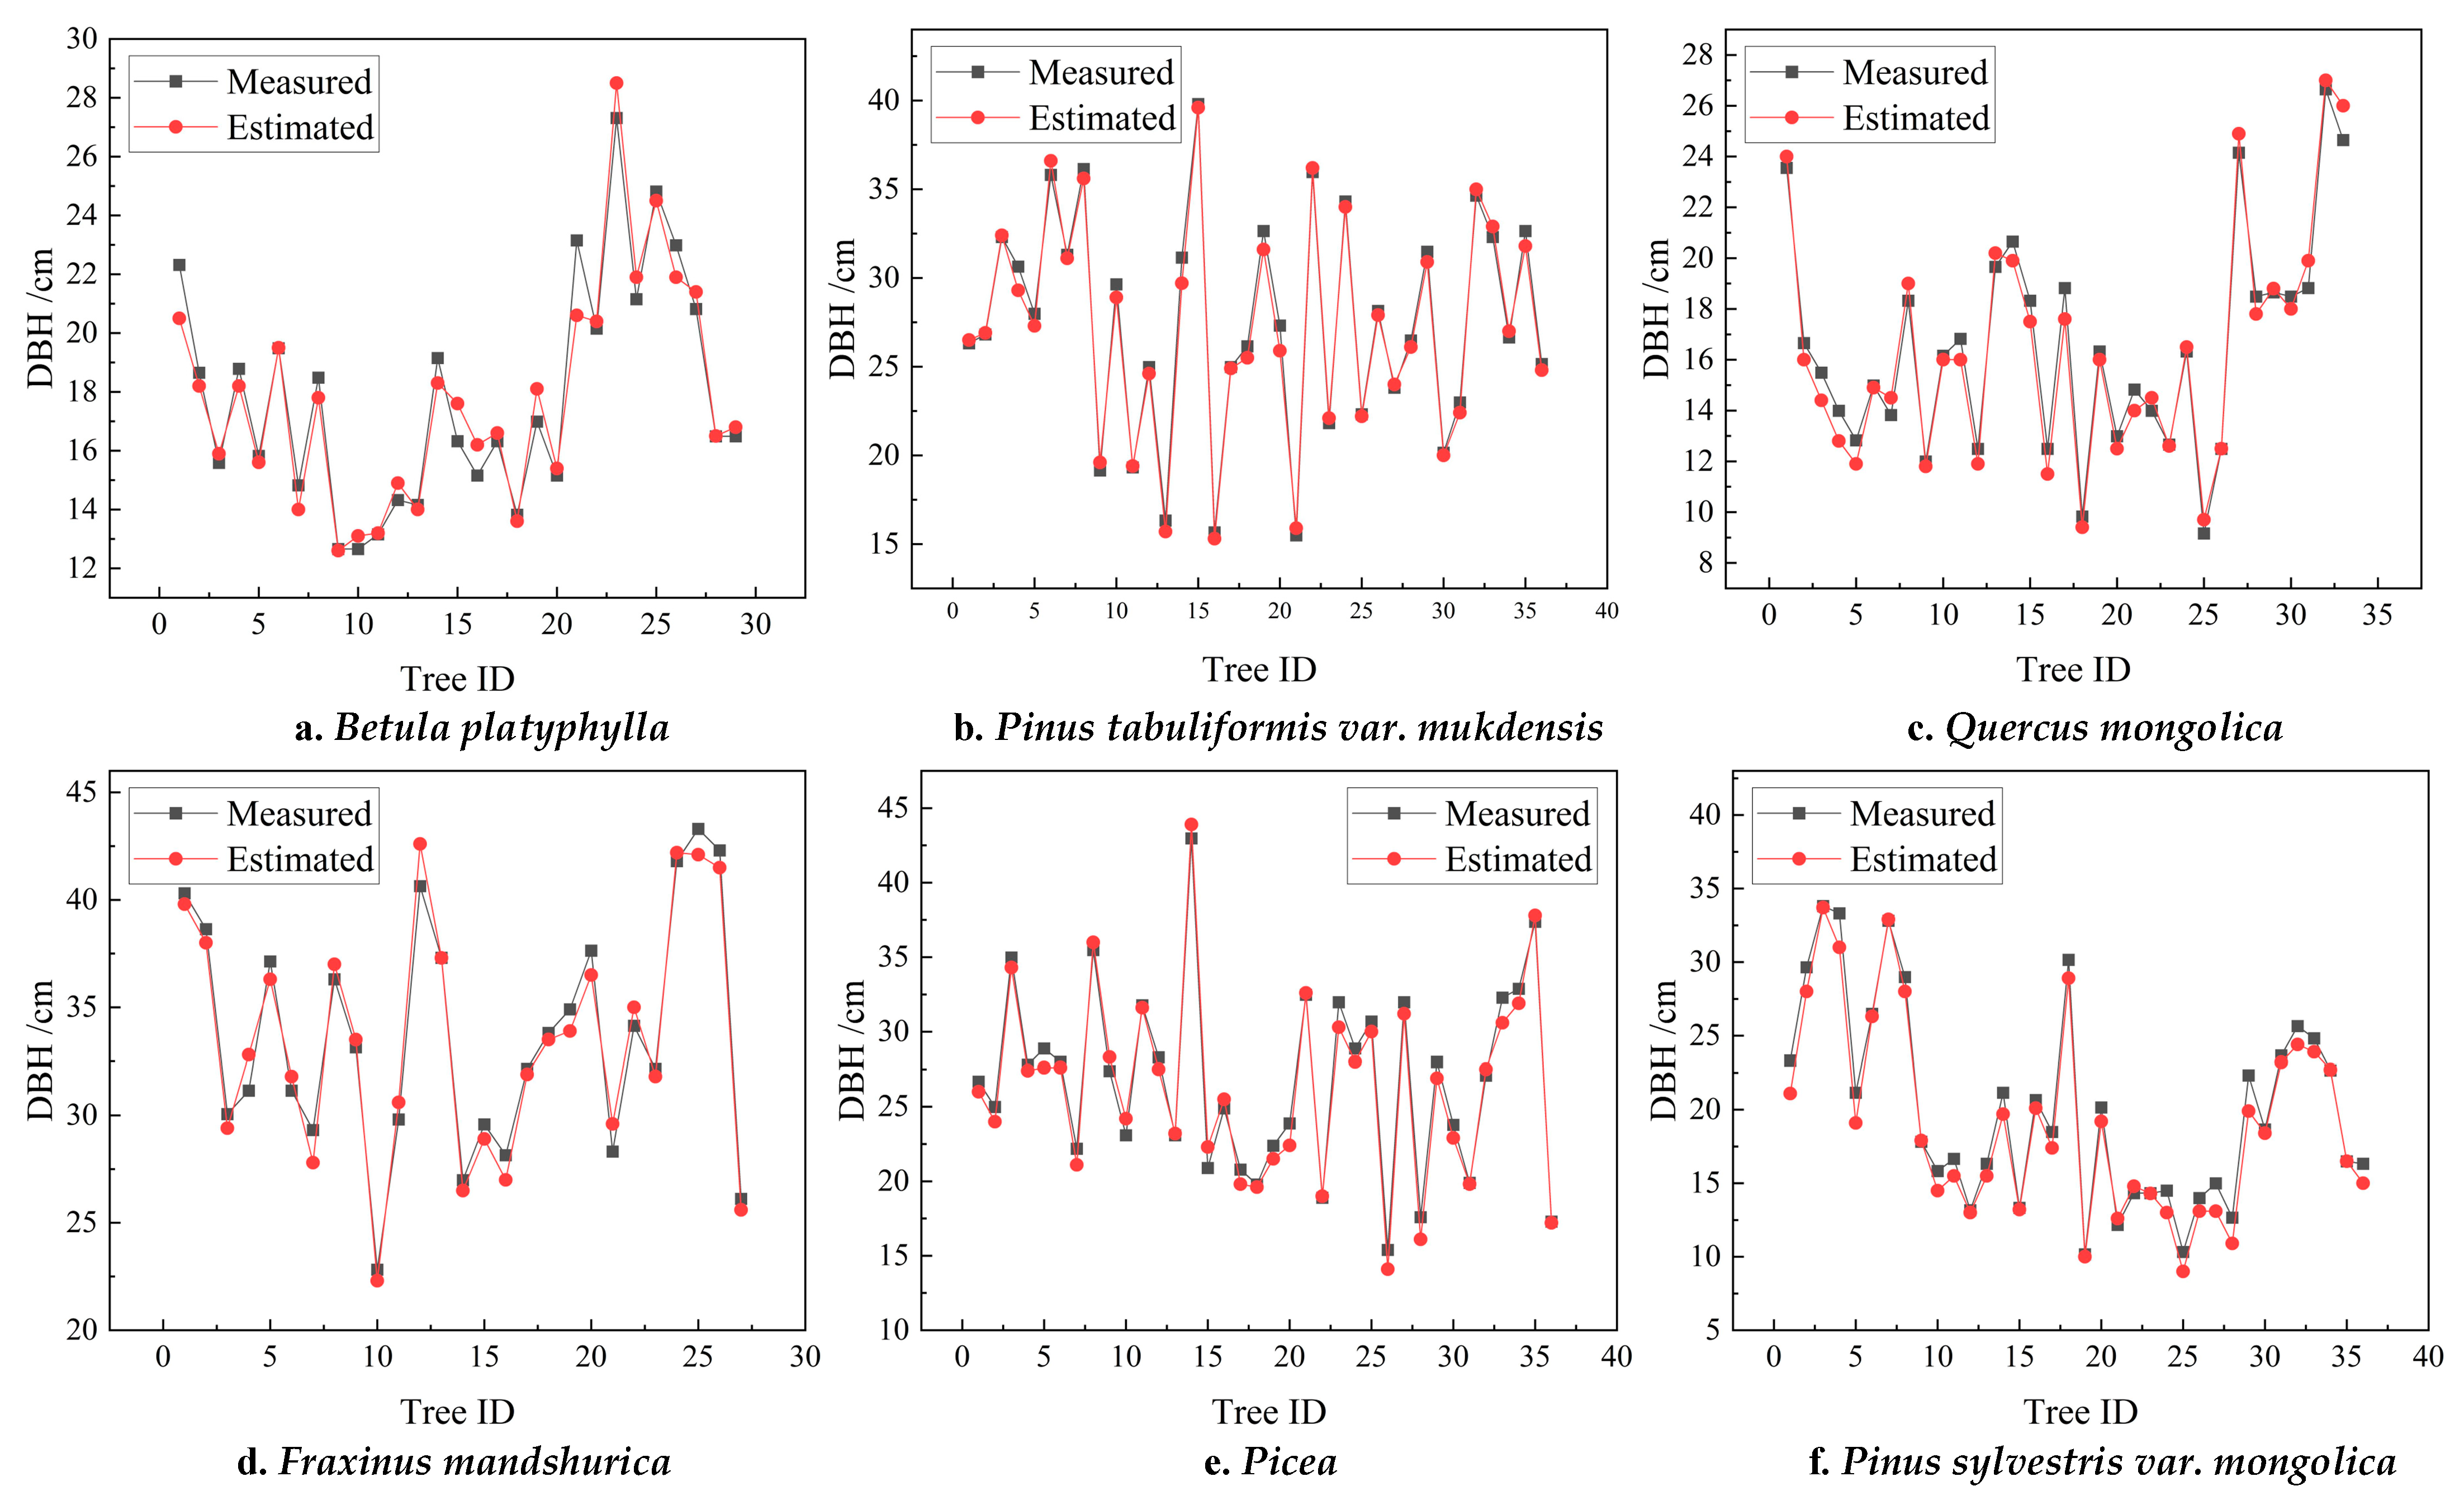
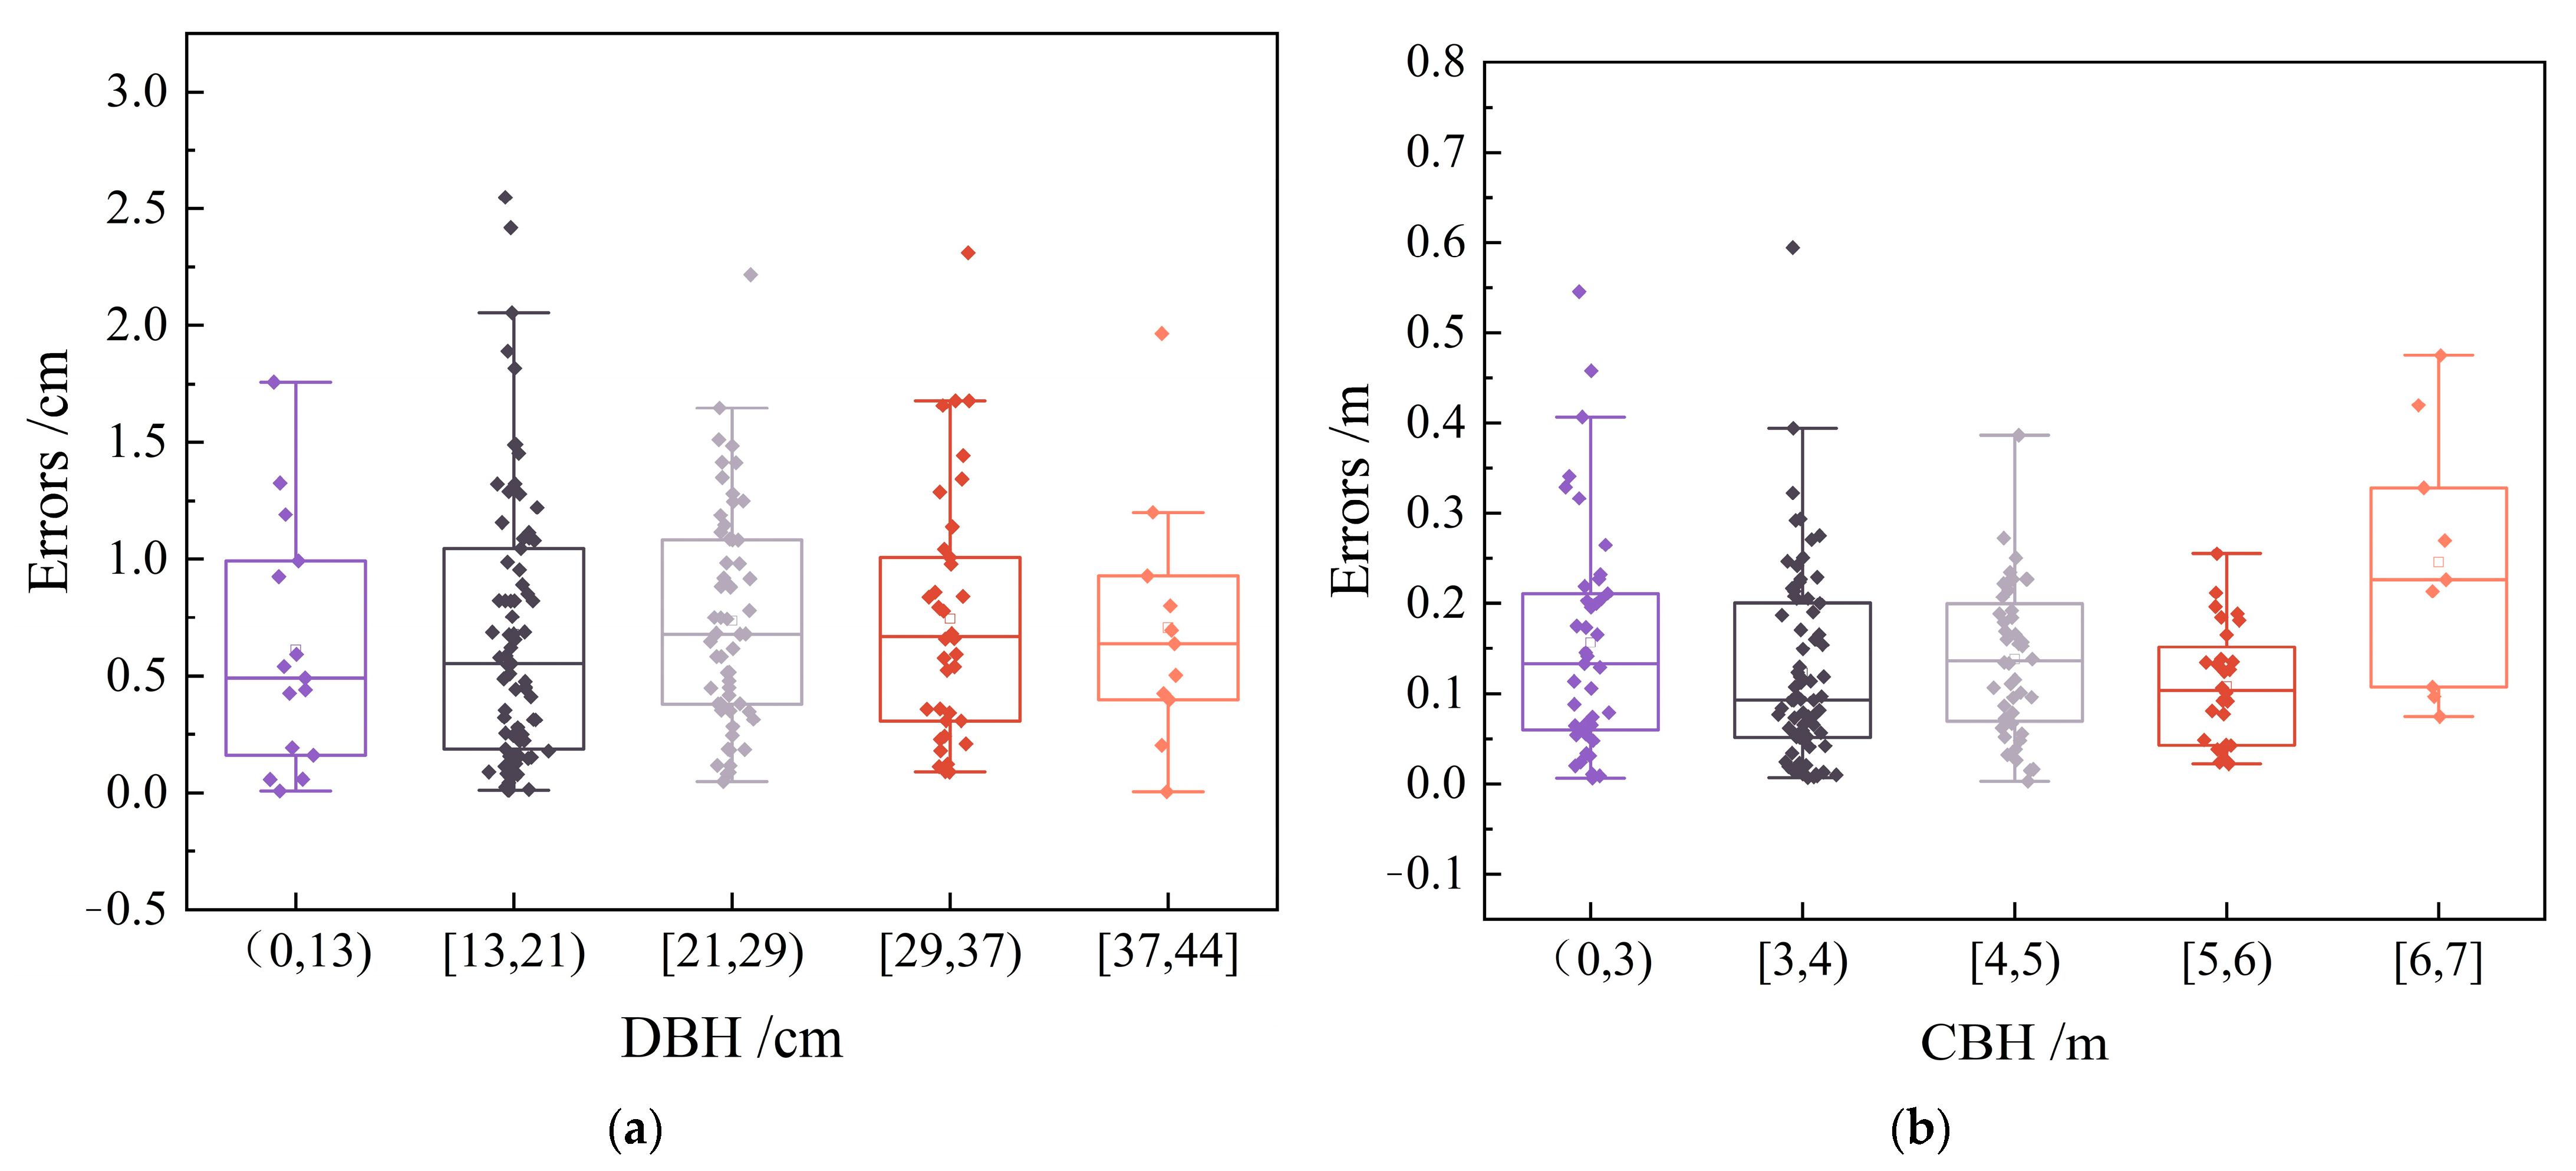
3.1. Accuracy Assessment and Error Analysis of DBH Estimation

In the study, the DBH of standing trees was extracted from each set of small motion clips. A linear fitting analysis was conducted between the measured DBH values ( x ) and the DBH values ( y ) extracted from point clouds. The scatter plot illustrating the fitting results is presented in Figure 6.
The R 2 values for these sets of one-dimensional linear regression models are 0.949, 0.992, 0.979, 0.971, 0.983, and 0.985, indicating a strong correlation between the measured DBH data and the DBH data extracted from point clouds. The slopes of the regression models are 0.942, 0.990, 1.059, 1.001, 1.015, 0.979, with corresponding intercepts of 0.995, 0.007, −1.135, −0.192, −0.819, −0.441, respectively. These results suggest that the DBH values obtained using the small motion clips extraction method are consistent with those measured using traditional standard tools, within an acceptable margin of error.
The accuracy analysis of the extracted DBH values for plots 1 to 6 is presented in Table 3 and Figure 7. The RMSE values of the estimated DBH for the six plots are 0.85 cm, 0.60 cm, 0.70 cm, 0.90 cm, 0.91 cm, and 1.18 cm, with corresponding relative errors of 3.39%, 1.81%, 3.89%, 2.38%, 3.19%, and 5.42%, respectively. As shown in Figure 7, the close alignment between the measured and estimated accuracies demonstrates that the DBH extraction method proposed in this study is robust against variations in tree species, lighting conditions, and understory environments. This robustness ensures the method’s adaptability to different tree species, varying brightness conditions, and diverse understory settings.

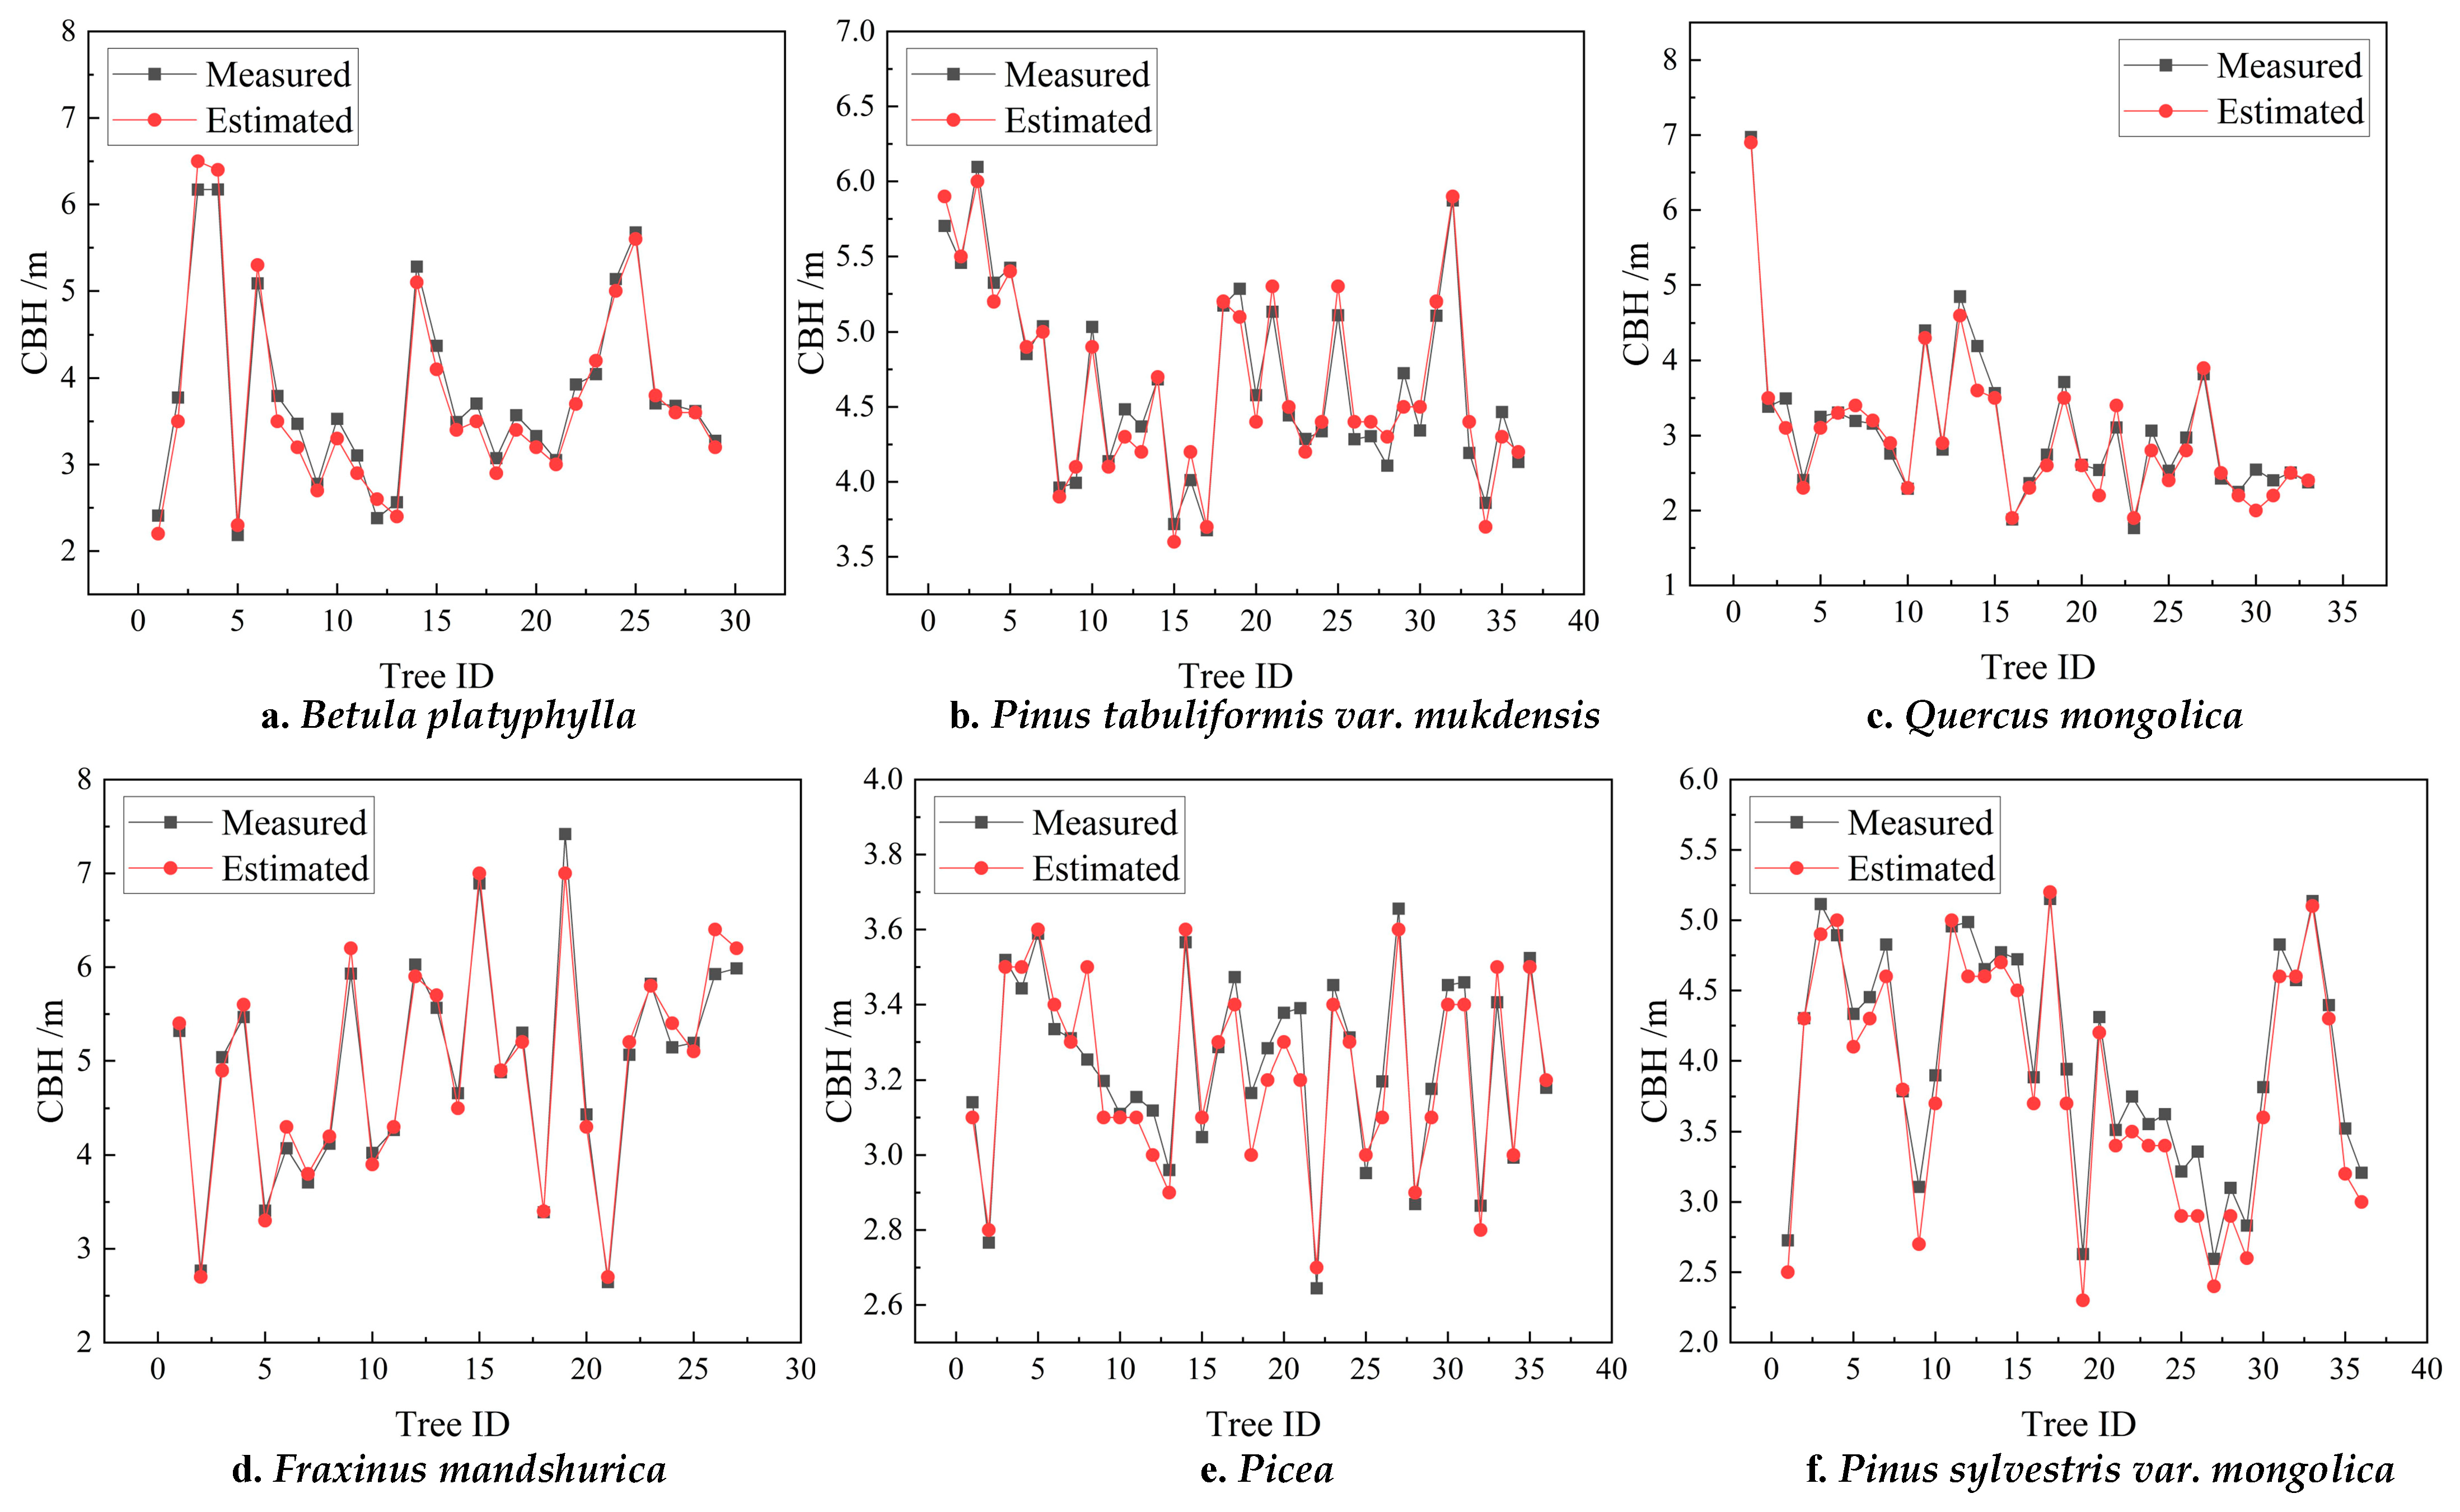
3.2. Accuracy Assessment and Error Analysis of CBH Estimation

In the study, the CBH of standing trees was extracted from each set of small motion clips. A linear fitting analysis was conducted between the measured CBH values ( x ) and the CBH values ( y ) extracted from point clouds. The scatter plot illustrating the fitting results is presented in Figure 8.
The R 2 values for these sets of one-dimensional linear regression models are 0.979, 0.956, 0.959, 0.976, 0.898, and 0.981, indicating a strong correlation between the measured CBH data and the CBH data extracted from point clouds. The slopes of the regression models are 0.942, 0.990, 1.059, 1.001, 1.015, and 0.979, with corresponding intercepts of −0.267, 0.032, 0.034, 0.976, 0.898, and 0.981, respectively. These results suggest that the CBH values obtained using the small motion clips extraction method are consistent with those measured using traditional standard tools, within an acceptable margin of error.
The accuracy analysis of the extracted CBH values for plots 1 to 6 is presented in Table 4 and Figure 9. The RMSE values of the estimated CBH for the six plots are 0.19 m, 0.13 m, 0.21 m, 0.18 m, 0.08 m, and 0.21 m, with corresponding relative errors of 4.87%, 2.48%, 5.50%, 2.74%, 1.97%, and 5.58%, respectively. As shown in Figure 9, the close alignment between the measured and estimated accuracies demonstrates that the CBH extraction method proposed in this study is robust against variations in tree species, lighting conditions, and understory environments. This robustness ensures the method’s adaptability to different tree species, varying brightness conditions, and diverse understory settings.

4. Discussion

4.1. Impact of Tree Species Characteristics on the Accuracy of DBH and CBH Estimation and Error Analysis

Different characteristics of different tree species can lead to deviations in the estimation of DBH. The trunk of the Pinus sylvestris var. mongolica is deeply fissured with scales, and the reconstructed trunk depth map appears serrated (as shown in Figure 10). When measuring the DBH, if the measurement is taken at a depression, the value will be lower and, if taken at a protrusion, the value will be higher. Therefore, there is some error in the DBH extraction algorithm for Pinus sylvestris var. mongolica forests.
In the estimation of CBH, the errors were most significant in sample plot 6 (Pinus sylvestris var. mongolica) and sample plot 3 (Quercus mongolica). This is primarily due to the branches’ tendency to extend in a specific direction, making the photo-taking angle critical. If the branches are concealed directly behind the trunk, the algorithm’s extracted CBH can differ from the actual measured height, leading to large errors in CBH estimation. Additionally, the broadleaf canopy of the Quercus mongolica is prone to occlusion, causing misidentification (as shown in Figure 11). In contrast, the Pinus sylvestris var. mongolica canopy is slender and elongated, with branches frequently interlacing (as shown in Figure 10). Although the depth map can analyze the branches’ depth differences to identify the corresponding trees, the photo-taking angle remains crucial. Therefore, the errors in CBH extraction are significantly influenced by the characteristics of Pinus sylvestris var. mongolica and Quercus mongolica forests.
Overall, the relative error in DBH and CBH for different tree species remains within a controllable range, and the estimated DBH and CBH values are still reliable.

4.2. Error Distribution and Key Influencing Factors in DBH and CBH Estimation

Additionally, we analyzed the errors associated with different ranges of DBH and CBH, as shown in Figure 12. The point cloud obtained from small motion clip restoration is not complete; instead, the cross-sections of the tree trunks appear as semicircles, with the diameter of these semicircles representing the DBH. The estimation error tends to be smaller for trees with smaller DBH. This phenomenon can be attributed to the uneven growth of the tree trunk, influenced by factors such as sunlight exposure and soil conditions, which leads to an irregular circular shape. The larger the DBH, the longer the tree has been growing, making this irregularity more pronounced (Figure 12a).
The estimation errors are more significant for trees with either too low or too high branch height. For trees with low branches, the branch heights can easily blend with the understory shrubs, making them difficult to distinguish in the reconstructed point cloud, which leads to larger errors. On the other hand, trees with high branches often have canopies that entangle with those of nearby trees, also resulting in increased errors (Figure 12b).
The proposed method in the study achieves an accuracy close to the traditional forestry measurement standards. Compared to the SfM algorithm, which requires multi-angle photography to generate a complete point cloud map of the tree, the DBH and CBH extraction algorithm proposed in the study is simpler in terms of both operation and computational complexity.

4.3. Comparison of DBH Extraction Algorithm Accuracy and Efficiency with Existing Methods

Table 5 compares the extraction accuracy and processing time of various photogrammetric methods for extracting tree DBH, including the algorithm proposed in the paper. The results reveal that the average relative error of the DBH extraction algorithm proposed in the study (3.35%) is lower than that of Sun’s [40] spatial forward intersection algorithm (10.0%), Wang et al.’s [41] SfM algorithm (5.4%), and Su et al.’s [28] SLAM algorithm (3.59%). This demonstrates that the proposed algorithm achieves comparable or even superior accuracy in DBH extraction compared to other similar methods.
Compared to other similar algorithms, the DBH extraction method proposed in the paper is simpler in terms of operational procedures and computational complexity, while also excelling in both image acquisition and processing. Regarding image acquisition time, the algorithm improves the feature point extraction method, enhancing its robustness to changes in image brightness and increasing the success rate of feature point matching. Additionally, the algorithm uses small motion clips which do not require auxiliary equipment [28] or extensive camera movement for multi-angle shooting [41]. The image acquisition takes only 1–2 s, making the process highly efficient and straightforward.
In terms of image processing, the use of small motion clips enables depth map calculation by extracting features, which reduces the need for extensive computational work typically required during post-processing. The processing time for each tree image is approximately 16 s, making it more efficient compared to the SfM algorithm. This demonstrates the effectiveness of the proposed method in reducing both operational complexity and processing time.

4.4. Comparison with LiDAR-Based Methods

In order to provide a comprehensive evaluation of our proposed method, we have compared its performance with that of LiDAR-based approaches, which are widely used in tree studies. This comparison is crucial for understanding the strengths and limitations of our method relative to LiDAR.
In terms of advantages, our method offers notable cost-effectiveness. The image acquisition requires only a camera or a mobile phone with a camera, which is considerably less expensive and more convenient than a LiDAR sensor [42], making it more feasible for large-scale forest monitoring projects with limited budgets. Additionally, the data processing for the image-based method is relatively straightforward, whereas LiDAR typically requires complex algorithms to handle the large volumes of point cloud data [43].
However, our method also has certain disadvantages when compared to LiDAR. One limitation is accuracy, especially in dense or cluttered forest environments, where LiDAR’s ability is to penetrate vegetation and generate detailed point clouds [44]. Furthermore, LiDAR systems generally have a longer effective range compared to cameras, which restricts the applicability of our method in larger or more distant forest plots [45].

5. Conclusions

The method proposed in the paper for extracting DBH and CBH in forests using small motion clips allows for the rapid and accurate measurement of these parameters. By comparing the DBH and CBH extraction results across 6 sample plots with different tree species, the study analyzed and discussed the sources of errors in the proposed algorithm. The conclusions are as follows:
(1)
To address the issues of large stereo matching errors, long acquisition times and extensive computational demands for generating 3D point cloud maps in traditional CRP, small motion clips are employed to estimate image depth, and the feature point extraction algorithm is optimized to reduce the mismatch rate of feature points. As a result, the relative error in DBH extraction is reduced to 3.35%, while the relative error in CBH extraction is 3.86%, achieving accuracy comparable to similar algorithms.
(2)
Different tree species can influence errors in DBH measurement. The DBH relative errors across different sample plots ranged from 1.81% to 5.42%, with Plot 6 exhibiting the highest accuracy due to the fact that the trunk of camphor pine has deep, scaly fissures, leading to a jagged depth map of the reconstructed trunk. The overall error trend indicates a correlation between tree species and extraction accuracy.
(3)
The estimation error of CBH is closely related to branch height variability. When branches are too low, they merge with understory shrubs, making them difficult to distinguish. When branches are too high, they overlap with nearby tree canopies, complicating segmentation. Both cases increase estimation errors, especially in plots with dense vegetation.
The proposed method has several practical applications. It can be used in large-scale forest monitoring projects to quickly and cost-effectively assess parameters, offering a more accessible alternative to expensive equipment like LiDAR. This makes it valuable for forest resource managers, who need frequent updates on forest conditions. Furthermore, it can be integrated with UAVs or handheld devices equipped with depth cameras, providing a flexible solution for data collection in remote or hard-to-access forest areas.
The algorithm proposed in this paper demonstrates the potential of monocular vision technology in forestry applications. However, compared to the technical regulations for continuous forest inventory [46], there is still the need for improvement in the accuracy of forest stand structure parameter measurements. In future research, to address the errors in DBH and CBH measurements using a monocular vision sensor, we plan to explore the integration of single-line or multi-line LiDAR with cameras. By integrating multiple sensors for joint measurements, the algorithm’s errors can be reduced, thereby enhancing both the feasibility and accuracy of the measurement approach.

Author Contributions

Conceptualization, S.Y., B.Y. and Y.X.; Date curation, S.Y.; Formal analysis, S.Y.; Funding acquisition, Y.X. and S.Y.; Investigation, S.Y., D.W., X.C. and J.W.; Methodology, S.Y. and B.Y.; Project administration, Y.X. and S.Y.; Writing—original draft, S.Y.; Writing—review and editing, S.Y., B.Y. and Y.X. All authors have read and agreed to the published version of the manuscript.

Funding

This work is supported by the National Key R&D Program of China (Grant Number: 2023YFD2201701-2), the National Key R&D Program of China (Grant Number: 2021YFE0117700-6), the Fundamental Research Funds for the Central Universities, Northeast Forestry University (Grant Number: 2572021AW50), and the Innovation Foundation for Doctoral Program of Forestry Engineering of Northeast Forestry University (Grant Number: LYGC202113).

Data Availability Statement

Data are contained within the article.

Acknowledgments

We thank the editor and anonymous reviewers for reviewing our paper.

Conflicts of Interest

The authors declare no conflicts of interest.

References

  1. Ge, J.; Zhang, Z.; Lin, B. Towards Carbon Neutrality: How Much Do Forest Carbon Sinks Cost in China? Environ. Impact Assess. Rev. 2023, 98, 106949. [Google Scholar] [CrossRef]
  2. Kurz, W.A.; Dymond, C.C.; Stinson, G.; Rampley, G.J.; Neilson, E.T.; Carroll, A.L.; Ebata, T.; Safranyik, L. Mountain Pine Beetle and Forest Carbon Feedback to Climate Change. Nature 2008, 452, 987–990. [Google Scholar] [CrossRef] [PubMed]
  3. Clawson, M. Forests in the Long Sweep of American History. Science 1979, 204, 1168–1174. [Google Scholar] [CrossRef]
  4. Montoya, O.; Icasio-Hernández, O.; Salas, J. TreeTool: A Tool for Detecting Trees and Estimating Their DBH Using Forest Point Clouds. SoftwareX 2021, 16, 100889. [Google Scholar] [CrossRef]
  5. Liu, G.; Wang, J.; Dong, P.; Chen, Y.; Liu, Z. Estimating Individual Tree Height and Diameter at Breast Height (DBH) from Terrestrial Laser Scanning (TLS) Data at Plot Level. Forests 2018, 9, 398. [Google Scholar] [CrossRef]
  6. Koreň, M.; Scheer, L.; Sedmák, R.; Fabrika, M. Evaluation of Tree Stump Measurement Methods for Estimating Diameter at Breast Height and Tree Height. Int. J. Appl. Earth Obs. Geoinf. 2024, 129, 103828. [Google Scholar] [CrossRef]
  7. Wang, B.; Xu, G.; Li, Z.; Cheng, Y.; Gu, F.; Xu, M.; Zhang, Y. Carbon Pools in Forest Systems and New Estimation Based on an Investigation of Carbon Sequestration. J. Environ. Manag. 2024, 360, 121124. [Google Scholar] [CrossRef]
  8. Guenther, M.; Heenkenda, M.K.; Morris, D.; Leblon, B. Tree Diameter at Breast Height (DBH) Estimation Using an iPad Pro LiDAR Scanner: A Case Study in Boreal Forests, Ontario, Canada. Forests 2024, 15, 214. [Google Scholar] [CrossRef]
  9. Shi, Y.; Wang, S.; Zhou, S.; Kamruzzaman, M.M. Study on Modeling Method of Forest Tree Image Recognition Based on CCD and Theodolite. IEEE Access 2020, 8, 159067–159076. [Google Scholar] [CrossRef]
  10. Cova, G.R.; Prichard, S.J.; Rowell, E.; Drye, B.; Eagle, P.; Kennedy, M.C.; Nemens, D.G. Evaluating Close-Range Photogrammetry for 3D Understory Fuel Characterization and Biomass Prediction in Pine Forests. Remote Sens. 2023, 15, 4837. [Google Scholar] [CrossRef]
  11. Yan, X.; Chai, G.; Han, X.; Lei, L.; Wang, G.; Jia, X.; Zhang, X. SA-Pmnet: Utilizing Close-Range Photogrammetry Combined with Image Enhancement and Self-Attention Mechanisms for 3D Reconstruction of Forests. Remote Sens. 2024, 16, 416. [Google Scholar] [CrossRef]
  12. Kuelka, K.; Surov, P. Mathematically Optimized Trajectory for Terrestrial Close-Range Photogrammetric 3D Reconstruction of Forest Stands. ISPRS J. Photogramm. Remote Sens. 2021, 178, 259–281. [Google Scholar] [CrossRef]
  13. Bayati, H.; Najafi, A.; Vahidi, J.; Jalali, S.G. 3D Reconstruction of Uneven-Aged Forest in Single Tree Scale Using Digital Camera and SfM-MVS Technique. Scand. J. For. Res. 2021, 36, 210–220. [Google Scholar] [CrossRef]
  14. Xu, Z.; Shen, X.; Cao, L. Extraction of Forest Structural Parameters by the Comparison of Structure from Motion (SfM) and Backpack Laser Scanning (BLS) Point Clouds. Remote Sens. 2023, 15, 2144. [Google Scholar] [CrossRef]
  15. Hu, T.; Sun, Y.; Jia, W.; Li, D.; Zou, M.; Zhang, M. Study on the Estimation of Forest Volume Based on Multi-Source Data. Sensors 2021, 21, 7796. [Google Scholar] [CrossRef]
  16. Popescu, S.C. Estimating Biomass of Individual Pine Trees Using Airborne Lidar. Biomass Bioenergy 2007, 31, 646–655. [Google Scholar] [CrossRef]
  17. Bucksch, A.; Lindenbergh, R.; Abd Rahman, M.Z.; Menenti, M. Breast Height Diameter Estimation from High-Density Airborne LiDAR Data. Geosci. Remote Sens. Lett. 2014, 11, 1056–1060. [Google Scholar] [CrossRef]
  18. Bu, G.; Wang, P. Adaptive Circle-Ellipse Fitting Method for Estimating Tree Diameter Based on Single Terrestrial Laser Scanning. J. Appl. Remote Sens. 2016, 10, 026040. [Google Scholar] [CrossRef]
  19. Zhou, S.; Kang, F.; Li, W.; Kan, J.; Zheng, Y.; He, G. Extracting Diameter at Breast Height with a Handheld Mobile LiDAR System in an Outdoor Environment. Sensors 2019, 19, 3212. [Google Scholar] [CrossRef]
  20. Corte, A.P.D.; Souza, D.V.; Rex, F.E.; Sanquetta, C.R.; Broadbent, E.N. Forest Inventory with High-Density UAV-Lidar: Machine Learning Approaches for Predicting Individual Tree Attributes. Comput. Electron. Agric. 2020, 179, 105815. [Google Scholar] [CrossRef]
  21. Kaviriri, D.K.; Liu, H.; Zhao, X. Estimation of Genetic Parameters and Wood Yield Selection Index in a Clonal Trial of Korean Pine (Pinus koraiensis) in Northeastern China. Sustainability 2021, 13, 4167. [Google Scholar] [CrossRef]
  22. Moreira, B.M.; Goyanes, G.; Pina, P.; Vassilev, O.; Heleno, S. Assessment of the Influence of Survey Design and Processing Choices on the Accuracy of Tree Diameter at Breast Height (DBH) Measurements Using UAV-Based Photogrammetry. Drones 2021, 5, 43. [Google Scholar] [CrossRef]
  23. Mokroš, M.; Liang, X.; Surový, P.; Valent, P.; Čerňava, J.; Chudý, F.; Tunák, D.; Saloň, Š.; Merganič, J. Evaluation of Close-Range Photogrammetry Image Collection Methods for Estimating Tree Diameters. ISPRS Int. J. Geo-Inf. 2018, 7, 93. [Google Scholar] [CrossRef]
  24. Popescu, S.C.; Zhao, K. A Voxel-Based Lidar Method for Estimating Crown Base Height for Deciduous and Pine Trees. Remote Sens. Environ. 2008, 112, 767–781. [Google Scholar] [CrossRef]
  25. Vauhkonen, J. Estimating Crown Base Height for Scots Pine by Means of the 3D Geometry of Airborne Laser Scanning Data. Int. J. Remote Sens. 2010, 31, 1213–1226. [Google Scholar] [CrossRef]
  26. Fu, L.; Sun, H.; Sharma, R.P.; Lei, Y.; Zhang, H.; Tang, S. Nonlinear Mixed-Effects Crown Width Models for Individual Trees of Chinese Fir (Cunninghamia lanceolata) in South-Central China. For. Ecol. Manag. 2013, 302, 210–220. [Google Scholar] [CrossRef]
  27. Clark, N.A.; Wynne, R.H.; Schmoldt, D.L.; Winn, M. An Assessment of the Utility of a Non-Metric Digital Camera for Measuring Standing Trees. Comput. Electron. Agric. 2000, 28, 151–169. [Google Scholar] [CrossRef]
  28. Su, J.; Fan, Y.; Mannan, A.; Wang, S.; Long, L.; Feng, Z. Real-Time Estimation of Tree Position, Tree Height, and Tree Diameter at Breast Height Point, Using Smartphones Based on Monocular SLAM. Forests 2024, 15, 939. [Google Scholar] [CrossRef]
  29. Ferreira, R.T.; Viana, A.P.; Barroso, D.G.; Resende, M.D.V.D.; Amaral Júnior, A.T.D. Toona Ciliata Genotype Selection with the Use of Individual BLUP with Repeated Measures. Sci. Agric. 2012, 69, 210–216. [Google Scholar] [CrossRef]
  30. Fan, Y.; Feng, Z.; Mannan, A.; Khan, T.U.; Shen, C.; Saeed, S. Estimating Tree Position, Diameter at Breast Height, and Tree Height in Real-Time Using a Mobile Phone with RGB-D SLAM. Remote Sens. 2018, 10, 1845. [Google Scholar] [CrossRef]
  31. Wu, X.; Zhou, S.; Xu, A.; Chen, B. Passive Measurement Method of Tree Diameter at Breast Height Using a Smartphone. Comput. Electron. Agric. 2019, 163, 104875. [Google Scholar] [CrossRef]
  32. Xinmei, W.; Aijun, X.; Tingting, Y. Passive Measurement Method of Tree Height and Crown Diameter Using a Smartphone. IEEE Access 2020, 8, 11669–11678. [Google Scholar] [CrossRef]
  33. Wells, L.A.; Woodam, C. Evaluation of Ground Plane Detection for Estimating Breast Height in Stereo Images. For. Sci. 2020, 66, 612–622. [Google Scholar] [CrossRef]
  34. Trairattanapa, V.; Ravankar, A.A.; Emaru, T. Estimation of Tree Diameter at Breast Height Using Stereo Camera by Drone Surveying and Mobile Scanning Methods. In Proceedings of the 2020 59th Annual Conference of the Society of Instrument and Control Engineers of Japan (SICE), Chiang Mai, Thailand, 23–26 September 2020; pp. 946–951. [Google Scholar]
  35. Song, C.; Yang, B.; Zhang, L.; Wu, D. A Handheld Device for Measuring the Diameter at Breast Height of Individual Trees Using Laser Ranging and Deep-Learning Based Image Recognition. Plant Methods 2021, 17, 67. [Google Scholar] [CrossRef] [PubMed]
  36. Rublee, E.; Rabaud, V.; Konolige, K.; Bradski, G. ORB: An Efficient Alternative to SIFT or SURF. In Proceedings of the 2011 International Conference on Computer Vision, Barcelona, Spain, 6–13 November 2011; pp. 2564–2571. [Google Scholar]
  37. Galvez-López, D.; Tardos, J.D. Bags of Binary Words for Fast Place Recognition in Image Sequences. IEEE Trans. Robot. 2012, 28, 1188–1197. [Google Scholar] [CrossRef]
  38. Ha, H.; Im, S.; Park, J.; Jeon, H.-G.; Kweon, I.S. High-Quality Depth from Uncalibrated Small Motion Clip. In Proceedings of the 2016 IEEE Conference on Computer Vision and Pattern Recognition (CVPR), Las Vegas, NV, USA, 27–30 June 2016; pp. 5413–5421. [Google Scholar]
  39. Nozick, V.; de Sorbier, F.; Saito, H. Plane-Sweep Algorithm: Various Tools for Computer Vision. Tech. Comm. Pattern Recognit. Media Underst. 2008, 107, 87–94. [Google Scholar]
  40. Sun, Y. Study on Single Tree Structure Parameters Extraction Based on Close-Range Photogrammetry. Master’s Thesis, Northeast Forestry University, Harbin, China, 2020. [Google Scholar]
  41. Wang, X.; Song, K.; Wang, Z.; Da, L.; Mokro, M. Usage of Structure-from-Motion for Urban Forest Inventory. J. Southwest For. Univ. 2021, 41, 139–148. [Google Scholar]
  42. Yang, S.; Xing, Y.; Xing, T.; Deng, H.; Xi, Z. Multi-Sensors Fusion SLAM-Aided Forest Plot Mapping with Backpack Dual-LiDAR System. IEEE J. Sel. Top. Appl. Earth Obs. Remote Sens. 2024, 1–21. [Google Scholar] [CrossRef]
  43. Yang, S.; Xing, Y.; Wang, D.; Deng, H. A Novel Point Cloud Adaptive Filtering Algorithm for LiDAR SLAM in Forest Environments Based on Guidance Information. Remote Sens. 2024, 16, 2714. [Google Scholar] [CrossRef]
  44. Su, Y.; Guo, Q.; Jin, S.; Guan, H.; Sun, X.; Ma, Q.; Hu, T.; Wang, R.; Li, Y. The Development and Evaluation of a Backpack LiDAR System for Accurate and Efficient Forest Inventory. IEEE Geosci. Remote Sens. Lett. 2021, 18, 1660–1664. [Google Scholar] [CrossRef]
  45. Zhu, Y.; Sun, G.; Ding, G.; Zhou, J.; Wen, M.; Jin, S.; Zhao, Q.; Colmer, J.; Ding, Y.; Ober, E.S.; et al. Large-Scale Field Phenotyping Using Backpack LiDAR and CropQuant-3D to Measure Structural Variation in Wheat. Plant Physiol. 2021, 187, 716–738. [Google Scholar] [CrossRef] [PubMed]
  46. GB/T 38590-2020; Technical Regulations for Continuous Forest Inventory. National Forest Resources Standardization Technical Committee: Beijing, China, 2020.
Figure 1. Study area and sample plots.
Forests 15 01635 g001
Figure 2. Schematic of small motion clip acquisition. (a) L m distance measurement. (b) Small motion clip acquisition.
Forests 15 01635 g002
Figure 3. Technical flow chart.
Forests 15 01635 g003
Figure 4. Diagram of the depth map coordinate system.
Forests 15 01635 g004
Figure 5. Depth map construction and point cloud reconstruction.
Forests 15 01635 g005
Figure 6. Plots of linear regression fit for DBH. The red line is the regression line of the estimated vs. measured DBH. The dashed line is the ideal 1:1 relationship line.
Forests 15 01635 g006
Figure 7. Comparison of measured DBH and estimated DBH.
Forests 15 01635 g007
Figure 8. Plots of linear regression fit for CBH. The red line is the regression line of the estimated vs. measured CBH. The dashed line is the ideal 1:1 relationship line.
Forests 15 01635 g008
Figure 9. Comparison of measured CBH and estimated CBH.
Forests 15 01635 g009
Figure 10. Detailed visualization for DBH and CBH in Pinus sylvestris var. mongolica.
Forests 15 01635 g010
Figure 11. Detailed visualization for CBH in Quercus mongolica.
Forests 15 01635 g011
Figure 12. Box plots of DBH and CBH estimated errors in different ranges. (a) DBH estimated errors (b) CBH estimated errors.
Forests 15 01635 g012
Table 1. Sample plot properties.
Plot IDDominant Tree SpeciesMean DBH/cmStem Density (Stems/ha)Understory Conditions
1Betula platyphylla17.79725More miscellaneous wood and good brightness
2Pinus tabuliformis var. mukdensis27.10900Non-miscellaneous tree and normal brightness
3Quercus mongolica16.36825Non-miscellaneous tree and normal brightness
4Fraxinus mandshurica33.53675Fewer miscellaneous tree and good brightness
5Picea26.38900Non-miscellaneous tree and good brightness
6Pinus sylvestris var. mongolica19.16900Non-miscellaneous tree and good brightness
Table 2. Monocular camera specifications.
ParametersValue
Resolution3840 × 2160
Frame rate30 Hz
Maximum Measurement Distance20 m
Field of View120°
Exposure Time1/4000~30 s
Focal Lengthx: 3005.0, y: 3002.3
Table 3. Accuracy assessment chart for DBH estimation.
Plot IDBIAS/cmrBIAS/%RMSE/cmrRMSE/%η/%
10.050.270.854.763.39
20.250.940.602.221.81
30.171.030.704.303.89
40.140.430.902.702.38
50.411.560.913.463.19
60.874.551.186.165.42
Mean0.321.460.863.933.35
Table 4. Accuracy assessment chart for CBH estimation.
Plot IDBIAS/mrBIAS/%RMSE/mrRMSE/%η/%
10.082.100.195.064.87
2−0.0020.0460.132.752.48
30.082.690.217.045.50
4−0.03−0.620.183.612.74
50.020.630.082.521.97
60.174.540.215.695.58
Mean0.051.560.174.453.86
Table 5. Comparative analysis of DBH with existing algorithms.
ReferenceSample Plot Size/m2Acquisition DevicesMethodologiesData Type Average Image Acquisition time/sAverage Image Processing time/sη/%
The study20 × 20Monocular cameraSmall motion clip point cloud recoverySmall motion clip1~2163.35%
Sun [40]20 × 20Monocular cameraSpace Intersection≥260-10.0%
Wang et al. [41]62 × πMonocular cameraSfM≈5453225.4%
Su et al. [28]7.5 × πMonocular cameraVisual OdometryOrdered image sequences--3.59%
Disclaimer/Publisher’s Note: The statements, opinions and data contained in all publications are solely those of the individual author(s) and contributor(s) and not of MDPI and/or the editor(s). MDPI and/or the editor(s) disclaim responsibility for any injury to people or property resulting from any ideas, methods, instructions or products referred to in the content.

