Article

Changes in Spatiotemporal Pattern and Its Driving Factors of Suburban Forest Defoliating Pest Disasters

1
Jilin Provincial Academy of Forestry Sciences (Jilin Provincial Forestry Biological Control Center Station), Changchun 130033, China
2
College of Forestry, Beijing Forestry University, Beijing 100083, China
3
Forestry Bureau of Changbai Chaoxianzu (Korean) Autonomous County, Baishan 134400, China
4
College of Landscape and Architecture, Changchun University, Changchun 130022, China
5
Hangzhou Innovation Institute, Beihang University, Hangzhou 310056, China
6
Key Laboratory of Wetland Ecology and Environment, Northeast Institute of Geography and Agroecology, Chinese Academy of Sciences, Changchun 130102, China
*
Authors to whom correspondence should be addressed.
These authors contributed equally to this work.
Forests 2024, 15(9), 1650; https://doi.org/10.3390/f15091650
Submission received: 28 July 2024 / Revised: 22 August 2024 / Accepted: 16 September 2024 / Published: 19 September 2024

Abstract

:
Forest defoliating pests are significant global forest disturbance agents, posing substantial threats to forest ecosystems. However, previous studies have lacked systematic analyses of the continuous spatiotemporal distribution characteristics over a complete 3–5 year disaster cycle based on remote sensing data. This study focuses on the Dendrolimus superans outbreak in the Changbai Mountain region of northeastern China. Utilizing leaf area index (LAI) data derived from Sentinel-2A satellite images, we analyze the extent and dynamic changes of forest defoliation. We comprehensively examine the spatiotemporal patterns of forest defoliating pest disasters and their development trends across different forest types. Using the geographical detector method, we quantify the main influencing factors and their interactions, revealing the differential impacts of various factors during different growth stages of the pests. The results show that in the early stage of the Dendrolimus superans outbreak, the affected area is extensive but with mild severity, with newly affected areas being 23 times larger than during non-outbreak periods. In the pre-hibernation stage, the affected areas are smaller but more severe, with a cumulative area reaching up to 8213 hectares. The spatial diffusion characteristics of the outbreak follow a sequential pattern across forest types: Larix olgensis, Pinus sylvestris var. mongolica, Picea koraiensis, and Pinus koraiensis. The most significant influencing factor during the pest development phase was the relative humidity of the year preceding the outbreak, with a q-value of 0.27. During the mitigation phase, summer precipitation was the most influential factor, with a q-value of 0.12. The combined effect of humidity and the low temperatures of 2020 had the most significant impact on both the development and mitigation stages of the outbreak. This study’s methodology achieves a high-precision quantitative inversion of long-term disaster spatial characteristics, providing new perspectives and tools for real-time monitoring and differentiated control of forest pest infestations.

1. Introduction

Forest diseases and pests are a significant threat to global forest health, affecting an average of 44 million hectares of forests annually worldwide [1]. In 2023 alone, global investments in forest disease and pest control reached $22.85 billion, reflecting the severity of their impact. The direct economic losses caused by these pests are second only to those caused by forest fires, making them the second-largest disturbance factor in forest ecosystems [2]. The ecological damage is even more profound; Metsaranta et al. noted that the annual carbon sequestration loss caused by forest pests nearly offsets the minimum carbon fixation achieved by global afforestation projects in the same year [3]. Among various forest pest disasters, defoliating pests cause the most severe damage by directly harming leaves and affecting plant photosynthesis, thereby reducing net productivity [4]. On a macro scale, accurately understanding the temporal and spatial changes and patterns of forest defoliator disasters and analyzing the key factors that promote and constrain disaster development can help formulate targeted ground control strategies. This approach not only effectively reduces forest losses but also advances forest management practices, playing a crucial role in understanding and controlling forest defoliator disasters and maintaining the health of forest ecosystems.
Given the limitations of ground surveys, remote sensing technologies offer an efficient means for monitoring forest health due to their unique macro-spectral characteristic capturing capabilities and continuous, repeated observations of the earth. Research indicates that the feeding of forest defoliator larvae on leaves leads to changes in the physicochemical parameters of the forest canopy, indirectly affecting canopy spectral characteristics. By analyzing the relationships between specific canopy parameters and spectral feature changes [5], it is possible to indirectly monitor the extent and severity of pest infestations. Accurately determining the spatial distribution of forest defoliator disasters has always been a focal point in remote sensing research. Scholars have made significant progress by extensively comparing various disaster detection algorithms and remote sensing indices. Initially, they could only extract affected areas [6] but have since advanced to qualitatively monitoring disaster severity by delineating different stages of the vegetation damage process [7]. However, challenges remain in quantitatively monitoring the detailed spatiotemporal distribution of pest infestations and interpreting the scale and spread of disasters from a macro perspective. By identifying canopy spectral characteristics [8] and analyzing the intensity of forest pest damage [6], researchers can achieve a preliminary quantification of vegetation damage [9] and pest lifecycles [10], demonstrating the value of timely monitoring [11]. However, merely obtaining algebraic spatial distributions does not provide biophysically meaningful disaster outbreak information, making it difficult to determine specific temporal patterns of pest distribution. With the continuous improvement of remote sensing data’s temporal and spatial resolution and the accumulation of historical data, monitoring methods for forest defoliating pest disasters have evolved from traditional image processing to continuous time-series analysis [12]. Researchers can now identify forest disturbance pixels during continuous monitoring [13] and describe historical sensitivity to disturbances [14]. Despite the existence of advanced algorithms and spectral data, methods based on continuous spectral changes are limited in their capacity to capture development trends. Defoliation rate, a standard indicator in ground-based surveys for assessing disaster severity [15], is more readily obtainable and intuitive than tree mortality rates [16], performing well in assessing damage at the individual tree level. However, the current mode of manual surveys is difficult to scale and cannot achieve macro assessments. Sathish C. [17] suggested that the leaf loss degree can be indirectly obtained from image data based on land cover patterns, addressing this issue, but it lacks physical meaning and precise quantification. Therefore, a method to quantitatively obtain the leaf loss ratio from a remote sensing perspective is needed to acquire large-scale dynamic disaster information quantitatively.
A detailed spatiotemporal pattern of forest defoliator disasters can elucidate the factors that promote or inhibit their development. Early studies on this topic transitioned from focusing on limited meteorological factors such as temperature and precipitation [18] to landscape-level factors such as forest composition [19] and site quality [20], while conducting numerous experiments. However, these studies often merely differentiated the impacts of different tree species without fundamentally understanding the roles of dominant species or the degree of mixture in the environment [21], directly treating them as influence factors. This approach limits the in-depth understanding of how different forest types respond to environmental and biological pressures. With an expanded research perspective, recent studies have shifted towards assessing these factors over temporal dimensions, explaining the impact of disaster-causing factors on pest physiological characteristics at different timescales [22] and their sensitivity at various life stages [23]. Nevertheless, they still fail to clearly describe the characteristics of different forest types affected during a complete pest cycle, overlooking the effects of mixed forest types within the entire disaster cycle. Research that relies heavily on ground truth data for modeling and comparing the environmental prediction accuracy of different forest types [24] is often constrained by the scope and methods of ground surveys conducted by forestry managers, which are typically limited to specific plots [25], affecting the breadth and depth of the research. As studies extend to larger geographic areas, despite discussing the differences in pest spread mechanisms at various scales [25], the spatial granularity of area data based on administrative divisions [26] is often too coarse. Moreover, the increased uncertainty from manual surveys [27] makes it difficult to provide in-depth explanations for the driving factors of pest spread. In this context, remote sensing technologies have demonstrated potential in identifying forest types and phenological conditions [28]. Although these technologies have primarily been used to predict the trend of disaster progression rather than to attribute causes, they still offer valuable insights. Thus, comprehensively revealing the heterogeneity of factors during the pest development process can provide effective decision support for phased prevention and control measures, which is crucial for a deep understanding and response to forest defoliator disasters.
In summary, previous research on forest defoliator disasters has largely focused on improving the accuracy of disaster monitoring or has been limited to plot-scale analyses of the impact of certain factors on disaster development, overlooking the process of disaster development over time on a spatial scale and the influence of different driving factors. To address this, this study relies on ground and remote sensing technology data to obtain the leaf area index (LAI), combined with forest-type classification results and defoliation data, to capture the spatial distribution patterns and temporal trends of forest defoliator disasters throughout a complete disaster cycle. The geographical detector method is used to reveal the influence patterns of different driving factors on the dynamic spatiotemporal sequence-distribution changes of disasters. This research focuses on solving the following two issues:
  • Utilizing remote sensing data to obtain real-time defoliation information and quantitatively describe the spatiotemporal evolution trends and characteristics of forest defoliating pest disasters.
  • Clarifying the effects of the interaction of different factors under four main forest types on the dynamics of evolution.
This study is significant for achieving a visual spatial representation of Dendrolimus superans disaster severity, establishing a differentiated prevention and control system for forest defoliating pests in stages, and enhancing the effectiveness and accuracy of forestry monitoring.

2. Materials and Methods

2.1. Study Area

The study area is located in the Changbai Korean Autonomous County, Jilin Province, China, covering a total area of 113,100 hectares. The soil in this region is predominantly dark brown forest soil, with scattered patches of meadow dark brown forest soil that vary with altitude and terrain, displaying acidic to weakly acidic properties. The main coniferous species include Larix olgensis, Pinus sylvestris var. mongolica, Pinus koraiensis, and Picea koraiensis. For a detailed overview of the study area, please refer to Figure 1.
According to monitoring data from the Forest Protection Department of the Changbai County Forestry Bureau, there was an unusual increase in the number of overwintering larvae of the larch caterpillar (Dendrolimus superans) in October 2018. By the spring of 2019, both the density of these larvae and the affected area began to increase. The forestry department implemented several control measures, including the barrier method [29], ground spraying method [30], and the placement of Trichogramma eggs [31]. By September 2019, the area affected by the larvae before overwintering had reached its maximum. Despite these efforts, by June 2020, both the larval population and the affected area remained significant. Consequently, the forestry department used aerial spraying of insecticides to control the larval density. By September 2020, the situation had returned to normal levels.

2.2. Data Sources and Preprocessing

This study utilizes multispectral remote sensing imagery from the European Space Agency’s Sentinel-2A (https://scihub.copernicus.eu, accessed on 8 July 2023). The ESA’s official SNAP platform was employed for preprocessing, which included atmospheric correction, topographic and geometric correction (with a mean pixel residual error of less than 0.41), and spatial resampling to a pixel resolution of 10 m [5]. For temporal selection, disaster occurrence data from the survey data from the Forest Protection Department of the Forestry Bureau were used to determine the outbreak period of the larch caterpillar disaster, focusing on the years 2017–2021. Based on the biological characteristics of the larch caterpillar, approximately 74.4% of the total needle consumption by larvae occurs in the pre-maturity and pre-overwintering stages [32]. Considering the phenological characteristics of the main tree species, June and September were selected as the study periods for remote sensing monitoring of the defoliating pest disaster.
Given the high altitude of the Changbai Mountain region, cloud cover significantly affects the imagery. To obtain cloud-free images for specific periods, the FMask algorithm was used to perform cloud removal and composite three images per month [33]. Using ArcGIS 10.8, elevation, slope, and aspect data were extracted based on a digital elevation model (DEM). Information on forest origin, age, canopy density, and diameter at breast height (DBH) was obtained from the Second-Class Forest Resource Survey Data. Additionally, 30 m resolution meteorological data for the Jilin Province from 2018 to 2020 were produced by the team of Bintao Liu at the Institute of Mountain Hazards and Environment, Chinese Academy of Sciences. For specific data sources and additional details, refer to Table 1.

2.3. Distribution of Forest Types Based on CD-CNN-CRF

For training and validation sample selection, we utilized the preprocessed Sentinel-2A data mentioned in Section 2.1 and referenced the forest-type distribution data from forest resource planning and design surveys. Within the study area, 500 training samples and 200 validation samples were uniformly selected for each of the eight target categories: Larix olgensis, Pinus koraiensis, Pinus sylvestris var. mongolica, Picea koraiensis, other forest land, construction land, cultivated land, and water bodies. The specific selection of validation samples points was guided by Figure 1. These samples were used to conduct neural network training and validate the results.
Using the PyCharm platform, coupled with TensorFlow 2.0, a convolutional neural network (CNN) was constructed [34] with the following parameter settings: the network configuration included 2 convolutional layers, 2 pooling layers, and 2 fully connected layers. The convolutional layers had kernel sizes of [3 × 3 × 6] and a stride of [1, 1, 4], while the pooling layers had sizes of [3 × 3 × 3]. The first fully connected layer contained 400 hidden units, and the second fully connected layer contained 200 hidden units, with a learning rate set at 0.005. To verify the accuracy of the neural network’s training and classification results, we used a confusion matrix and Kappa analysis.
This study employs a joint multi-label conditional random field (CRF) optimization method (CD-CNN-CRF) for a three-dimensional convolutional neural network model (3D-CNN) [35]. This method, based on the deep learning CD-CNN model, introduces a conditional random field optimization algorithm to reasonably adjust the identified land cover patches, thereby improving classification accuracy and addressing the issue of feature confusion in hyperspectral remote sensing image classification. Both deep learning models and random forest classification methods were used for forest-type extraction. The results obtained are visually presented in Appendix A Figure A1 and statistically summarized in Appendix A Table A1.

2.4. Leaf Area Index and Degree of Disaster

(1)
Leaf Area Index Extraction
To obtain accurate leaf area index (LAI) data, the project team established 70 plots of 10 m × 10 m in mid-June 2020, based on the diversity and spatial heterogeneity of the vegetation distribution and the phenological characteristics of the study area. These plots were used to conduct ground surveys of the affected pine forest areas, focusing on LAI and basic forest information. LAI measurements were conducted using an LAI-2200C Canopy Analyzer [36], following the national standard “Verification of Remote Sensing Products for Leaf Area Index” (GB/T 40034-2021).
For remote sensing-based LAI monitoring, we employed a method that distinguishes forest types to construct LAI regression models for the four coniferous forest types in the Changbai Mountains (Larix olgensis, Pinus sylvestris var. mongolica, Pinus koraiensis, and Picea koraiensis). Our LAI regression models demonstrated higher accuracy compared to traditional empirical models that do not differentiate between forest types [37] and the PROSAIL model [38]. The specific method followed Bao Guangdao et al. [39]. For each image time point, the LAI of the same month was maximized to achieve LAI mapping of the study area for that month [18]. The verification results of LAI inversion accuracy are shown in Figure A2 and Figure A3 of Appendix A.
(2)
Division of Disaster Stage
Trend analysis, also known as the trend forecasting method [40], is a statistical technique used to analyze changes in trends within time-series data. Common statistical methods used in trend analysis include linear regression, moving averages, and exponential smoothing. This method models the data as a function where time is the independent variable, and the data themselves are the dependent variables. By analyzing time-series data, it determines the direction, rate, and significance of trends.
Slope = n i = 1 n i × L A I i i = 1 n i × i = 1 n L A I i n i = 1 n i 2 i = 1 n i 2
When the slope is positive, it indicates an increasing trend in pixel LAI; when the slope is zero, the trend in pixel LAI is constant; and when the slope is negative, it indicates a decreasing trend in pixel LAI.
Using a raster calculator and the formula above, a statistical analysis was performed on the ten LAI inversion results from 2017 to 2021, computed in Section 2.2. Based on the timing of the lowest LAI values, different years of disaster development within the same growth season were identified. Specifically, June 2018 to June 2019 was identified as the disaster development phase, and September 2019 to September 2020 was identified as the disaster mitigation and recovery phase. This analysis further determined the overall impact of the disaster and the forest loss caused by the Dendrolimus superans outbreak.
(3)
Disaster Severity Calculation Based on Defoliation Rate
This study quantifies the damage to coniferous leaves caused by pine caterpillar disasters using the ratio of fallen leaves to total leaves, facilitating an assessment of disaster severity. Referencing the defoliation rate calculation method from the “Standards for the Occurrence and Disaster of Harmful Forest Organisms” (LY/T 1681-2006), the severity of the disaster is classified as follows: more than 60% defoliation is considered severe, 30%–60% is moderate, and below 30% is mild.
Initially, the spatial distribution of the four coniferous forest types described in Section 2.3 is used to mask the ten periods of LAI data obtained in Section 2.4 (1. Leaf Area Index Extraction) to determine the LAI within the study area. Subsequently, the LAI difference between June and September 2017 is used to eliminate the leaf leaf-fall phenomenon caused by normal leaf drop. Finally, taking June 2017 as the baseline period [41], the defoliation rate for the monitoring periods is calculated by dividing the difference in LAI by the baseline period’s leaf area index.
LLR = L A I N L A I M L A I M
In this formula, LLR stands for leaf-loss rate, LAIN represents the LAI at the monitoring time, specifically corresponding to June 2017 in our study, and LAIM denotes the LAI for the baseline reference months (September 2018 and June, September of 2019–2021).

2.5. Analysis of Influencing Factors Based on the Geographical Detector

The geographical detector (http://www.geodetector.org, accessed on 13 March 2024) [42] is a statistical method used to analyze relationships between geographic phenomena and environmental factors. It is based on principles of geography and statistics, measuring and analyzing the explanatory power of individual factors and their interactions on the dependent variable. This method reveals spatial heterogeneity and identifies the factors influencing geographic phenomena, overcoming the limitations of categorical variables [43]. The “factor detector” measures the extent to which an independent variable explains the variation in the dependent variable, while the “interaction detector” assesses how interactions between factors influence the dependent variable, including weakening, enhancing, or acting independently.
In the analytical process using the geographical detector, it is first necessary to discretize the factors listed in Table 2 using ArcGIS 10.8. This is performed by employing classification methods such as natural breaks and geometric intervals, according to the classification standards in the “Technical Specifications for Forest Resource Planning and Design Survey in Jilin Province,” and then building statistical models. Subsequently, geodetector software 1.0-5 is used to calculate the q statistic and significance level to evaluate the explanatory power and statistical significance of the independent variables.
Different factors reveal their relative importance through the q statistic in various developmental stages. The q statistic ranges from 0 to 1; values closer to 1 indicate higher explanatory power of an independent variable, whereas values closer to 0 indicate lower explanatory power. A q-value significantly greater than 0.5 indicates that the independent variable has a high explanatory power over the dependent variable.

2.6. Technical Route Introduction

As illustrated in Figure 2, our methodology begins with Sentinel-2A multispectral imagery, which is corrected for atmospheric and geometric distortions using the SNAP platform. Clouds are removed via the FMask algorithm to ensure data clarity. Subsequently, the imagery is processed through the CD-CNN-CRF model for tree species classification and the PROSAIL-PROSPECT model to calculate the Leaf Area Index (LAI). These preparatory steps enable further analysis with the Geodetector tool, which evaluates the impacts of ecological disasters by examining changes in forest structure and analyzing meteorological data.

3. Results

3.1. Forest-Type Classification and LAI Inversion

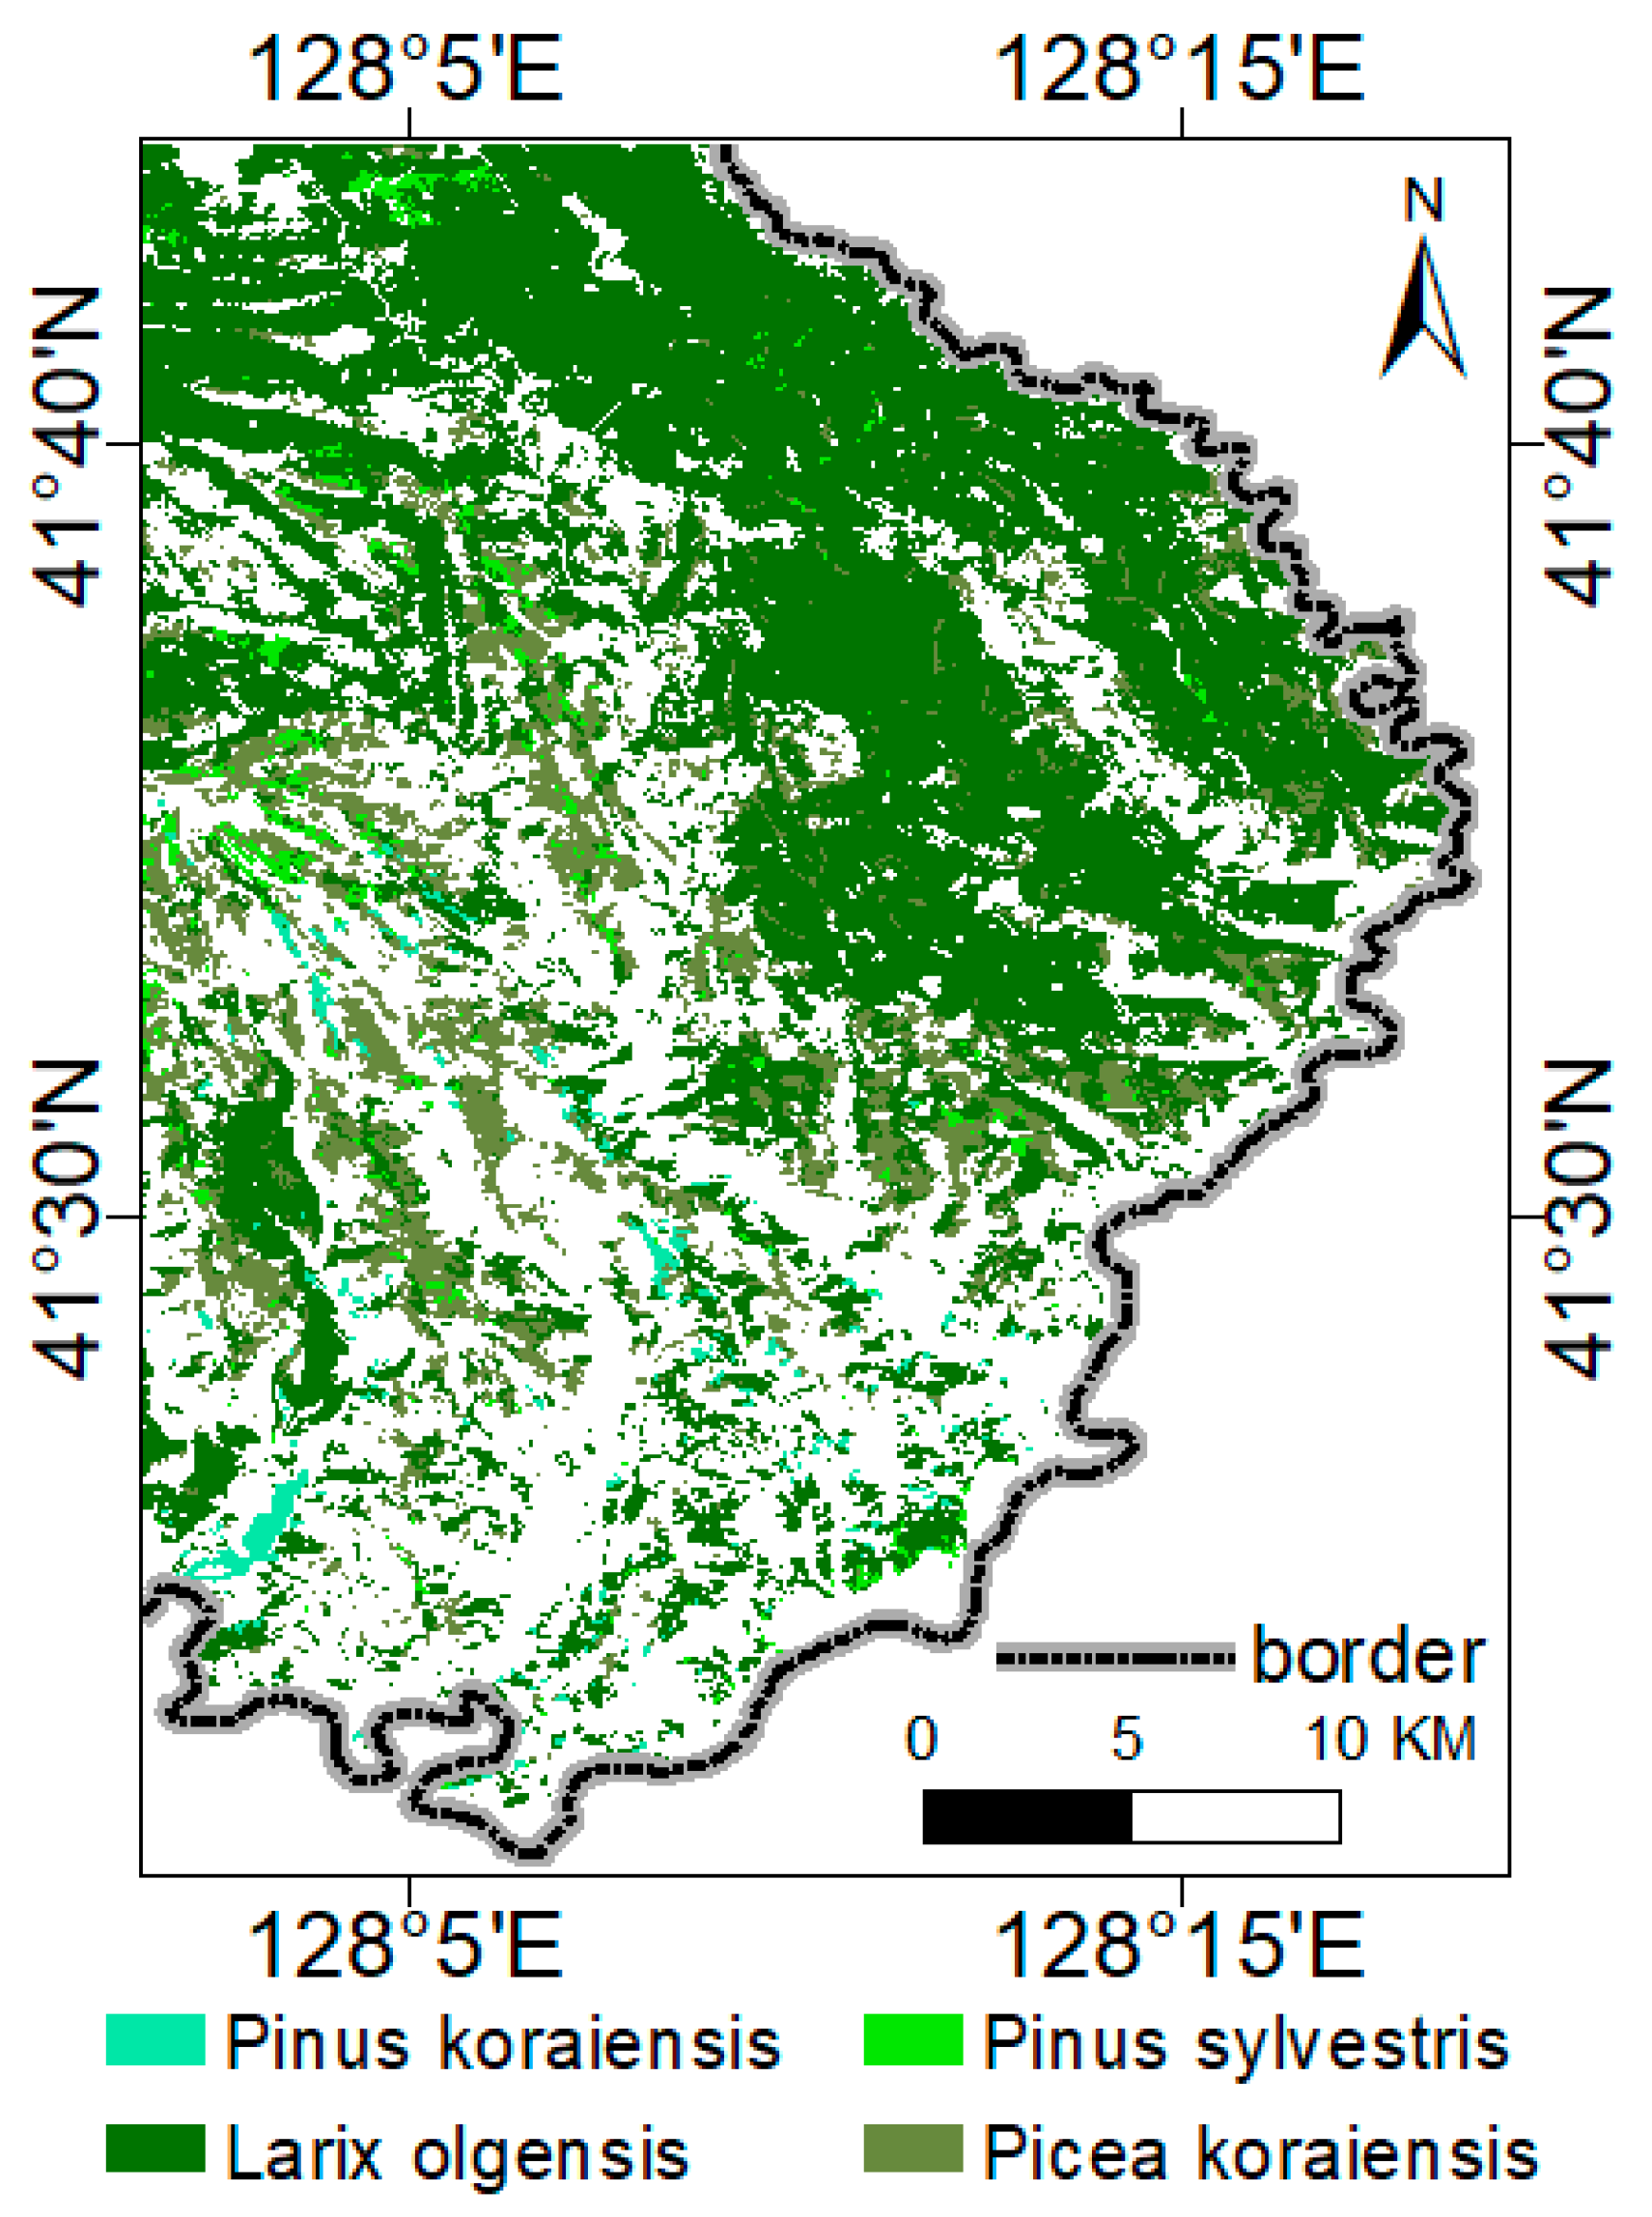
This study employed a confusion matrix to evaluate the accuracy of the classification results, as shown in Appendix A Table A1. The overall classification accuracy of the sample was 89.48%, with a kappa coefficient of 0.88, meeting the requirements for classifying coniferous species. As illustrated in Appendix A Figure A1, Larix olgensis had the largest coverage area at 35,987.90 ha, accounting for 73.4% of the total area. In the northeastern part of the study area, large patches of natural forests of Larix olgensis are concentrated, with an average patch size of 26.54 ha. In contrast, in the southern part, it is mainly distributed as smaller patches of artificial forests, making it the dominant forest type in the study area. Pinus sylvestris var. mongolica and Pinus koraiensis are primarily located in the southern part, with user accuracy and mapping accuracy of 89.91% and 88.77%, and 97.67% and 94.29%, respectively.
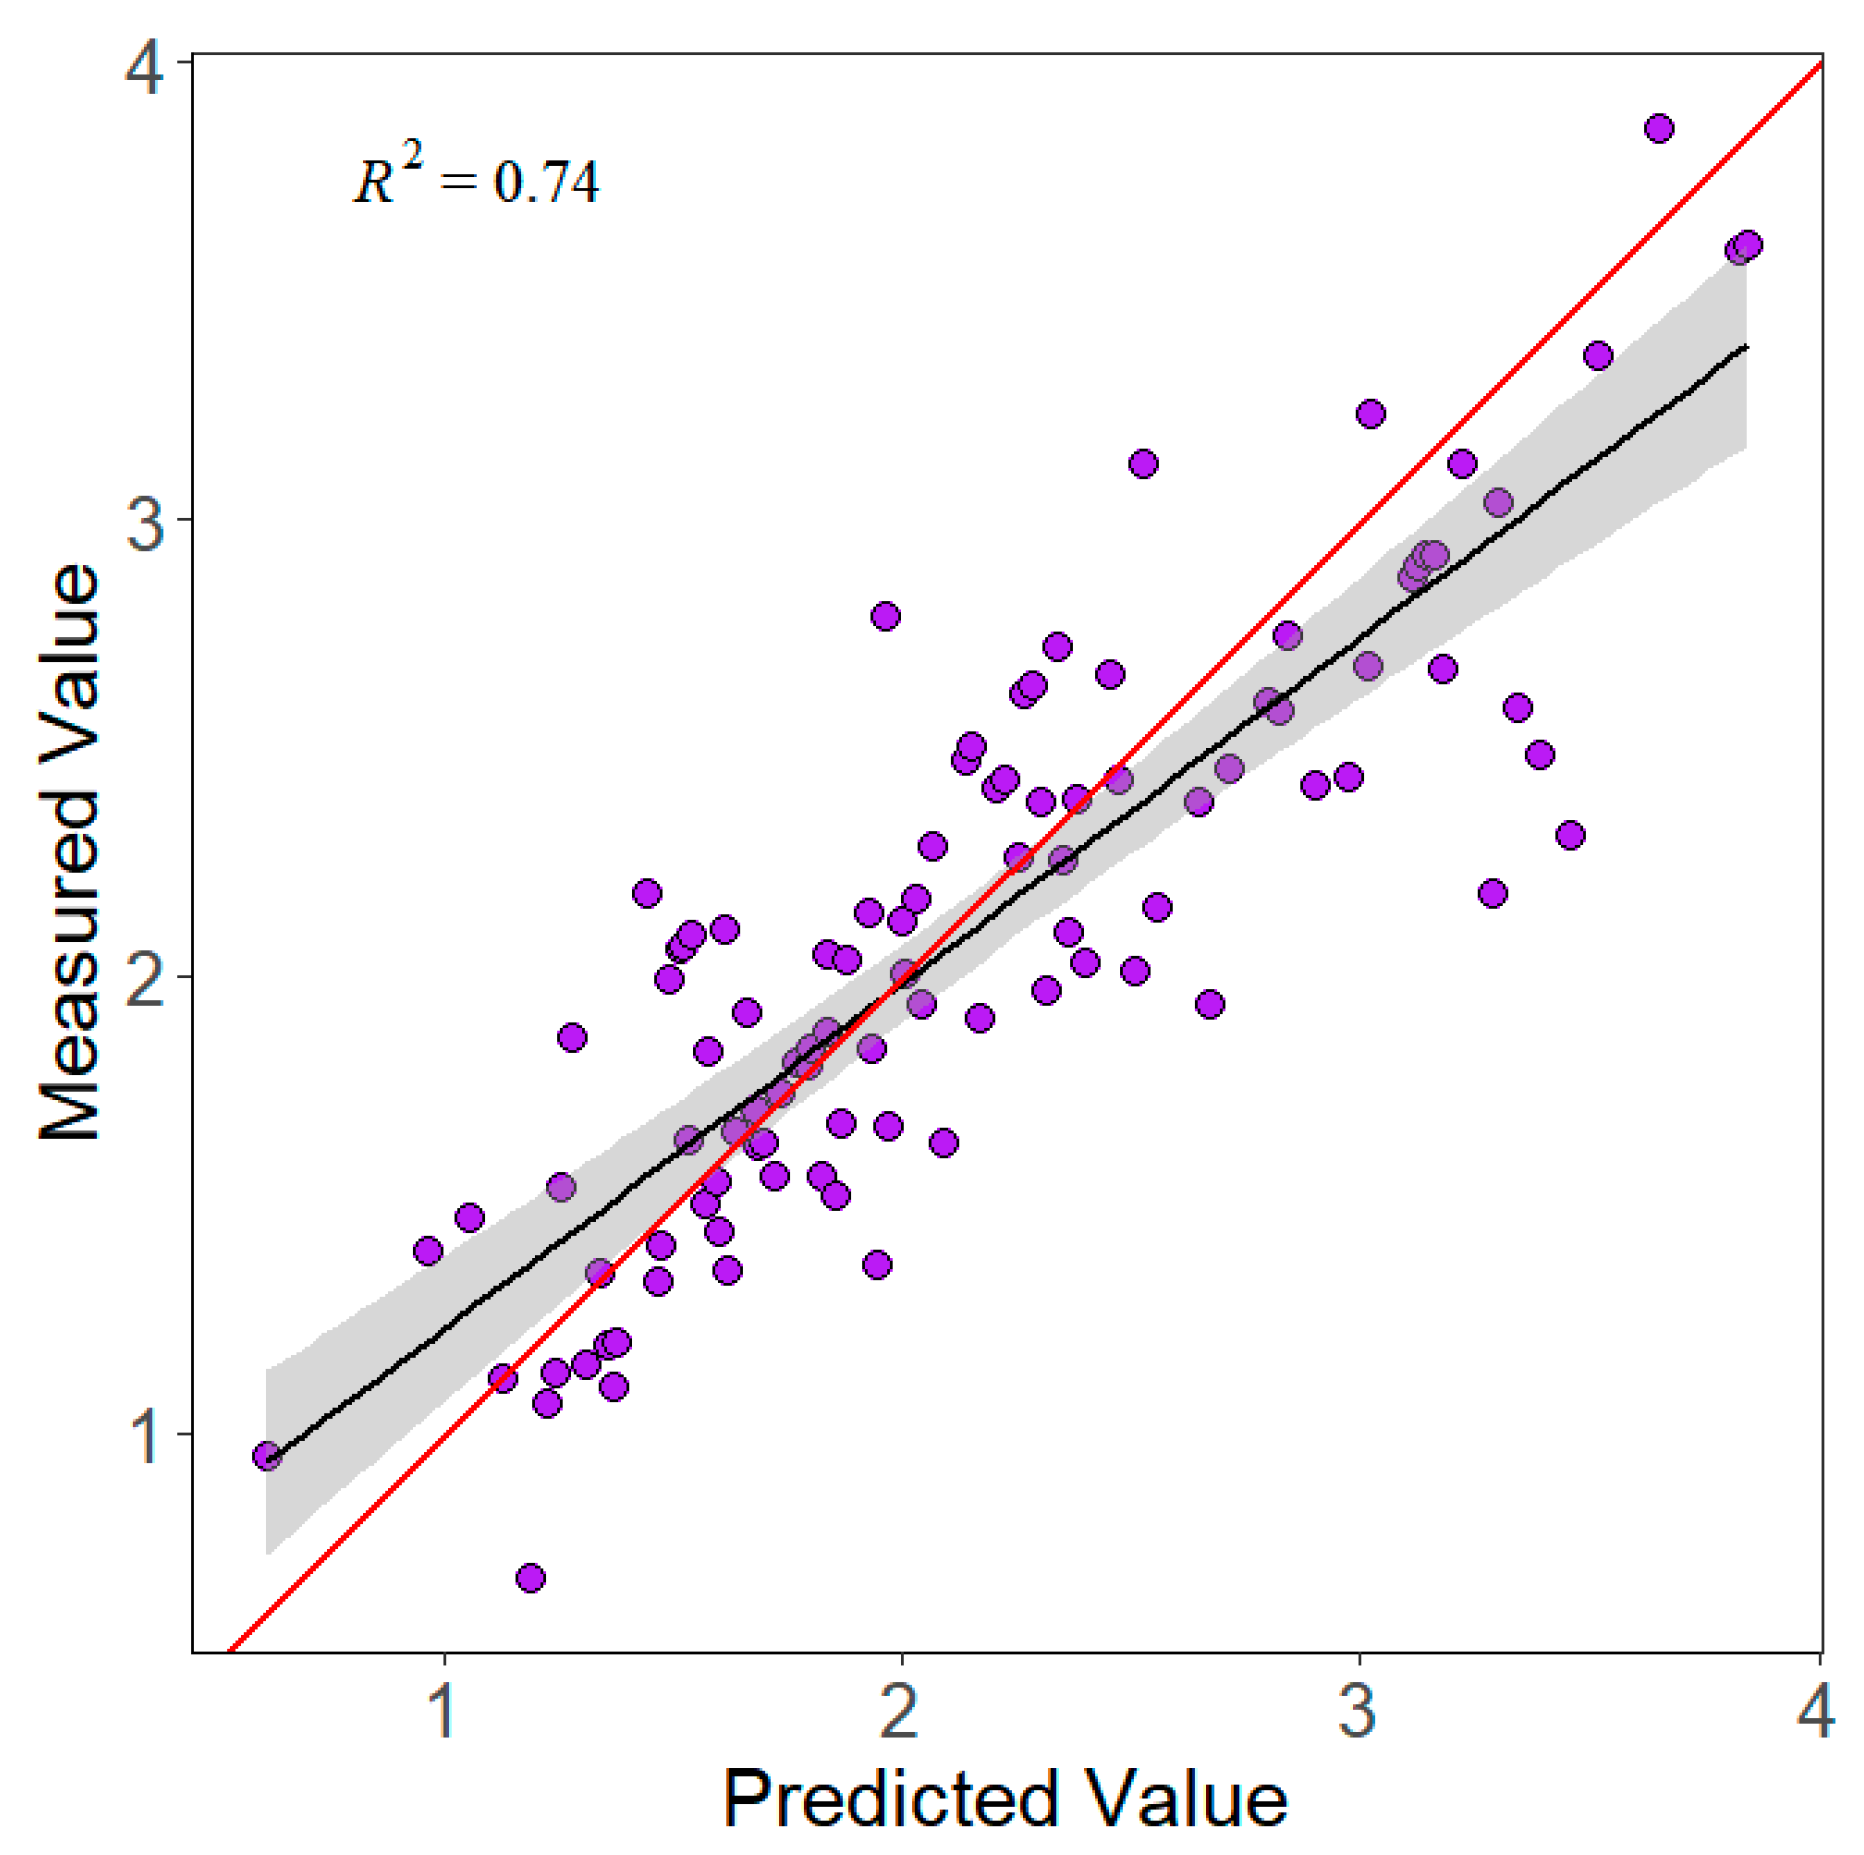
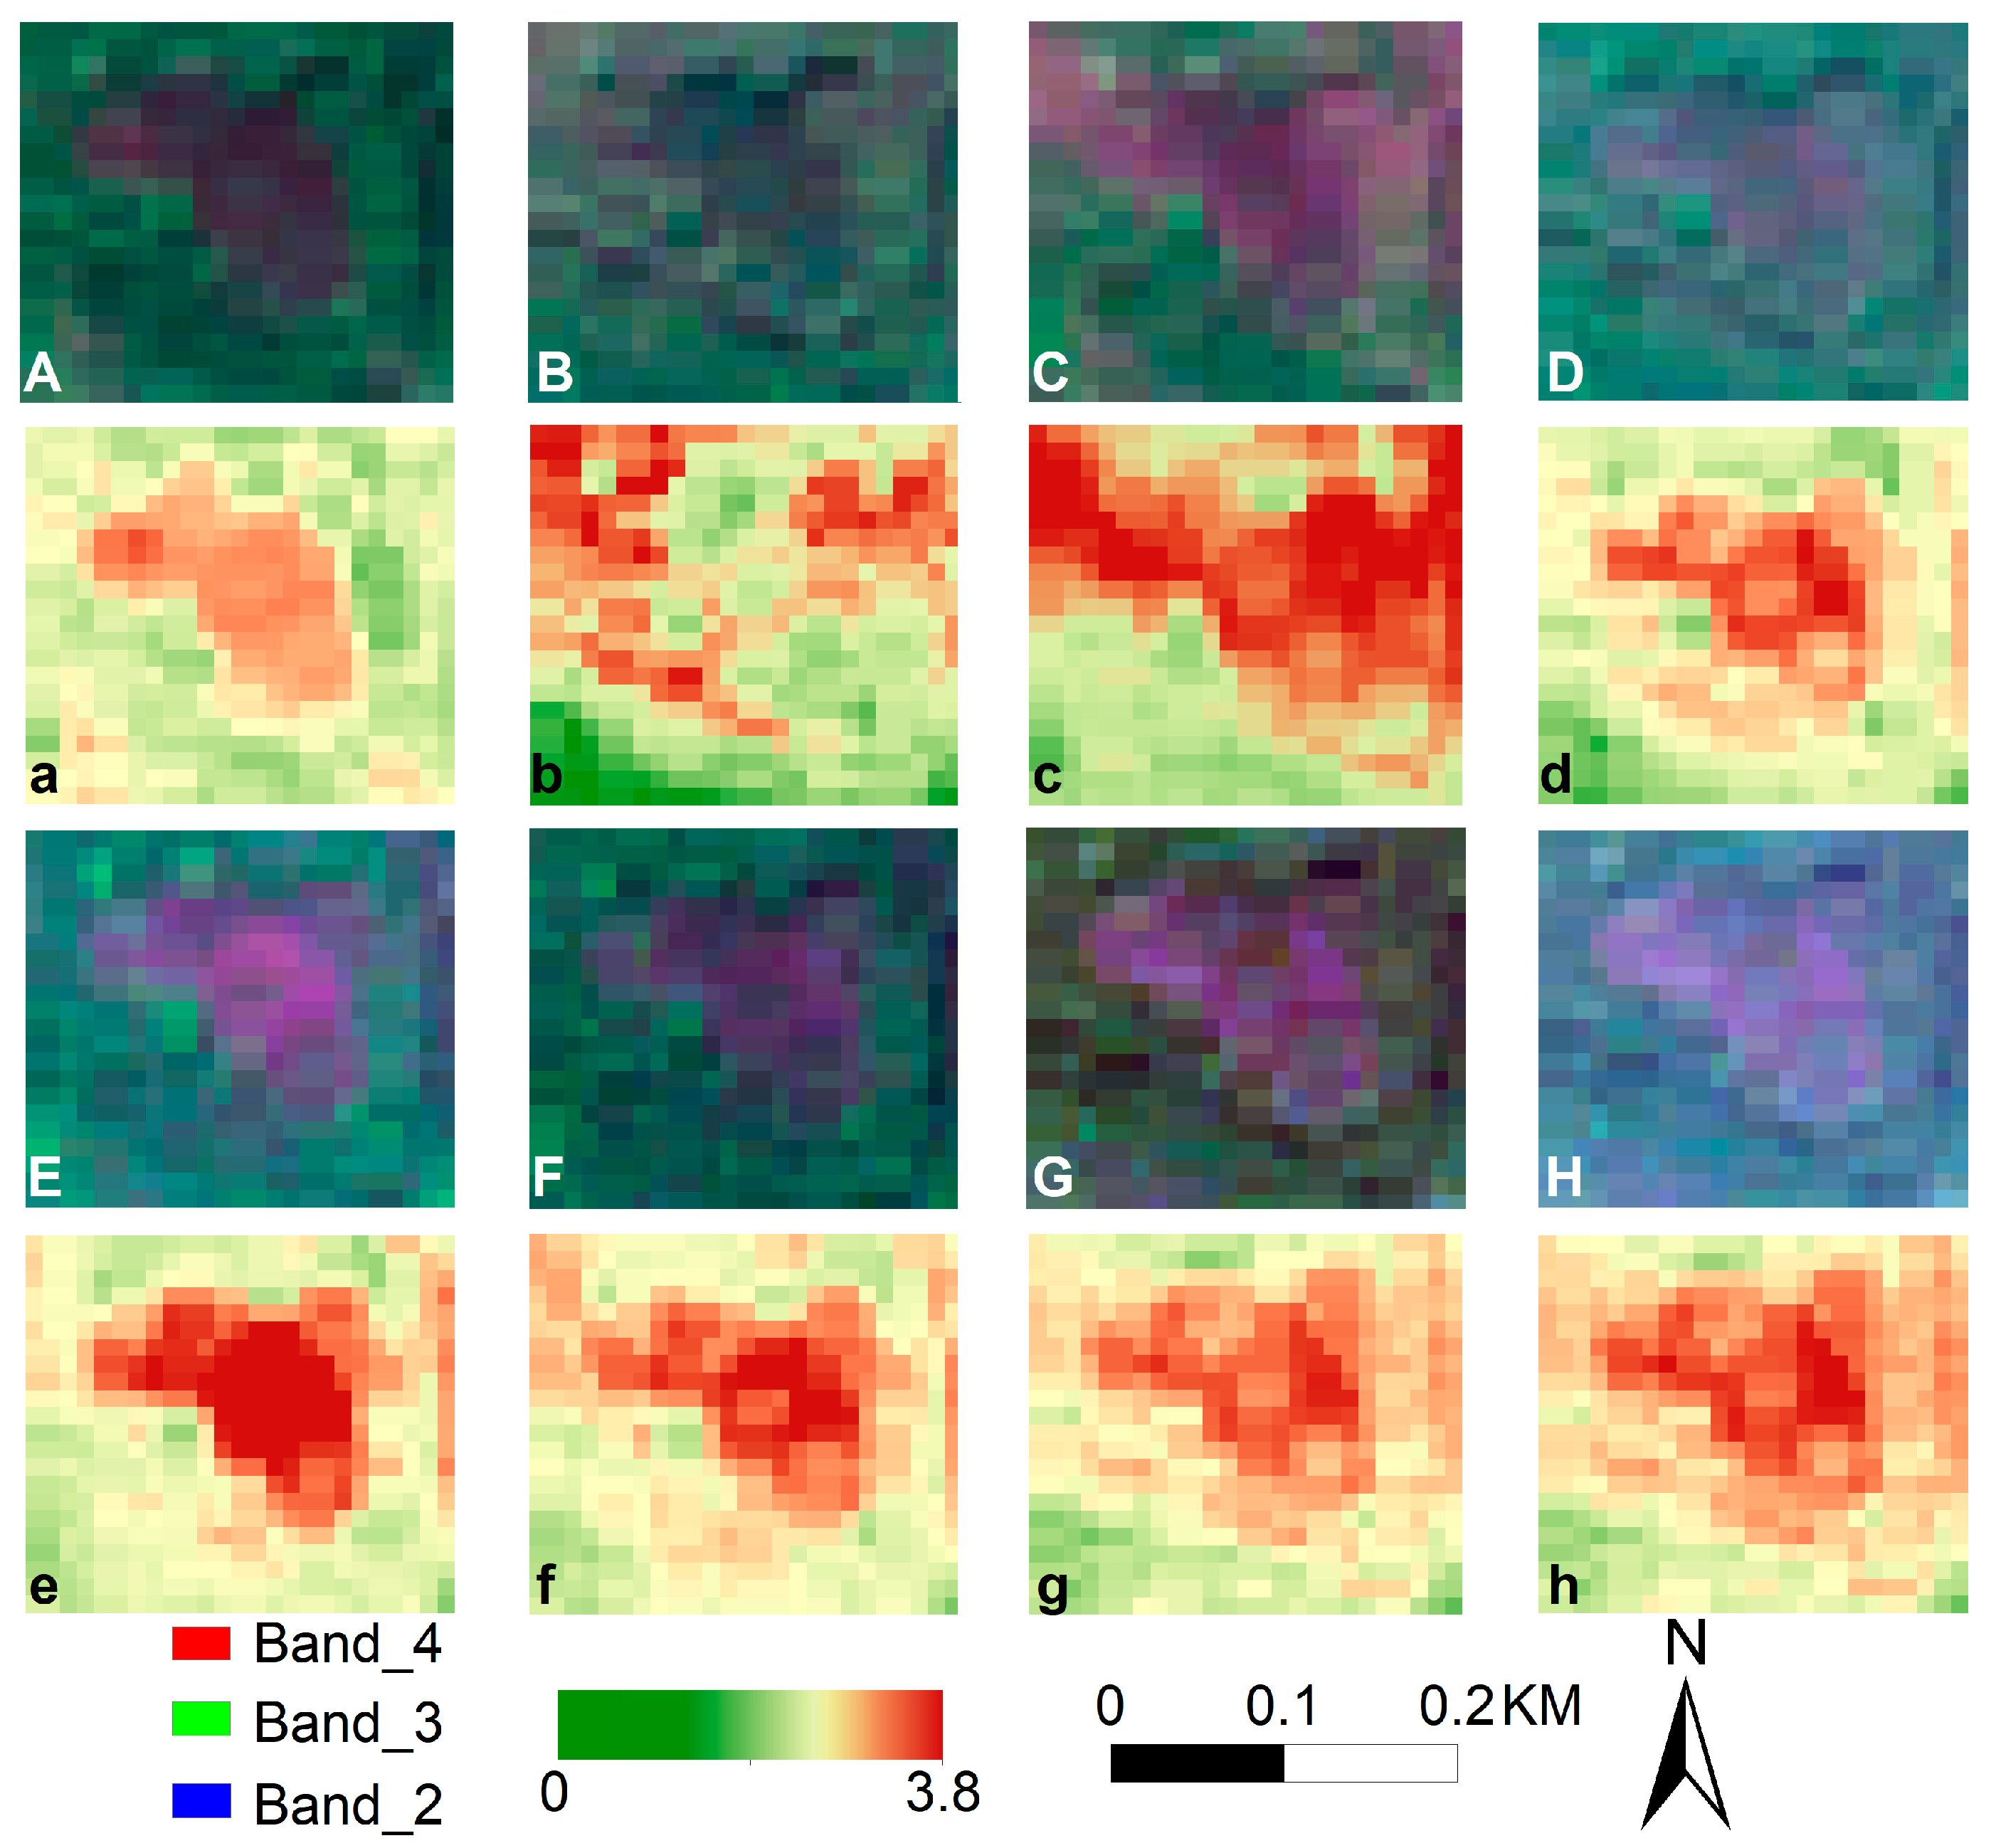
The multi-temporal LAI inversion results are shown in Appendix A Figure A3. The accuracy validation results from June 2020, presented in Appendix A Figure A2, indicate an R2 of 0.74, with predicted values slightly higher than measured values, meeting the experimental requirements. Since Larix olgensis, the main forest type in the study area, is a deciduous species, the LAI at the end of the growing season (September) is generally lower than at the beginning of the growing season (June), with the overall LAI value decreasing by about 0.1 compared to the annual average. By combining image and LAI inversion results for spatiotemporal trend verification, and comparing changes in some land classes, as shown in Appendix A Figure A4, the study confirms that the LAI trends observed are reasonable.

3.2. Evolution of the Spatiotemporal Pattern of Forest Defoliating Pest Disasters

To elucidate the trends and spatial characteristics of disaster expansion and reduction over time, this study employed a multi-temporal normalized difference index analysis method. The results are shown in Figure 3.
Overall, the pine caterpillar disasters in the study area evolved from mild to severe to mitigation. Spatially, they were mainly concentrated in the northeastern part of the study area. According to Appendix A Figure A1, the general sequence of forest types affected by the Dendrolimus superans disasters over time is Larix olgensis, Pinus sylvestris var. mongolica, Picea koraiensis, then Pinus koraiensis.
Additionally, the slope analysis results in Appendix A Figure A5 and Table A2 show that the LAI during the development phase generally exhibited a decreasing trend. In the eastern part, 13,835.35 ha of Larix olgensis forests experienced severe defoliation, with slope values showing regional negative values, the lowest reaching −1. During the mitigation period, the overall LAI tended to be positive, but some areas still showed slope values as low as −0.2. The negative value area expanded from 157.30 ha in the development phase to 857.30 ha, mainly transitioning from light to severe damage in evergreen species.
Figure 3A,D depict the spatiotemporal evolution of the disaster from occurrence to outbreak. In the early stages of the disaster, as shown in Figure 3A,B, the Larix olgensis forest areas display scattered disaster distributions, with new areas accounting for less than 3%. In June 2019 (Figure 3C), the affected area surged to 2586.84 ha, with new affected areas mainly concentrated in the Larix olgensis distribution areas, accounting for 70% of the total coniferous forest area, more than 23 times that of the pre-outbreak period. In September of the same year (Figure 3D), 32.01% of the larger patch areas continued to be affected, and 57.53% of the new disasters continued to spread to connected areas, scattered in the southwest. However, 41.05% of the areas were already recovering, with new areas exceeding the mitigated areas. Combined with the study area’s elevation model (Figure 1) and forest resource survey data, the newly affected areas during the disaster development phase were concentrated on gentle slopes (elevation changes at 17, 18; slope 3–7), low altitudes, sunny slopes (slope orientation 198–225 degrees), and young forest ages (1–4 years).
Figure 3E,H describe the mitigation process of the disaster. In June 2020 (Figure 3E), the proportion of recovery significantly increased to 66.05%, the affected area decreased by 2711.64 ha, and the proportion of new areas reduced to 24.29%, indicating that most coniferous forests began to recover, and the disaster entered a mitigation phase. In September 2020 (Figure 3F), the affected areas continued to shrink, with 45.72% of the areas showing effective disaster management and natural recovery. In June 2021 (Figure 3G), although the disaster was largely controlled, it expanded to 15.99% of new areas that were unaffected during the 2019 major outbreak, displaying a spatial pattern different from the latent period in 2018 and the outbreak period in 2019, with new affected areas mainly transitioning to evergreen species. By September 2021 (Figure 3H), the disaster situation had once again recovered.
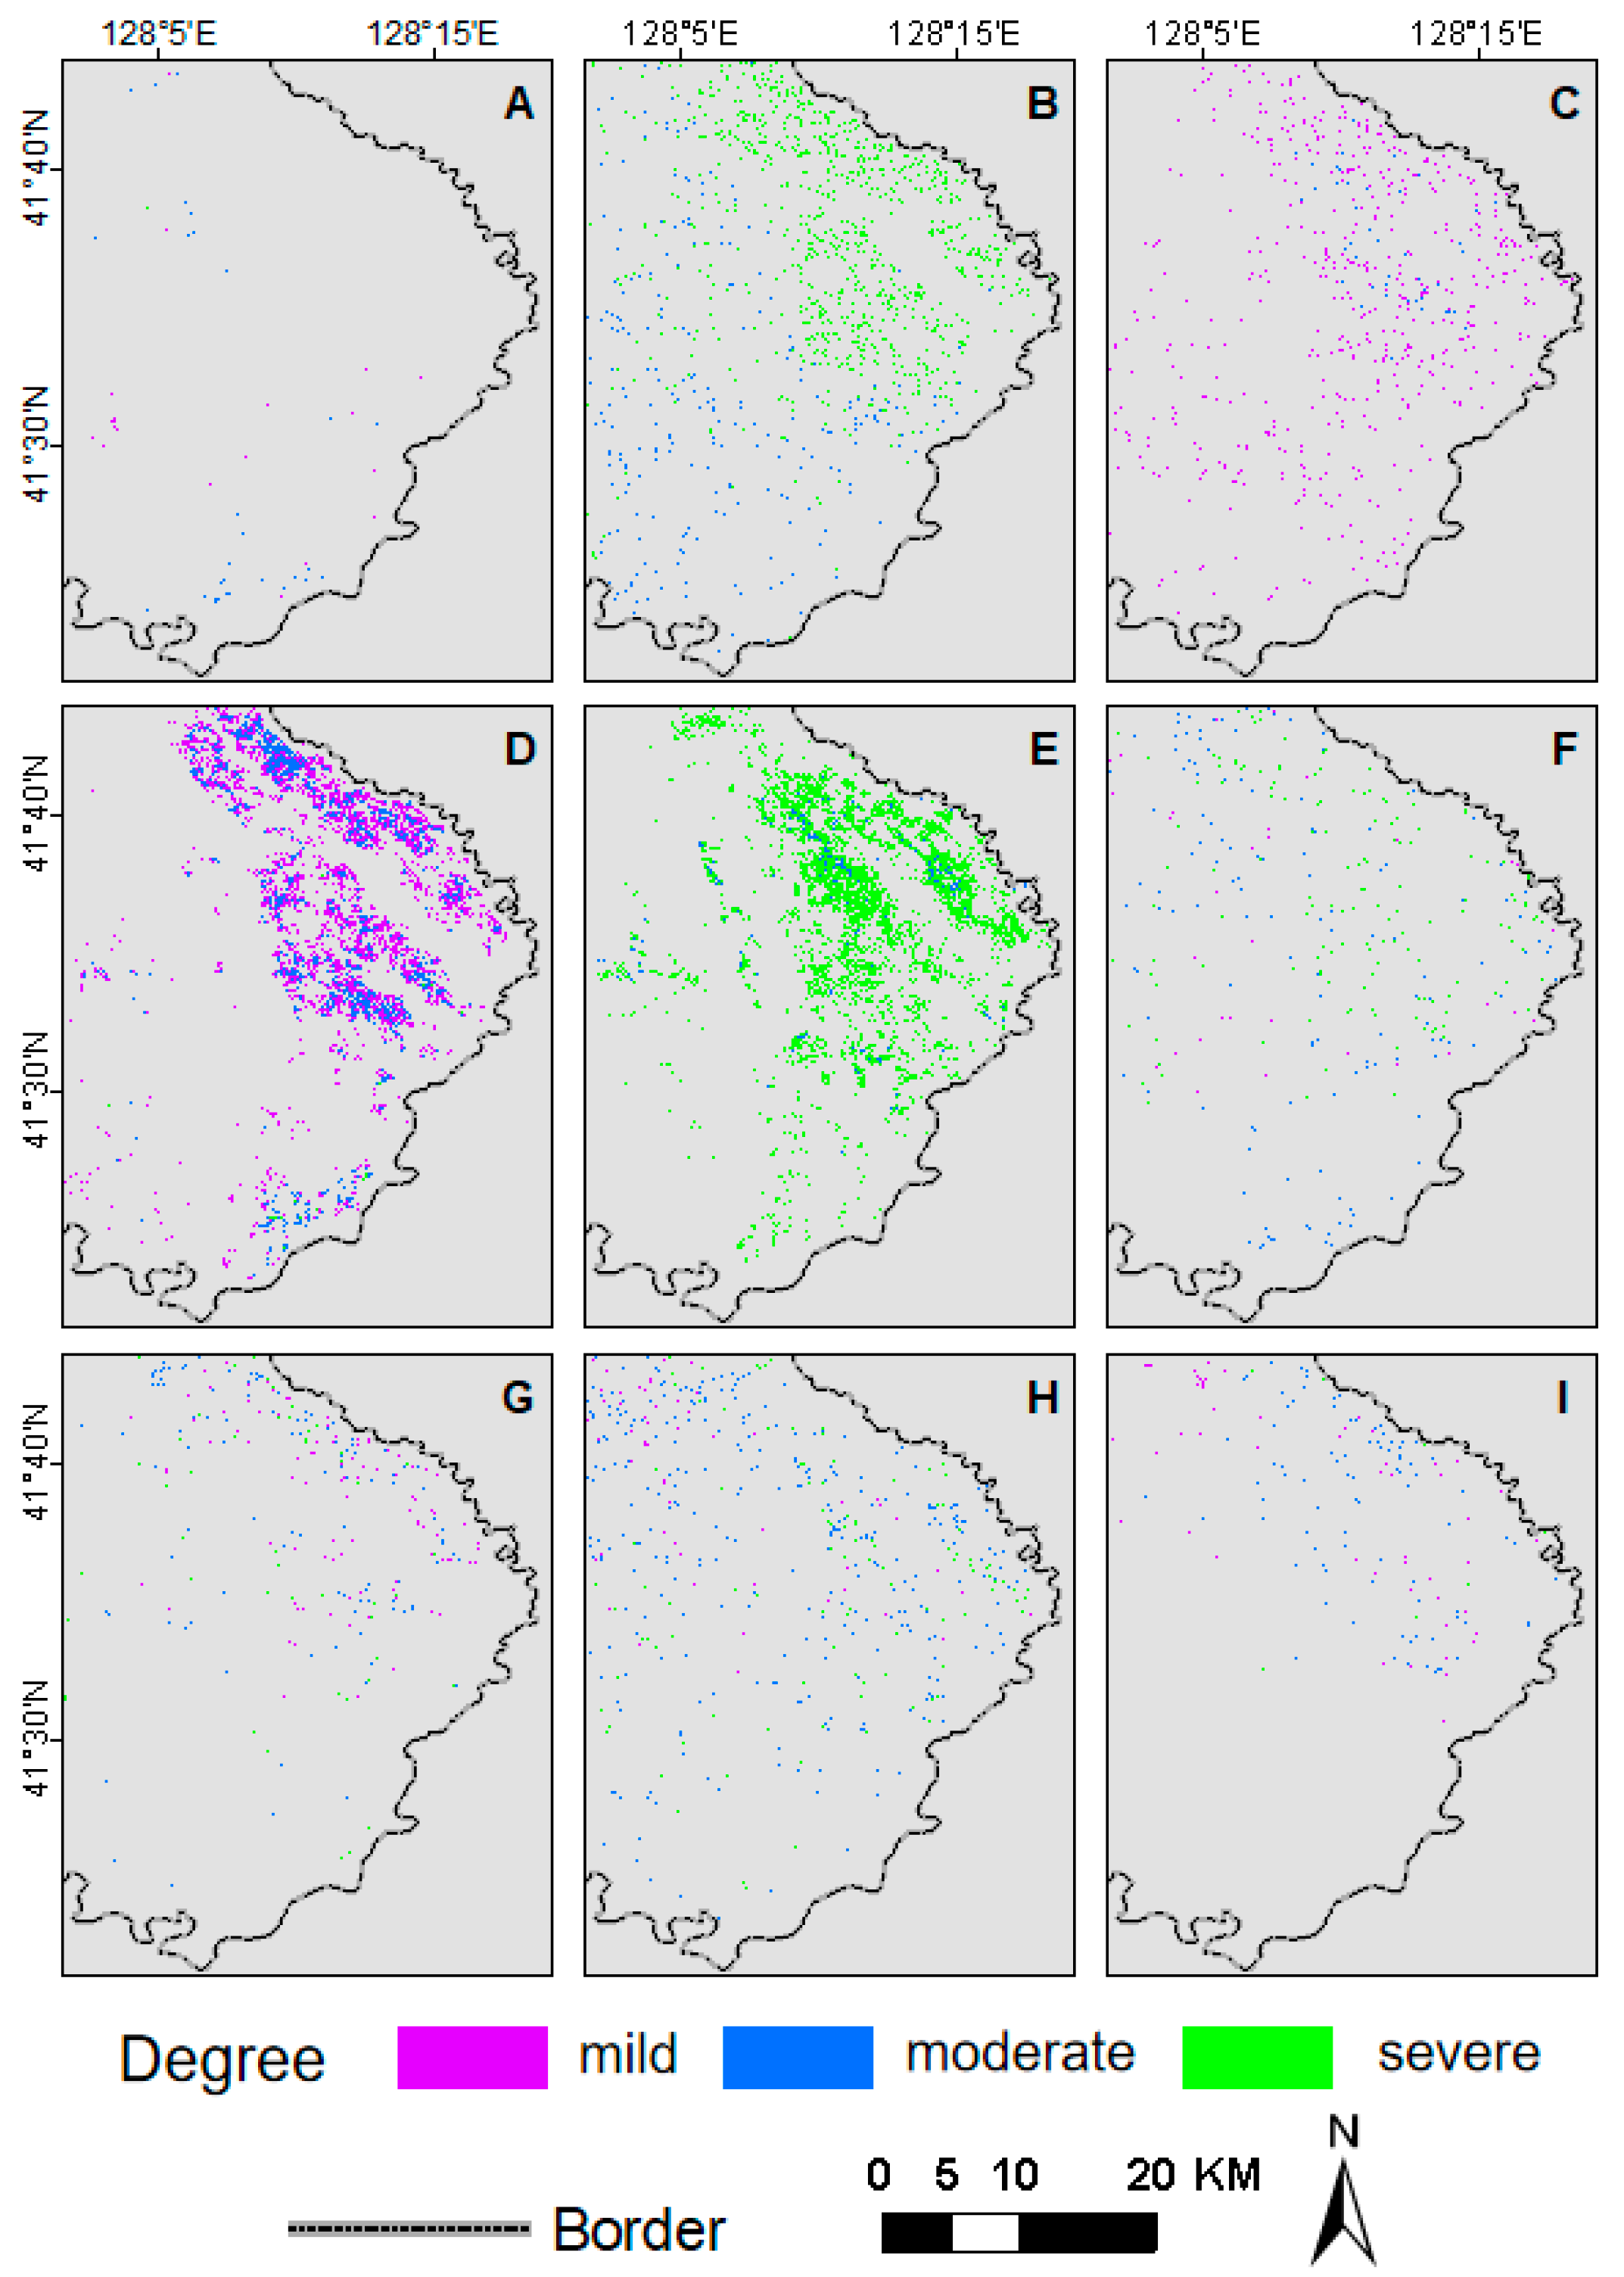
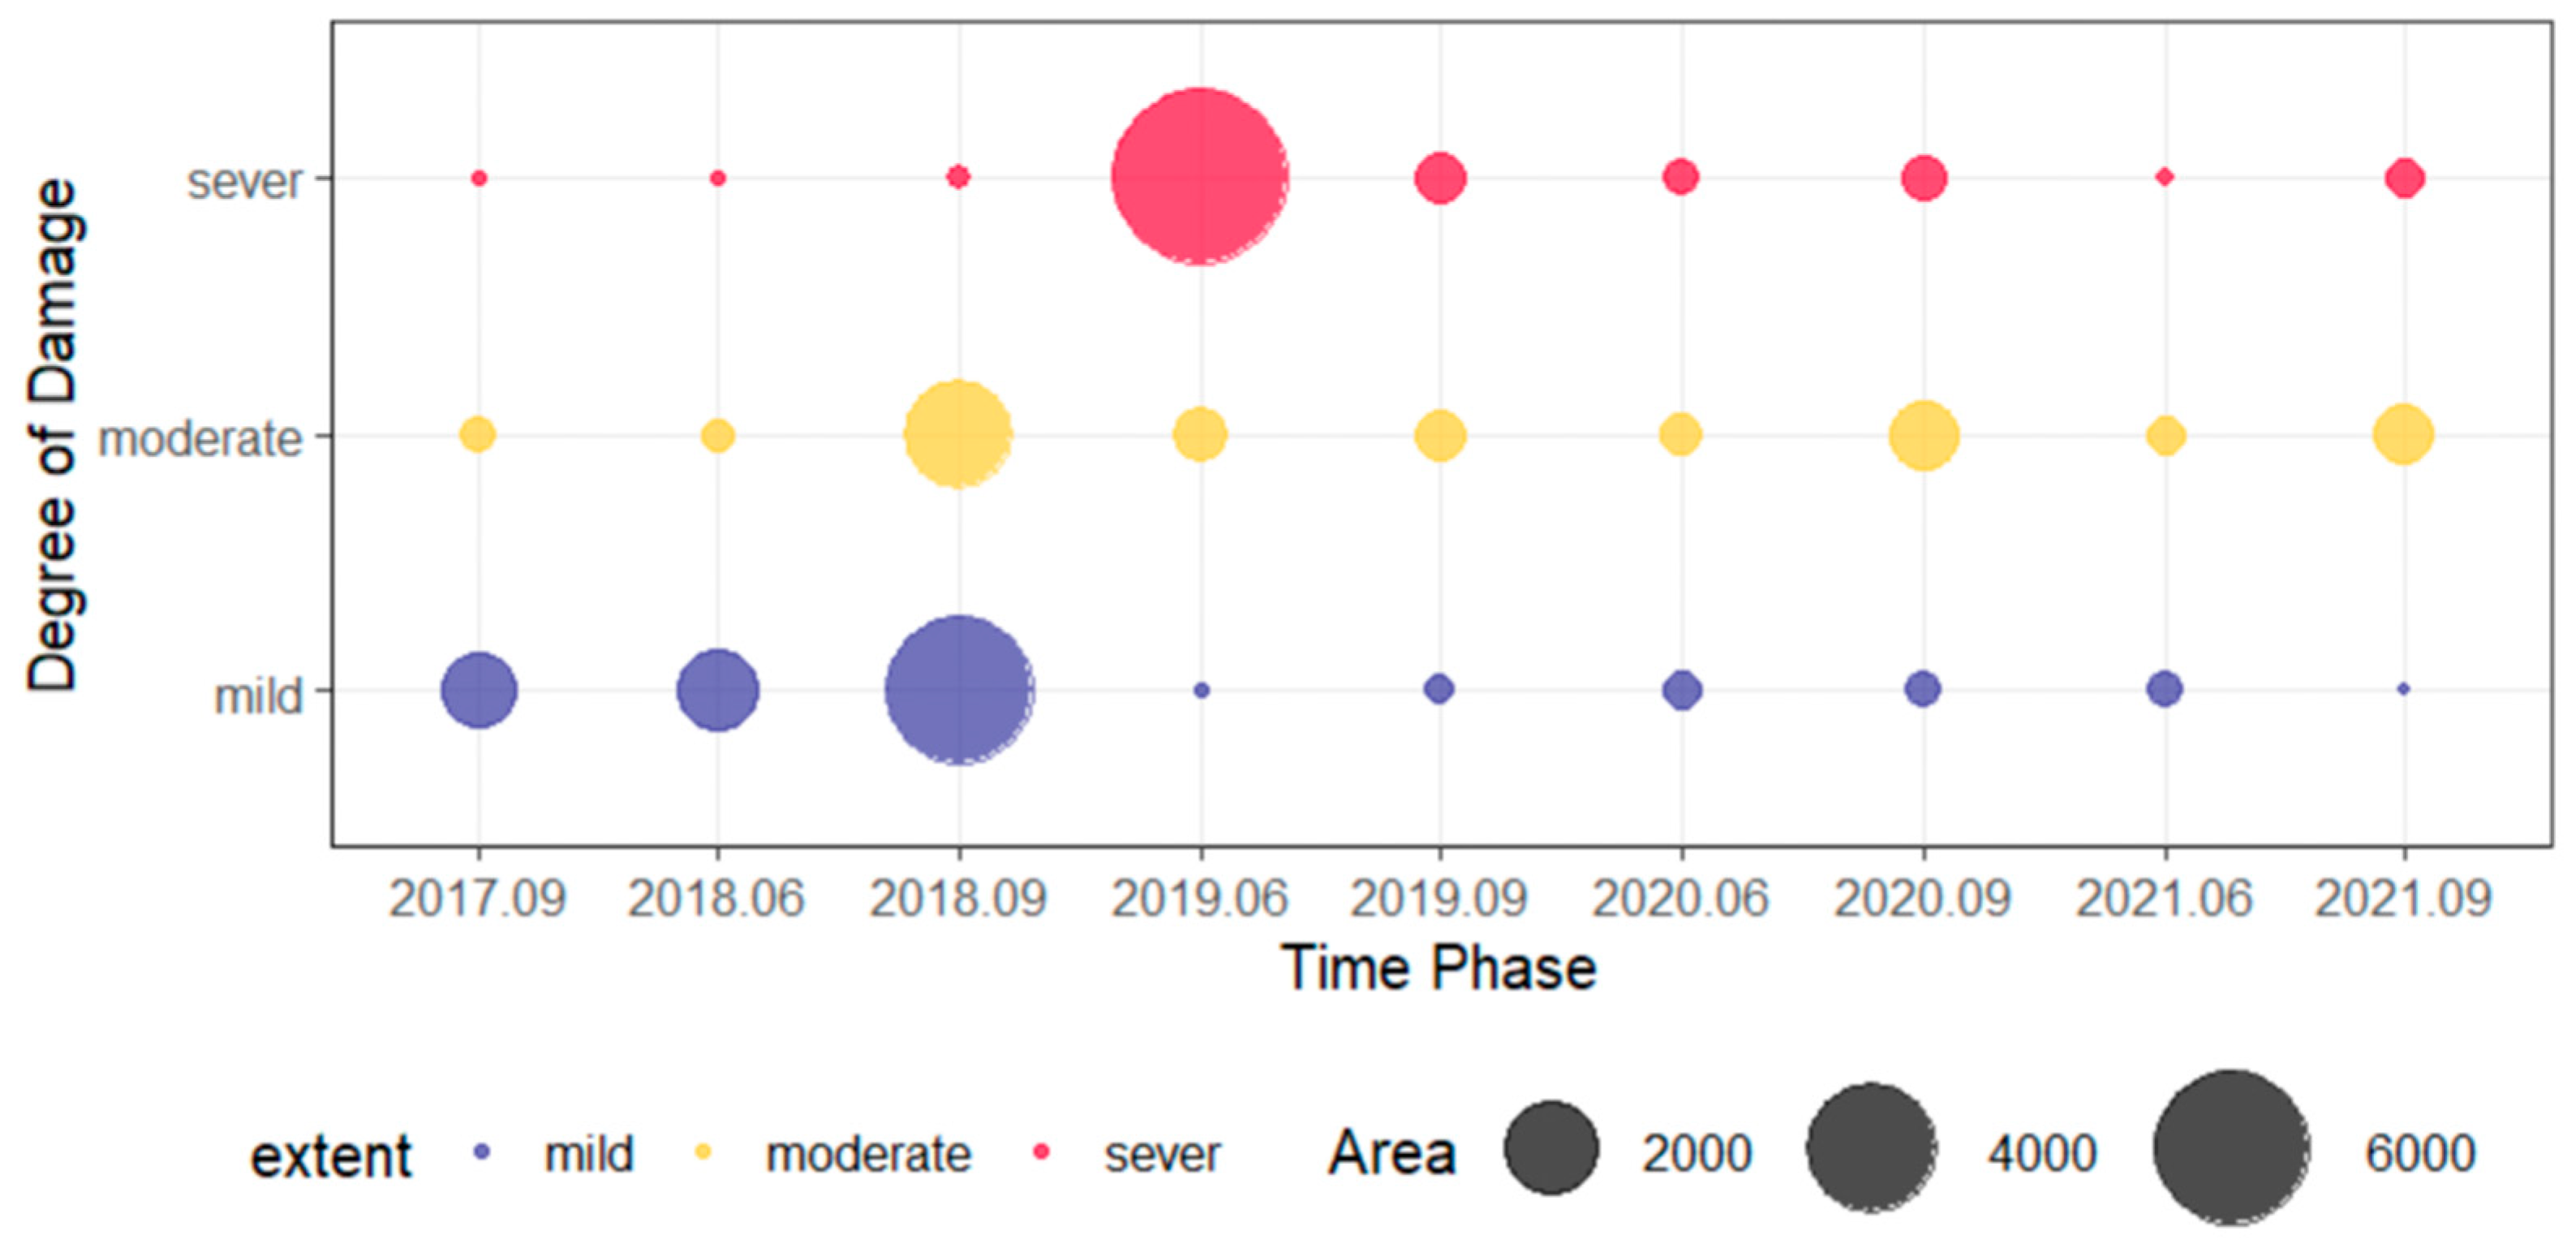
Based on further calculations derived from the visualization results in Appendix A Figure A6, an analysis of the disaster classification statistical data from 2017 to 2021 is presented in Figure 4. Initially, in 2017, disasters primarily existed in a mild form, with the area of mild disasters being only 0.1626 ha. By 2019, the severity of disasters reached a peak, rapidly increasing from 1500 ha at the end of 2018 to 8069 ha, with the area of severe disasters expanding to 7711.0149 ha. Especially in June (pre-maturity phase), the areas of mild and moderate disasters significantly increased to 100.144 ha and 427.671 ha, respectively, indicating an outbreak trend characterized by large areas but mild severity. By September (pre-overwintering phase), the severity escalated from mild and moderate to severe, with the area of severe disasters increasing to 7667 ha, showing a characteristic of small areas but high severity.
However, by 2020, after reaching a peak, the affected area began to decline. Effective mitigation measures led to a sharp reduction in the affected areas, improving the disaster situation. In 2021, although disasters essentially ceased, the area of mild disasters slightly increased in June to 185.483 ha and decreased again in September to 179.056 ha. In September, while the area of mild disasters increased, the area of severe disasters decreased to only 15.9428 ha, indicating a significant mitigation of the disaster situation in the region.

3.3. Differences in Disaster Characteristics among Different Forest Types

To further examine the development of the disaster, this study focused on the four main coniferous forest types primarily affected by Dendrolimus superans. An in-depth analysis of their disaster areas and spatiotemporal patterns was conducted.
Figure 5 illustrates the changes in the proportion of disaster-affected areas by different forest types throughout the disaster cycle. Overall, Larix olgensis consistently remained the primary affected forest type, reaching its peak disaster proportion in June 2019 at 21.19%, with an affected area of 7626 ha. This proportion gradually decreased to 0.62% by September 2020. The proportion of disaster-affected Pinus sylvestris var. mongolica peaked at 4.54% in June 2019, with an affected area of 540 ha, and decreased to 1.55% by September 2020. Pinus koraiensis reached its highest proportion in affected area at 2.55% in September 2019, but significantly decreased to 0.28% by June 2020. The proportion of disaster-affected Picea koraiensis peaked at 4.40% in September 2019, then significantly declined throughout 2020, but rebounded to 3.96% in June 2021.
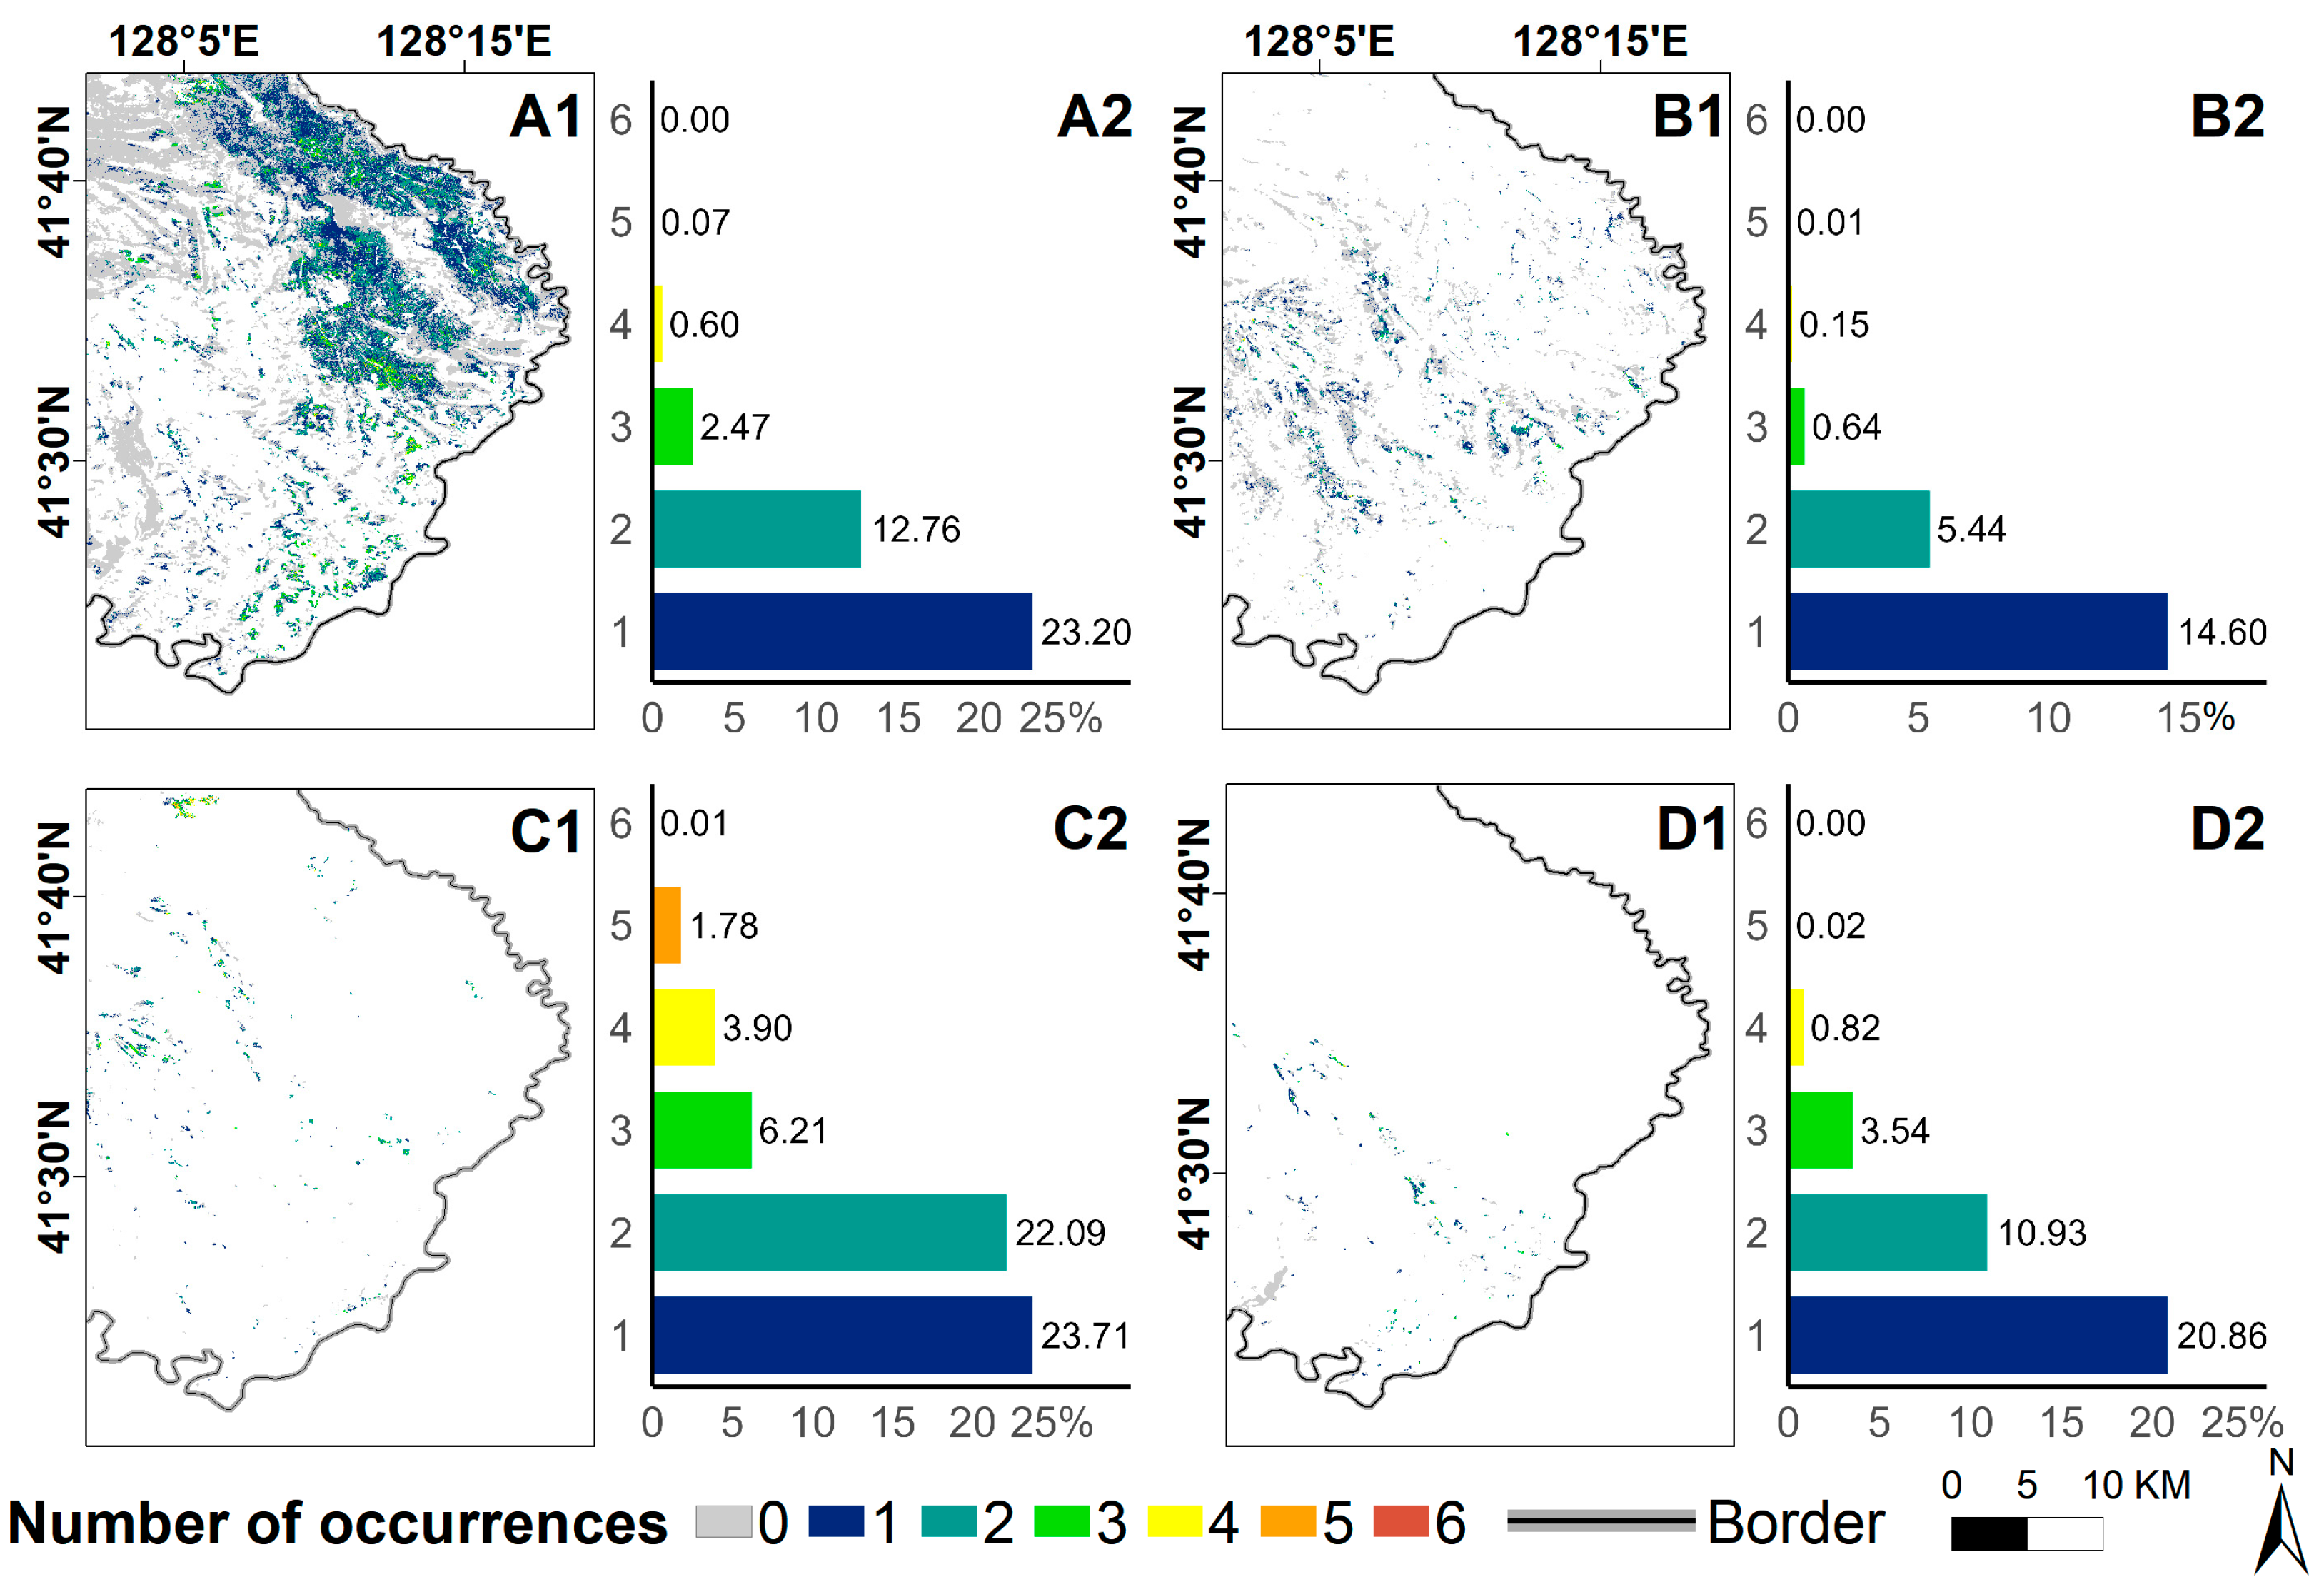
Figure 6 illustrates the disaster frequency for each forest type during the entire disaster period. As shown in Figure 6(A1,A2), Larix olgensis had the largest disaster-affected area at each time stage, with a single-stage disaster proportion reaching as high as 23.20%. These areas are primarily distributed in the northern region, with high-frequency occurrences concentrated in the central-eastern and southeastern areas near farmlands, indicating a pattern of low frequency but wide distribution.
In contrast, Figure 6(B1,B2) show that Picea koraiensis had a smaller affected area, at 14.60%, with a more scattered spatial distribution, mainly concentrated in the central and eastern regions. Figure 6(C1,C2) reveal that Pinus sylvestris var. mongolica had the highest single-stage disaster-affected area, reaching 23.71%, and exhibited a high frequency across multiple time stages, primarily in the northern region. Figure 6(D1,D2) indicate that Pinus koraiensis had a disaster proportion of 20.86%, primarily concentrated in the southwestern region, with a lower frequency.
Overall, Larix olgensis and Pinus sylvestris var. mongolica show prominent disaster areas and frequencies across multiple time stages, exhibiting characteristics of high disaster persistence and wide distribution. In contrast, Picea koraiensis and Pinus koraiensis had lower disaster areas and frequencies, with more scattered distributions, indicating lower disaster persistence. These differences reflect the various response patterns of different forest types to pine caterpillar disasters. Larix olgensis and Pinus sylvestris var. mongolica are more sensitive to disasters, with widespread affected areas and high frequencies, while Picea koraiensis and Pinus koraiensis experience more localized disasters with lower frequencies.

3.4. Driving Factors and Their Interactions in Different Forest Types

To further explore the driving factors of disasters and their interactions in different forest types, this study utilized geographical detector technology. Focusing on the four main coniferous forest types within the study area, we analyzed the multifactorial interactions affecting both the development and mitigation phases of the disaster and quantified their effects. The geographical detector tested 22 environmental factors, all with p-values less than 0.0001, indicating high statistical significance. Specific q-values and significance results are detailed in Appendix A Table A3.
During the development phase of the forest defoliating pest disaster cycle (Figure 7A), humidity in 2018 (M12) was a key factor, negatively correlated with the disaster, with a q-value of 0.27. Sunlight (M11) followed, with a q-value of −0.15. When analyzing by forest type, the impact factors for each type became clearer. Larix olgensis was particularly sensitive to humidity in 2018 (M12), with a high q-value of 0.33. Evergreen species such as Pinus sylvestris var. mongolica and Picea koraiensis were more sensitive to humidity in 2019 (M13). However, considering the sequence of pest occurrences, it was the previous year’s humidity that played a decisive role in the early development of pests, with Picea koraiensis and Pinus sylvestris var. mongolica showing higher significance than Larix olgensis. The development of disasters in Pinus koraiensis was primarily influenced by slope orientation (G3), with a q-value of 0.16. The effect of average temperature (M1–M3) on Pinus koraiensis was ten times that of the overall sample, with a q-value of 0.05. Additionally, Pinus sylvestris var. mongolica was significantly influenced by altitude (G2), with a q-value of 0.22.
In the disaster mitigation and recovery phase (Figure 7B), summer rainfall (M8) was the most significant factor, with a q-value of 0.12, followed by slope orientation (G3). Significant differences were observed in the recovery growth patterns of different forest types. In 2019, the influence of altitude (G1) on Pinus koraiensis was higher but not as significant as during the development phase, with a q-value of 0.09. Larix olgensis’s growth depended on soil type (G4), with dark brown soil negatively correlated with the disaster, having a q-value of −0.14. Picea koraiensis was significantly affected by the slope (G2), with a q-value of 0.24, indicating that the slope was a key factor in the recovery of Picea koraiensis.
Moreover, forest spatial structure factors such as stand age (S2) and stand density (S5) significantly influenced the development and recovery of disasters across forest types. The influence of origin (S1) ranked second, with its impact ratio being 2.3 times higher than during the development phase, and its significance exceeding that of the development phase. During the development phase, Larix olgensis showed a minor response to stand age with a q-value of 0.02 but was more sensitive to stand density, with a q-value of 0.06. Pinus sylvestris var. mongolica and Pinus koraiensis showed more significant responses to stand age and stand density, particularly Pinus koraiensis, which was significantly influenced by stand age with a q-value of 0.10.
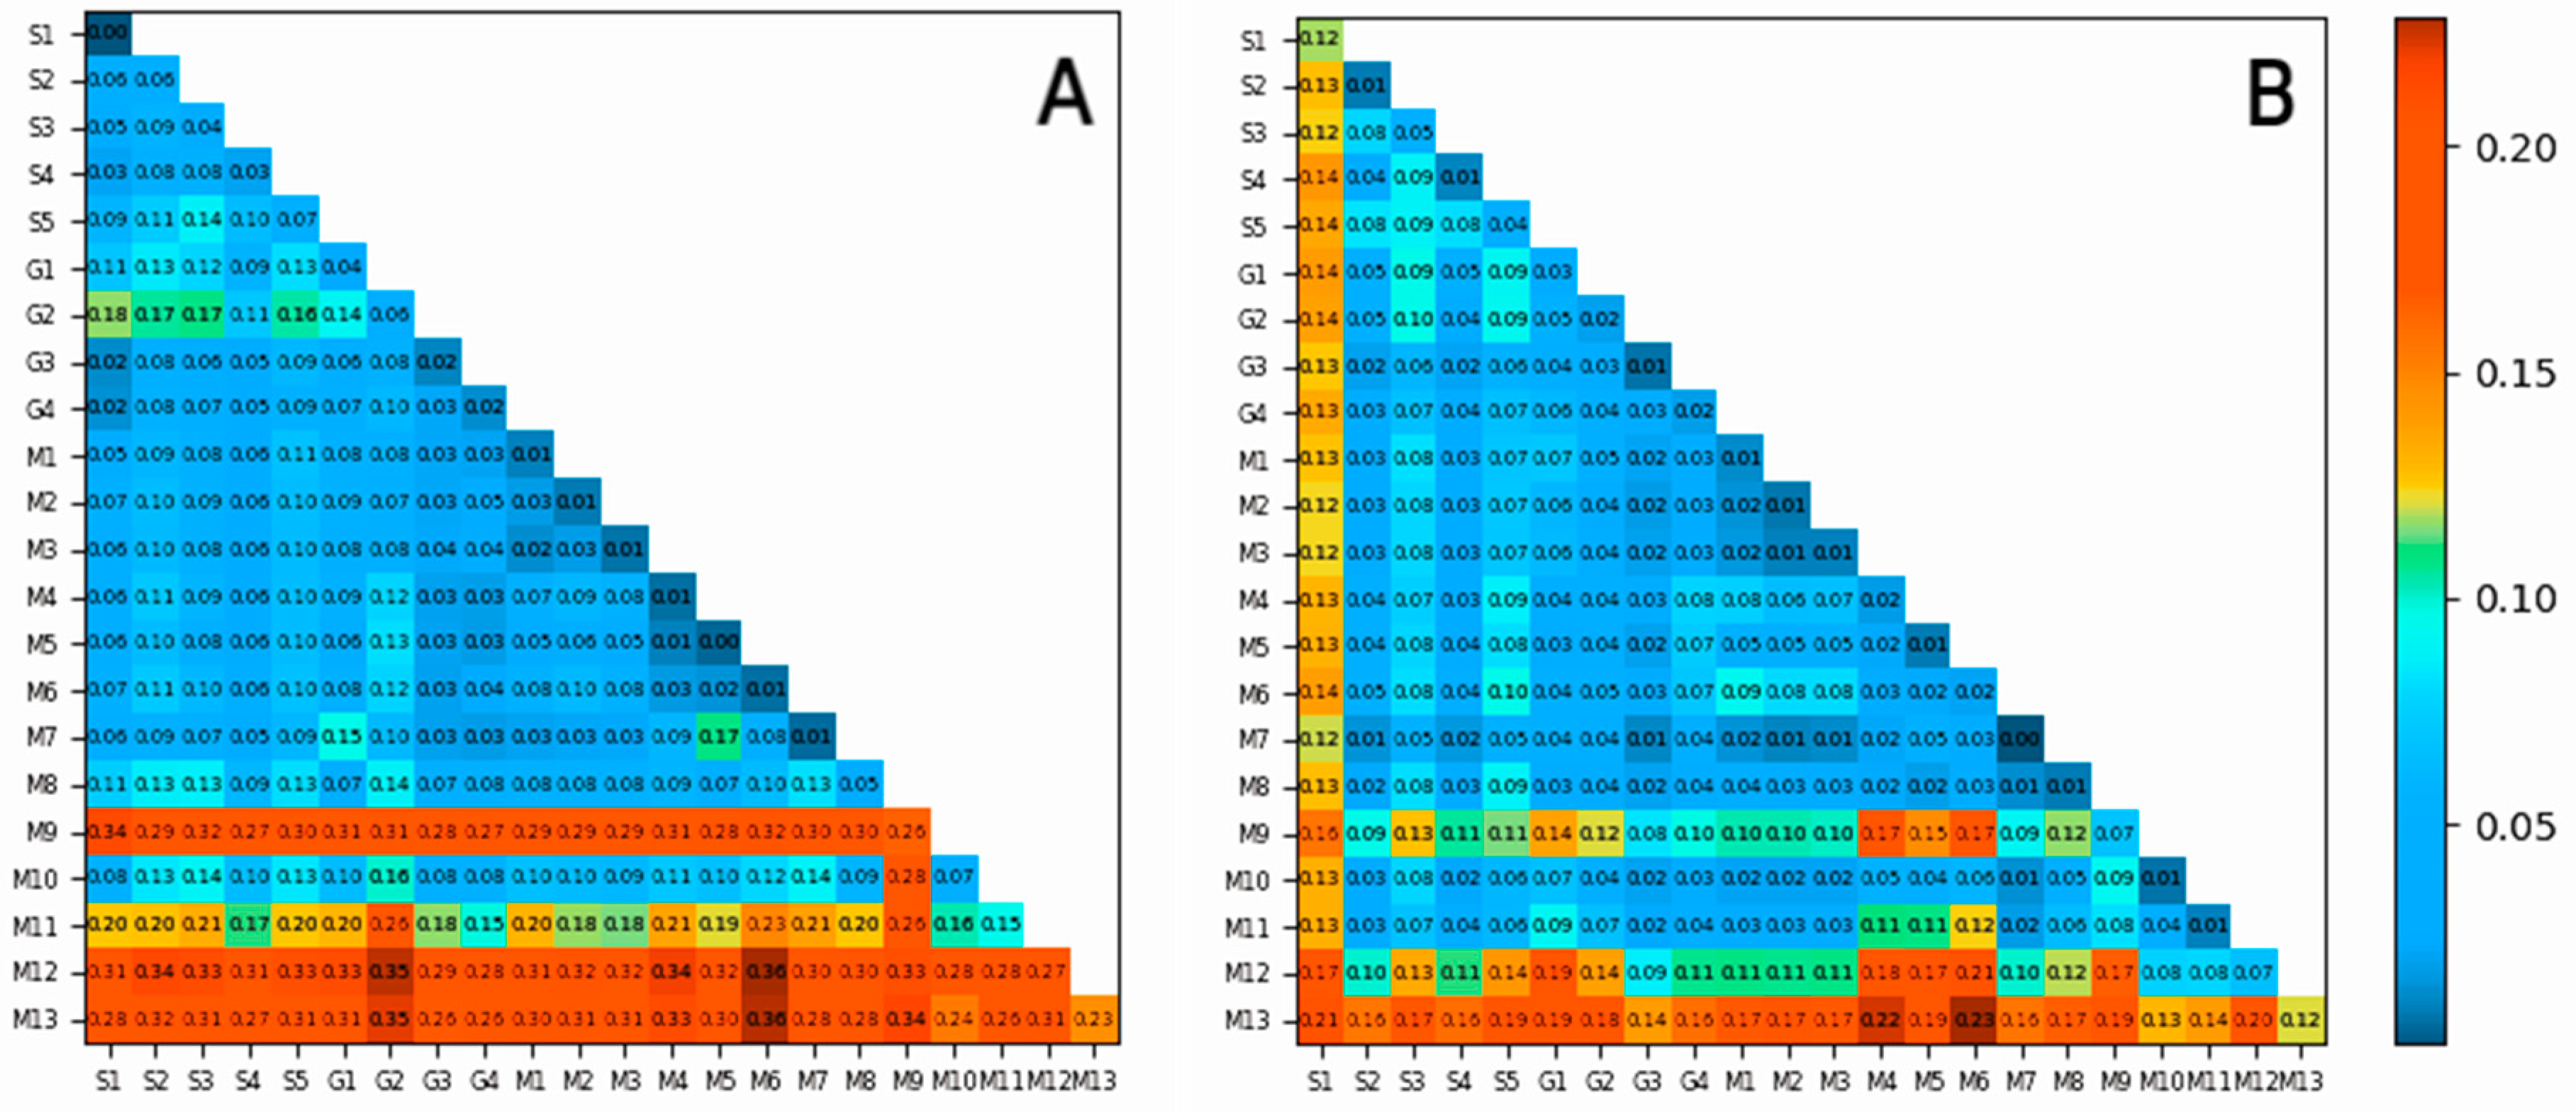
By examining the coupling of two variables’ spatial distributions, Figure 8 reveals the synergistic interactions among various factors during the development (Figure 8A) and mitigation (Figure 8B) phases of forest defoliating pest disasters. The results indicate that enhanced spatial-distribution coupling of two variables strengthens the processes of pest disaster development and recovery. The synergistic interactions among all driving factors have intensified their impact on both disaster development and recovery. Among 276 interaction combinations, there were 42 pairs of bi-variable enhancements during the pest disaster development phase, and 28 pairs during the disaster mitigation and recovery phase; the rest of the interactions exhibited non-linear enhancements.
Overall, the interaction between humidity in 2019 (M13) and the lowest winter temperature in 2020 (M6) showed the greatest explanatory power in explaining regional differences during the development and disaster mitigation phases, with q-values of 0.36 and 0.23, respectively. This indicates that climatic conditions such as humidity and temperature have a decisive impact on pest activity. In different forest types, the interaction between humidity and density predominates in spreading disasters during the development phase, with q-values all exceeding 0.35. During the disaster mitigation and recovery phase, the results of interactions among factors show significant differences, with generally high q-values, indicating that the synergistic effects of environmental factors are equally important in disaster recovery.

4. Discussion

4.1. Spatiotemporal Pattern Evolution

Using five years of time-series remote sensing data from 2017 to 2021, this study calculated the differences in leaf area index (LAI) to quantitatively describe the spatial changes in forest defoliating pest disasters over time. This approach fully reconstructed the onset, intensification, mitigation, and recovery processes of a pine caterpillar disaster. The pattern of disaster severity aligns with the statistical outcomes from the European and Mediterranean Plant Protection Organization (EPPO) [48] and observations by Bragard Claude [49]. The study clarified the sequence of forest types affected by these disasters as follows: Larix olgensis, Pinus sylvestris var. mongolica, Picea koraiensis, then Pinus koraiensis. This sequence is primarily influenced by the trees’ susceptibility to pests and their coniferous structure, with pests accessing Larix olgensis more easily compared to the dense resinous needles of Picea koraiensis and Pinus koraiensis [50]. Disasters typically begin with Larix olgensis and, as pest generations and population density increase, gradually shift to evergreen species, causing extensive defoliation and tree mortality when disaster severity is high.
This study observed that during the pre-maturity phase (June), disaster characteristics were marked by large affected areas but mild severity. Entering the pre-overwintering phase (September), the characteristics shifted to smaller areas but higher severity, aligning closely with the patterns and trends reported by Yanqing Liu [26]. This validates that the larval stage of pine caterpillars is the most active phase of their lifecycle [51], and the reduction in affected area before overwintering may relate to a decrease in susceptible forest types or an increase in effective natural enemies [52]. Compared to previous studies that focused on single-tree-level defoliation assessments, which could only measure at a point scale to describe their annual patterns [53], our addition of spatial mapping allows for a comprehensive understanding of disaster dynamics, addressing issues of coarse spatial granularity faced by whole-forest-level monitoring [25]. Furthermore, this paper uses a finer spatial scale to analyze the process of disaster occurrence, providing more precise monitoring of disaster dynamics, and addressing the limitations of similar large-scale studies that used administrative area-based data [26] to reveal spatial distribution trends and perform fine-grained spatial analyses. Cen Chen’s model for predicting the spatiotemporal patterns of leaf loss due to pest damage requires over a hundred times the computational effort to achieve the precision of this study [54]. In the temporal dimension, unlike previous studies that assessed leaf fall in most plots in July based on the phenology of dominant forest types [55], this study has broadened the monitoring window, addressing the challenges of acquiring historical data in long time-series monitoring [18].
To compare the differences in the incidence of disasters caused by pine caterpillars among different forest types, this study analyzed the disaster frequency and recurring patterns at the same locations within different forest types. The results show that the Pinus sylvestris var. mongolica forest type exhibits higher disaster frequencies and tendencies for repeated disasters at the time of occurrence, while Larix olgensis shows the lowest number of disasters at the same location, indicating lower frequency and recurrence rates, possibly due to its physiological and ecological characteristics [56]. Compared to previous monitoring results for all forest types [57], this study better showcases the disaster development characteristics of the main affected forest types.

4.2. Driving Factors of Pine Caterpillar Disasters

In exploring the driving factors of pest outbreaks, this study broadens the research scope by comprehensively considering the multidimensional interactions of meteorological, geographical, and forest structural factors. Utilizing geographical detector technology, we conducted an in-depth analysis of the influencing factors and their interactions for four coniferous forest types during the pest development and recovery phases.
The study reveals that environmental moisture content is likely a key factor ensuring the survival rate of overwintering larvae [58]. Larvae undergo diapause in winter, and their survival after overwintering is a major mortality event in the life cycle of the larch caterpillar, crucial for the subsequent feeding stage population size [59]. Results show that meteorological factors significantly influence the four tree species during the pest development stage, with an explanatory power reaching 64%.
Moreover, as depicted in Figure 9, the analysis of climatic trends over the study period reveals that temperature exhibited pronounced seasonal oscillations, reaching its apex during the summer months, while relative humidity generally declined with rising temperatures. Precipitation patterns demonstrated significant variability, reflecting the seasonal dynamics. Of particular note is the anomalous climatic event observed in the spring of 2019, characterized by exceptionally high temperatures coupled with markedly diminished precipitation. This rare phenomenon likely exacerbated environmental stressors, thereby heightening the susceptibility of the affected regions during the subsequent pest outbreak.
Relative humidity has a q-value of 0.27 and shows an inverse correlation with pest outbreaks, indicating that lower humidity levels are associated with a higher likelihood of outbreaks, aligning with the findings of Lei Fang et al. [18]. Over 60% of the affected areas during outbreaks were in regions with low humidity, although some outbreaks still occurred in moderate to high humidity areas, as detailed in Table 3. This suggests that, while humidity is a key factor, it is not the sole determinant, as other environmental factors also play a significant role. This highlights the prominent role of relative humidity in early pest development, compared to the previous focus on temperature and precipitation [60].
Although meteorological factors directly regulate pine caterpillar population dynamics, stand characteristics and topography also significantly influence pest distribution [61]. Unlike previous studies that merely revealed the impact of individual factors [45], this research finds that topographical factors play a crucial role during the disaster mitigation phase, rather than throughout the entire process. Spatial heterogeneity factors such as slope [62] help identify pest distribution patterns under specific environmental conditions. High biodiversity and complex biological networks in natural forests aid in quicker ecosystem recovery from disasters [44]. The origin (S1) ranks second in influence during the disaster mitigation period, with its impact ratio being 2.3 times higher than during the development phase, indicating that natural mixed forests recover better than plantations. Referring to existing management strategies, employing mixed forest creation to enhance stand resilience [46] is recommended for prevention and control. Different forest types exhibit varying vulnerabilities to forest leaf-eating pest disasters due to their unique growth characteristics and specific ecological needs [20]. For example, the disaster development in Pinus koraiensis is mainly positively influenced by microhabitat temperature and humidity affected by slope orientation [40], while Pinus sylvestris var. mongolica is positively correlated with altitude [45].
Furthermore, the sensitivity of forests to pine caterpillar outbreaks is regulated by the comprehensive modulation of topography, climate, and forest characteristics. Previous studies [7] often focused on using a single explanatory variable to interpret outbreak susceptibility. This study quantitatively describes the coupling effects of factors on forest sensitivity to insect outbreaks using geographical detectors. Results show that the interaction between humidity and density dominates during the pest development phase. The synergistic interactions of topography and climate have the most significant impact on environmental susceptibility, exhibiting non-linear enhancement, with q-values ranging from 1.3 to 11.5 times that of single factors.

4.3. Significance and Limitations

This study introduces a refined and innovative method for remote sensing monitoring of forest defoliating pests based on LAI difference analysis. It overcomes the limitations of traditional methods that heavily rely on manual data collection [27], offering stronger physical significance compared to methods that directly depend on optical remote sensing vegetation indices [28]. By integrating LAI analysis, this method provides a more detailed and accurate depiction of pest-induced defoliation across various spatial and temporal scales, thus contributing significantly to forest pest management strategies.
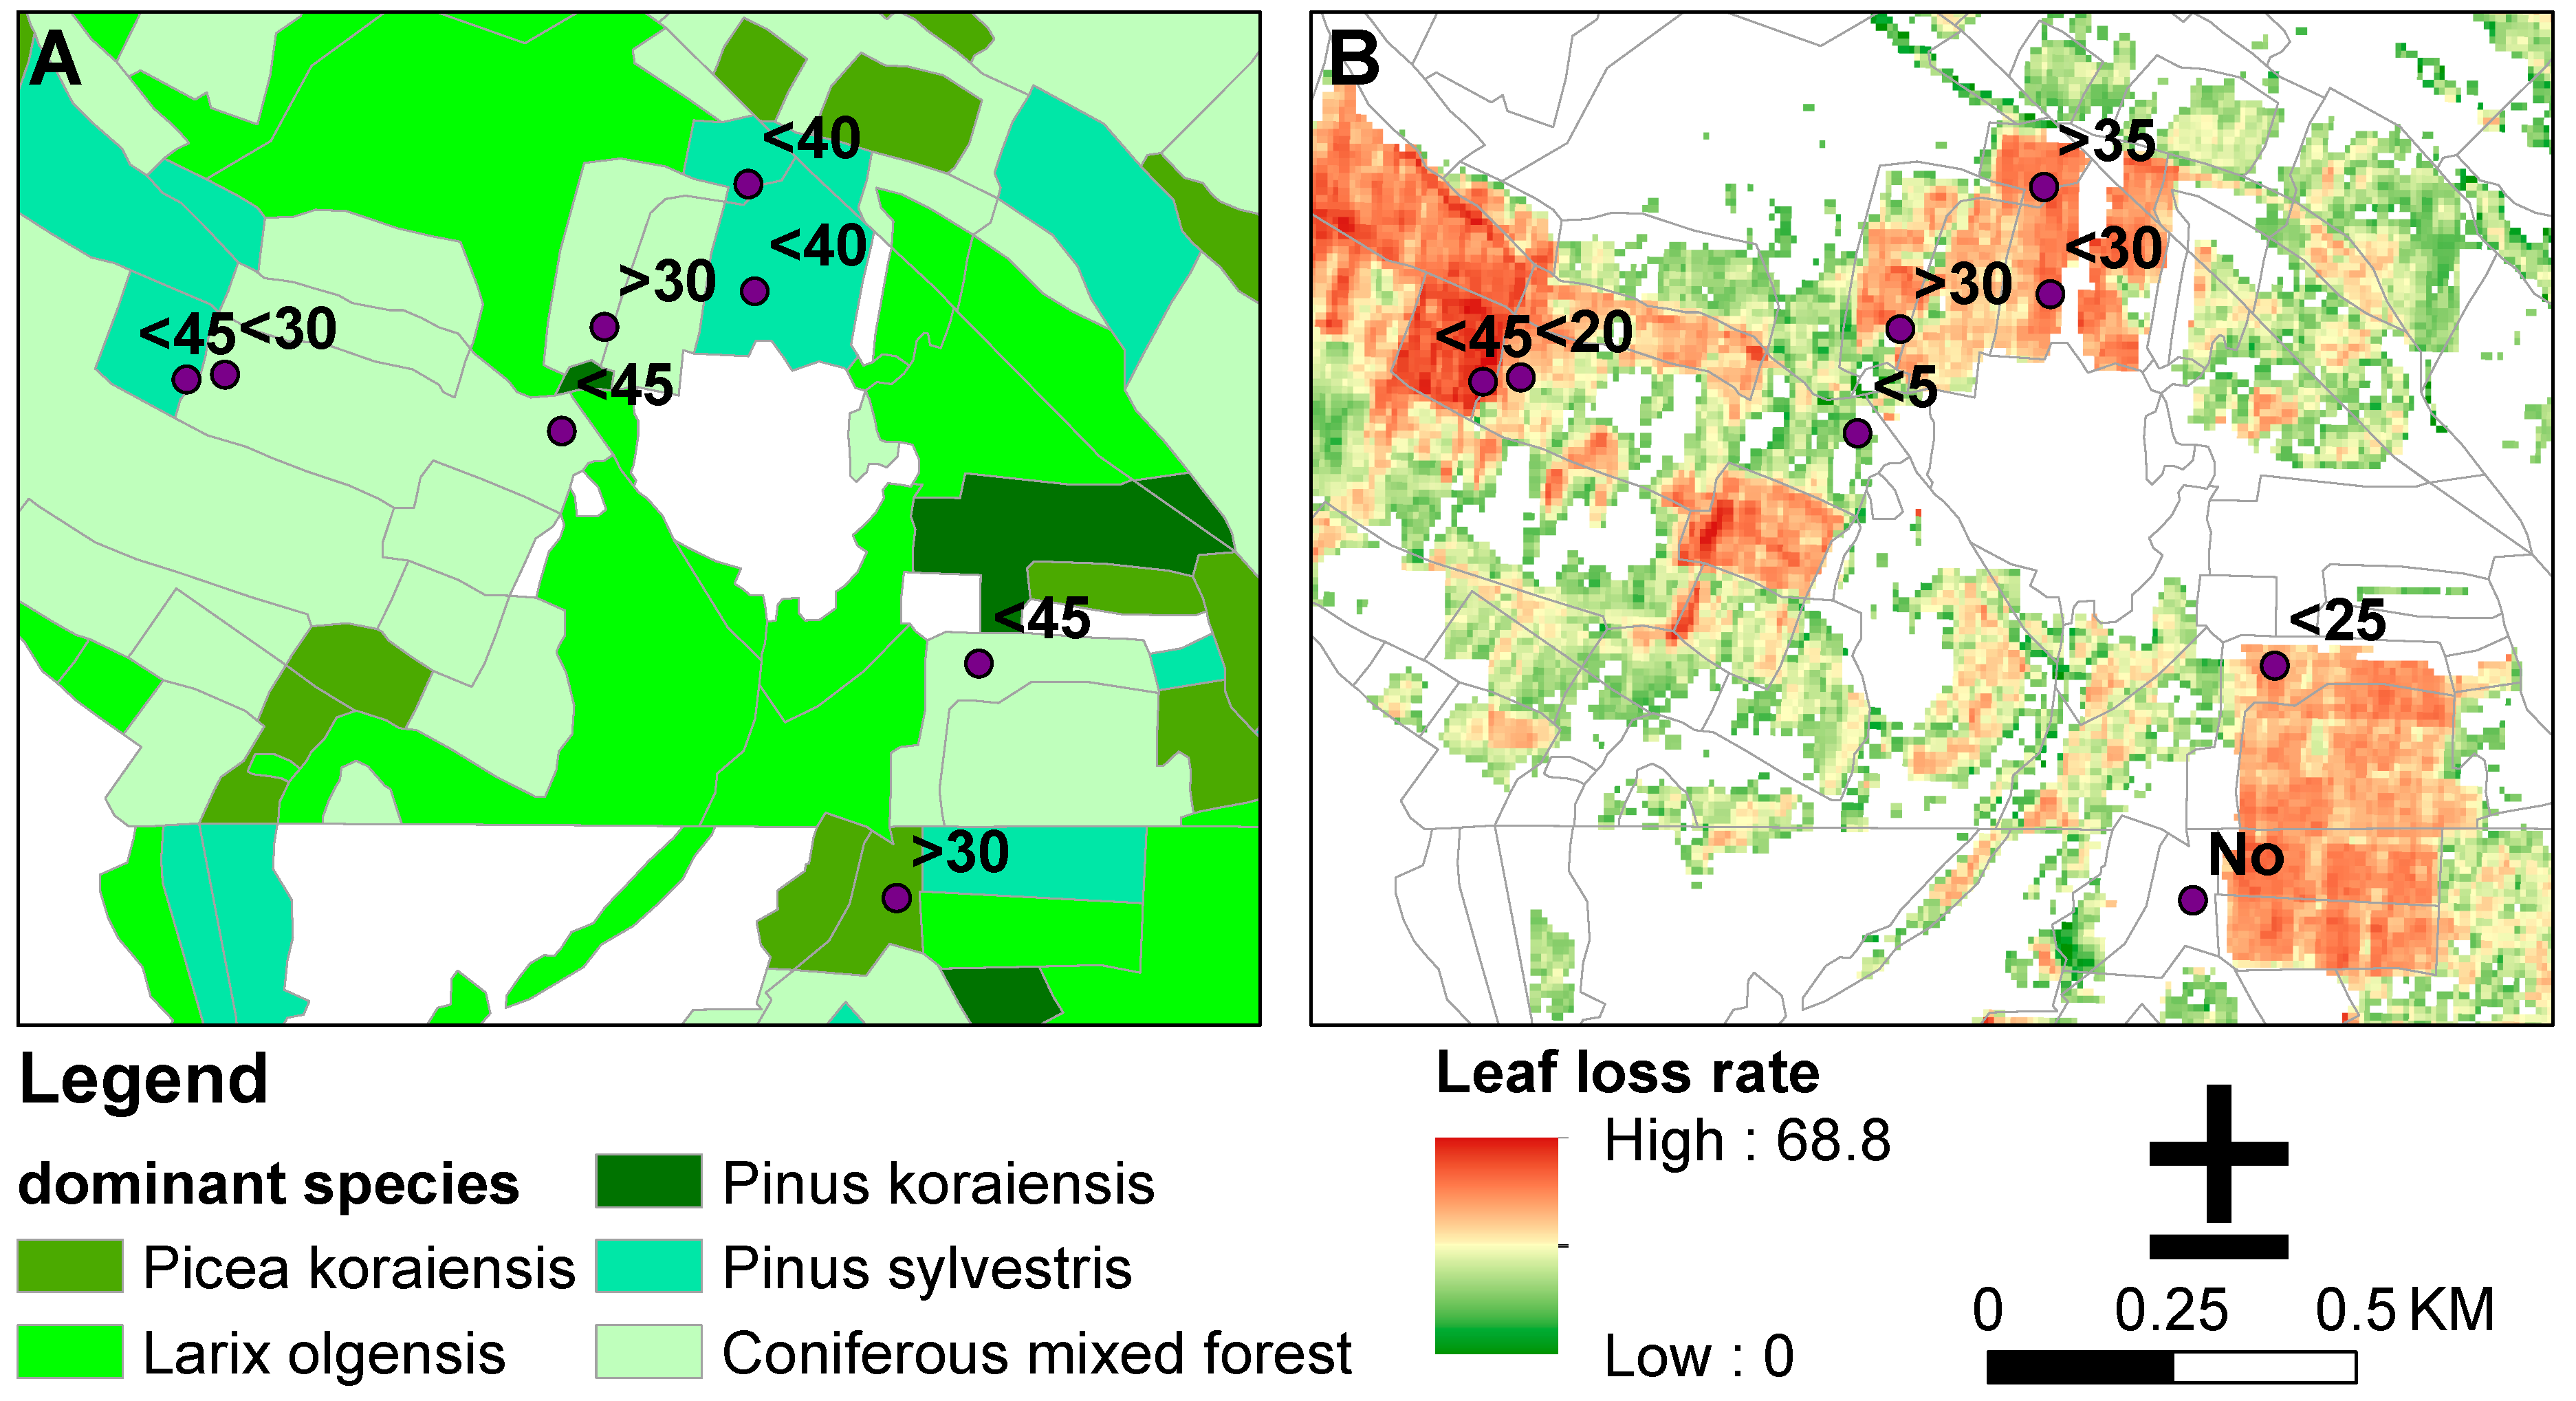
Traditional disaster statistics primarily rely on ground surveys based on plot statistics [18], assessing the average pest density or average defoliation rate across all trees in a plot, treating the entire plot as a uniform level. This leads to generalization and information loss when dealing with large areas, similar to the U.S. aerial sketch mapping method [12], which both overestimates and underestimates defoliated areas. Comparing forest resource survey data (Figure 10A) and this study’s remote sensing inversion of defoliation rates (Figure 10B), the field survey in the southeast shows a defoliation rate of 45%, while the remotely sensed grid area only reaches 25%. This method helps accurately identify small areas of mild disaster and aids in correctly identifying plots mistakenly marked as affected, offering a more intuitive representation of heterogeneity within plots. This paper utilizes remote sensing technology to enhance spatial and temporal precision, accurately quantifying the degree and specific locations of disasters [51]. It deepens the understanding of the relationship between the leaf area index and the spatiotemporal evolution of disasters, revealing the dynamics of disasters and key influencing factors, providing a scientific basis and specific strategies for forest pest management, and showcasing superior technical advantages.
Although remote sensing technology provides a powerful tool for monitoring forest pest disasters, the resolution of the remote sensing data currently used is relatively low, which may limit the identification and precise assessment of very small areas or early-stage pest disasters [28]. Furthermore, the dependency on spectral data is susceptible to cloud cover, which can obscure important observations. Additionally, the meteorological data used in this study are limited, considering only factors frequently mentioned in past research, thus limiting the expansion of the time phase. Additionally, the coverage of factors may not be comprehensive enough [7,54], which could affect the comprehensiveness and accuracy of the dynamic disaster analysis.
Future studies need to combine higher-resolution radar data such as Sentinel-1C SAR, which can penetrate dense cloud cover and detect subtle changes in canopy structure, and a broader range of meteorological factors, including real-time data as well as microclimate variations, to further enhance the accuracy and timeliness of forest pest disaster monitoring. This radar technology will enable more precise observation of structural changes in the canopy, such as variations in canopy volume due to foliage loss caused by defoliating pest outbreaks. In the analysis of driving factors, we plan to utilize a more comprehensive set of data and conduct an in-depth exploration of microtopography. Additionally, we will continue to investigate the phenomenon of forest growth delays associated with pine caterpillar outbreaks, using a time-series analysis of above-ground biomass (AGB) changes to estimate the impact of these disturbances on tree growth. These advancements will contribute to a more nuanced understanding of the factors driving pest outbreaks, thereby advancing the field and leading to more precise and effective forest pest management strategies.

5. Research Conclusions

This study conducted an in-depth analysis of Dendrolimus superans disasters in the Changbai Mountains area, utilizing high-precision remote sensing data to accurately monitor and assess the spatiotemporal changes of the disaster. Through systematic data analysis and model validation, this research offers critical insights into the mechanisms driving pest outbreaks, significantly advancing our understanding of forest pest dynamics. Moreover, the findings provide essential guidance for shaping future research directions in the monitoring and management of forest pest disasters. The following key conclusions were drawn:
This study successfully delineated the spatial distribution and temporal evolution of forest defoliation caused by forest defoliating pests, aligning pest lifecycle stages with defoliation patterns. The trends in leaf area changes caused by these pests are consistent with the spatiotemporal characteristics of disasters observed in field studies. The pattern is characterized by an initial rapid outbreak followed by a gradual reduction, with a peak cumulative area of 8213 ha observed in September 2019. During the pre-maturity phase, the affected area was large, but the severity was moderate. In contrast, during the pre-overwintering phase, although the affected area decreased, the severity of the damage increased. The order of priority for the affected forest types was Larix olgensis, Pinus sylvestris var. mongolica, Picea koraiensis, then Pinus koraiensis.
Utilizing geographical detectors, this study quantified the main factors and their coupling effects on the disaster. The humidity of the preceding year played a decisive role during the disaster development phase, while summer rainfall (M8) had the greatest impact during the disaster mitigation phase. The importance of environmental moisture content for determining the population size during the post-overwintering feeding phase was emphasized. The coupling of humidity and low temperatures in 2020 significantly influenced both the development and mitigation phases of the disaster. Different forest types exhibited nonlinear enhancement responses to these environmental drivers, demonstrating varying vulnerabilities to forest defoliating pest disasters based on their unique growth traits and specific ecological needs.
This study presented a high-precision, long time-series inversion of the spatial characteristics of disasters using LAI to quantitatively describe them. This approach not only carries strong physical significance but also offers clear advantages in spatial granularity. It provides an effective tool for assessing and responding to forest pest disasters. This method represents an improvement over traditional techniques that heavily depend on manual data collection and optical remote sensing vegetation indices, which often lack the same level of precision and applicability.

Author Contributions

Conceptualization, X.J., G.B., Z.R. and T.L.; methodology, X.J., G.B., Z.R. and T.L.; software, X.J. and J.L.; validation, H.H. and Y.L.; formal analysis, X.J., T.L., M.D. and C.Z.; investigation, X.J., T.L., M.D. and W.Z.; resources, W.Z. and J.L.; data curation, H.H. and Y.L.; writing—original draft preparation, X.J. and M.D.; writing—review and editing, X.J., G.B., Z.R. and T.L.; visualization, X.J., M.D. and T.L.; supervision, G.B. and T.L.; project administration, G.B.; funding acquisition, G.B. All authors have read and agreed to the published version of the manuscript.

Funding

This research was funded by [Research and Development Project of Jilin Province] grant number [20230202098NC], [International Cooperation Project of Jilin Province] grant number [20240402030GH], [Natural Science Foundation of Jilin Province] grant number [YDZJ202201ZYTS446], [Major Special Project of Science and Technology Department of Jilin Province] grant number [20230303006SF], and the [Youth Innovation Promotion Association of Chinese Academy of Sciences] grant number [2020237].

Data Availability Statement

The original contributions presented in the study are included in the article, further inquiries can be directed to the corresponding author.

Conflicts of Interest

The authors declare that they have no known competing financial interests or personal relationships.

Appendix A

Figure A1. Forest-type classification results.
Forests 15 01650 g0a1
Figure A2 presents the accuracy validation results for a single period of LAI. By comparing the field-measured LAI results from June 2020 with the corresponding remote sensing inversion results, the study confirmed that the model accuracy meets the experimental requirements. Consequently, this method was used to invert the LAI results for all ten images, as illustrated in Figure A3.
Figure A2. LAI linear regression results. Scatter plot showing the linear regression (black line) between predicted and measured values, with a 1:1 line (red) for reference. The gray shaded area indicates the confidence interval.
Forests 15 01650 g0a2
Figure A3. PROSAIL model LAI inversion results. Note: Subfigures (AJ) cover the entire observation period from 2017 to 2021, encompassing 10 disaster phases and including all observation points within the study period. For a detailed list of time phases, please see the descriptions provided in the following paragraphs.
Forests 15 01650 g0a3
Based on the LAI inversion results shown in Figure A3, it is evident that the LAI changes in the study area exhibit significant spatiotemporal patterns. The subfigures A–J in Figure A3 correspond sequentially to the temporal phases of June and September 2017, June and September 2018, June and September 2019, June and September 2020, and June and September 2021. From the low values in the LAI inversion results, preliminary insights into the trend of disaster development can be obtained. Consequently, to further quantify this, the defoliation rate was calculated by comparing the differences between the two periods in 2017 shown in Figure A3A,B.
The spatiotemporal validation of LAI inversion is presented in Appendix A Figure A4. The subfigures Aa–Hh in Figure A4 correspond sequentially to the temporal phases of June and September 2018, June and September 2019, June and September 2020, and June and September 2021. The RGB image utilizes the Sentinel-2 satellite’s bands 4, 3, and 2 for true-color representation, where band 4 corresponds to red, band 3 to green, and band 2 to blue. The image stretching was executed using the percentile clipping method, with the highest value set to 3.5 and the lowest to 0.5, along with gamma correction. This processing approach vividly demonstrates the trends in LAI changes as captured by remote sensing, effectively highlighting the disaster-affected regions and the degree of their changes.
Figure A4. LAI spatiotemporal validation. Note: Subfigures (AaHh) cover the entire observation period from 2018 to 2021, encompassing eight disaster phases, for a detailed list of time phases, refer to the descriptions in the paragraphs below. In this arrangement, Subfigure (AH) illustrates the actual changes in remote sensing imagery within a rectangular area near the selected plot, whereas Subfigure (ah) depicts the inversion results for LAI variations.
Forests 15 01650 g0a4
Figure A5. LAI trend analysis results. Note: Panels (AC) correspond to the developing phase, stationary phase, and full phase, respectively.
Forests 15 01650 g0a5
Trend analysis methods are employed to quantitatively investigate the spatiotemporal evolution of LAI, incorporating the defoliation area induced by leaf-eating pest activity to initially delineate the research phases. Within the same growing season across various disaster years, further analysis examines the LAI change trends during the early stages of disaster development and the phases of disaster mitigation and recovery, focusing on both the extent and region affected. By assessing the overall temporal changes in LAI, the study determines the comprehensive impact of the disaster and the forest loss caused by larch casebearer infestations.
To more effectively illustrate the distribution and extent of disaster severity across different periods, we categorized the defoliation rates as follows: 0%–30% for mild damage, 30%–60% for moderate damage, and over 60% for severe damage. The results are shown in Figure A6.
Figure A6. Disaster severity distribution. Note: panels (AI) correspond sequentially to the temporal phases of September 2017, June and September 2018, June and September 2019, June and September 2020, and June and September 2021.
Forests 15 01650 g0a6
Table A1. Exponential regression parameters by forest type.
TypeArea (ha)Patches NumberAverage Area of Patches (ha)Proportion (%)Mapping Accuracy (%)User Accuracy (%)
Larix olgensis35,987.90135626.5431.8191.1395.44
Picea koraiensis10,901.3719105.719.6489.2693.46
Pinus sylvestris var. mongolica1320.225222.531.1788.7789.91
Pinus koraiensis829.152483.340.7394.2997.67
This study evaluated the classification accuracy using a confusion matrix to thoroughly assess the performance of the sample classification. The overall classification accuracy was 89.48%, with the model achieving a kappa coefficient of 0.88, indicating a high level of agreement between the predicted and actual classifications. This robust accuracy provides a reliable basis for subsequent analyses of tree species distribution. By combining forest land distribution with individual tree species characteristics, the accuracy of the four forest-type classification models was significantly enhanced. The highest user accuracy was 97.67%, and the highest mapping accuracy was 94.29%, thus improving monitoring precision and fulfilling the study’s requirements for conifer species classification.
Table A2. Slope statistical results by forest type.
MinimumMaximumAverageStandard Deviation<0>0
Full PhaseLarix olgensis−0.11 0.39 0.10 0.03 204.26 35,783.64
Picea koraiensis−0.05 0.41 0.14 0.05 11.22 10,890.15
Pinus sylvestris−0.11 0.36 0.06 0.04 92.04 1228.18
Pinus koraiensis−0.05 0.39 0.10 0.07 7.39 821.76
Developing PhaseLarix olgensis−0.97 1.21 0.10 0.24 13,835.35 22,152.55
Picea koraiensis−0.90 1.22 0.21 0.17 974.53 9926.84
Pinus sylvestris−0.56 0.83 0.14 0.14 155.43 1164.79
Pinus koraiensis−1.00 1.05 0.18 0.15 61.25 767.90
Stationary PhaseLarix olgensis−0.40 1.49 0.15 0.18 6285.40 29,702.50
Picea koraiensis−0.40 1.42 0.12 0.19 2678.28 8223.09
Pinus sylvestris−0.40 0.94 −0.06 0.16 857.30 462.92
Pinus koraiensis−0.40 1.11 0.04 0.20 369.71 459.44
Table A2 is constructed from the statistical analysis of LAI slope values for each period depicted in Figure A5. By integrating LAI trend data with imagery, this table offers a sophisticated method for assessing the extent of forest damage caused by defoliating pests. The analysis of LAI trends elucidates the temporal variations of LAI in affected regions, providing a quantitative foundation for evaluating forest health dynamics.
Table A3 illustrates the impact of various environmental factors on the development and mitigation phases of forest pest disasters across four forest types, encompassing q-values derived from the geographical detector, the direction of correlation, and significance levels. Significance levels are denoted by “*”, “**”, and “***”, corresponding to p-values of 0.05, 0.01, and 0.001, respectively, indicating confidence levels of 95%, 99%, and 99.9%, thus reflecting statistical reliability. Using Spearman correlation analysis, yellow shading signifies positive correlations, while blue shading indicates negative correlations, visually delineating the relationships between environmental factors and the progression of forest pest disasters.
Table A3. q-values and significance by forest type.
S1S2S3S4S5G1G2G3G4M1M2M3M4M5M6M7M8M9M10M11
Pinus sylvestrisA0.09820.07350.05850.01570.07620.21960.02550.02450.020.06450.03420.03570.10440.11310.11780.06940.19950.04740.10420.1068
****** ******************* ************************
B0.00060.00830.00640.00130.00260.00080.00050.00310.00070.00150.00190.00130.00420.00180.00470.00050.00120.00110.00160.0063
*** ********** ***************** ******
Picea koraiensisA0.00090.04830.02370.03050.03390.0190.04230.00750.04040.02540.0230.03260.00370.01250.00450.00880.0260.10210.05690.0682
************************************** ***************
B0.00030.00030.0150.00050.014800.00390.00180.0010.00120.00080.000800.000200.00550.00030.00260.00010.0009
****** *** ************* *** ******
Larix olgensisA0.00130.02220.03750.01210.06190.05580.12210.02810.01820.00990.01360.00720.02010.00940.02860.01210.06980.32070.09180.1754
B00.00020.00040.00010.000500.00050.000100.00020.00080.00050.00020.00020.00060.000500.00030.00010.0003
*********** ********* *
Pinus koraiensisA0.0970.0980.02930.03950.10020.10210.16460.01510.00030.11990.12440.12440.03910.02540.05560.04820.040.05010.01430.0443
****************** ******************* *
B0.00010.00670.01070.00140.01710.00660.00410.0060.0020.01060.00940.00940.00320.00330.00380.00320.00270.00060.00060.0051
******* *

References

  1. Kautz, M.; Meddens, A.J.H.; Hall, R.J.; Arneth, A. Biotic disturbances in Northern Hemisphere forests—A synthesis of recent data, uncertainties and implications for forest monitoring and modelling. Glob. Ecol. Biogeogr. 2017, 26, 533–552. [Google Scholar] [CrossRef]
  2. Stewart, D.; Djoumad, A.; Holden, D.; Kimoto, T.; Capron, A.; Dubatolov, V.V.; Akhanaev, Y.B.; Yakimova, M.E.; Martemyanov, V.V.; Cusson, M. A TaqMan Assay for the Detection and Monitoring of Potentially Invasive Lasiocampids, with Particular Attention to the Siberian Silk Moth, Dendrolimus sibiricus (Lepidoptera: Lasiocampidae). J. Insect Sci. (Online) 2023, 23, 5. [Google Scholar] [CrossRef] [PubMed]
  3. Metsaranta, J.; Shaw, C.; Kurz, W.; Boisvenue, C.; Morken, S. Uncertainty of inventory-based estimates of the carbon dynamics of Canada’s managed forest (1990–2014). Can. J. For. Res. 2017, 47, 1082–1094. [Google Scholar] [CrossRef]
  4. Medvigy, D.; Clark, K.L.; Skowronski, N.S.; Schäfer, K.V.R. Simulated impacts of insect defoliation on forest carbon dynamics. Environ. Res. Lett. 2012, 7, 045703. [Google Scholar] [CrossRef]
  5. Pasqualotto, N.; D’Urso, G.; Bolognesi, S.F.; Belfiore, O.R.; Wittenberghe, S.V.; Delegido, J.; Pezzola, A.; Winschel, C.; Moreno, J. Retrieval of Evapotranspiration from Sentinel-2: Comparison of Vegetation Indices, Semi-Empirical Models and SNAP Biophysical Processor Approach. Agronomy 2019, 9, 663. [Google Scholar] [CrossRef]
  6. Soukhovolsky, V.; Krasnoperova, P.; Kovalev, A.; Sviderskaya, I.; Tarasova, O.; Ivanova, Y.; Akhanaev, Y.; Martemyanov, V. Differentiation of Forest Stands by Susceptibility to Folivores: A Retrospective Analysis of Time Series of Annual Tree Rings with Application of the Fluctuation-Dissipation Theorem. Forests 2023, 14, 1385. [Google Scholar] [CrossRef]
  7. Campbell, M.J.; Williams, J.P.; Berryman, E.M. Using Remote Sensing and Climate Data to Map the Extent and Severity of Balsam Woolly Adelgid Infestation in Northern Utah, USA. Forests 2023, 14, 1357. [Google Scholar] [CrossRef]
  8. Liu, Y.; Zhan, Z.; Ren, L.; Ze, S.; Yu, L.; Jiang, Q.; Luo, Y. Hyperspectral evidence of early-stage pine shoot beetle attack in Yunnan pine. For. Ecol. Manag. 2021, 497, 119505. [Google Scholar] [CrossRef]
  9. Huang, Z.; Zhang, Y. Remote sensing of spruce budworm defoliation using EO-1 Hyperion hyperspectral data: An example in Quebec, Canada. IOP Conf. Ser. Earth Environ. Sci. 2016, 34, 012017. [Google Scholar] [CrossRef]
  10. Jha, P.K.; Zhang, N.; Rijal, J.P.; Parker, L.E.; Ostoja, S.; Pathak, T.B. Climate change impacts on insect pests for high value specialty crops in California. Sci. Total Environ. 2023, 906, 167605. [Google Scholar] [CrossRef]
  11. Pasquarella, V.J.; Bradley, B.A.; Woodcock, C.E. Near-Real-Time Monitoring of Insect Defoliation Using Landsat Time Series. Forests 2017, 8, 275. [Google Scholar] [CrossRef]
  12. Hall, R.J.; Castilla, G.; White, J.C.; Cooke, B.J.; Skakun, R.S. Remote sensing of forest pest damage: A review and lessons learned from a Canadian perspective. Can. Entomol. 2016, 148, S296–S356. [Google Scholar] [CrossRef]
  13. Zhu, Z.; Woodcock, C.E.; Olofsson, P. Continuous monitoring of forest disturbance using all available Landsat imagery. Remote Sens. Environ. 2012, 122, 75–91. [Google Scholar] [CrossRef]
  14. Pastick, N.J.; Jorgenson, M.T.; Goetz, S.J.; Jones, B.M.; Wylie, B.K.; Minsley, B.J.; Genet, H.; Knight, J.F.; Swanson, D.K.; Jorgenson, J.C. Spatiotemporal remote sensing of ecosystem change and causation across Alaska. Glob. Change Biol. 2018, 25, 1171–1189. [Google Scholar] [CrossRef] [PubMed]
  15. Yu, L.; Zhan, Z.; Ren, L.; Zong, S.; Luo, Y.; Huang, H. Evaluating the Potential of WorldView-3 Data to Classify Different Shoot Damage Ratios of Pinus yunnanensis. Forests 2020, 11, 417. [Google Scholar] [CrossRef]
  16. Abolfazl, J.; Mahdi, P.; Davood, M.-G.; Omid, R.; Himan, S.; Ataollah, S.; Saro, L.; Tien, B.D.; Biswajeet, P. Swarm intelligence optimization of the group method of data handling using the cuckoo search and whale optimization algorithms to model and predict landslides. Appl. Soft Comput. J. 2022, 116, 108254. [Google Scholar]
  17. Sathish, C.; Nakhawa, A.D.; Bharti, V.S.; Jaiswar, A.K.; Deshmukhe, G. Estimation of extent of the mangrove defoliation caused by insect Hyblaea puera (Cramer, 1777) around Dharamtar creek, India using Sentinel 2 images. Reg. Stud. Mar. Sci. 2021, 48, 102054. [Google Scholar] [CrossRef]
  18. Fang, L.; Yu, Y.; Fang, G.; Zhang, X.; Yu, Z.; Zhang, X.; Crocker, E.; Yang, J. Effects of meteorological factors on the defoliation dynamics of the larch caterpillar (Dendrolimus superans Butler) in the Great Xing’an boreal forests. J. For. Res. 2021, 32, 2683–2697. [Google Scholar] [CrossRef]
  19. Damestoy, T.; Jactel, H.; Belouard, T.; Schmuck, H.; Plomion, C.; Castagneyrol, B. Tree species identity and forest composition affect the number of oak processionary moth captured in pheromone traps and the intensity of larval defoliation. Agric. For. Entomol. 2020, 22, 169–177. [Google Scholar] [CrossRef]
  20. Lombardero, M.J.; Ayres, M.P.; Bonello, P.; Cipollini, D.; Herms, D.A. Effects of defoliation and site quality on growth and defenses of Pinus pinaster and P. radiata. For. Ecol. Manag. 2016, 382, 39–50. [Google Scholar] [CrossRef]
  21. Ali, A.M.; Abdullah, H.; Darvishzadeh, R.; Skidmore, A.K.; Heurich, M.; Roeoesli, C.; Paganini, M.; Heiden, U.; Marshall, D. Canopy Chlorophyll Content Retrieved from Time Series Remote Sensing Data as a Proxy for Detecting Bark Beetle Infestation. Remote Sens. Appl. Soc. Environ. 2021, 22, 100524. [Google Scholar] [CrossRef]
  22. Sánchez-Cuesta, R.; Ruiz-Gómez, F.J.; Duque-Lazo, J.; González-Moreno, P.; Navarro-Cerrillo, R.M. The environmental drivers influencing spatio-temporal dynamics of oak defoliation and mortality in dehesas of Southern Spain. For. Ecol. Manag. 2021, 485, 118946. [Google Scholar] [CrossRef]
  23. Bao, Y.; Na, L.; Han, A.; Guna, A.; Wang, F.; Liu, X.; Zhang, J.; Wang, C.; Tong, S.; Bao, Y. Drought drives the pine caterpillars (Dendrolimus spp.) outbreaks and their prediction under different RCPs scenarios: A case study of Shandong Province, China. For. Ecol. Manag. 2020, 475, 118446. [Google Scholar] [CrossRef]
  24. Zhang, B.; Leroux, S.J.; Bowden, J.J.; Hargan, K.E.; Hurford, A.; Moise, E.R. Species distribution model identifies influence of climatic constraints on severe defoliation at the leading edge of a native insect outbreak. For. Ecol. Manag. 2023, 544, 121166. [Google Scholar] [CrossRef]
  25. Charbonneau, D.; Lorenzetti, F.; Doyon, F.; Mauffette, Y. The influence of stand and landscape characteristics on forest tent caterpillar (Malacosoma disstria) defoliation dynamics: The case of the 1999–2002 outbreak in northwestern Quebec. Can. J. For. Res. 2012, 42, 1827–1836. [Google Scholar] [CrossRef]
  26. Liu, Y.; Huang, J.; Fang, G.; Sun, H.; Yin, Y.; Zhang, X. Fine-scale forest biological hazard in China show significant spatial and temporal heterogeneity. Ecol. Indic. 2022, 145, 109676. [Google Scholar] [CrossRef]
  27. Li, M.; MacLean, D.; Hennigar, C.; Ogilvie, J. Spatial-Temporal Patterns of Spruce Budworm Defoliation within Plots in Québec. Forests 2019, 10, 232. [Google Scholar] [CrossRef]
  28. Bae, S.; Müller, J.; Förster, B.; Hilmers, T.; Hochrein, S.; Jacobs, M.; Leroy, B.M.L.; Pretzsch, H.; Weisser, W.W.; Mitesser, O. Tracking the temporal dynamics of insect defoliation by high-resolution radar satellite data. Methods Ecol. Evol. 2021, 13, 121–132. [Google Scholar] [CrossRef]
  29. Hu, J. The Occurrence Characteristics and Control Strategies of Intermediate Pests. Int. J. Ecol. 2014, 3, 43–46. [Google Scholar] [CrossRef]
  30. Wood, B.J. Pest control in Malaysia’s perennial crops: A half century perspective tracking the pathway to integrated pest management. Integr. Pest Manag. Rev. 2002, 7, 173–190. [Google Scholar] [CrossRef]
  31. Fatemeh, T.; Giorgio, F.; Parviz, S.; Ebrahim, E.; Massimo, G.; Givskov, S.J. Variation among populations of Trichogramma euproctidis (Hymenoptera: Trichogrammatidae) revealed by life table parameters: Perspectives for biological control. J. Econ. Entomol. 2023, 116, 1119–1127. [Google Scholar]
  32. Boersma, N.; Boardman, L.; Gilbert, M.; Terblanche, J.S. Cold Treatment Enhances Low-temperature Flight Performance in False Codling Moth, Thaumatotibia leucotreta (Lepidoptera: Tortricidae)]. Agric. For. Entomol. 2019, 21, 243–251. [Google Scholar]
  33. Foga, S.; Scaramuzza, P.L.; Guo, S.; Zhu, Z.; Dilley, R.D.; Beckmann, T.; Schmidt, G.L.; Dwyer, J.L.; Hughes, M.J.; Laue, B. Cloud detection algorithm comparison and validation for operational Landsat data products. Remote Sens. Environ. 2017, 194, 379–390. [Google Scholar] [CrossRef]
  34. Zhao, H.; Zhang, H.X.; Cao, Q.J.; Sun, S.J.; Han, X.; Palaoag, T.D. Design and Development of Image Recognition Toolkit Based on Deep Learning. Int. J. Pattern Recognit. Artif. Intell. 2020, 35, 2159002. [Google Scholar] [CrossRef]
  35. Liu, T.; Bao, G.; Li, Z.; Zhu, R.; Bao, Y.; Zhang, Z. Forset Type Classification with Jilin-1GP Spectral Satellite Image Based on Three-dimension Convolution Neural Network. J. Anhui Agric. Sci. 2023, 51, 96–101+108. [Google Scholar]
  36. Kuusk, A.; Pisek, J.; Lang, M.; Märdla, S. Estimation of Gap Fraction and Foliage Clumping in Forest Canopies. Remote Sens. 2018, 10, 1153. [Google Scholar] [CrossRef]
  37. Cohrs, C.W.; Cook, R.L.; Gray, J.M.; Albaugh, T.J. Sentinel-2 Leaf Area Index Estimation for Pine Plantations in the Southeastern United States. Remote Sens. 2020, 12, 1406. [Google Scholar] [CrossRef]
  38. Kalamandeen, M.; Gulamhussein, I.; Castro, J.B.; Sothe, C.; Rogers, C.A.; Snider, J.; Gonsamo, A. Climate change and human footprint increase insect defoliation across central boreal forests of Canada. Front. Ecol. Evol. 2023, 11, 1293311. [Google Scholar] [CrossRef]
  39. Bao, G.; Liu, T.; Zhang, Z.; Ren, Z.; Zhai, C.; Ding, M.; Jiang, X. Remote Sensing Inversion of Effective Leaf Area Index of Four Coniferous Forest Types and Their Spatial Distribution Rule in Changbai Mountain. Sci. Silvae Sin. 2024, 60, 127–138. [Google Scholar]
  40. Hejný, I.; Wallin, J.; Bogdan, M. Weak pattern recovery for SLOPE and its robust versions. arXiv 2023, arXiv:2303.10970. [Google Scholar]
  41. Jiang, X.; Bao, G.; Zhai, C.; Liu, T.; Ren, Z.; Ding, M.; Zhang, W.; Du, Y. Study on Quantitative Inversion of Spatial Pattern of Forest Leaf Eating Pest Disaster. J. Southwest For. Univ. (Nat.) 2024, 44, 125–134. [Google Scholar]
  42. Wang, J.; Xu, C. Geographic detector: Principle and outlook. Acta Geogr. Sin. 2017, 72, 116–134. [Google Scholar]
  43. Liu, C.; Li, W.; Wang, W.; Zhou, H.; Liang, T.; Hou, F.; Xu, J.; Xue, P. Quantitative spatial analysis of vegetation dynamics and potential driving factors in a typical alpine region on the northeastern Tibetan Plateau using the Google Earth Engine. Catena 2021, 206, 105500. [Google Scholar] [CrossRef]
  44. Zhou, Q.; Zhang, X.; Yu, L.; Ren, L.; Luo, Y. Combining WV-2 images and tree physiological factors to detect damage stages of Populus gansuensis by Asian longhorned beetle (Anoplophora glabripennis) at the tree level. For. Ecosyst. 2021, 8, 479–490. [Google Scholar] [CrossRef]
  45. Bao, Y.; Han, A.; Zhang, J.; Liu, X.; Tong, Z.; Bao, Y. Contribution of the synergistic interaction between topography and climate variables to pine caterpillar (Dendrolimus spp.) outbreaks in Shandong Province, China. Agric. For. Meteorol. 2022, 322, 109023. [Google Scholar] [CrossRef]
  46. Zhang, N.; Wang, Y.; Zhang, X. Extraction of tree crowns damaged by Dendrolimus tabulaeformis Tsai et Liu via spectral-spatial classification using UAV-based hyperspectral images. Plant Methods 2020, 16, 135. [Google Scholar] [CrossRef]
  47. Nanninga, C.; Ward, S.F.; Aukema, B.H.; Montgomery, R.A. The effects of chilling and forcing temperatures on spring synchrony between larch casebearer and tamarack. Agric. For. Entomol. 2023, 25, 658–668. [Google Scholar] [CrossRef]
  48. Bai, Y.; Wong, C.P.; Jiang, B.; Hughes, A.C.; Wang, M.; Wang, Q. Developing China’s Ecological Redline Policy using ecosystem services assessments for land use planning. Nat. Commun. 2018, 9, 3034. [Google Scholar] [CrossRef]
  49. Michael, J.; Claude, B.; David, C.; Thierry, C.; Elisavet, C.; Katharina, D.-S.; Gianni, G.; Anton, J.M.J.; Alan, M.; Maria, N.N.; et al. Pest categorisation of Dendrolimus sibiricus. EFSA J. Eur. Food Saf. Auth. 2018, 16, e05301. [Google Scholar]
  50. Fatih, S.; Ece, Ö.G.; Korhan, E.; Emre, S.O. Comparative study of the analytical hierarchy process, frequency ratio, and logistic regression models for predicting the susceptibility to Ips sexdentatus in Crimean pine forests. Ecol. Inform. 2022, 71, 101811. [Google Scholar]
  51. Zhu, C.; Zhang, X.; Zhang, N.; Hassan, M.A.; Zhao, L. Assessing the Defoliation of Pine Forests in a Long Time-Series and Spatiotemporal Prediction of the Defoliation Using Landsat Data. Remote Sens. 2018, 10, 360. [Google Scholar] [CrossRef]
  52. Choi, W.I.; Nam, Y.; Lee, C.Y.; Choi, B.K.; Shin, Y.J.; Lim, J.-H.; Koh, S.-H.; Park, Y.-S. Changes in Major Insect Pests of Pine Forests in Korea Over the Last 50 Years. Forests 2019, 10, 692. [Google Scholar] [CrossRef]
  53. Ulf, B.; David, F.; Andrew, L.; Derek, J.; Marco, C.; Carlo, U.; Michael, G.; Kurt, N.; Tom, L.; Jan, E. Three centuries of insect outbreaks across the European Alps. New Phytol. 2009, 182, 929–941. [Google Scholar]
  54. Cen, C.; Parinaz, R.B.; Aaron, W. Assessing spatial and temporal dynamics of a spruce budworm outbreak across the complex forested landscape of Maine, USA. Ann. For. Sci. 2021, 78, 33. [Google Scholar]
  55. Toïgo, M.; Nicolas, M.; Jonard, M.; Croisé, L.; Nageleisen, L.-M.; Jactel, H. Temporal trends in tree defoliation and response to multiple biotic and abiotic stresses. For. Ecol. Manag. 2020, 477, 118476. [Google Scholar] [CrossRef]
  56. Anton, K.; Vladislav, S. Analysis of Forest Stand Resistance to Insect Attack According to Remote Sensing Data. Forests 2021, 12, 1188. [Google Scholar] [CrossRef]
  57. Zhang, N.; Zhang, X.; Yang, G.; Zhu, C.; Huo, L.; Feng, H. Assessment of defoliation during the D e ndrolimus tabulaeformis Tsai et Liu disaster outbreak using UAV-based hyperspectral images. Remote Sens. Environ. 2018, 217, 323–339. [Google Scholar] [CrossRef]
  58. Hua, H.; Wu, C.; Jassal, R.S.; Huang, J.; Liu, R.; Wang, Y. Pine caterpillar occurrence modeling using satellite spring phenology and meteorological variables. Environ. Res. Lett. 2022, 17, 104046. [Google Scholar] [CrossRef]
  59. Zhang, B.; MacLean, D.A.; Johns, R.C.; Eveleigh, E.S.; Edwards, S. Hardwood-softwood composition influences early-instar larval dispersal mortality during a spruce budworm outbreak. For. Ecol. Manag. 2020, 463, 118035. [Google Scholar] [CrossRef]
  60. Rouault, G.; Candau, J.-N.; Lieutier, F.; Nageleisen, L.-M.; Martin, J.-C.; Warzée, N. Effects of drought and heat on forest insect populations in relation to the 2003 drought in Western Europe. Ann. For. Sci. 2006, 63, 613–624. [Google Scholar] [CrossRef]
  61. Ece, Ö.G.; Fatih, S.; Emre, S.O.; Korhan, E. Determination of some factors leading to the infestation of Ips sexdentatus in crimean pine stands. For. Ecol. Manag. 2022, 519, 120316. [Google Scholar]
  62. Yu, X.; Zhou, H.; Luo, T. Spatial and temporal variations in insect-infested acorn fall in a Quercus liaotungensis forest in North China. Ecol. Res. 2003, 18, 155–164. [Google Scholar] [CrossRef]
Figure 1. Location and sample plots of the study area.
Forests 15 01650 g001
Figure 2. Methodological framework.
Forests 15 01650 g002
Figure 3. Spatiotemporal variation in disaster distribution. (AH) Correspond sequentially to the disaster distribution at each time phase. Specifically: (A) June 2018, (B) September 2018, (C) June 2019, (D) September 2019, (E) June 2020, (F) September 2020, (G) June 2021, (H) September 2021.
Forests 15 01650 g003
Figure 4. Temporal variation in disaster area and severity from 2017 to 2021.
Forests 15 01650 g004
Figure 5. Disaster area and proportion in different forest types from 2017 to 2021.
Forests 15 01650 g005
Figure 6. Disaster frequency in different forest types. (AD) represent the disaster frequency statistics for different forest types. (A) Larix olgensis, (B) Picea koraiensis, (C) Pinus sylvestris var. mongolica, (D) Pinus koraiensis. For each type of forest, the drawing is divided into two parts: 1 represents the disaster distribution map for that species, and 2 represents the statistical results of disaster frequency. Specifically, the x-axis represents the proportion of the total coniferous forest area where a disaster event occurred n times across the ten time intervals from 2017 to 2021, while the y-axis represents the frequency of these occurrences.
Forests 15 01650 g006
Figure 7. Radial diagram of geographic detector analysis results. Note: (A) depicts the analysis results for the development phase of the forest defoliating pest disaster cycle, while (B) represents the disaster mitigation and recovery phase. The variables labeled G1-5, M1-13, S1-4 correspond to the different factors listed in Table 2, which provides a detailed description of each indicator.
Forests 15 01650 g007
Figure 8. Heatmap of variable interactions by phase. (A) Represents variable interactions during the development phase, and (B) represents variable interactions during the mitigation phase.
Forests 15 01650 g008
Figure 9. Monthly climatic trends from 2017 to 2021.
Forests 15 01650 g009
Figure 10. Comparison of results from the field surveys and remote sensing inversions. (A) Forest resource survey data showing the observed defoliation rates across different areas. (B) Remote sensing inversion of defoliation rates as estimated by this study, illustrating the spatial distribution of defoliation.
Forests 15 01650 g010
Table 1. Details of data sources.
Data TypeData Name Spatial Resolution/Scale BarTimeLink
Remote
sensing image
Sentinel 2A10 mJune and September, 2017–2021https://scihub.copernicus.eu, accessed on 8 July 2023
Auxiliary dataSecond-Class Forest Resource Survey Data1:102018
High-Resolution Remote
Sensing Imagery
<1 mSeptember, 2018https://www.google.com/maps, accessed on 8 July 2023
Digital Elevation Model (DEM)10 m2018https://www.gis5g.com, accessed on 8 July 2023
Survey Data from the Forest Protection Department of the Forestry Bureau10 mJune, 2020
Meteorological Data30 m2018–2020Dr. Bintao Liu’s team
Table 2. Detailed description of different indicators.
CategoryCodeFactorDescriptionReference
Documentation
Forest Space StructureS1OriginThe study area’s plantations are primarily monoculture pine forests with simple stand structures, low biodiversity, and limited natural predator control, often resulting in large-scale disasters. In contrast, natural forests, with their higher biodiversity and complex biological networks, have more stable ecosystems and enhanced self-regulatory potential, leading to less severe disasters.[44]
S2Age of StandMiddle-aged and young forests have a significantly higher occurrence probability than other age groups, likely due to their developing structure and increased vulnerability.[8]
S3DBH (Diameter at Breast Height)The vigor of trees directly reflects the growth condition of the plants; better vigor results in stronger resistance to pests and diseases.[44]
S4Crown DensityForests with low canopy densities suffer more from pest damage than those with dense canopies, which have lower temperatures and weaker light, conditions unfavorable for adult pine caterpillars.[24]
S5Stand DensityWhen stand density is high, it affects the canopy closure and light intensity, especially in the central area of the forest where light conditions are relatively weak. These conditions are unfavorable for adult pine caterpillars to fly, mate, and lay eggs, resulting in relatively lower occurrences of pine caterpillars.[24]
Geographical FactorsG1ElevationLower elevation areas are more susceptible to insect outbreaks due to human interference.[45]
G2SlopePine caterpillar outbreaks are more severe on gentle slopes than on steep slopes at the same elevation. An increased slope enhances soil erosion, thereby increasing forest vulnerability, with the degree of slope directly proportional to its weakening effect.[45]
G3AspectThe slope direction directly impacts microhabitat temperature and humidity, influencing the distribution of sun-loving and shade-tolerant forest types. Pine caterpillars generally occur more frequently on sunny slopes than shady ones, and more on western slopes than eastern ones.[46]
G4Land TypeThe soil structure facilitates trees’ nutrient absorption, adjusting their sensitivity to insects. Some insects also overwinter in the soil as eggs or larvae.[45]
Meteorological FactorsM1/M2/M3Average Annual Temperature of 2018/2019/2020Annual temperature ranges reflect extreme seasonal temperatures and the sea and land’s influence on a region. Warmer temperatures enable pine caterpillar larvae to develop faster and achieve higher survival rates.[16]
M4/M5/M6Minimum Winter Temperature in 2018/2019/2020Warmer winters and springs may initially increase the synchronicity between leaf fall and Larix olgensis, while extremely warm spring temperatures may reduce the survival rate from larvae to adulthood.[47]
M7/M8Average Monthly Precipitation in Spring 2018/Summer 2020Precipitation can affect the water content and vitality of host trees by changing atmospheric and soil moisture, and can mechanically damage eggs and hatched larvae. This may adversely affect adult mating and suppress pine caterpillar occurrences.[45]
M9/M10/M11Sunshine in 2018/2019/2020Increased sunlight duration during the growing season enables insects to grow rapidly.[45]
M12/M13Relative Humidity in 2018/2019Extreme variations in relative humidity may affect the hatching process of eggs and subsequent survival rates, and may exacerbate the spread of pathogens.[16]
Table 3. Pest outbreak proportions by humidity (2017–2021).
TimeLow Humidity (0%–27%)Moderate Humidity (27%–30%)High Humidity (30%–100%)
2017.0976.0123.980.01
2018.0685.3112.172.52
2018.0987.549.053.41
2019.0665.0625.49.54
2019.0993.086.490.43
2020.0666.1326.237.64
2020.0961.1726.8212.01
2021.0664.9722.9712.06
2021.0974.4721.843.69
Disclaimer/Publisher’s Note: The statements, opinions and data contained in all publications are solely those of the individual author(s) and contributor(s) and not of MDPI and/or the editor(s). MDPI and/or the editor(s) disclaim responsibility for any injury to people or property resulting from any ideas, methods, instructions or products referred to in the content.