Article

The Impacts of Phenological Stages within the Annual Cycle on Mapping Forest Stock Volume Using Multi-Band Dual-Polarization SAR Images in Boreal Forests

1
Research Center of Forestry Remote Sensing & Information Engineering, Central South University of Forestry & Technology, Changsha 410004, China
2
Hunan Provincial Key Laboratory of Forestry Remote Sensing Based Big Data & Ecological Security, Changsha 410004, China
*
Author to whom correspondence should be addressed.
Forests 2024, 15(9), 1660; https://doi.org/10.3390/f15091660
Submission received: 2 August 2024 / Revised: 22 August 2024 / Accepted: 18 September 2024 / Published: 20 September 2024
(This article belongs to the Section Forest Meteorology and Climate Change)

Abstract

:
SAR images with two polarizations show strong potential for mapping forest stock volume (FSV) combined with limited samples. However, accurately mapping FSV still presents challenges in selecting the optimal acquisition date to obtain the SAR images during specific phenological stages within the annual forest cycle (growth and dormant stages). To clarify the impacts of phenological stages within the annual cycle on FSV mapping, SAR images with various polarization models and bands (Sentinel-1(S), GaoFen-3(GF-3 (G)) and ALOS-2(A)) were acquired within the growth and dormant stages of an annual cycle in a boreal evergreen coniferous forest (Chinese pine) and a deciduous coniferous forest (Larch). Subsequently, single-band (G, S, and A) and multi-band combined alternative variable sets (A + G, A + S, S + G, and A + S + G) were extracted within the same stage, respectively. Finally, the forward selection approach was utilized in conjunction with four different models (MLR, KNN, RF, and SVR) to obtain the most suitable variable sets and generate FSV mapping. The results demonstrated a strong correlation between the intensity of backscattering coefficients and the phenological stages of the forest. Within the dormant stage, there was a significant decrease in the gaps of backscattering coefficients obtained from the same polarization compared to those within the growth stage. Furthermore, the results also revealed that more signals from inside the canopy could be detected during the dormant stage in both evergreen coniferous forests and deciduous coniferous forests. Subsequently, the accuracy in mapping FSV obtained from single-band SAR images within the dormant stage are slightly higher than that within the growth stage, and the accuracy was still significantly affected by both overestimation and underestimation. Moreover, the combined effects of different bands significantly improve the reliability of mapped FSV. The rRMSE values in four multi-band combinations ranged from 22.37% to 29.40% for Chinese pine forests and from 21.27% to 34.38% for Larch forests, and the optimal result was observed from combinations of A + S + G acquired within the dormant stage. It is confirmed that SAR signal and their sensitivity to FSV depends on the stages of forest annual growth cycle. In comparison to the growth period, dual-polarization SAR data acquired during the dormant stage is more suitable for estimating FSV in boreal forests.

1. Introduction

Recently, the assessment of forest quality has increasingly emphasized the significance of forest stock volume (FSV) as one of the crucial indicators [1,2,3]. The integration of remote sensing images with limited samples is gradually developing as a more efficient and affordable strategy to map FSV in varied forest regions, replacing traditional laborious and time-consuming methods. This is due to developments in space and information technology [4,5,6]. Passive remote sensing techniques primarily encompass optical sensors that allow swift retrieval of forest information over large spatial extents at low data acquisition costs. However, limitations such as cloud cover, ground topography, shadow effects caused by forest canopies, and potential saturation issues associated with optical signals [3,4,5] frequently hinder accurate mapping of FSV, especially in high-density regions. Microwave remote sensing techniques, represented by Synthetic Aperture Radar (SAR), hold great potential to overcome these inherent drawbacks in optical remote sensing approaches [6,7,8,9].
SAR signals at the C and L bands demonstrate robust penetration capabilities, offering significant advantages in capturing canopy and vertical structure information of forests [10,11,12]. Currently, quad-polarization and dual-polarization SAR data have been extensively utilized for mapping FSV in diverse forests. Furthermore, polarization features extracted from quad-polarization SAR data exhibit higher sensitivity to forest parameters compared to those extracted from dual-polarization SAR data [13]. However, due to the presence of multiple SAR sensors operating at different frequencies, there is a considerably larger quantity of dual-polarization SAR data available compared to quad-polarization SAR data [14,15]. As a result, dual-polarization SAR data continues to be regarded as the main source for estimating FSV.
For accurate mapping FSV, it is imperative to extract valuable variables from dual-polarization SAR data. Normally, backscattering coefficients with various polarization modes, decomposition variables, Radar vegetation indices (RVI), and texture variables are widely employed to map FSV. Polarization decomposition methods are widely used to map forest parameters due to their direct connection to the forest scattering process. Various techniques, such as the Cloude–Pottier [16], Van Zyl [17], and Freeman–Durden decompositions [18], are available for quad-polarization SAR data. However, methods for dual-polarization data remain limited. Among these, the H/α/A decomposition stands out for its reliability in analyzing forest vegetation and urban areas. It is also the main approach for incoherent target decomposition, which is essential for dual-polarization SAR data analysis.
Moreover, the sensitivity between these variables and FSV is frequently influenced by many factors, such as forest types, wavelength, polarization modes, and phenological factors. Previous studies have shown that forest types have a significant impact on the correlation between extracted variables and FSV [19,20]. Among different types of forests, variations in forest structures and growth states result in differences in scattering mechanisms [21]. Furthermore, there are notable disparities in accuracy in estimating biomass for coniferous and evergreen broad-leaved forests using Sentinel-1 in the same geographical area [22]. Additionally, previous results have also demonstrated that SAR signals from different bands exhibit variations in vegetation characteristics and better depict structural attributes of vegetation. Higher accuracy for mapping aboveground biomass (AGB) has been obtained in Masson pine forests compared to Chinese fir forests [23]. Based on the relationships between variables extracted from SAR data and FSV of coniferous and broadleaf forests in karst mountain areas, previous results have implied that the backscattering coefficient of coniferous forests is higher than that in broadleaf forests at the same FSV level [24]. Moreover, previous studies have also highlighted significant disparities in accuracy and saturation when estimating FSV using polarimetric SAR within tropical broad-leaved forests compared to subarctic coniferous forests [25]. Therefore, the difference in the microwave scattering process caused by different forest types is the key to selecting acquired dates for dual-polarization SAR images in accurate mapping FSV.
Additionally, information derived from SAR signals is closely associated with growth phases throughout the year for the same forest type. Typically, the annual cycle can be broadly classified into dormant and growth stages [26]. During the dormant stage, forests exhibit reduced physiological activity due to adverse environmental conditions and decreased sunlight exposure during cold winters [27]. Conversely, the growth stage is characterized by accelerated tree growth, thicker trunks, and denser branches and leaves [28]. Polarimetric SAR technology effectively captures these temporal changes in forest morphology and structure to provide comprehensive information for the precise mapping of forest parameters [29]. These seasonal variations can be observed by scattering characteristics within polarized SAR images. Previous studies have confirmed that during spring and summer, when vegetation growth is at its densest, there are increased scattering effects from forests on SAR signals, whereas autumn and winter witness foliage shedding or bare land surfaces leading to altered scattered signals [30]. Furthermore, in contrast to optical sensors, meteorologically independent SAR images in forests can be detected regularly, thereby facilitating high-frequency observations within the same area. The scattering process of SAR signals associated with forest parameters typically exhibits variations corresponding to different phenological stages within the annual cycle of the forest (including growth and dormant stages). However, limited studies have been performed on investigating the response of SAR data to variations in phenological stages for estimating forest parameters. It remains a challenge to explore the impacts of phenological factors on mapping FSV using dual-polarization SAR data acquired during growth or dormant stages.
In this article, we examined the response of SAR signals to different forests and phenological factors to assess the capability of dual-polarization SAR data for mapping FSV. Initially, boreal evergreen coniferous forest (Chinese pine) and deciduous coniferous forest (Larch) were selected and several variables derived from dual-polarization SAR data with varying bands and polarization modes were acquired during both the growth and dormant stages. Subsequently, various variables extracted from SAR data were employed to investigate the relationships between the accuracy of estimating FSV and phenological factors.

2. Study Area and Data
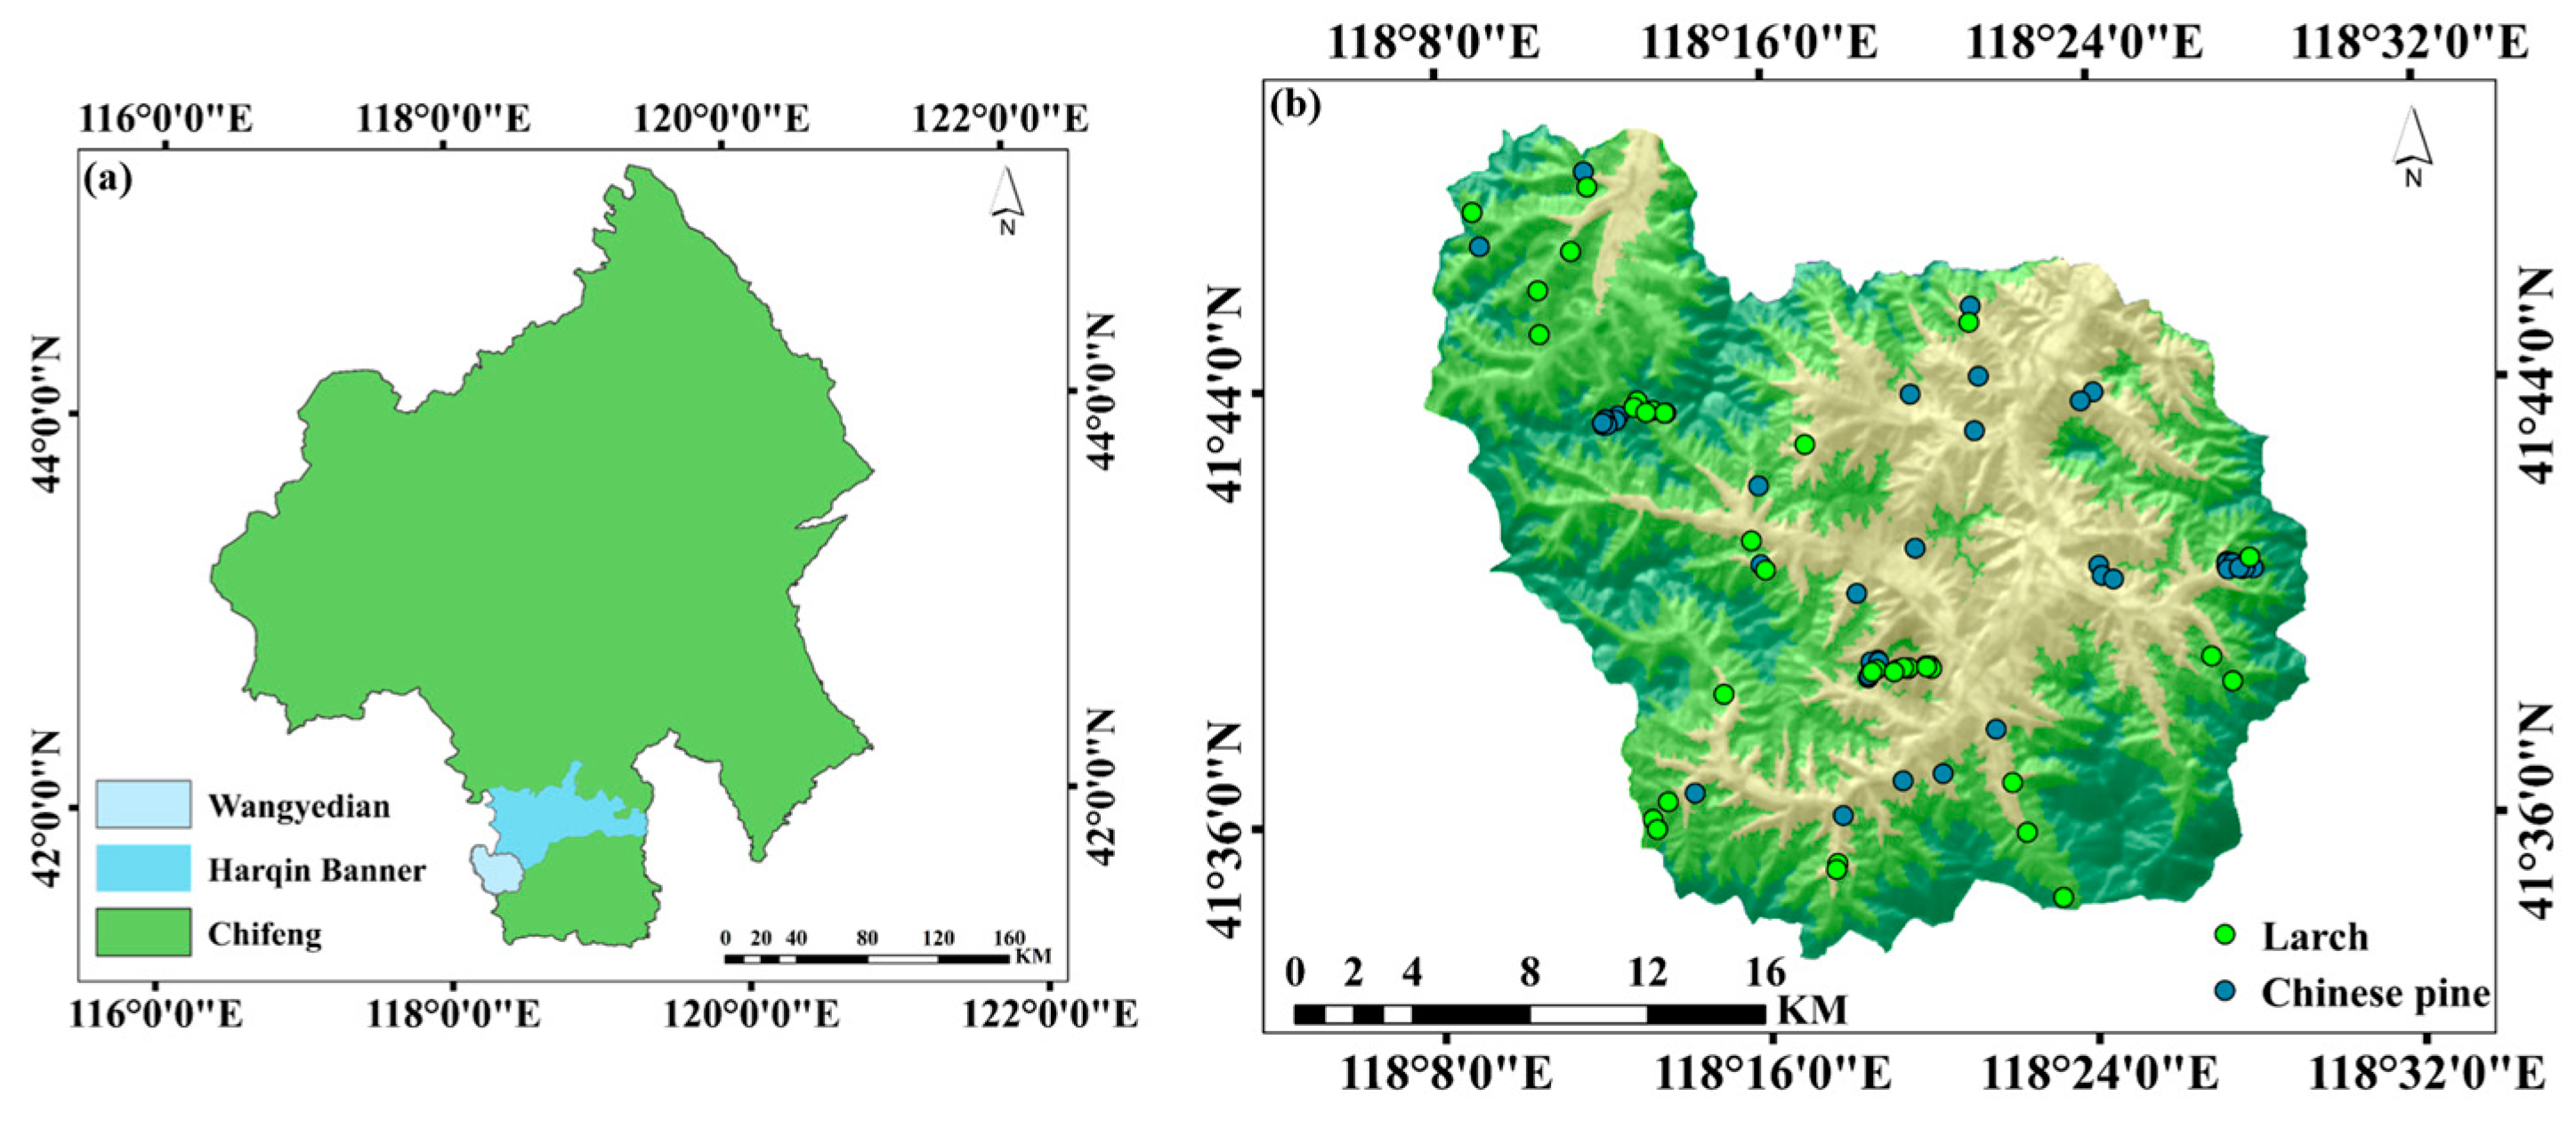
2.1. Study Area

Wangyedian Forest Farm, situated in southwest Inner Mongolia, is a prominent state-owned forest in China. The study area, between 118°09′ to 118°30′ E and 41°21′ to 41°39′ N (Figure 1), features mid-to-low mountainous terrain and a continental monsoon climate with four distinct seasons: spring (March–May), summer (June–August), autumn (September–October), and winter (November–February of the subsequent year) [31]. The rainy season is mainly concentrated in July–August. Based on data from 2016, the forest coverage area encompassed approximately 23,300 ha, exhibiting a forest coverage rate of around 93 percent. The total FSV reached an impressive figure of about 1527 million m3, while the plantation coverage rate accounted for roughly 49.78% (equivalent to approximately 11,600 ha) [32]. The predominant tree species found in this plantation include Larch (principis-rupprechtii Mayr) and Pine (tabuliformis Carr).

2.2. Ground Data

In October 2017, 81 ground samples were collected using stratified random sampling based on species and FSV. This included 38 Larch and 43 Chinese Pine samples, each covering 25 m × 25 m. The Global Navigation Satellite System (GNSS) was used to determine precise positions, and tree height, diameter at breast height, and crown width were measured for each sample. Finally, both the volume of a single tree and FSV for each sample were obtained by integrating the ground-measured parameters for each individual tree with the binary volume equations [33]. Statistically, the FSV of Chinese pine ranged from 91.97 m3/ha to 334.01 m3/ha; for Larch samples, it varied between 87.44 m3/ha and 405.56 m3/ha.

2.3. Dual-Polarization SAR Images

Due to the distinct seasonal variations in the study area, the growth of Chinese pine and Larch was classified into two distinct stages within the forest’s annual cycle: the growth stage and the dormant stage. Consequently, C- and L-band dual-polarization SAR images were acquired during two phases. In March 2017, we obtained C-band GF-3, Sentinel-1 (VV and VH polarizations), and L-band ALOS-2 images during the dormant stage. Additionally, in August 2017, we also acquired three dual-polarization SAR images during the growth phase (Table 1).

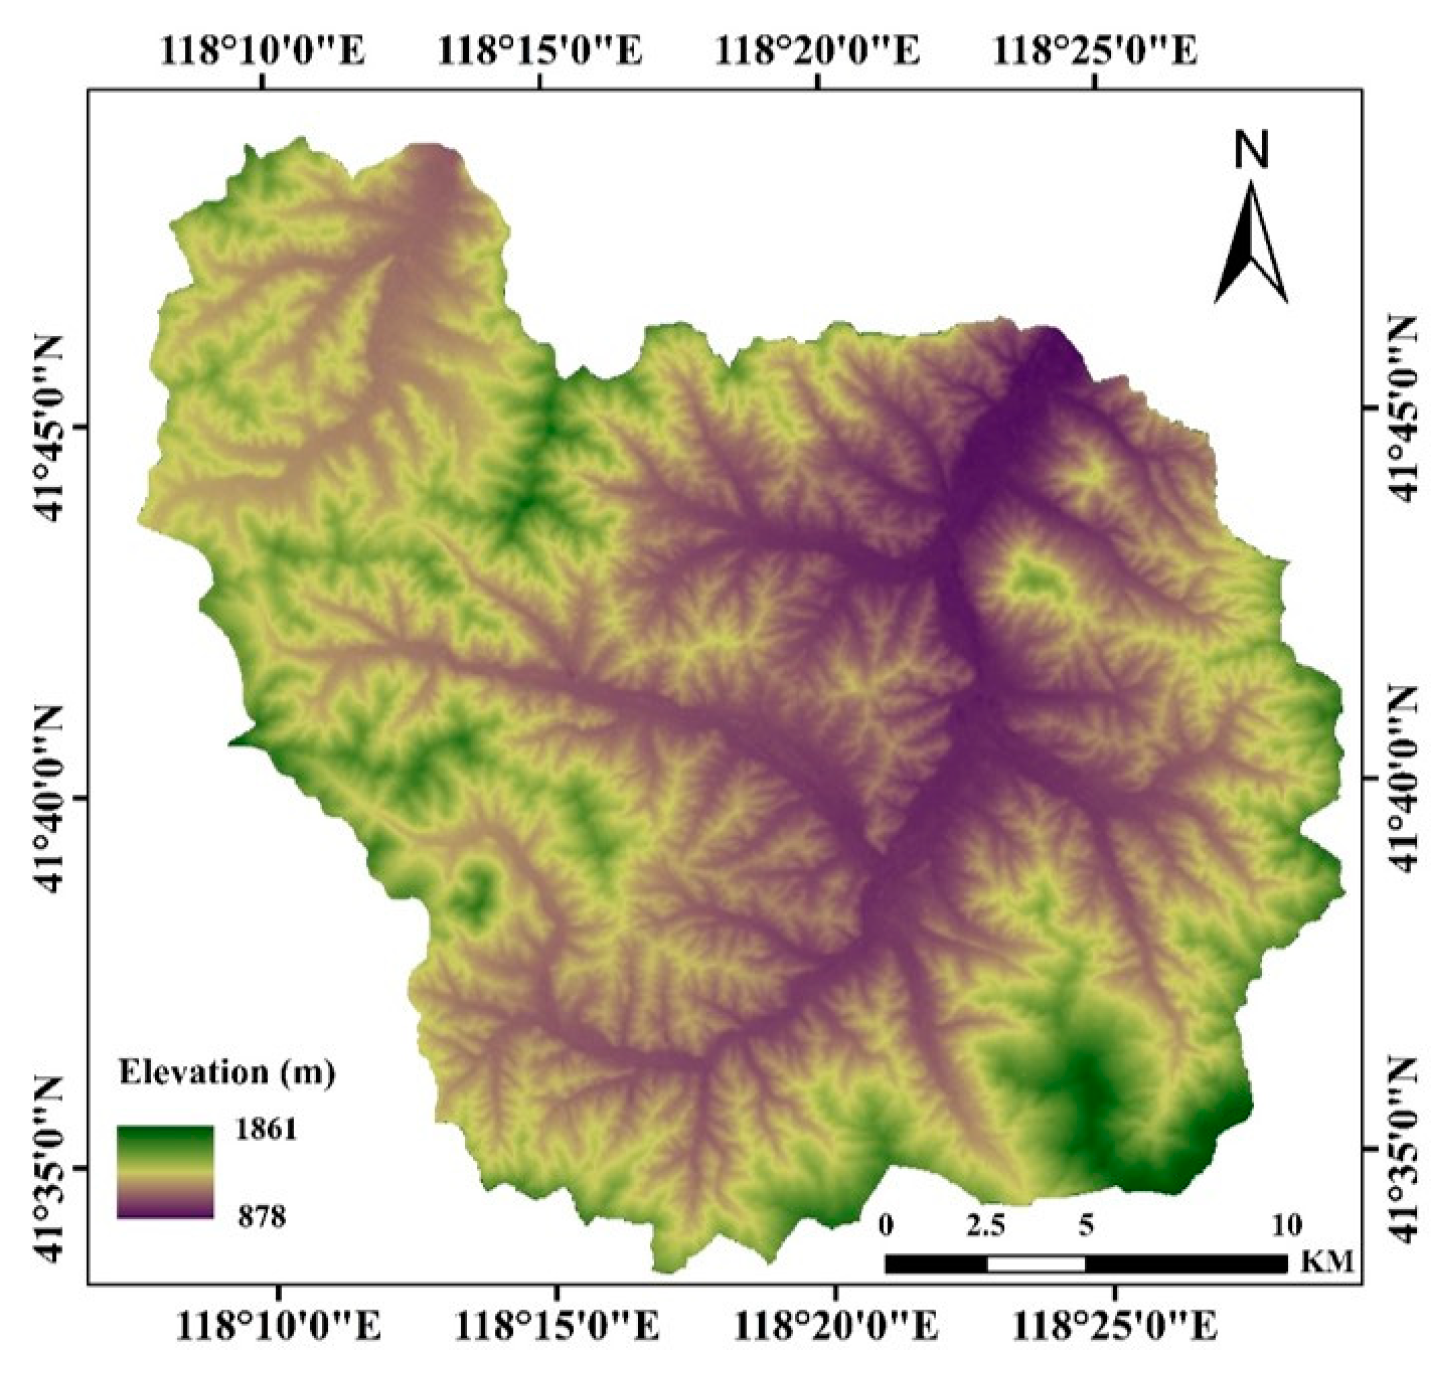
2.4. Digital Elevation Model

The dual-polarization SAR image in the Wangyedian Forest farm, being situated in a mountainous region, is significantly influenced by terrain factors. Therefore, topographic correction processing and geocoding necessitate the Digital Elevation Model (DEM). The ASTER GDEM with a 30 m spatial resolution was utilized to perform terrain correction and geocoding during the preprocessing of SAR images (Figure 2).

3. Methods

3.1. SAR Images Preprocessing

The dual-polarization SAR images are susceptible to significant noise, which can result in geometric distortion during signal transmission and reception. Therefore, mitigating the impacts of noise is necessary to effectively capture the scattering characteristics of forest canopy and accurately analyze the relationship between FSV and variables extracted from acquired images. Initially, radiometric correction was applied to the SAR images, followed by multi-look processing. Adaptive Frost filtering was then utilized to reduce speckle noise. Additionally, the topographic correction was also applied to minimize distortions caused by topographic factors such as shrinkage effects from terrain variations. Finally, geocoding was performed using employed DEM. After preprocessing, these SAR images acquired in the growth and dormant stages were applied to extract various types of variables.

3.2. Extracting Variables from SAR Images

For mapping FSV, variable extracting is the first step to form alternative variable sets. There are several alternative variables extracted from dual-polarization SAR images in the growth and dormant stages, including backscattering coefficients with different polarization modes and their derived variables, decomposition variables, Radar vegetation indices (RVI), and texture variables.

3.2.1. Backscattering Coefficients and Derived Variables

Extracting sufficient variables from SAR images is essential for constructing regression models. Backscattering coefficients are extensively employed to map forest parameters in various forest scenes. In this study, the backscattering coefficients of SAR data encompass two polarization modes, HH/HV (GF-3 and ALOS-2) and VH/VV (Sentinel-1). Additionally, mathematical operations were also applied to construct derived variables to augment the number of alternative variables [34]. Consequently, eighteen derived variables were extracted from each type of acquired SAR image in this study. For acquired Sentinel-1 images, polarization modes of HH and HV (GF-3 and ALOS-2) are replaced by VV and VH (Sentinel-1), respectively.

3.2.2. Decomposition Variables and RVI

Commonly, polarization decomposition methods are extensively employed to extract polarization variables from SAR images. However, it should be noted that while numerous decomposition methods are suitable for quad-polarization data, there remains a scarcity of techniques specifically designed for dual-polarization SAR data. The H/a/A decomposition method is the primary approach employed in incoherent target decomposition, which plays a crucial role in decomposing dual-polarization SAR data. In this study, polarization entropy (H), anisotropy (A), and average target scattering angle (a) were extracted from the H/a/A decomposition method [35]. Then, two characteristics of polarization Entropy and average target scattering Angle (a) were selected as the alternative variables set. Additionally, Radar vegetation indices (RVI) [36] and bipolar SAR vegetation index (DPSVI) [37] were also employed to investigate the correlation related to forest FSV.

3.2.3. Texture Variables

To augment the number of alternative variables for model construction, texture variables extracted from backscattering coefficients are commonly utilized. In this study, we utilized the Gray Level Concurrence Matrix (GLCM) [38] to extract texture information. From each backscattering coefficient image, eight textural variables were obtained with varying window sizes (ranging from 5 to 9), including mean, homogeneity, variance, contrast, entropy, dissimilarity, second moment, and correlation.

3.3. Variable Evaluation and Models

To obtain the most effective variable subset, the Pearson correlation coefficient was initially applied to evaluate the sensitivity between FSV and the variables. Subsequently, the absolute values of these correlations and sorted variables in descending order based on their coefficients were obtained for variable selection. Afterward, sequential forward selection methods along with four models (MLR, KNN, RF, and SVR) were employed to create wrapped variable selection methods. By eliminating variables that had minimal impact on accurately estimating FSV, optimal variable sets were derived. Additionally, multi-band combined data with different strategies in growth and dormant stages were also generated to map forest FSV (Table 2).

3.4. Accuracy Evaluation Indices

The LOOCV method was used to assess model performance in mapping FSV, with the root mean square error (RMSE), relative root means square error (rRMSE), and coefficient of determination (R2) as evaluation metrics for model accuracy. The formulas for these indices are presented as follows:
R M S E = 1 N i = 1 n y ^ i y i ˙ 2
r R M S E = R M S E y ¯ × 100 %
R 2 = 1 i = 1 n y ^ i y i ˙ 2 i = 1 n y ¯ i y i ˙ 2
the predicted FSV is denoted by y ^ i , the ground-measured FSV is denoted by y i ˙ , the average of ground-measured FSV is denoted by y ¯ i , and the total number of samples is indicated by n .

4. Results

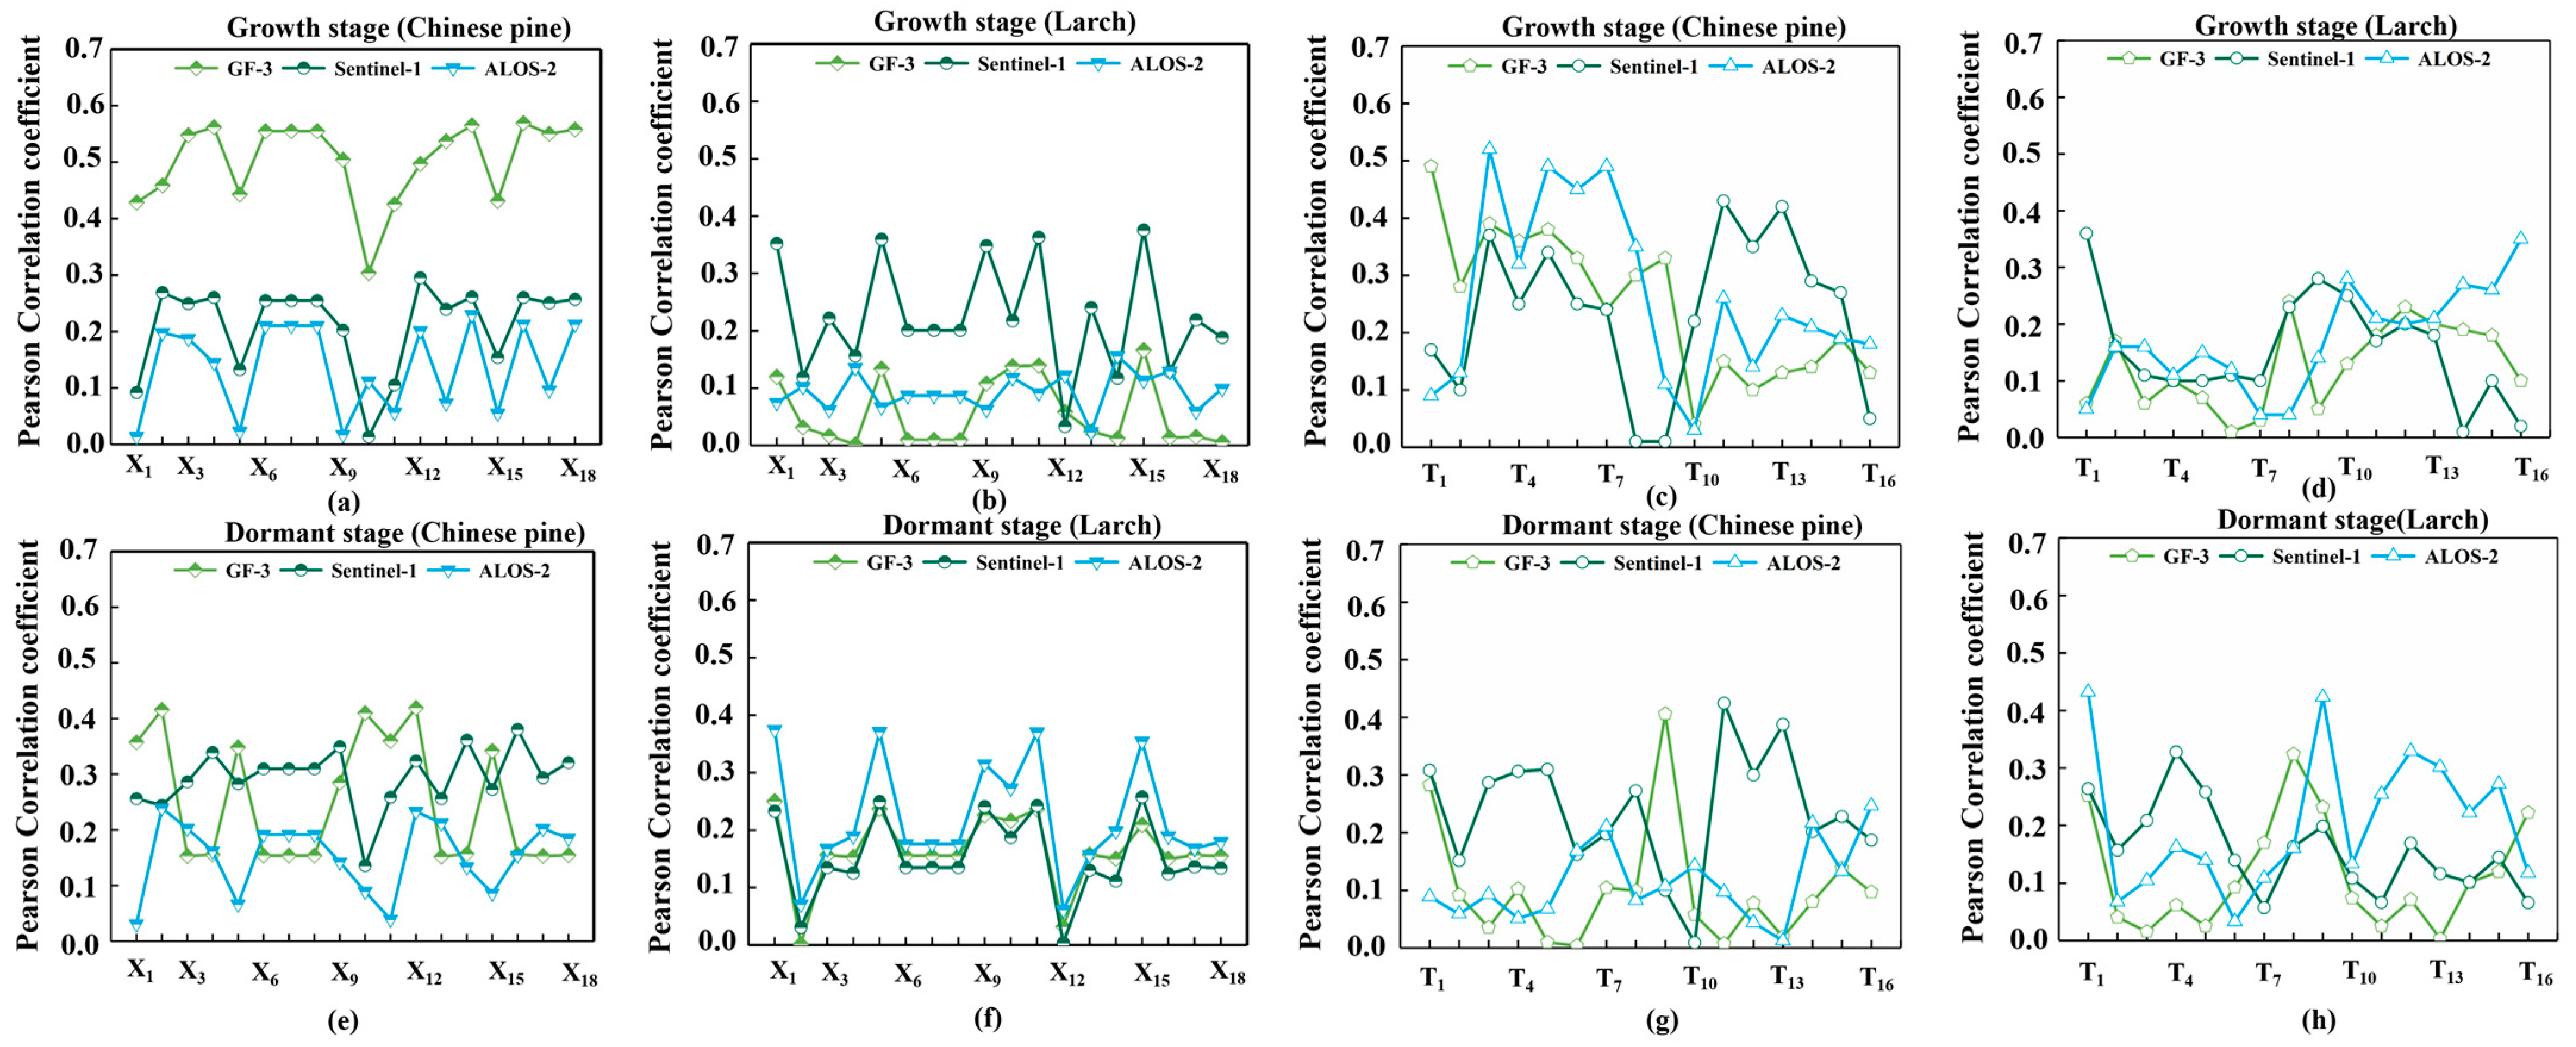
4.1. The Results of Backscattering Coefficients Related to Forest Phenological Factors

To analyze the variations in backscattering coefficients during the growth and dormant stages, the scatterplots between forest FSV and backscattering coefficients (Figure 3) were plotted. The results demonstrated that backscattering coefficients of co-polarization (HH and VV) from GF-3, Sentinel-1, and ALOS-2 images were significantly higher than those from cross-polarization (HV and VH) during both growth and dormant stages. Furthermore, these backscattering coefficients extracted from ALOS-2 SAR data exceeded those extracted from GF-3 and Sentinel-1 data; these backscattering coefficients extracted from C-band Sentinel-1 were higher than those extracted from GF-3 SAR data. Notably distinct differences were also observed in the backscattering coefficients during the growth and dormant stages. It is inferred that the backscattering coefficients are highly related to the wavelength, polarization modes, and phenology of forest types.
During the growth stage in the evergreen coniferous forest (Chinese Pine), a significant disparity was observed in the backscattering coefficients extracted from dual-polarization SAR data with different bands and polarization modes (Figure 3a,b), which can be attributed to variations in wavelengths and polarization modes. In the dormant stages (Figure 3e,f), the backscattering energy extracted from ALOS-2 is attenuated, while there is a slight increase in backscattering energy extracted from Sentinel-1 and GF-3 images; however, the disparity among different bands gradually diminishes.
In the dormant stage of deciduous coniferous forest (Larch), backscattering coefficients of HH polarizations (Figure 3c,d) ranged from −8 dB to 0 dB for ALOS-2, from −12 dB to −5 dB for Sentinel-1, and from −20 dB and −10 dB for GF-3, respectively. Similar distribution characteristics were observed in the extracted backscattering coefficients of cross-polarization from these SAR images. The results also illustrated that the gaps of backscattering coefficients extracted from ALOS-2 and Sentinel-1 were significantly decreased compared to those in the evergreen coniferous forest. In the dormant stages (Figure 3g,h), the differences between backscattering coefficients extracted from these dual-polarization SAR images have become smaller, making it challenging to distinguish between ALOS-2 and Sentinel-1. This suggests that L-band and C-band SAR signals penetrate a deciduous coniferous forest almost equally.

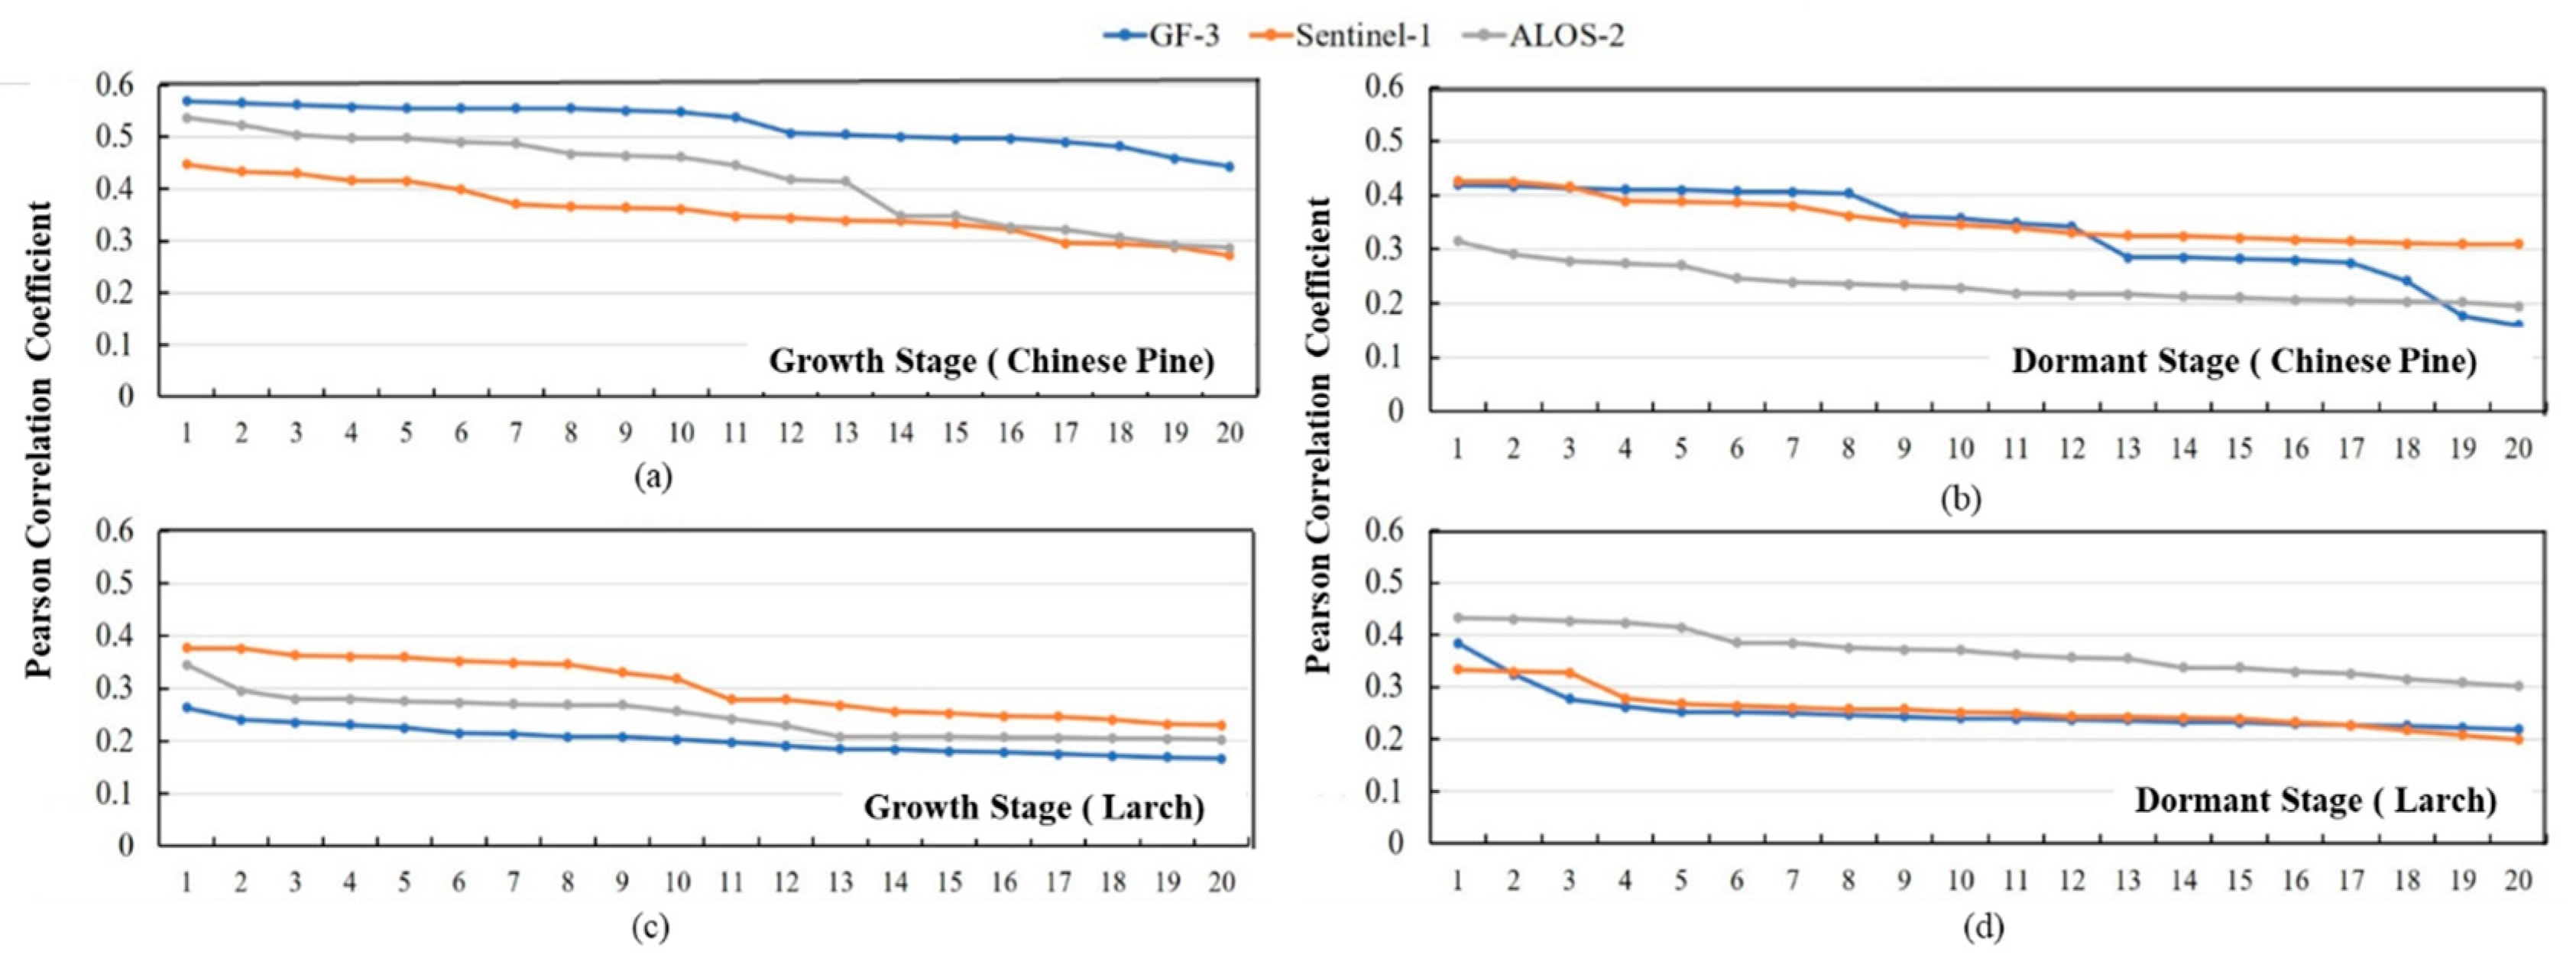
4.2. The Sensitivity Results of Variables Related to Forest Growth and Dormant Stages

To further analyze the impact of phenological factors on mapping FSV using dual-polarization SAR images, the Pearson coefficients between FSV and variables should be initially investigated. In this study, derived variables (From X1 to X18) extracted from backscattering coefficients and texture variables (T1 to T16) extracted from backscattering coefficients of co-polarization and cross-polarization were applied to calculate the Pearson correlation coefficients, respectively (Figure 4).
The results demonstrated that the sensitivity of variables was influenced by wavelength, polarization modes, and forest phenological factors. During the growth stage, the values of the Pearson coefficient of variables extracted from GF-3 and Sentinel-1 data exhibited higher values compared to those obtained from ALOS-2 data in Chinese pine forests (Figure 4a,b,e,f). The highest correlation coefficient obtained from GF-3 images ranged from 0.30 to 0.60. In contrast, the Pearson correlation coefficient between derived variables extracted from Sentinel-1 and FSV was stronger than that observed for GF-3 and ALOS-2 data in planted Larch forests. During the dormant stage, the Pearson correlation coefficients of variables obtained from GF-3 and Sentinel-1 data in Chinese pine forests also demonstrated higher values compared to those obtained from ALOS-2 data. However, these derived variables extracted from datasets acquired during both growth and dormant stages showed similar correlations with FSV in Larch forests ranging from 0 to 0.30.
Furthermore, the results also revealed higher Pearson correlation coefficients between the texture variables extracted from SAR data and FSV in Chinese pine forests compared to those in Larch forests (Figure 4c,d,g,h). Moreover, during the dormant stage, the Pearson correlation coefficients of texture variables were higher than those during the growth stage in Larch forests. Additionally, polarization modes also influenced the correlation coefficient between texture characteristics and FSV under two distinct growth states. It is inferred that the sensitivity between texture variables and FSV are severely influenced by the phenological states, and the dual-polarization SAR data obtained during the growth stage is more suitable for Chinese pine forests, whereas the data acquired during the dormant stage is better suited for Larch forests.

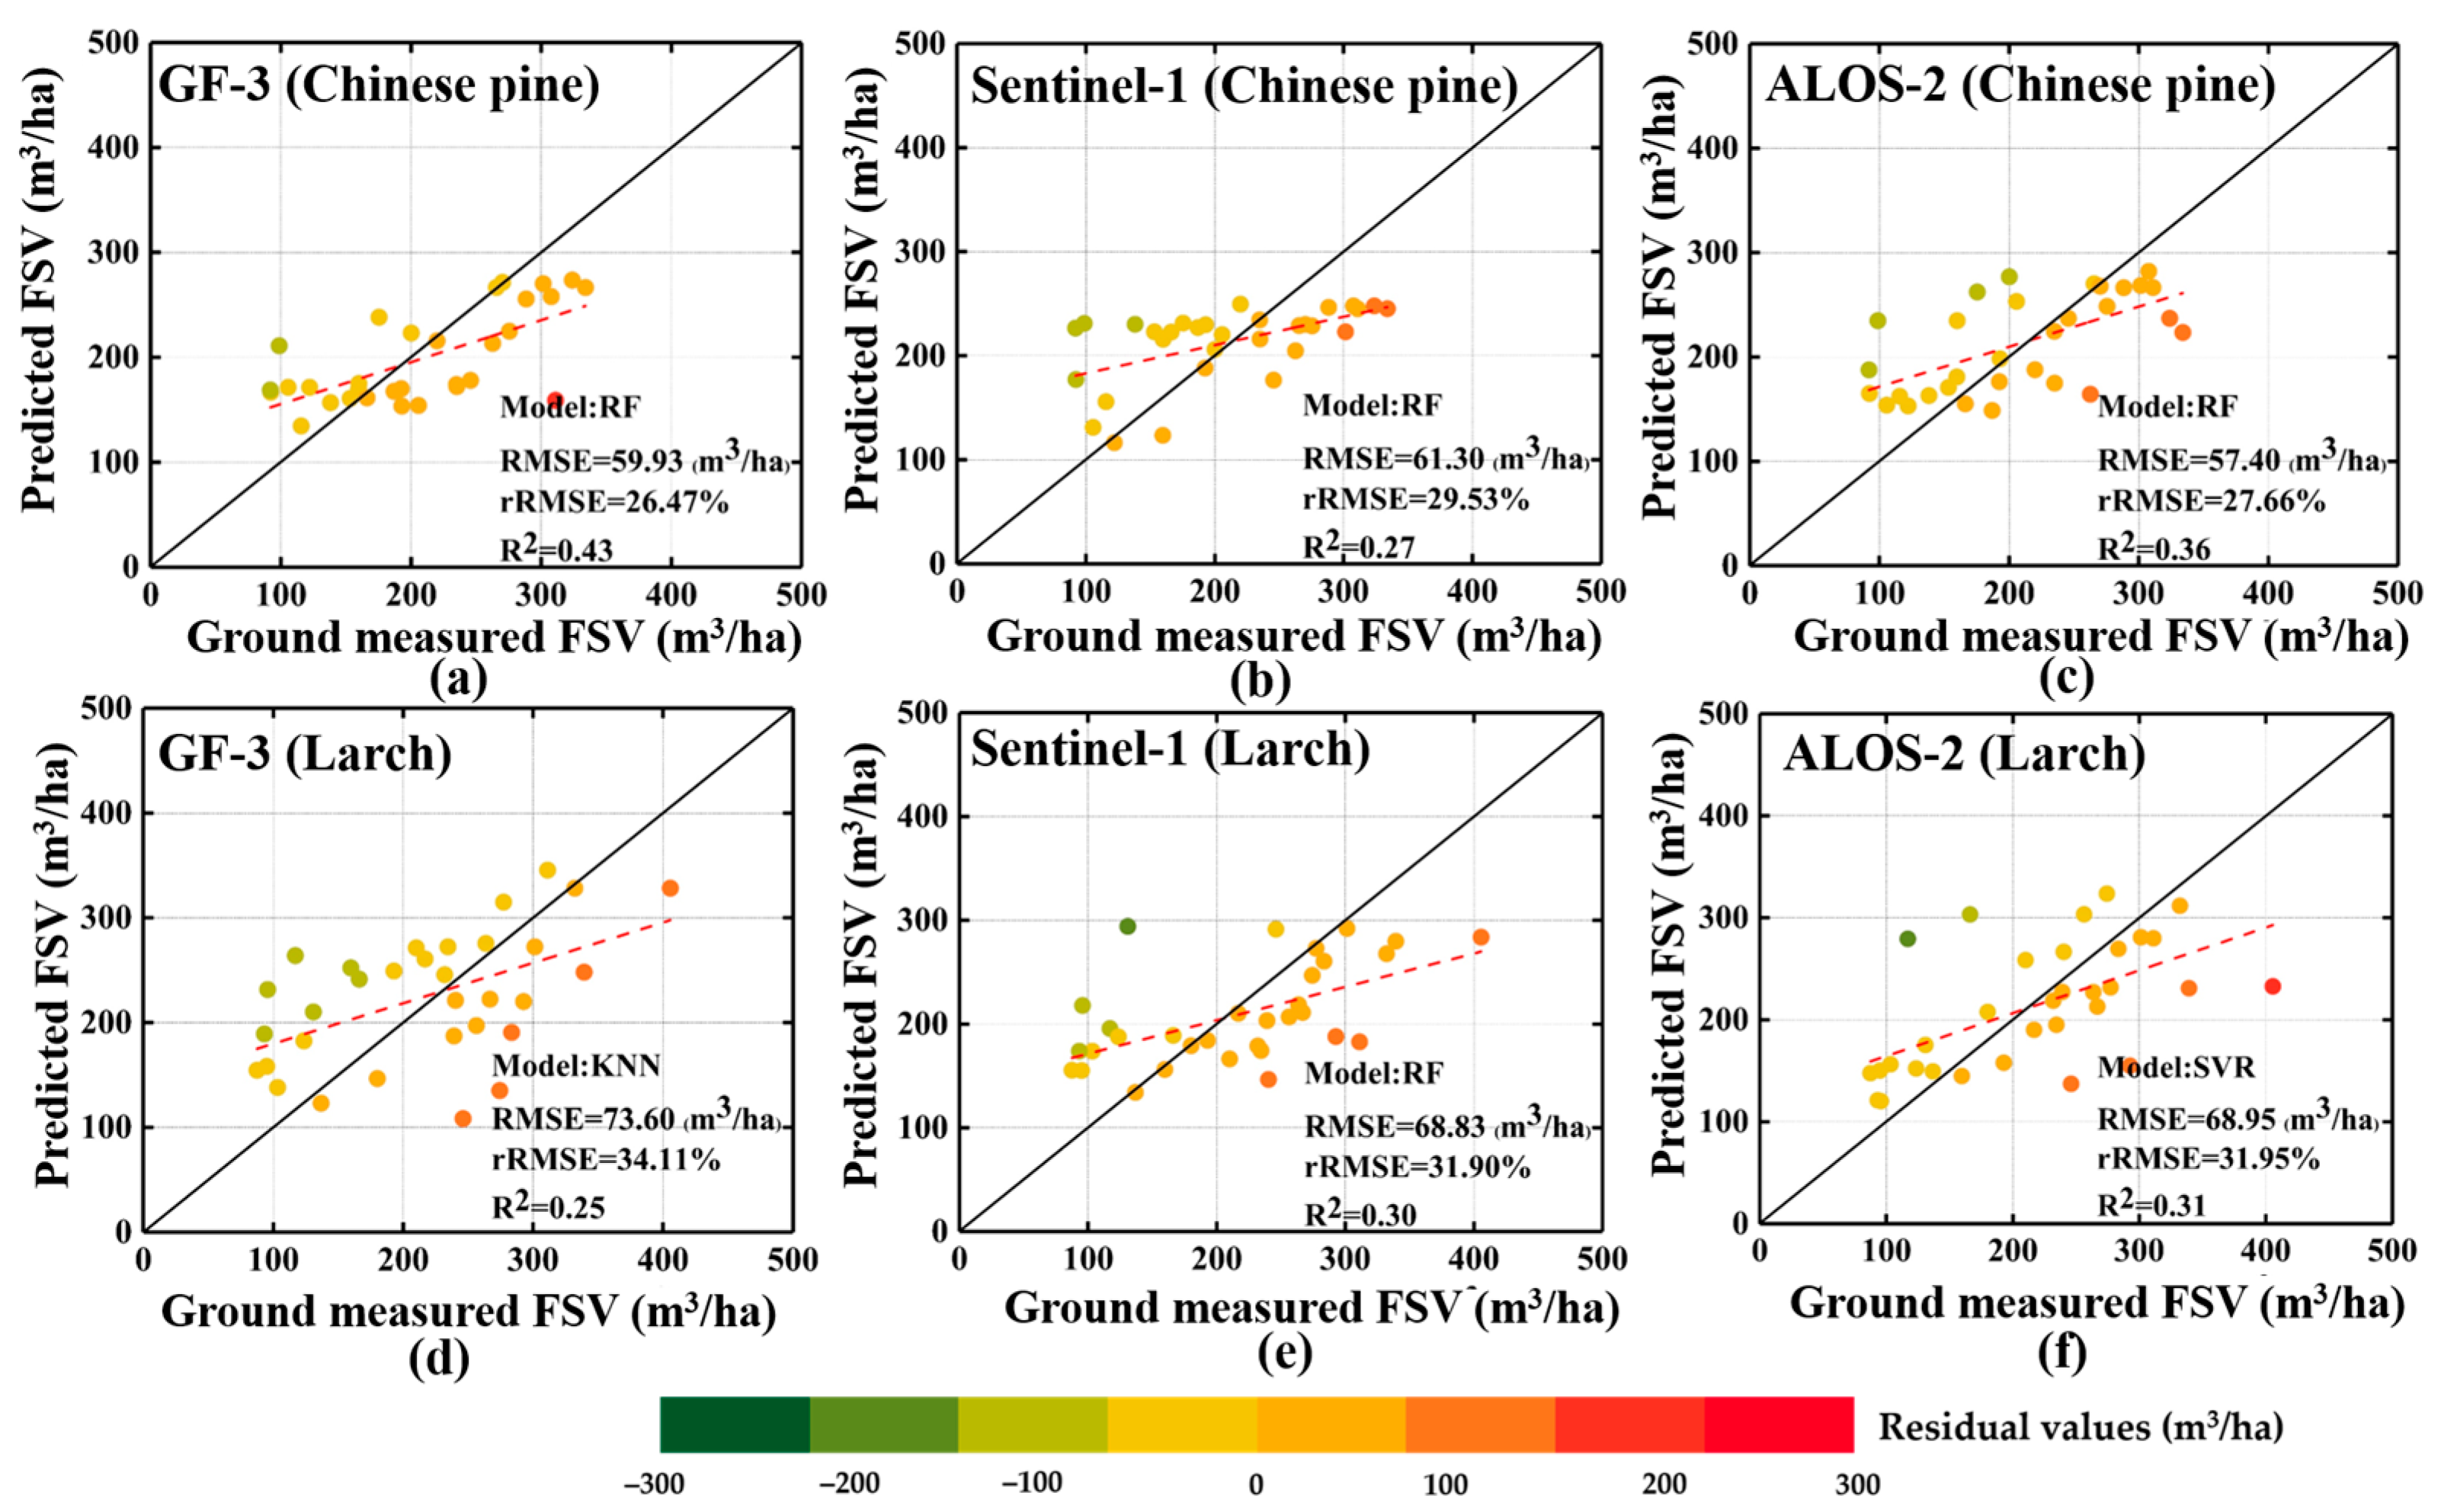
4.3. The Results of Mapped FSV Using Single-Band SAR Images

4.3.1. The Results of Estimated FSV Using Single Data during the Dormant Stage

In the Chinese pine forests, the results demonstrated that the rRMSE values derived from GF-3, Sentinel-1, and ALSO-2 ranged from 28.38% to 34.28%, from 23.99% to 32.45%, and from 29.69% to 35.24%, respectively (Table 3). Furthermore, the average rRMSE derived from Sentinel-1 data exhibited the lowest value, with an average rRMSE of 28.08%. In the Larch forests, the rRMSE values ranged from 32.35% to 36.90% for GF-3 images, 32.15% to 40.79% for Sentinel-1 images, and 31.96% and 35.01% for ALOS-2 images, respectively. The high rRMSE values were mainly due to the sensitivity of variables in the models (MLR and KNN) and ALOS-2 data for FSV mapping in Larch forests.
Using the SAR data acquired in the dormant stage, the results demonstrated that the accuracy in Chinese pine forests surpassed that in Larch forests, with GF-3 and Sentinel-1 data exhibiting superior performance compared to ALOS-2 data. Furthermore, it is worth mentioning that there was minimal discrepancy in accuracy among the three SAR datasets when estimating FSV in Larch forests. To further analyze the performance of models in mapping FSV, the scatterplots between ground-measured and predicted FSV obtained by optimal models were plotted using single-band dual-polarization SAR images acquired in the dormant stage (Figure 5). The R2 values of mapping FSV by single-band dual-polarization SAR data are rather low in both Chinese pine and Larch forests. This can be attributed to the saturation phenomenon observed in all models, resulting in a significant underestimation of high FSV samples.

4.3.2. The Results of Estimated FSV Using Single Data during the Growth Stage

To further investigate the response between FSV and variables acquired at the growth stage, regression models were also applied to accurately map FSV (Table 4). In Chinese pine forests, the estimated FSV derived from GF-3 data demonstrated rRMSE values ranging from 26.47% to 29.88%, and R2 values ranging from 0.32 to 0.43, respectively. Similarly, the results obtained from Sentinel-1 data revealed rRMSE values ranging between 29.53% and 34.05%, with R2 varying from 0.24 to 0.29. Additionally, the results obtained from ALOS-2 data estimated rRMSE values within a range of 27.66% to 32.03%, while R2 varied between 0.17 and 0.36. Moreover, the accuracy of mapping FSV using GF-3 data surpassed that of Sentinel-1 and ALOS-2, with the best estimation results exhibiting an rRMSE of 26.47% and an R2 value of 0.43. In Larch forests, the rRMSE estimated by GF-3, Sentinel-1, and ALOS-2 ranged from 34.11% to 35.96%, 31.90% to 36.40%, and 31.95% to 35.70%, respectively. The R2 values varied between 0.10 and 0.38 for GF-3 data, between 0.10 and 0.30 for Sentinel-1 data, and between 0.18 and 0.31 for ALOS-2 data. Additionally, there was minimal difference between ALOS-2 and Sentinel-1 data, but GF-3 data showed the lowest FSV mapping accuracy.
Among these dual-polarization SAR data acquired during the growth stage, the accuracy in Chinese pine forests surpassed that in Larch forests, aligning with the findings observed during the dormant stage. Furthermore, the scatterplots and residual plots were also generated to compare the predicted and measured values using the optimal results derived from single-band SAR images in the growth stage (Figure 6). The results also clearly illustrated that saturation phenomena frequently occurred in the estimated results. Consequently, these overestimation and underestimation samples significantly impacted the accuracy of mapping FSV.

4.4. The Results of Mapped FSV by Multi-Band SAR Images

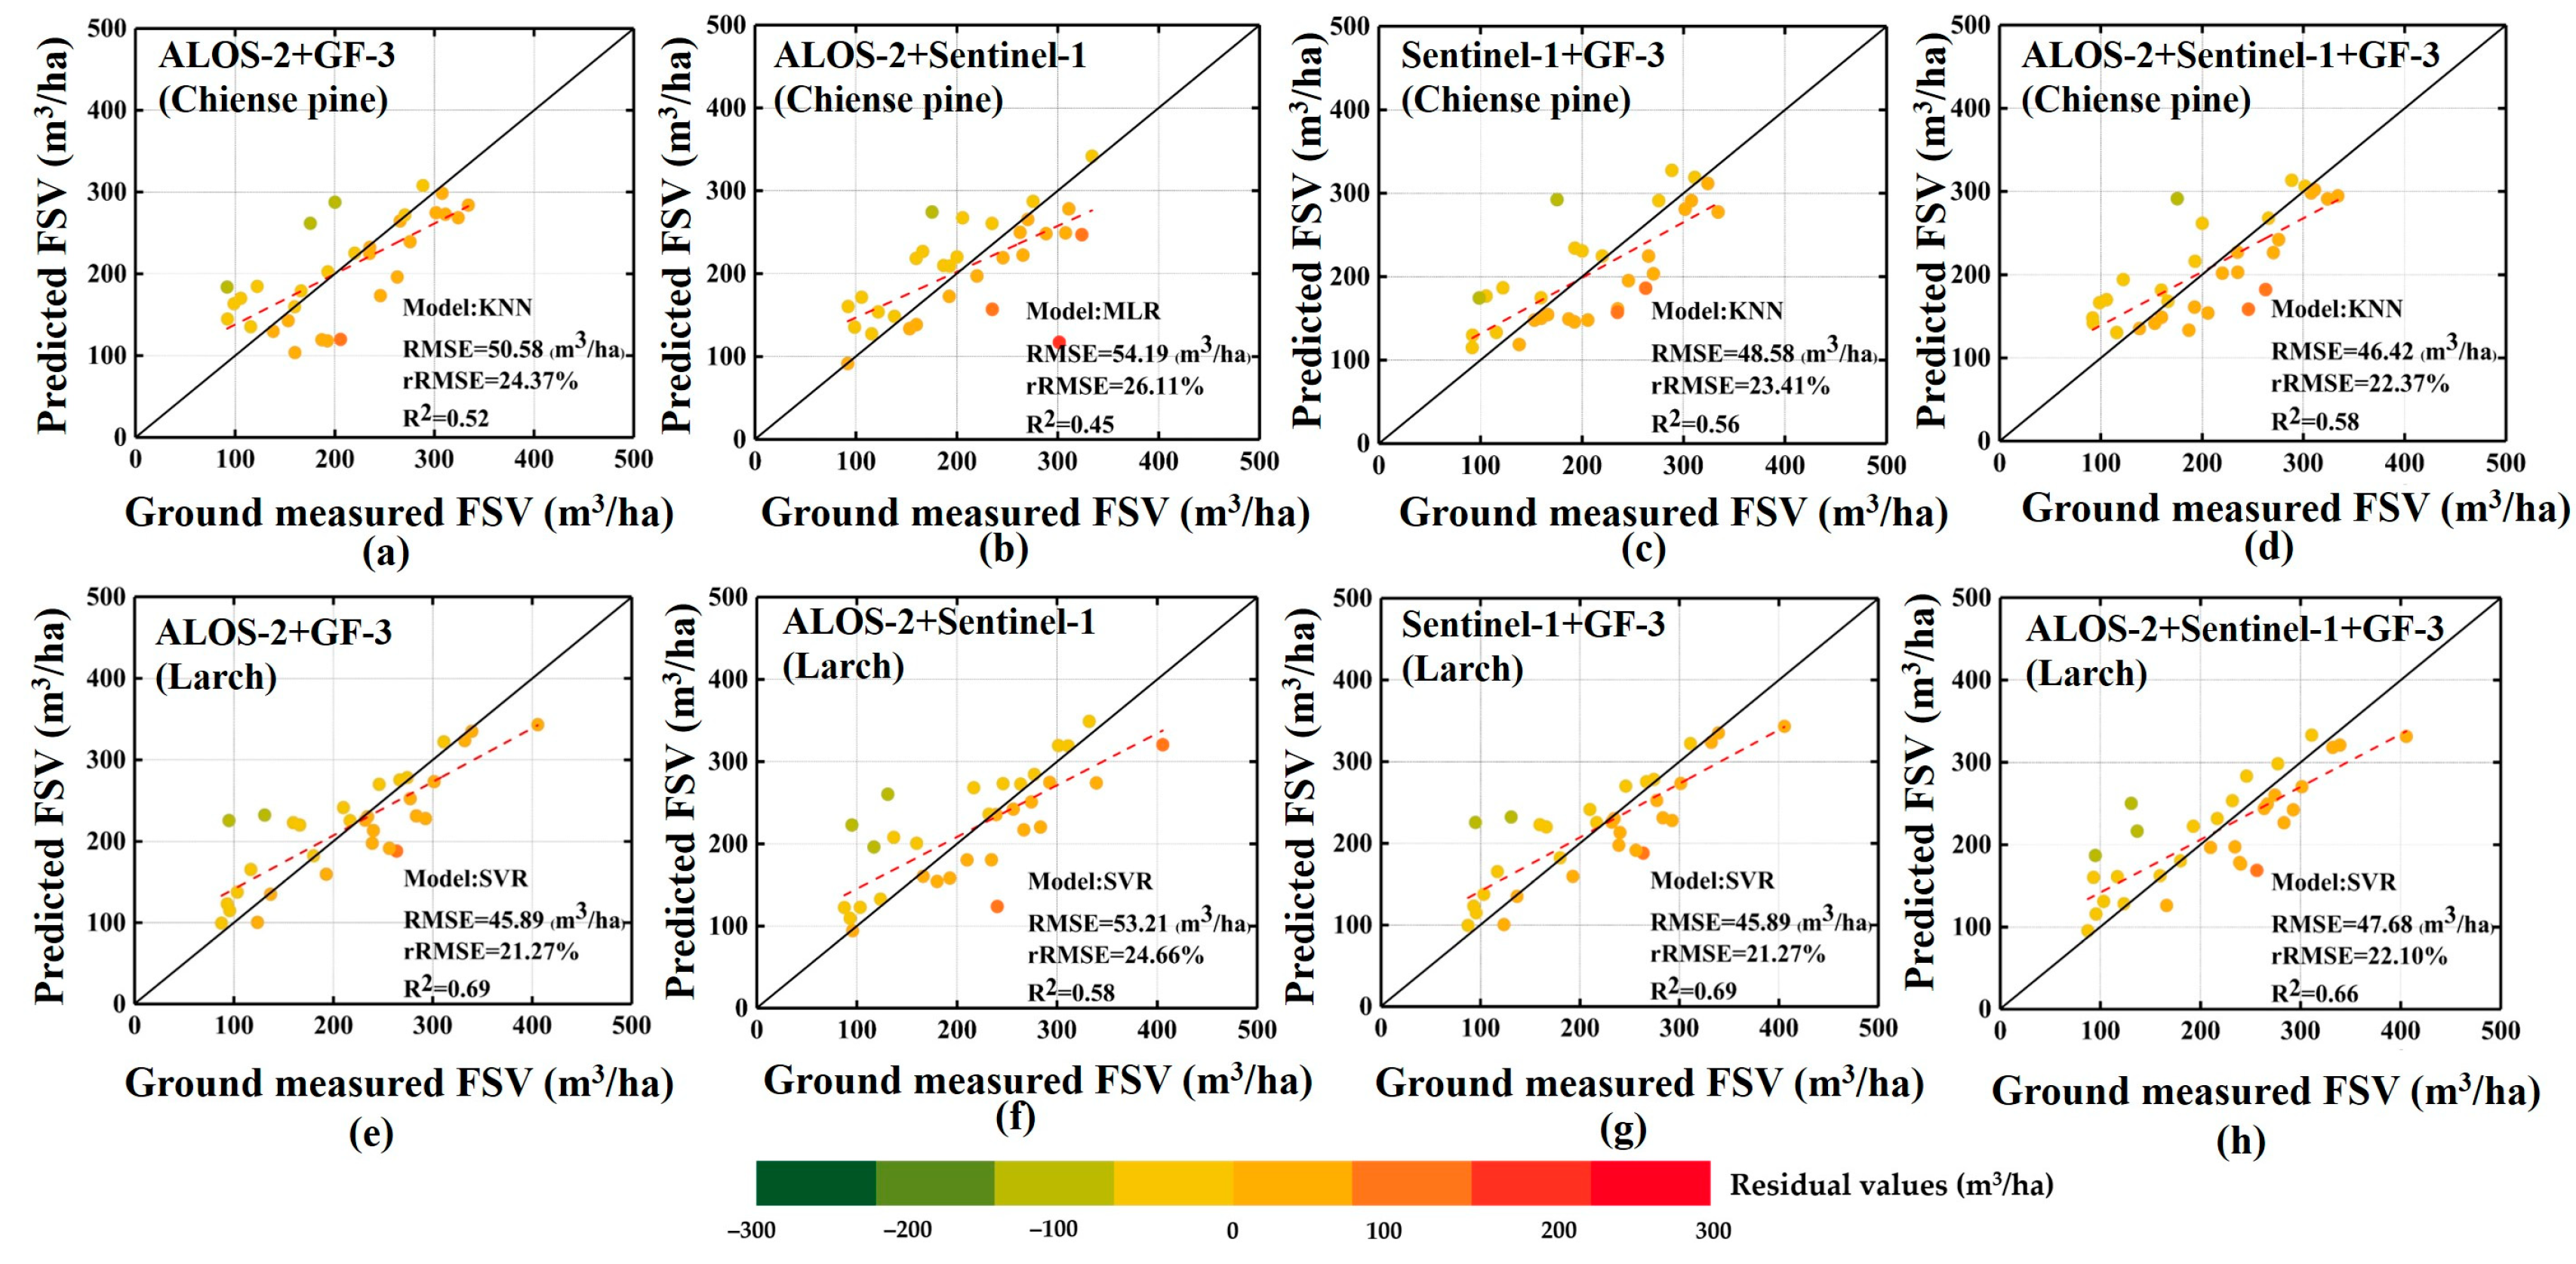
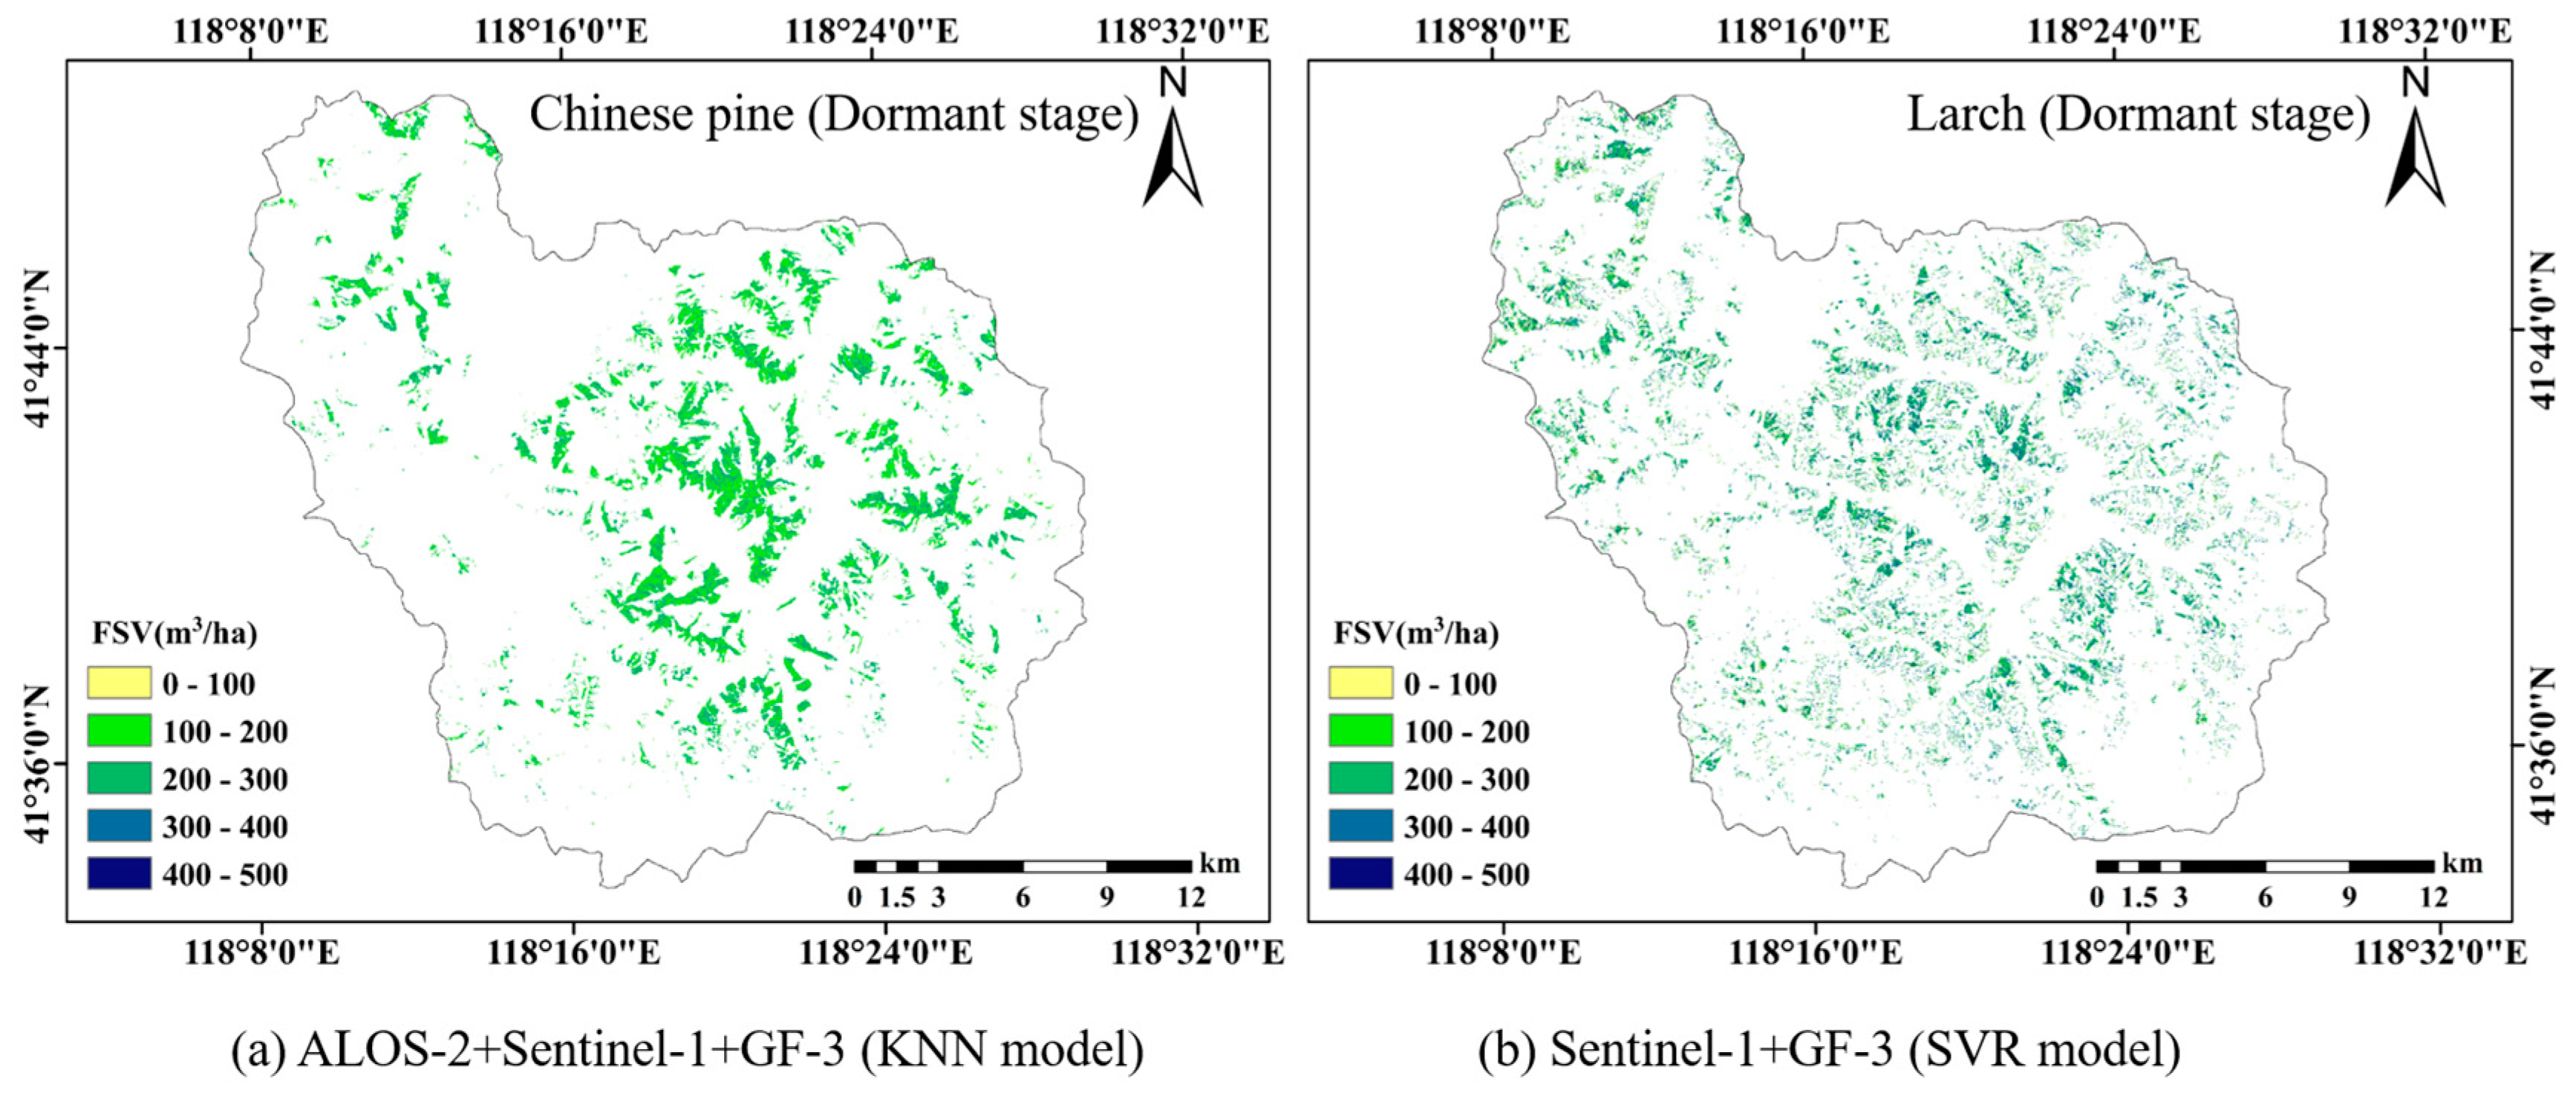
4.4.1. The Mapped FSV Using Multi-Band SAR Images during the Dormant Stage

In this study, four combinations (A + G, A + S, S + G, and A + S + G) were formed, and alternative variable sets were generated through consolidation. Subsequently, estimated FSV was obtained by applying variable selection methods and corresponding models using multi-band SAR data acquired during the dormant stage (Table 5). The results demonstrated that these four combined strategies significantly enhanced the accuracy of mapping FSV in Chinese pine and Larch forests during the dormant stage. The rRMSE values for Chinese pine forests ranged from 22.37% to 29.40%, while for Larch forests, the range was from 21.27% to 34.38%. Moreover, compared with results derived from single data, the most notable improvement was observed in R2 obtained from multi-band data. Moreover, the optimal results were achieved using an MLR model with A + S + G combination in Chinese pine forests while an SVR model with S + G combination yielded optimal results in Larch forests.
The dual-polarization SAR data from four combined strategies were utilized to estimate the optimal results during the dormant stage, followed by plotting scatter and residual plots between predicted and measured values (Figure 7). The findings demonstrated that using multi-band SAR data with four combination strategies improved FSV mapping precision compared to single-source dual-polarization SAR data. This improvement was primarily observed in significantly mitigating both overestimation and underestimation of samples, while substantially increasing the saturation levels of FSV.

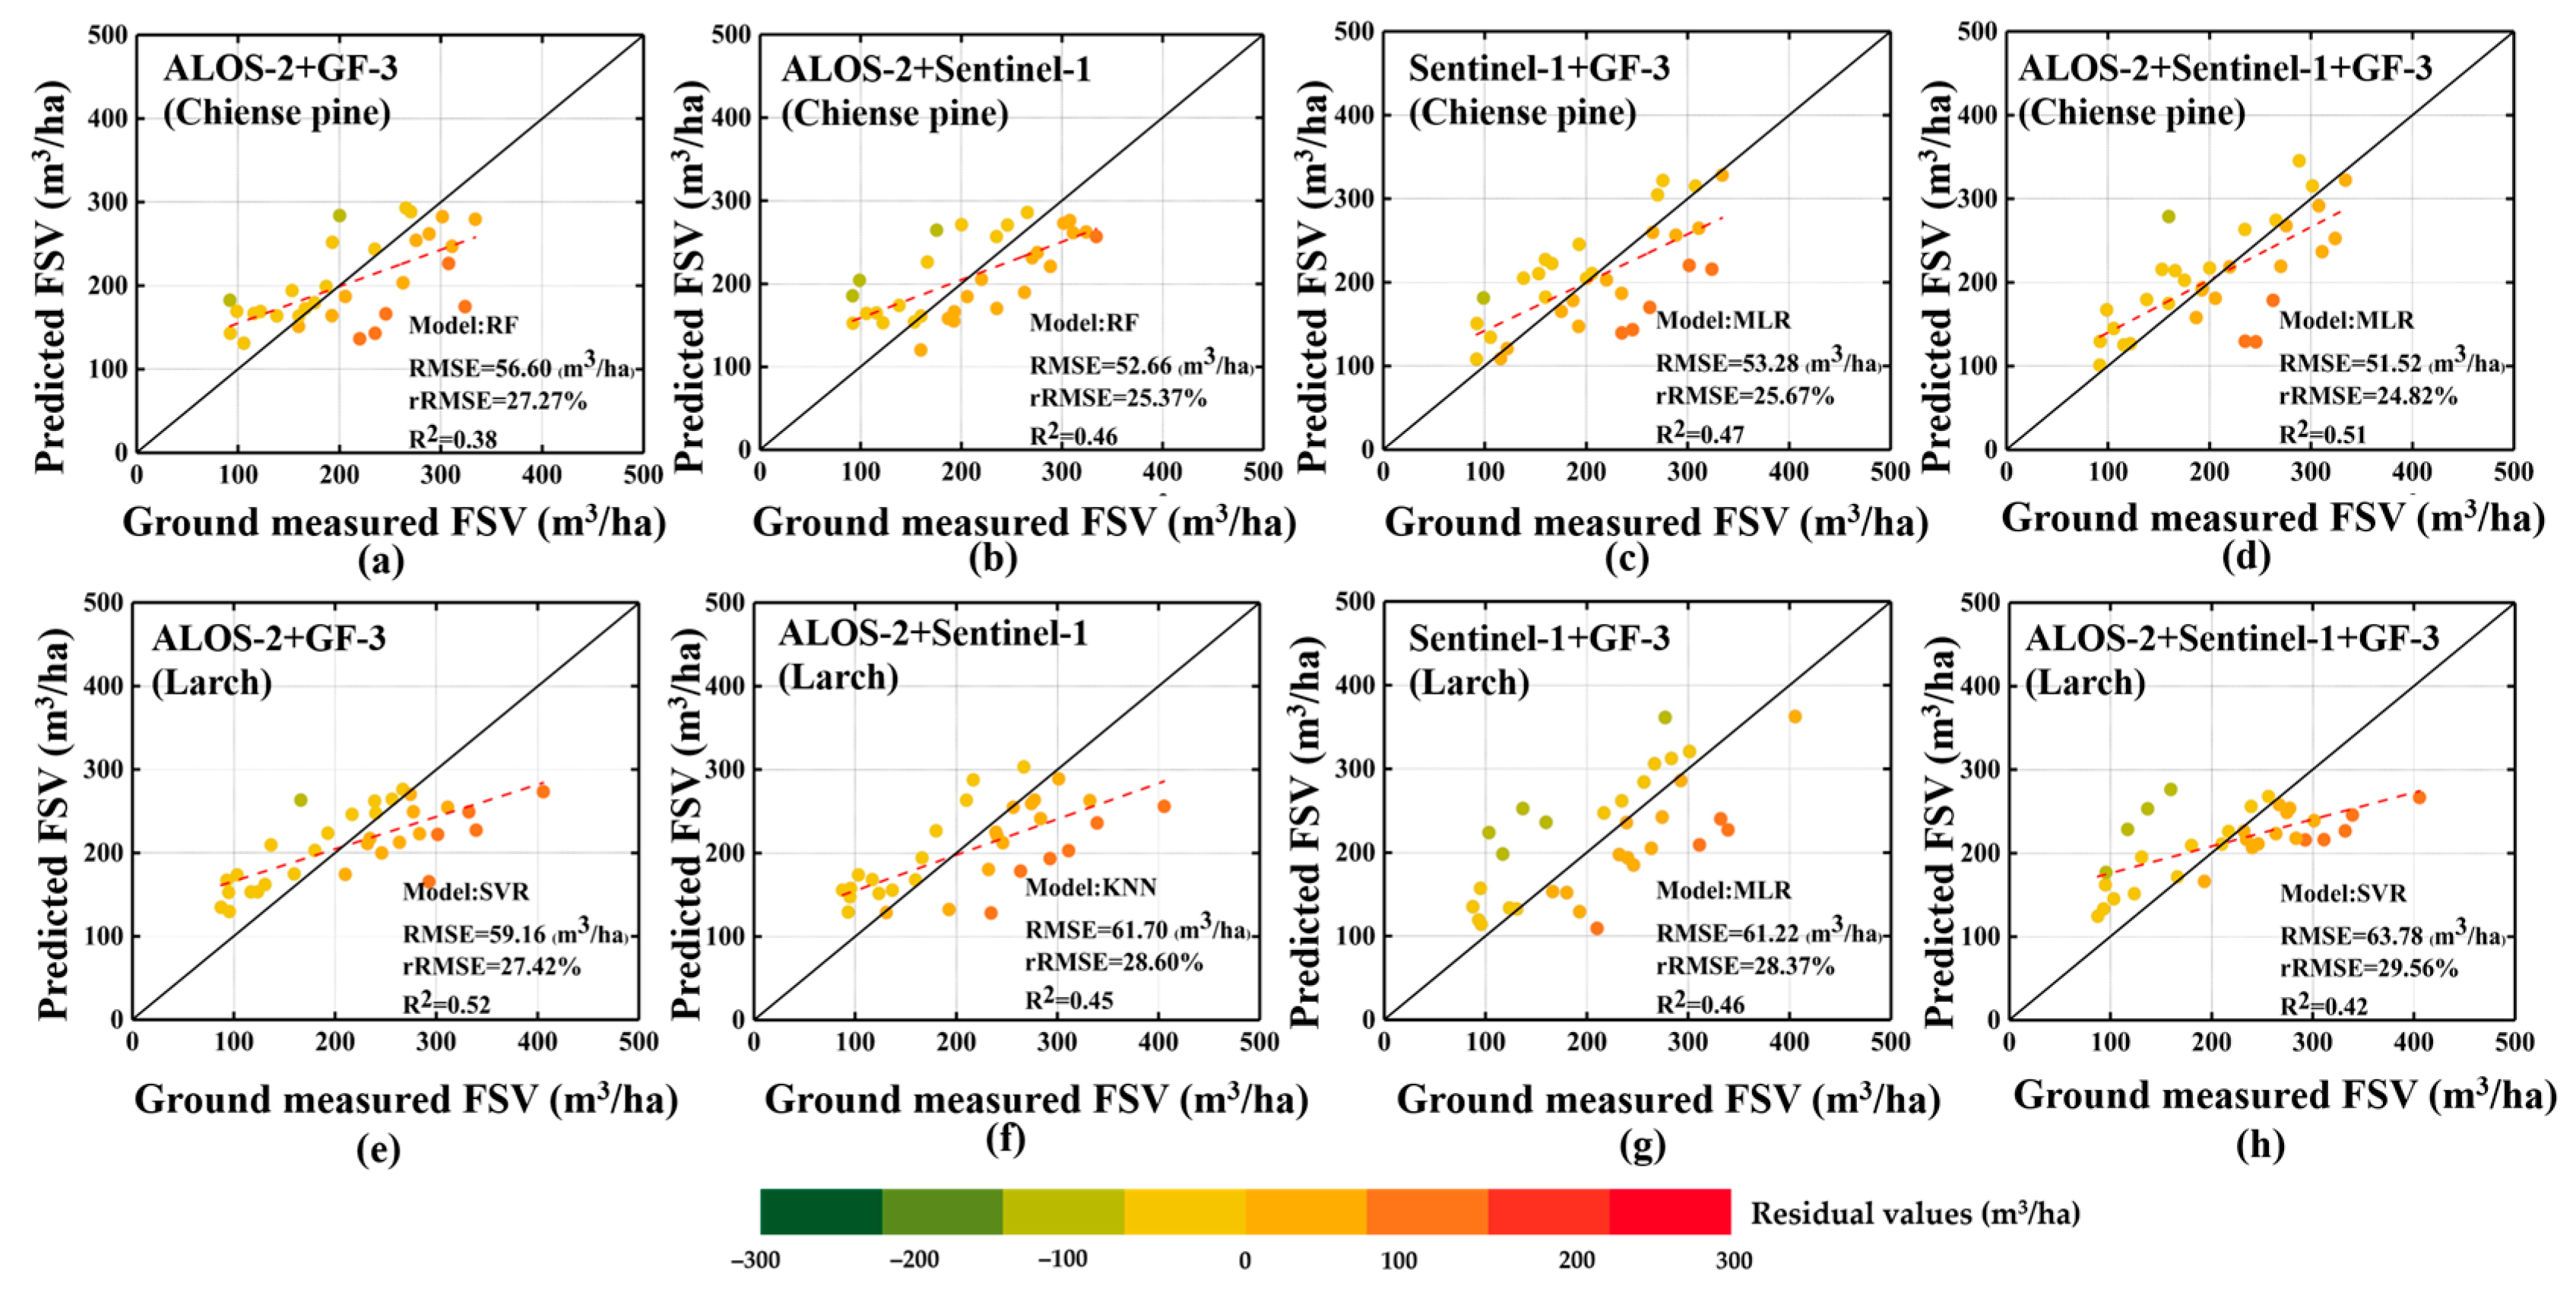
4.4.2. The Mapped FSV Using Multi-Band Images Acquired in the Growth Stage

For the dual-polarization SAR images acquired during the growth stage, four combinations were also formed to map FSV, and the results of these combinations were also obtained from similar variable selection methods and models (Table 6). The rRMSE values for these four combinations ranged from 24.82%% to 30.30% for Chinese pine forests and from 27.42% to 36.03% for Larch forests. Moreover, compared with results obtained from single-band data, the most notable improvement was also observed in R2 obtained from multi-band combination data. The results were consistent with those obtained during the dormant stage. It is inferred that the integration of multi-band dual-polarization SAR images can compensate for the limitations of single-band data in representing forest structure information and enhance the reliability of results.
The accuracy of FSV has been significantly improved through the combination of multiple bands, surpassing the results obtained from single-band data. However, when combining growth period data, the reliability of estimating FSV using combined multi-band data is notably lower compared to that achieved with combined multi-band data acquired during the dormant stage. Therefore, it can be inferred that the estimation accuracy of FSV obtained from combined multi-band data is more closely related to the phenology stages.
Additionally, scatterplots and residual errors between ground-measured and predicted FSV were presented to evaluate the performance of combined datasets (Figure 8). Compared to results obtained from multi-band data acquired during the dormant stage, saturation phenomena were observed for all models, particularly for samples with high FSV values. This suggests that SAR signals primarily capture forest structure information based on scattering characteristics of internal structures rather than the surface properties of canopies. Consequently, during periods of vigorous growth, a closed canopy’s width does not facilitate retrieval of stand structure parameters using SAR signals. The FSV map of the study area was ultimately generated from the optimal models (Figure 9). Specifically, the KNN model was used with multi-band dual-polarimetric SAR data (A + S + G) acquired during the dormant stage to obtain the FSV map of Chinese pine forests, while SVR was employed with multi-band dual-polarimetric SAR data (A + G) also acquired during the dormant stage to derive the FSV map of Larch forests.

5. Discussion

5.1. Analyzing the Correlations between Variables and FSV between the Growth and Dormant Stages

Improving FSV mapping precision requires extracting significant variables related to forest parameters. Previous studies show that the correlation between FSV and dual-polarization SAR variables is highly affected by wavelengths and polarimetric modes [39,40,41,42]. The longer wavelength of the L-band compared to the C-band allows for stronger penetration for the forest, enabling the capture of information primarily derived from branches and trunks [43,44]. Consequently, backscattering coefficients derived from ALOS-2 SAR data surpass those obtained from GF-3 and Sentinel-1 data (Figure 3). Conversely, C-band polarized SAR data predominantly reflects scattering information originating from the forest canopy [45]. Additionally, different polarization modes exhibit varying sensitivities towards forest parameters [46,47]. Specifically, co-polarization and cross-polarization offer distinct insights into forest structure characteristics [48,49]. In dual-polarization SAR data, co-polarization generally yields higher backscattered energy than cross-polarization (Figure 3).
In comparison to deciduous forests (Larch), evergreen forests (Chinese pine) exhibit greater seasonal variability. This study primarily focuses on the disparity in backscattering energy observed in Chinese pine and Larch forests, which is predominantly influenced by the penetration capability associated with wavelengths, including GF-3, Sentinel-1, and ALOS-2 SAR data. During the dormant stage, distinguishing between Chinese Pine forests and Larch forests mainly relies on canopy depth. Specifically, the difference in backscattered energy between dual-polarization ALOS-2 and GF-3 data diminishes for leafless Larch stands during dormancy. The influence of penetrating force weakens across all three SAR datasets while the polarization mode emerges as a primary factor influencing backscattered energy. For evergreen forests, the penetration capability of the SAR signal remains the principal determinant affecting backscattering energy across all three SAR datasets. Consequently, Pearson correlation coefficients of various polarization modes acquired during the dormant stage are mostly larger than those acquired during the growth stage (Figure 10). Due to seasonal changes’ impact, this distinction becomes more pronounced in Larch forests.
Additionally, the changes in the forest growth process also affect the correlation between FSV and polarization variables extracted from the growth stage and dormant stage. During the growth stage of Chinese pine, the correlation between variables derived from GF-3 data and FSV exhibited a higher degree of association compared to that of Sentinel-1 and ALOS-2 (Figure 11a), and therefore, the accuracy of GF-3 in mapping FSV surpassed that of Sentinel-1 and ALOS-2, with Sentinel-1 obtaining the lowest estimation accuracy (Table 4). During the dormant stage, variables extracted from Sentinel-1 data demonstrated stronger correlations than the variables extracted from ALOS-2 and GF-3 data (Figure 11c). In Larch forests, the difference in correlation between the variables extracted from C-band and L-band SAR data and FSV is more significant during the growth and dormant stages (Figure 11b,d), thereby directly influencing the disparity in FSV estimation accuracy. These results also indicate that microwave signal and sensitivity to FSV are contingent upon wavelength and polarization mode, rather than being influenced by the forest’s growth state. Even during dormancy, SAR data remains better suited for estimating forest structure parameters.

5.2. The Contributions of Multi-Bands Combination

The combination of multi-source SAR data can significantly enhance the reliability of FSV estimation [15,50]. The improvement in accuracy is closely associated with the combination strategy in SAR data, forest types, and phenological factors [51,52,53,54]. In this study, the results of mapping FSV demonstrated that compared to single-band dual-polarimetric SAR data, the results obtained from multi-band dual-polarimetric SAR data exhibit a substantial enhancement in accuracy (Table 5 and Table 6). The results also confirmed the considerable potential of combining dual-polarization SAR data with various bands to delay saturation levels (Figure 7 and Figure 8).
Furthermore, the accuracy of combined SAR data for mapping FSV depends not only on the combination strategy but also on the growth state of forests (Figure 12). The reliability of inverting FSV using combined SAR data during the dormant stage was found to be higher than during the growth stage. Employing four different combination strategies significantly improved the estimation reliability of FSV, and the determination coefficient (R2) is the most significant improvement in the accuracy index. Moreover, it was noted that the combination of various bands and polarization modes exhibited promise in addressing delay saturation levels while also minimizing overestimation errors. Additionally, considering seasonal variations in forests, this study elucidated differences in combined SAR data for mapping FSV during growth and dormant stages, providing a promising approach for mapping FSV using dual-polarization SAR with diverse frequency bands.

6. Conclusions

To clarify the influence of phenological factors on mapping FSV, GF-3, Sentinel-1, and ALOS-2 images with dual polarization modes were acquired during the growth and dormant stages in a northern evergreen coniferous forest (Chinese pine) and a deciduous coniferous forest (Larch) in this study. The Sequential Forward Selection method was employed along with four models (KNN, MLR, RF, and SVR) to select optimal variable sets from single and multi-band alternative sets for FSV mapping. The results revealed that Pearson correlation coefficients obtained during the dormant stage were generally higher than those acquired during the growth stage. Moreover, the rRMSE values for the four multi-band combinations (A + G, A + S, S + G, and A + S + G) ranged from 22.37% to 29.40% for Chinese pine forests and from 21.27% to 34.38% for Larch forests. Notably improved determination coefficients (R2) were observed when using multi-band data. Additionally, combining different bands and polarization modes demonstrated potential in mitigating the delay saturation phenomenon while reducing overestimation errors. Moreover, considering seasonal variations in forests, this study highlighted differences in combined SAR data for mapping FSV during both growth and dormant stages, thus providing a promising approach utilizing dual-polarization SAR with various bands and polarization modes.

Author Contributions

Conceptualization, J.L., H.Z. and Z.Y.; methodology, J.L. and H.Z.; software, T.Z. and X.L.; validation, H.Z. and T.Z.; formal analysis, J.L. and H.Z.; investigation, J.L., Z.Y. and T.Z.; resources, J.L. and X.L.; data curation, J.L. and Z.Y.; writing—original draft preparation, J.L.; writing—review and editing, J.L. and Z.Y.; visualization, J.L., H.Z., Z.Y., T.Z. and X.L.; supervision, J.L. and Z.Y.; project administration, J.L. and Z.Y.; funding acquisition, J.L. All authors have read and agreed to the published version of the manuscript.

Funding

This research was funded by the Excellent Youth Project of the Scientific Research Foundation of the Hunan Provincial Department of Education (21B0246) and supported by the National Natural Science Foundation of China (32171784).

Data Availability Statement

The observed FSV data from the sample plots and the spatial distribution data of forest resources presented in this study are available upon request from the corresponding author. Those data are not publicly available due to privacy and confidentiality reasons. The GF-3 images are available from China Centre for Resources Satellite Data and Application website at http://www.sasclouds.com/chinese/normal/ (accessed on 18 March and 5 August 2017); The Sentinel-1 images are available from the European Space Agency (https://www.esa.int/, accessed on 14 August 2017); Japan Aerospace Exploration Agency for the acquired ALOS-2 PALSAR-2 images (https://alos-pasco.com/en/alos-2/, accessed on 26 August 2017) in this study.

Conflicts of Interest

The authors declare no conflicts of interest.

References

  1. Jiang, F.; Kutia, M.; Sarkissian, A.J.; Lin, H.; Long, J.; Sun, H.; Wang, G. Estimating the growing stem volume of coniferous plantations based on random forest using an optimized variable selection method. Sensors 2020, 20, 7248. [Google Scholar] [CrossRef] [PubMed]
  2. Shi, L.; Liu, S. Methods of estimating forest biomass: A review. Biomass Vol. Estim. Valorization Energy 2017, 10, 65733. [Google Scholar] [CrossRef]
  3. White, J.C.; Coops, N.C.; Wulder, M.A.; Vastaranta, M.; Hilker, T.; Tompalski, P. Remote sensing technologies for enhancing forest inventories: A review. Can. J. Remote Sens. 2016, 42, 619–641. [Google Scholar] [CrossRef]
  4. Franceschetti, G.; Lanari, R. Synthetic Aperture Radar Processing; CRC Press: Boca Raton, FL, USA, 2018. [Google Scholar] [CrossRef]
  5. Nuthammachot, N.; Askar, A.; Stratoulias, D.; Wicaksono, P. Combined use of Sentinel-1 and Sentinel-2 data for improving above-ground biomass estimation. Geocarto Int. 2022, 37, 366–376. [Google Scholar] [CrossRef]
  6. Patenaude, G.; Milne, R.; Dawson, T.P. Synthesis of remote sensing approaches for forest carbon estimation: Reporting to the Kyoto Protocol. Environ. Sci. Policy 2005, 8, 161–178. [Google Scholar] [CrossRef]
  7. Shao, Z.; Zhang, L. Estimating Forest aboveground biomass by combining optical and SAR data: A case study in Genhe, Inner Mongolia, China. Sensors 2016, 16, 834. [Google Scholar] [CrossRef]
  8. Thies, B.; Bendix, J. Satellite based remote sensing of weather and climate: Recent achievements and future perspectives. Meteorol. Appl. 2011, 18, 262–295. [Google Scholar] [CrossRef]
  9. Xu, Q.; Dong, X.; Li, W. Integrated space-air-ground early detection, monitoring and warning system for potential catastrophic geohazards. Geomat. Inf. Sci. Wuhan Univ. 2019, 44, 957–966. [Google Scholar] [CrossRef]
  10. Berninger, A.; Lohberger, S.; Zhang, D.; Siegert, F. Canopy height and above-ground biomass retrieval in tropical forests using multi-pass X-and C-band Pol-InSAR data. Remote Sens. 2019, 11, 2105. [Google Scholar] [CrossRef]
  11. Kurum, M.; Kim, S.B.; Akbar, R.; Cosh, M.H. Surface Soil Moisture Retrievals Under Forest Canopy for L-Band SAR Observations Across a Wide Range of Incidence Angles by Inverting a Physical Scattering Model. IEEE J. Sel. Top. Appl. Earth Obs. Remote Sens. 2020, 14, 1741–1753. [Google Scholar] [CrossRef]
  12. Santoro, M.; Cartus, O.; Fransson, J.E.S.; Wegmüller, U. Complementarity of X-, C-, and L-band SAR backscatter observations to retrieve forest stem volume in boreal forest. Remote Sens. 2019, 11, 1563. [Google Scholar] [CrossRef]
  13. Antropov, O.; Rauste, Y.; Häme, T.; Praks, J. Polarimetric ALOS PALSAR time series in mapping biomass of boreal forests. Remote Sens. 2017, 9, 999. [Google Scholar] [CrossRef]
  14. Huang, X.; Ziniti, B.; Torbick, N.; Ducey, M.J. Assessment of forest above ground biomass estimation using multi-temporal C-band Sentinel-1 and Polarimetric L-band PALSAR-2 data. Remote Sens. 2018, 10, 1424. [Google Scholar] [CrossRef]
  15. Shi, J.; Zhang, W.; Marino, A.; Zeng, P.; Ji, Y.; Zhao, H.; Huang, G.; Wang, M. Forest total and component biomass retrieval via GA-SVR algorithm and quad-polarimetric SAR data. Int. J. Appl. Earth Obs. Geoinf. 2023, 118, 103275. [Google Scholar] [CrossRef]
  16. Ji, K.; Wu, Y. Scattering Mechanism Extraction by a Modified Cloude-Pottier Decomposition for Dual Polarization SAR. Remote Sens. 2015, 7, 7447–7470. [Google Scholar] [CrossRef]
  17. Van Zyl, J.J.; Arii, M.; Kim, Y. Requirements for model-based polarimetric decompositions. In Proceedings of the 7th European Conference on Synthetic Aperture Radar, Friedrichshafen, Germany, 2–5 June 2008; pp. 1–4. [Google Scholar]
  18. Freeman, A.; Durden, S.L. A three-component scattering model for polarimetric SAR data. IEEE Trans. Geosci. Remote Sens. 1998, 36, 963–973. [Google Scholar] [CrossRef]
  19. Dobson, M.C.; Ulaby, F.T.; Pierce, L.E.; Sharik, T.L.; Bergen, K.M.; Kellndorfer, J.; Kendra, J.R.; Li, E.; Lin, Y.C.; Nashashibi, A.; et al. Estimation of forest biophysical characteristics in Northern Michigan with SIR-C/X-SAR. IEEE Trans. Geosci. Remote Sens. 1995, 33, 877–895. [Google Scholar] [CrossRef]
  20. Ranson, K.J.; Sun, G. Effects of environmental conditions on boreal forest classification and biomass estimates with SAR. IEEE Trans. Geosci. Remote Sens. 2000, 38, 1242–1252. [Google Scholar] [CrossRef]
  21. Luo, Y.; Liu, Y.; Huang, H.; Yu, L.; Ren, L. Pathway and method of forest health assessment using remote sensing technology. J. Beijing For. Univ. 2021, 43, 1–13. [Google Scholar] [CrossRef]
  22. Bjerreskov, K.S.; Nord-Larsen, T.; Fensholt, R. Classification of nemoral forests with fusion of multi-temporal sentinel-1 and 2 data. Remote Sens. 2021, 13, 950. [Google Scholar] [CrossRef]
  23. Fang, G.; Yu, H.; Fang, L.; Zheng, X. Synergistic Use of Sentinel-1 and Sentinel-2 Based on Different Preprocessing for Predicting Forest Aboveground Biomass. Forests 2023, 14, 1615. [Google Scholar] [CrossRef]
  24. Yang, Y.; Yang, G.; Zhao, H. Estimation of Forest Volume in Karst Mountain Ecosystem with Synthetic Aperture Radar Remote Sensing technology. For. Resour. Manag. 2018, 4, 100. [Google Scholar] [CrossRef]
  25. Yu, Y.; Saatchi, S. Sensitivity of L-band SAR backscatter to aboveground biomass of global forests. Remote Sens. 2016, 8, 522. [Google Scholar] [CrossRef]
  26. Ackermann, N. Growing Stock Volume Estimation in Temperate Forested Areas Using a Fusion Approach with SAR Satellites Imagery; Springer: Berlin/Heidelberg, Germany, 2014. [Google Scholar] [CrossRef]
  27. Cooke, J.E.K.; Eriksson, M.E.; Junttila, O. The dynamic nature of bud dormancy in trees: Environmental control and molecular mechanisms. Plant Cell Environ. 2012, 35, 1707–1728. [Google Scholar] [CrossRef] [PubMed]
  28. Janssen, T.; Van Der Velde, Y.; Hofhansl, F.; Luyssaert, S.; Naudts, K.; Driessen, B.; Fleischer, K. Drought effects on leaf fall, leaf flushing and stem growth in the Amazon forest: Reconciling remote sensing data and field observations. Biogeosciences 2021, 18, 4445–4472. [Google Scholar] [CrossRef]
  29. Koyama, C.N.; Watanabe, M.; Hayashi, M.; Ogawa, T.; Shimada, M. Mapping the spatial-temporal variability of tropical forests by ALOS-2 L-band SAR big data analysis. Remote Sens. Environ. 2019, 233, 111372. [Google Scholar] [CrossRef]
  30. Li, D.; Wang, C.; Hu, Y.; Liu, S. General review on remote sensing-based biomass estimation. Geomat. Inf. Sci. Wuhan Univ. 2012, 37, 631–635. [Google Scholar] [CrossRef]
  31. Hao, M.; Feng, J.M.; Feng, Z.; Jiang, G.; Sang, A.; Wu, S.; Hua, W.; Wang, Y. Variation characteristics and relationship analysis of ground temperature and precipitation in Chifeng City, Inner Mongolia from 1961 to 2020. J. Inn. Mong. Univ. (Nat. Sci. Ed.) 2022, 53, 194–202. [Google Scholar] [CrossRef]
  32. Zhang, T.; Lin, H.; Long, J.; Zhang, M.; Liu, Z. Analyzing the saturation of growing stem volume based on ZY-3 stereo and multispectral images in planted coniferous forest. IEEE J. Sel. Top. Appl. Earth Obs. Remote Sens. 2021, 15, 50–61. [Google Scholar] [CrossRef]
  33. Xu, X.; Lin, H.; Liu, Z.; Ye, Z.; Li, X.; Long, J. A combined strategy of improved variable selection and ensemble algorithm to map the growing stem volume of planted coniferous forest. Remote Sens. 2021, 13, 4631. [Google Scholar] [CrossRef]
  34. Ye, Z.; Long, J.; Zheng, H.; Liu, Z.; Zhang, T.; Wang, Q. Mapping Growing Stem Volume Using Dual polarization GaoFen-3 SAR Images in Evergreen Coniferous Forests. Remote Sens. 2023, 15, 2253. [Google Scholar] [CrossRef]
  35. Dai, X.; Chen, S.; Jia, K.; Jiang, H.; Sun, Y.; Li, D.; Zheng, Q.; Huang, J. A decision-tree approach to identifying paddy rice lodging with multiple pieces of polarization information derived from Sentinel-1. Remote Sens. 2022, 15, 240. [Google Scholar] [CrossRef]
  36. Shashikant, V.; Mohamed Shariff, A.R.; Wayayok, A.; Kamal, M.R.; Lee, Y.P.; Takeuchi, W. Comparison of field and SAR-derived descriptors in the retrieval of soil moisture from oil palm crops using PALSAR-2. Remote Sens. 2021, 13, 4729. [Google Scholar] [CrossRef]
  37. Periasamy, S. Significance of dual polarimetric synthetic aperture radar in biomass retrieval: An attempt on Sentinel-1. Remote Sens. Environ. 2018, 217, 537–549. [Google Scholar] [CrossRef]
  38. Liao, Z.; He, B.; Quan, X. Potential of texture from SAR tomographic images for forest aboveground biomass estimation. Int. J. Appl. Earth Obs. Geoinf. 2020, 88, 102049. [Google Scholar] [CrossRef]
  39. Cartus, O.; Santoro, M. Exploring combinations of multi-temporal and multi-frequency radar backscatter observations to estimate above-ground biomass of tropical forest. Remote Sens. Environ. 2019, 232, 111313. [Google Scholar] [CrossRef]
  40. Chen, L.; Wang, Y.; Ren, C.; Zhang, B.; Wang, Z. Assessment of multi-wavelength SAR and multispectral instrument data for forest aboveground biomass mapping using random forest kriging. For. Ecol. Manag. 2019, 447, 12–25. [Google Scholar] [CrossRef]
  41. Sinha, S.; Jeganathan, C.; Sharma, L.K.; Nathawat, M.S. A review of radar remote sensing for biomass estimation. Int. J. Environ. Sci. Technol. 2015, 12, 1779–1792. [Google Scholar] [CrossRef]
  42. Sinha, S.; Santra, A.; Sharma, L.K.; Das, A.K.; Jeganathan, C.; Mohan, S.; Mitra, S.S.; Nathawat, M.S. Responses of Multi-Frequency Remote Sensing to Forest Biomass. Adv. Remote Sens. Nat. Resour. Monit. 2021, 58–80. [Google Scholar] [CrossRef]
  43. Kumar, A.; Kishore, B.; Saikia, P.; Deka, J.; Bharali, S.; Singha, L.B.; Tripathi, O.P.; Khan, M.L. Tree diversity assessment and above ground forests biomass estimation using SAR remote sensing: A case study of higher altitude vegetation of North-East Himalayas, India. Phys. Chem. Earth Parts A/B/C 2019, 111, 53–64. [Google Scholar] [CrossRef]
  44. Papathanassiou, K.P.; Cloude, S.R.; Pardini, M.; Quiñones, M.J.; Hoekman, D.; Ferro-Famil, L.; Goodenough, D.; Chen, H.; Tebaldini, S.; Neumann, M.; et al. Forest applications. In Polarimetric Synthetic Aperture Radar: Principles and Application; Springer: Cham, Switzerland, 2021; pp. 59–117. [Google Scholar] [CrossRef]
  45. Soudani, K.; Delpierre, N.; Berveiller, D.; Hmimina, G.; Vincent, G.; Morfin, A.; Dufrêne, É. Potential of C-band Synthetic Aperture Radar Sentinel-1 time-series for the monitoring of phenological cycles in a deciduous forest. Int. J. Appl. Earth Obs. Geoinf. 2021, 104, 102505. [Google Scholar] [CrossRef]
  46. Forkuor, G.; Zoungrana JB, B.; Dimobe, K.; Ouattara, B.; Vadrevu, K.P.; Tondoh, J.E. Above-ground biomass mapping in West African dryland forest using Sentinel-1 and 2 datasets-A case study. Remote Sens. Environ. 2020, 236, 111496. [Google Scholar] [CrossRef]
  47. Musthafa, M.; Singh, G. Improving forest above-ground biomass retrieval using multi-sensor L-and C-Band SAR data and multi-temporal spaceborne LiDAR data. Front. For. Glob. Chang. 2022, 5, 822704. [Google Scholar] [CrossRef]
  48. Godinho Cassol, H.L.; De Oliveira ECruz De Aragão, L.E.; Moraes, E.C.; De Brito Carreiras, J.M.; Shimabukuro, Y.E. Quad-pol Advanced Land Observing Satellite/Phased Array L-band Synthetic Aperture Radar-2 (ALOS/PALSAR-2) data for modelling secondary forest above-ground biomass in the central Brazilian Amazon. Int. J. Remote Sens. 2021, 42, 4985–5009. [Google Scholar] [CrossRef]
  49. Solanki, J.B.; Kumari, R.; Das, A.K.; Maurya, P.; Lele, N. Retrieval of Mangrove Forest Properties Using Synthetic Aperture Radar. In Advances in Remote Sensing for Forest Monitoring; Wiley Online Library: Hoboken, NJ, USA, 2022; pp. 107–125. [Google Scholar] [CrossRef]
  50. Fu, B.; Xie, S.; He, H.; Zuo, P.; Sun, J.; Liu, L.; Huang, L.; Fan, D.; Gao, E. Synergy of multi-temporal polarimetric SAR and optical image satellite for mapping of marsh vegetation using object-based random forest algorithm. Ecol. Indic. 2021, 131, 108173. [Google Scholar] [CrossRef]
  51. Khati, U.; Lavalle, M.; Shiroma, G.H.X.; Meyer, V.; Chapman, B. Assessment of forest biomass estimation from dry and wet SAR acquisitions collected during the 2019 UAVSAR AM-PM campaign in southeastern United States. Remote Sens. 2020, 12, 3397. [Google Scholar] [CrossRef]
  52. Liu, Y.; Gong, W.; Xing, Y.; Hu, X.; Gong, J. Estimation of the forest stand mean height and aboveground biomass in Northeast China using SAR Sentinel-1B, multispectral Sentinel-2A, and DEM imagery. ISPRS J. Photogramm. Remote Sens. 2019, 151, 277–289. [Google Scholar] [CrossRef]
  53. Van Pham, M.; Pham, T.M.; Du, Q.V.V.; Bui, Q.T.; Van Tran, A.; Pham, H.M.; Nguyen, T.N. Integrating Sentinel-1A SAR data and GIS to estimate aboveground biomass and carbon accumulation for tropical forest types in Thuan Chau district, Vietnam. Remote Sens. Appl. Soc. Environ. 2019, 14, 148–157. [Google Scholar] [CrossRef]
  54. Wan, X.; Li, Z.; Chen, E.; Zhao, L.; Zhang, W.; Xu, K. Forest aboveground biomass estimation using multi-features extracted by fitting vertical backscattered power profile of tomographic SAR. Remote Sens. 2021, 13, 186. [Google Scholar] [CrossRef]
Figure 1. The maps of the study area (a) and the distribution maps of samples (b).
Forests 15 01660 g001
Figure 2. The map of the Digital Elevation Model (DEM).
Forests 15 01660 g002
Figure 3. The scatterplots between forest FSV and backscattering coefficients of different polarization modes in growth stages (ad) and dormant stages (eh).
Forests 15 01660 g003
Figure 4. Plots of Pearson correlation coefficients between FSV and various variables (derived variables and texture variables), (a,b,e,f) presents the derived variables (From X1 to X18), and (c,d,g,h) presents the texture variables (T1 to T8 are extracted from backscattering coefficients of co-polarization, T9 to T18 are extracted from backscattering coefficients of cross-polarization).
Forests 15 01660 g004
Figure 5. The plots between ground measured and predicted FSV obtained from optimal models using single-band dual polarization SAR images acquired in a dormant stage. (ac) show the FSV estimation results for Chinese pine, While (df) for Larch.
Forests 15 01660 g005
Figure 6. The plots between measured and predicted FSV derived from optimal models using single data acquired in the growth stage. (af) present the FSV estimation results for Chinese pine and Larch, respectively.
Forests 15 01660 g006
Figure 7. The plots between measured and predicted FSV by optimal models using multi-band dual-polarization SAR images acquired during the dormant stage. (ad) show estimation results for Chinese pine FSV; (eh) show results for Larch FSV.
Forests 15 01660 g007
Figure 8. The plots between measured and predicted values obtained by optimal models using multi-band dual-polarization SAR images acquired during the growth stage. (ad) show the estimation results for Chinese pine FSV, (eh) for Larch FSV.
Forests 15 01660 g008
Figure 9. The maps of FSV obtained from optimal models using multi-band data acquired during the dormant stage, respectively.
Forests 15 01660 g009
Figure 10. Radar charts of Pearson correlation coefficients between FSV and backscattering coefficients of different polarizations extracted from single-band SAR images during growth and dormant stages.
Forests 15 01660 g010
Figure 11. Plots of sorted Pearson correlation coefficient between the top 20 variables extracted from single dual-polarization SAR data and FSV. (a,b) show the correlation between variables and Chinese pine FSV, (c,d) show the correlation for Larch FSV, during the growth and dormant stages.
Forests 15 01660 g011
Figure 12. The histograms of accuracy indices in mapping FSV using single and multi-band polarimetric SAR data during growth and dormant stages in planted forests.
Forests 15 01660 g012
Table 1. Three types of dual-polarization SAR data acquired within the growth and dormant stages.
Growth PhasesBandSatellitesAcquired DatePolarization
Modes
Incidence AngleSpatial Resolutions
Dormant stageCGF-318 March 2017HH/HV38.57°2.25 m × 3.12 m
C Sentinel-14 March 2017VV/VH39.50°2.32 m × 13.89 m
L ALOS-29 March 2017HH/HV31.41°4.29 m × 3.09 m
Growth stageC GF-35 August 2017HH/HV29.65°2.25 m × 5.31 m
C Sentinel-114 August 2017VV/VH39.49°2.32 m × 13.89 m
L ALOS-226 August 2017HH/HV31.60°4.29 m × 3.09 m
Table 2. The lists of alternative variable sets (growth and dormant stage).
Number Data SourcesSAR ImagesVariable Sets
1Single bandGF-3 (G)Backscattering coefficients, their derived variables, decomposition variables, RVI, and texture variables
2Sentinel-1(S)
3ALOS-2(A)
4Multi-bandA + GVariables obtained from multi-band SAR images
5A + S
6S + G
7A + G + S
Table 3. The evaluation indices of mapped FSV by single SAR data within dormant stage.
SAR
Images
ModelsChinese PineLarch
RMSE
(m3/ha)
rRMSE (%)R2RMSE
(m3/ha)
rRMSE (%)R2
GF-3MLR71.1534.280.1079.6236.900.10
KNN64.8831.260.2077.4435.890.17
SVR58.9028.380.3478.9636.600.16
RF59.8928.850.3169.8032.350.28
Sentinel-1MLR67.3432.450.1488.0140.790.36
KNN49.7923.990.5377.8336.070.14
SVR57.8127.850.3769.3732.150.29
RF58.1828.030.3470.2032.540.26
ALOS-2MLR73.1435.240.1074.1334.360.26
KNN65.4531.540.2675.5535.010.16
SVR64.0930.880.2086.2439.970.18
RF61.6129.690.2768.9531.960.32
Table 4. The evaluation indices of mapped FSV using single data acquired within growth stage.
SAR
Images
ModelsChinese PineLarch
RMSE
(m3/ha)
rRMSE (%)R2RMSE
(m3/ha)
rRMSE (%)R2
GF-3MLR61.4529.610.3976.6235.510.38
KNN62.0129.880.3273.6034.110.25
SVR55.2626.620.4276.2735.350.14
RF59.9326.470.4377.5935.960.10
Sentinel-1MLR70.6734.050.2978.5436.400.10
KNN63.5030.590.2674.5534.550.18
SVR66.8232.200.2473.9634.280.22
RF61.3029.530.2768.8331.900.30
ALOS-2MLR64.0130.840.2477.0235.700.18
KNN66.4732.030.1774.2134.400.21
SVR61.8529.800.3468.9531.950.31
RF57.4027.660.3673.0933.880.23
Table 5. The evaluation indices of estimated FSV using multi-band data acquired within the dormant stage.
SAR
Images
ModelsChinese PineLarch
RMSE
(m3/ha)
rRMSE (%)R2RMSE
(m3/ha)
rRMSE (%)R2
A + GMLR57.5127.710.4274.1834.380.29
KNN50.5824.370.5266.2930.720.35
SVR60.2829.040.3059.0827.380.48
RF61.0129.400.3372.4433.570.21
A + SMLR54.1926.110.4574.1334.360.26
KNN54.7526.380.4469.0331.990.29
SVR60.4529.130.4153.2124.660.58
RF57.4427.670.4269.7232.320.31
S + GMLR54.7526.380.4759.5427.600.53
KNN48.5823.410.5661.7728.630.46
SVR58.2328.040.3445.8921.270.69
RF53.5925.820.4569.3032.120.29
A + S + GMLR52.5825.330.6170.1132.490.29
KNN46.4222.370.5858.2927.020.49
SVR59.7428.780.4147.6822.100.66
RF59.0028.420.3570.7632.800.25
Table 6. The evaluation indices of results using multi-band data acquired during the growth stage.
SAR
Images
ModelsChinese PineLarch
RMSE
(m3/ha)
rRMSE (%)R2RMSE
(m3/ha)
rRMSE (%)R2
A + GMLR58.9928.420.5373.1433.900.53
KNN59.7228.770.3571.1532.980.27
SVR62.8830.300.3159.1627.420.52
RF56.6027.270.3872.7933.740.21
A + SMLR57.5127.710.5763.0929.240.47
KNN57.8827.890.3961.7028.600.45
SVR61.0629.420.3265.8130.500.36
RF52.6625.370.4666.6930.900.35
S + GMLR53.2825.670.4761.2228.370.46
KNN60.6429.220.3677.7436.030.12
SVR60.7229.250.2867.2031.140.34
RF56.6727.300.4069.2632.100.28
A + S + GMLR51.5224.820.5165.2830.260.46
KNN58.9328.400.3477.2635.810.13
SVR59.7128.770.3263.7829.560.42
RF58.5628.210.3564.6729.970.38
Disclaimer/Publisher’s Note: The statements, opinions and data contained in all publications are solely those of the individual author(s) and contributor(s) and not of MDPI and/or the editor(s). MDPI and/or the editor(s) disclaim responsibility for any injury to people or property resulting from any ideas, methods, instructions or products referred to in the content.

