
A Proteomic Study on Seed Germination of Nitraria roborowskii Kom.

1
College of Ecology and Environment, Xinjiang University, Urumqi 830017, China
2
College of Life and Geographic Sciences, Kashi University, Kashi 844006, China
3
Key Laboratory of Biological Resources and Ecology of Pamirs Plateau in Xinjiang, Kashi 844006, China
4
Key Laboratory of Oasis Ecology of Education Ministry, Xinjiang University, Urumqi 830017, China
5
Xinjiang Jinghe Observation and Research Station of Temperate Desert Ecosystem, Ministry of Education, Urumqi 830017, China
*
Author to whom correspondence should be addressed.
Forests 2024, 15(9), 1661; https://doi.org/10.3390/f15091661
Submission received: 30 August 2024
/
Revised: 14 September 2024
/
Accepted: 16 September 2024
/
Published: 20 September 2024
(This article belongs to the Section Forest Biodiversity)
Abstract
:Owing to the dormancy of the seeds of Nitraria roborowskii Kom., which results in a low germination rate in nature, germination takes a long time, and natural regeneration is difficult. Therefore, there is a need to study the molecular mechanism by which the seeds of N. roborowskii release dormancy. In this study, the differentially expressed proteins of N. roborowskii seeds before and after dormancy and germination were quantitatively and qualitatively analyzed via two-dimensional high-performance liquid chromatography tandem mass spectrometry (LC–MS) and TMTTM. Differentially expressed proteins from dormant and germinated seeds were characterized and enriched via bioinformatics to determine the functions and pathways of the differentially expressed proteins. The results revealed that seed dormancy was regulated by multiple metabolic pathways, including protein synthesis, nutrient utilization and phytohormone signal transduction pathways. A comparison of the dormant and germinated N. roborowskii seed samples revealed 1082 differentially expressed proteins with FC ≥ 1.5 and p values ≤ 0.05, among which 191 proteins were upregulated and 891 proteins were downregulated in the seeds of the germinated group, and proteins more closely related to the key genes of the germinated N. roborowskii seeds were involved in the activity of D-threo-aldose 1-dehydrogenase. Four proteins (WD40, cystatin, AMP binding protein, and helicase) were involved in the positive regulation of seed germination. The release of N. roborowskii seed dormancy is a complex biological process involving cell differentiation, formation, cellular transport, signaling and resistance, etc. The interactions of multiple metabolic pathways, such as carbon fixation, glycolysis/gluconeogenesis, the pentose phosphate pathway, endoplasmic reticulum protein processing and pyruvic acid metabolism in photosynthetic organisms, constitute a complex regulatory mechanism for dormancy release.
1. Introduction
Seed dormancy is a phenomenon in which seeds with normal viability fail to germinate despite suitable environmental conditions [1]. Nitraria roborowskii Kom., which belongs to the genus Nitraria of the Nitrariaceae family, is an ideal plant for the phytoremediation of saline soils [2]; soda salinized soils planted with N. roborowskii presented a significant yearly increase in organic matter and total nitrogen and a yearly decrease in total salt compared with bare ground [3]. N. roborowskii has important ecological, nutritional, medicinal and economic value, and N. roborowskii fruit might be used as a functional ingredient in food products [4]. Moreover, its seeds have deep dormancy characteristics [5]. Seeds of the genus Nitraria reportedly exhibit physiological dormancy (PD) [6]. Several studies have investigated the germination, dormancy and salt stress of N. roborowskii. The best values for the germination percentage, germination index and mean germination time were observed at 30 °C [7]. The effects of NaCl stress on the growth and stress tolerance of N. roborowskii seedlings increase with increasing salinity [8,9]. A previous study reported that N. roborowskii seeds are difficult to germinate, implying that these seeds have dormancy characteristics [10]. The components of the methanol phase, ethyl acetate phase and petroleum ether phase ether extracts of N. roborowskii seeds were identified via gas chromatography–mass spectrometry (GC–MS). The organic phase extracts of N. roborowskii seeds contained a variety of inhibitory compounds, which included 4H-pyran-4-one, 2,3-dihydro-3,5-dihydroxy-6-methyl-dibutyl phthalate; 4-((1E)-3-hydroxy-1-propenyl)- 2-methoxyphenol; 13-docosenamide, (Z)-; 3-hydroxy-4-methoxybenzoic acid; vanillin; 2,4-di-tert-butylphenol; and cyclohexane, ethyl-. The seeds of N. roborowskii contain a variety of endogenous inhibitors, which are the main reason for its seed dormancy [11]. Therefore, studying the mechanism of seed dormancy release in N. roborowskii is important.
Proteins, as the most direct regulators of biological growth and development and the response to external stimuli, are the most direct manifestations of various life activities. The proteome refers to the expression profile of all protein products of a genome, which was first proposed by Wilkins and Williams of Macquarie University, Australia, in 1994 at a conference held in Italy and was formally proposed by Wasinger in July 1995 in Electrophoresis for the first time [12].
Proteomic analyses revealed that protein profiles are temporarily altered in imbibed Arabidopsis seeds. It reflects the joint result of two processes: protein resynthesis and degradation [13]. Arabidopsis was the first plant to undergo large-scale proteomics studies [14], identifying more than 1300 differentially expressed proteins in its seeds, encompassing five biological processes, of which 74 proteins were associated with seed germination and 12 proteins with the capacity to regulate the release of dormancy to germination [7]. Thirty-two differentially expressed proteins exist between dormant and nondormant seeds in Arabidopsis [15]. The abundance of certain proteins may decrease or increase during seed germination or may increase after radicle extension [16]. Germination proteins may be associated with cell elongation after germination [17].
There was a smooth increase in the expression of genes encoding proteins related to swelling and sprouting and an increase in enzymes involved in the mobilization of postsprouting stores during and after tomato seed germination [18]. Researchers have conducted a proteomic study of the germination process of soybean N2899 seeds via two-dimensional electrophoresis (2-DE), which revealed that the abundance of 10 differentially expressed proteins changed during the early stages of germination [19]. Only AtGA3oxl and DELLA subfamily proteins were identified as downstream components of the Arabidopsis germination process [20].
In the present study, we used seeds of N. roborowskii without reference genome information, and quantitative and qualitative analyses of differentially expressed proteins between dormant and germinated samples were carried out via 2-D high-performance liquid chromatography tandem mass spectrometry (LC–MS) with the TMTTM technique (Tandem Mass TagTM). Tandem mass spectrometry analysis was performed by specific labeling of the amino groups of the peptides (Thermo Scientific, Waltham, MA, USA). The differentially expressed proteins in dormant and nondormant seeds were identified, aiming to identify potential genes affecting seed dormancy and providing a theoretical basis for the study of the molecular regulatory mechanism of seed dormancy.
2. Materials and Methods
2.1. Plant Materials and Treatments
The seeds of N. roborowskii for this experiment were purchased from the planting base of Minqin County Linquan Ecological Seed Industry Co., Wuwei, China. Mature, full, disease-free and pest-free seeds were selected (with a viability of 83.00% according to the TTC method; TTC is 2,3,5-triphenyltetrazolium chloride). The seed mass was 100.0 g for both experimental treatments. The seeds were disinfected with 0.1% KMnO4 solution for 30 min before sowing, and the seeds were soaked in 500 mg/L GA3 solution for 24 h. Distilled water was used as the control, and the GA3 solution-treated seeds were mixed with river sand (mass ratio of 1:3). The seeds were placed outdoors for 90 d in sand storage and stratified. Defining the stages of seed dormancy release and germination initiation in the scientific community is very difficult, so this study presupposes that seed germination is the criterion for determining the release of dormancy [21]. In this study, we used seeds with exposed radicles as a criterion for complete germination, but control seeds presented no signs of germination and remained dormant. In this study, seed embryos in the dormant state (A1, A2, A3) and broken dormant state (B1, B2, B3) were used as test materials for RNA extraction and transcriptome sequencing analysis, respectively. Approximately 0.1 g of each sample was taken, and three biological replicates were performed. The sample experimental design was a 1-time, 6-labeled TMT with an isotope labeling design, and the labeling information is shown in Table 1.
On the basis of expert advice, we reworked the experimental design to include a description of the germination status of nondormant seeds, which was approximately 90%, and whether all the seeds collected from the nondormant samples had visibly germinated.
2.2. Experimental Instrumentation
The following equipment was used: a RIGOL L-3000 high-performance liquid chromatography system (Beijing Puyuan Jingdian Science and Technology Co., Ltd., Beijing, China), a vortex oscillator (SCILOGEX, Rocky Hill, CT, USA, Model: MX-S), a vacuum centrifuge concentrator (Beijing JIAMMU Science and Technology Co., Ltd., Beijing, China, Model: CV100-DNA), an electrothermal thermostatic water bath (Beijing Mingguang Medical Instrument Co., Beijing, China, 7000), a centrifuge (Eppendorf, Hamburg, Germany), an enzyme labeller (DR200B, Diatek, Wuxi Hiwell-Diatek Instruments Co., Ltd., Wuxi, China), an electrophoresis system (Bio-Rad, Hercules, CA, USA), a high-throughput tissue grinder (Shanghai Hefan Instrument Co., Ltd., Shanghai, China, Model: hf-48), and an ultrasonic crusher (Shanghai HUANYAN Industrial Co., Ltd., Shanghai, China, Model: JY96-IIN).
2.3. Protein Extraction Quality Control
Protein extraction: The sample was transferred to a 2.0 mL grinding tube, zirconia beads were added, and the sample was transferred to liquid nitrogen precooled for 10 min along with the metal module of the crushed tissue. The sample was then quickly transferred to a tissue grinder and ground at 60 Hz for 60 s. This process was repeated 3 times. A 10-fold volume of lysis buffer (with protease inhibitor added at 8 mol/L, Amresco, Solon, OH, USA) was added, and the mixture was homogenized. The samples were subjected to ultrasonication for 30 s, followed by 10 s and a cumulative 10 min. After centrifugation at 14,000× g at 4 °C for 20 min, the supernatant was collected, and 10 µL was retained for quantification.
Protein quantification: The Bradford method was used to determine the concentration of the extracted proteins [22]. The sample was first diluted with lysis buffer so that the final concentration fell within the range of the standard curve. The diluted sample and the standard (BSA dissolved in lysis buffer to form a series of concentrations of the standard protein) were each mixed with 10 µL and 300 µL of the protein quantitative dye for 10 min, the absorbance values of the standard and the sample at 595 nm were measured by ELISA simultaneously, and the standard curve was plotted according to the relationship between the absorbance value and concentration of each standard. The concentrations of the samples were subsequently calculated (Table 2). All experimental samples were graded A1 and A2, with grades A1 and A2 indicating a clear gel map with abundant bands for subsequent experiments.
2.4. SDS–PAGE Electrophoresis
Ten micrograms of each sample was subjected to SDS–PAGE, stained with Coomassie Brilliant Blue for 30 min and decolored until the background was clear (Figure 1).
2.5. Trypsin Treatment and Desalting
An appropriate amount of protein was added to DTT at a final concentration of 5 mM, and the mixture was incubated at 37 °C for 1 h and then returned to room temperature. Then, 10 mM iodoacetamide was added, and the mixture was incubated for 45 min at room temperature in the dark. The sample was diluted 4-fold with 25 mM ammonium bicarbonate, trypsin (protein:trypsin = 50:1) was added, and the sample was incubated at 37 °C overnight; on the second day, formic acid was added to adjust the pH to <3, and the digestion was terminated. The samples were desalted via a C18 desalting column, 100% acetonitrile was used to activate the desalting column, 0.1% formic acid was used to equilibrate the column, the samples were loaded onto the column, the columns were washed with 0.1% formic acid to remove impurities, and the samples were finally eluted with 70% acetonitrile to collect the flow-through solution and lyophilized.
2.6. Labeling Samples
The TMT reagent was removed, the cap was opened, and 41 μL of acetonitrile was added. The mixture was shaken for 5 min and centrifuged. The TMT reagent was added to 100 μg of the digested sample, and the mixture was allowed to react at room temperature for 1 h. The reaction was terminated by the addition of ammonia. The labeled samples were mixed, vortexed and centrifuged to the bottom of the tube. The sample was freeze-dried by centrifugation under vacuum.
2.7. Fractions
After mixing and labeling, the samples were dissolved in 100 μL of mobile phase A. The samples were centrifuged at 14,000 rpm for 20 min, and the supernatants were collected and graded via a high-performance liquid phase. The flow rate was 0.7 mL/min.
2.8. LC–MS/MS Mass Spectrometry Analysis
Mobile phases A (100% water + 0.1% formic acid) and B (80% acetonitrile + 0.1% formic acid) were prepared. The lyophilized powder was dissolved in 10 µL of liquid A. The sample was centrifuged at 14,000× g for 20 min at 4 °C, and 1 µg of the supernatant was injected into the sample for liquid mass detection. An ORBITRAP ECLIPSE mass spectrometer (Thermo Fisher) was used with a Nanospray Flex™ (NSI) ion source (Thermo Fisher), the ion spray voltage was set to 2.0 kV, the ion transfer tube temperature was set to 320 °C, the mass spectrum was acquired in data-dependent mode, the full scan range of the mass spectrum was 350–1500 m/z, and the resolution of the first stage of the mass spectrum was set to 120,000 (200 m/z). The AGC was 100%, and the maximum injection time of the C-trap was 50 ms. The parent ion with an ionic strength of TOP 40 in the full scan was fragmented by high-energy collisional deconvolution (HCD) and then detected by secondary mass spectrometry. The resolution of the secondary mass spectrometer was set at 30,000 (200 m/z), the AGC was 100%, the maximum injection time was 54 ms, the energy of peptide fragmentation was set to 36%, and the raw mass spectrometry data were generated. Raw data (.raw) for mass spectrometry detection were generated.
2.9. Data Processing
A transcriptome database was used in this study. Proteome Discoverer 2.4 software was used to search the databases, and the database search parameter settings are shown in Table 3.
3. Functional Analysis of Differentially Expressed Proteins
3.1. GO Functional Annotation
To explore the distribution of differentially expressed proteins in terms of cellular components, molecular functions and biological processes in dormant (CK) and germinated (GA3) seeds of N. roborowskii. GO annotation of the proteome was derived from the GO database (https://www.ebi.ac.uk/QuickGO/, accessed on 14 September 2024). Proteins were classified by GO annotation based on three categories as follows: molecular function, biological process, and cellular component.
3.2. KEGG Analysis
Proteins in an organism do not exercise their functions alone; rather, different proteins interact with each other and work together to coordinate a series of physiological, biochemical and metabolic activities to exercise their biological functions. The pathway analysis was performed using the KEGG pathway (KEGG protein database: http://www.kegg.jp/kegg/pathway.html, accessed on 14 September 2024). The KEGG database was used in this study to identify enriched pathways and to test the enrichment of the different proteins against all identified proteins by Hypergeometric distribution.
3.3. GO Function Enrichment Analysis and KEGG Annotation
Fisher’s exact test (FET) was used to compare the distribution of each gene ontology classification or each metabolic pathway in the target protein set and the total protein set to evaluate the significance level of enrichment.
4. Results and Analysis
4.1. Data Quality Control
4.1.1. Statistics of Protein Qualitative Results
According to the results of this study, the total number of secondary spectra of Run1 was 396,183, the total number of matched spectra was 37,067, the total number of peptides was 12,969, and the total number of identified proteins was 2714.
4.1.2. Statistics of Protein Quantification Results
The identification of differentially expressed proteins between nondormant seeds and dormant seed samples of N. roborowskii revealed that all the differentially expressed proteins met FC ≥ 1.5 and p value ≤ 0.05, totaling 1082, 191 of which were upregulated and 891 of which were downregulated.
4.1.3. Evaluation and Statistical Analysis of Identified Peptides
Most of the identified peptide lengths were distributed between 7 and 20, with the peak region distributed between 8 and 15 (Supplementary Figure S1). The number of peptide matching spectra (PSMs) corresponding to the peptides identified in this study were mostly between 1 and 5 (Supplementary Figure S2). The number of peptides with 0 missed cuts in this study was 10,749, accounting for 82.88% of the total number of all identified peptides, indicating that the enzymatic cleavage in this experiment was relatively thorough, which was conducive to the identification of differentially expressed proteins (Supplementary Figure S3).
4.1.4. Evaluation and Statistical Analysis of Identified Proteins
The number of unique peptide segments contained in the identified proteins was counted (Supplementary Figure S4), and the number of peptide segments of the identified proteins was the greatest, with most ranging from 1–8. On average, the fewer peptide segments matched by each protein proved that the peptide segments were more efficient in identifying the proteins. The number of PSMs matched by proteins was mostly between 1 and 18 (Supplementary Figure S5), indicating the distribution of the number of proteins with different abundance levels and higher reliability of the identified proteins. The number of identified proteins with molecular weights between 0 and 50 kDa was the highest, followed by proteins with molecular weights between 50 and 100 kDa (Supplementary Figure S6), and the greater the molecular weight of the protein was, the lower the number of identified proteins. The number of proteins identified with coverage between 0% and 20% was approximately 1600, the number of proteins with coverage between 20% and 40% was greater than 600, and the number of proteins with coverage above 60% was lower (Supplementary Figure S7).
4.2. Bioinformatics Analysis
4.2.1. Global Analysis
Hierarchical clustering and principal component analysis (PCA) were used for global analysis of differentially expressed proteins in the seeds. Hierarchical clustering was used to analyze the sample expression of proteins and samples simultaneously to construct a global analysis clustering heatmap (Supplementary Figure S8). Z value correction was applied to each row. The vertical direction represents sample clustering, the horizontal direction represents protein clustering, and the shorter direction represents greater similarity. Vertical clustering was used to analyze the expression patterns of proteins between samples. The majority of genes clustered in red in a sample of released dormant seeds of N. roborowskii appeared to be highly expressed, the number of genes whose expression was upregulated was greater than the number of genes whose expression was downregulated, and the similarity between CK1 and CK2, GA3_SC30 d2 and GA3_SC30 d3 was greater. According to the PCA results (Figure 2), the percentages of proteins that could be explained by PC1 and PC2 were 69.9% and 14.2%, respectively, and the distributions of the principal component PC1 and PC2 values between the samples within the groups of dormant seeds and nondormant seeds were more concentrated, which proved that the credibility of the duplication of the samples within the two groups was high and that there was a significant separation between the two groups of treated samples.
4.2.2. Statistics of the Differentially Expressed Proteins
Volcano plots (FCs) and hierarchical clustering were used to count the differentially expressed proteins in the seeds. When FC ≥ 2 and p value ≤ 0.01, the protein with upregulated expression was identified in this study; when FC ≤ 1/2 and p value ≤ 0.01, the protein with downregulated expression was identified. There were 191 upregulated proteins and 891 downregulated proteins in the nondormant group (B) compared with the dormant group (A) according to the volcano map (Figure 3). The results of hierarchical clustering in this study are shown in Supplementary Figure S9, indicating that the expression patterns of differentially expressed proteins were more consistent between the two groups of samples in this experiment, which proved that the reproducibility of the samples obtained with differentially expressed proteins was better.
4.3. Functional Analysis of Differentially Expressed Proteins
4.3.1. GO Functional Annotation of DEPs
The results of the GO functional annotation of the differentially expressed proteins are shown in Figure 4, in which a total of 2510 proteins were annotated by GO. Twenty genes were enriched in biological processes, mainly protein folding, response to heat, response to cold, etc.; 20 genes were enriched in cellular components, mainly cytosol, chloroplasts, and mitochondria; and 20 genes were enriched in molecular functions, mainly mRNA binding, structural composition of ribosomes, ATP hydrolysis activity, etc.
4.3.2. KEGG Analysis
KEGG pathway enrichment analysis of the proteins of the two groups of samples from the seeds of N. roborowskii revealed that the proteins were involved mostly in biochemical metabolic pathways and signal transduction pathways and differentially expressed proteins were significantly enriched in 117 pathways. Figure 5 shows the top 20 enriched pathways, which included carbon fixation in photosynthetic organisms, glycolysis/gluconeogenesis, the pentose phosphate pathway, pyruvate metabolism, and protein processing in the endoplasmic reticulum.
4.3.3. COG Functional Annotation
The statistical results of the COG classification of the differentially expressed proteins identified in this study are shown in Figure 6, and the functional classifications of the differentially expressed proteins were mainly post-translational modification, protein turnover, molecular chaperones, global function prediction, translation, ribosome structure and biosynthesis, carbohydrate transport and metabolism, energy production and conversion, amino acid transport and metabolism, etc. Among these factors, post-translational modification, protein turnover, molecular chaperones and amino acid transport and metabolism may be the main factors that promote the release of dormancy in the seeds of N. roborowskii. Translation, ribosome structure and biosynthesis, carbohydrate transport and metabolism, energy production and conversion are the material basis for the dormancy release of seeds.
4.3.4. GO Enrichment Analysis
GO enrichment analysis of differentially expressed proteins from dormant and nondormant seeds of N. roborowskii revealed that biological processes were significantly enriched in 20 entries (Figure 7), mainly protein folding, protein refolding, glycolytic process, response to heat, gluconeogenesis, etc.; cellular components were significantly enriched in 20 entries (Supplementary Figure S10), mainly cytosol, chloroplast stroma, apoplast, plant-type cell wall, chloroplast envelope, etc.; and molecular functions were significantly enriched in 20 entries (Supplementary Figure S11), mainly unfolded protein binding, copper ion binding, mRNA binding, heat shock protein binding, and protein folding chaperones, etc.
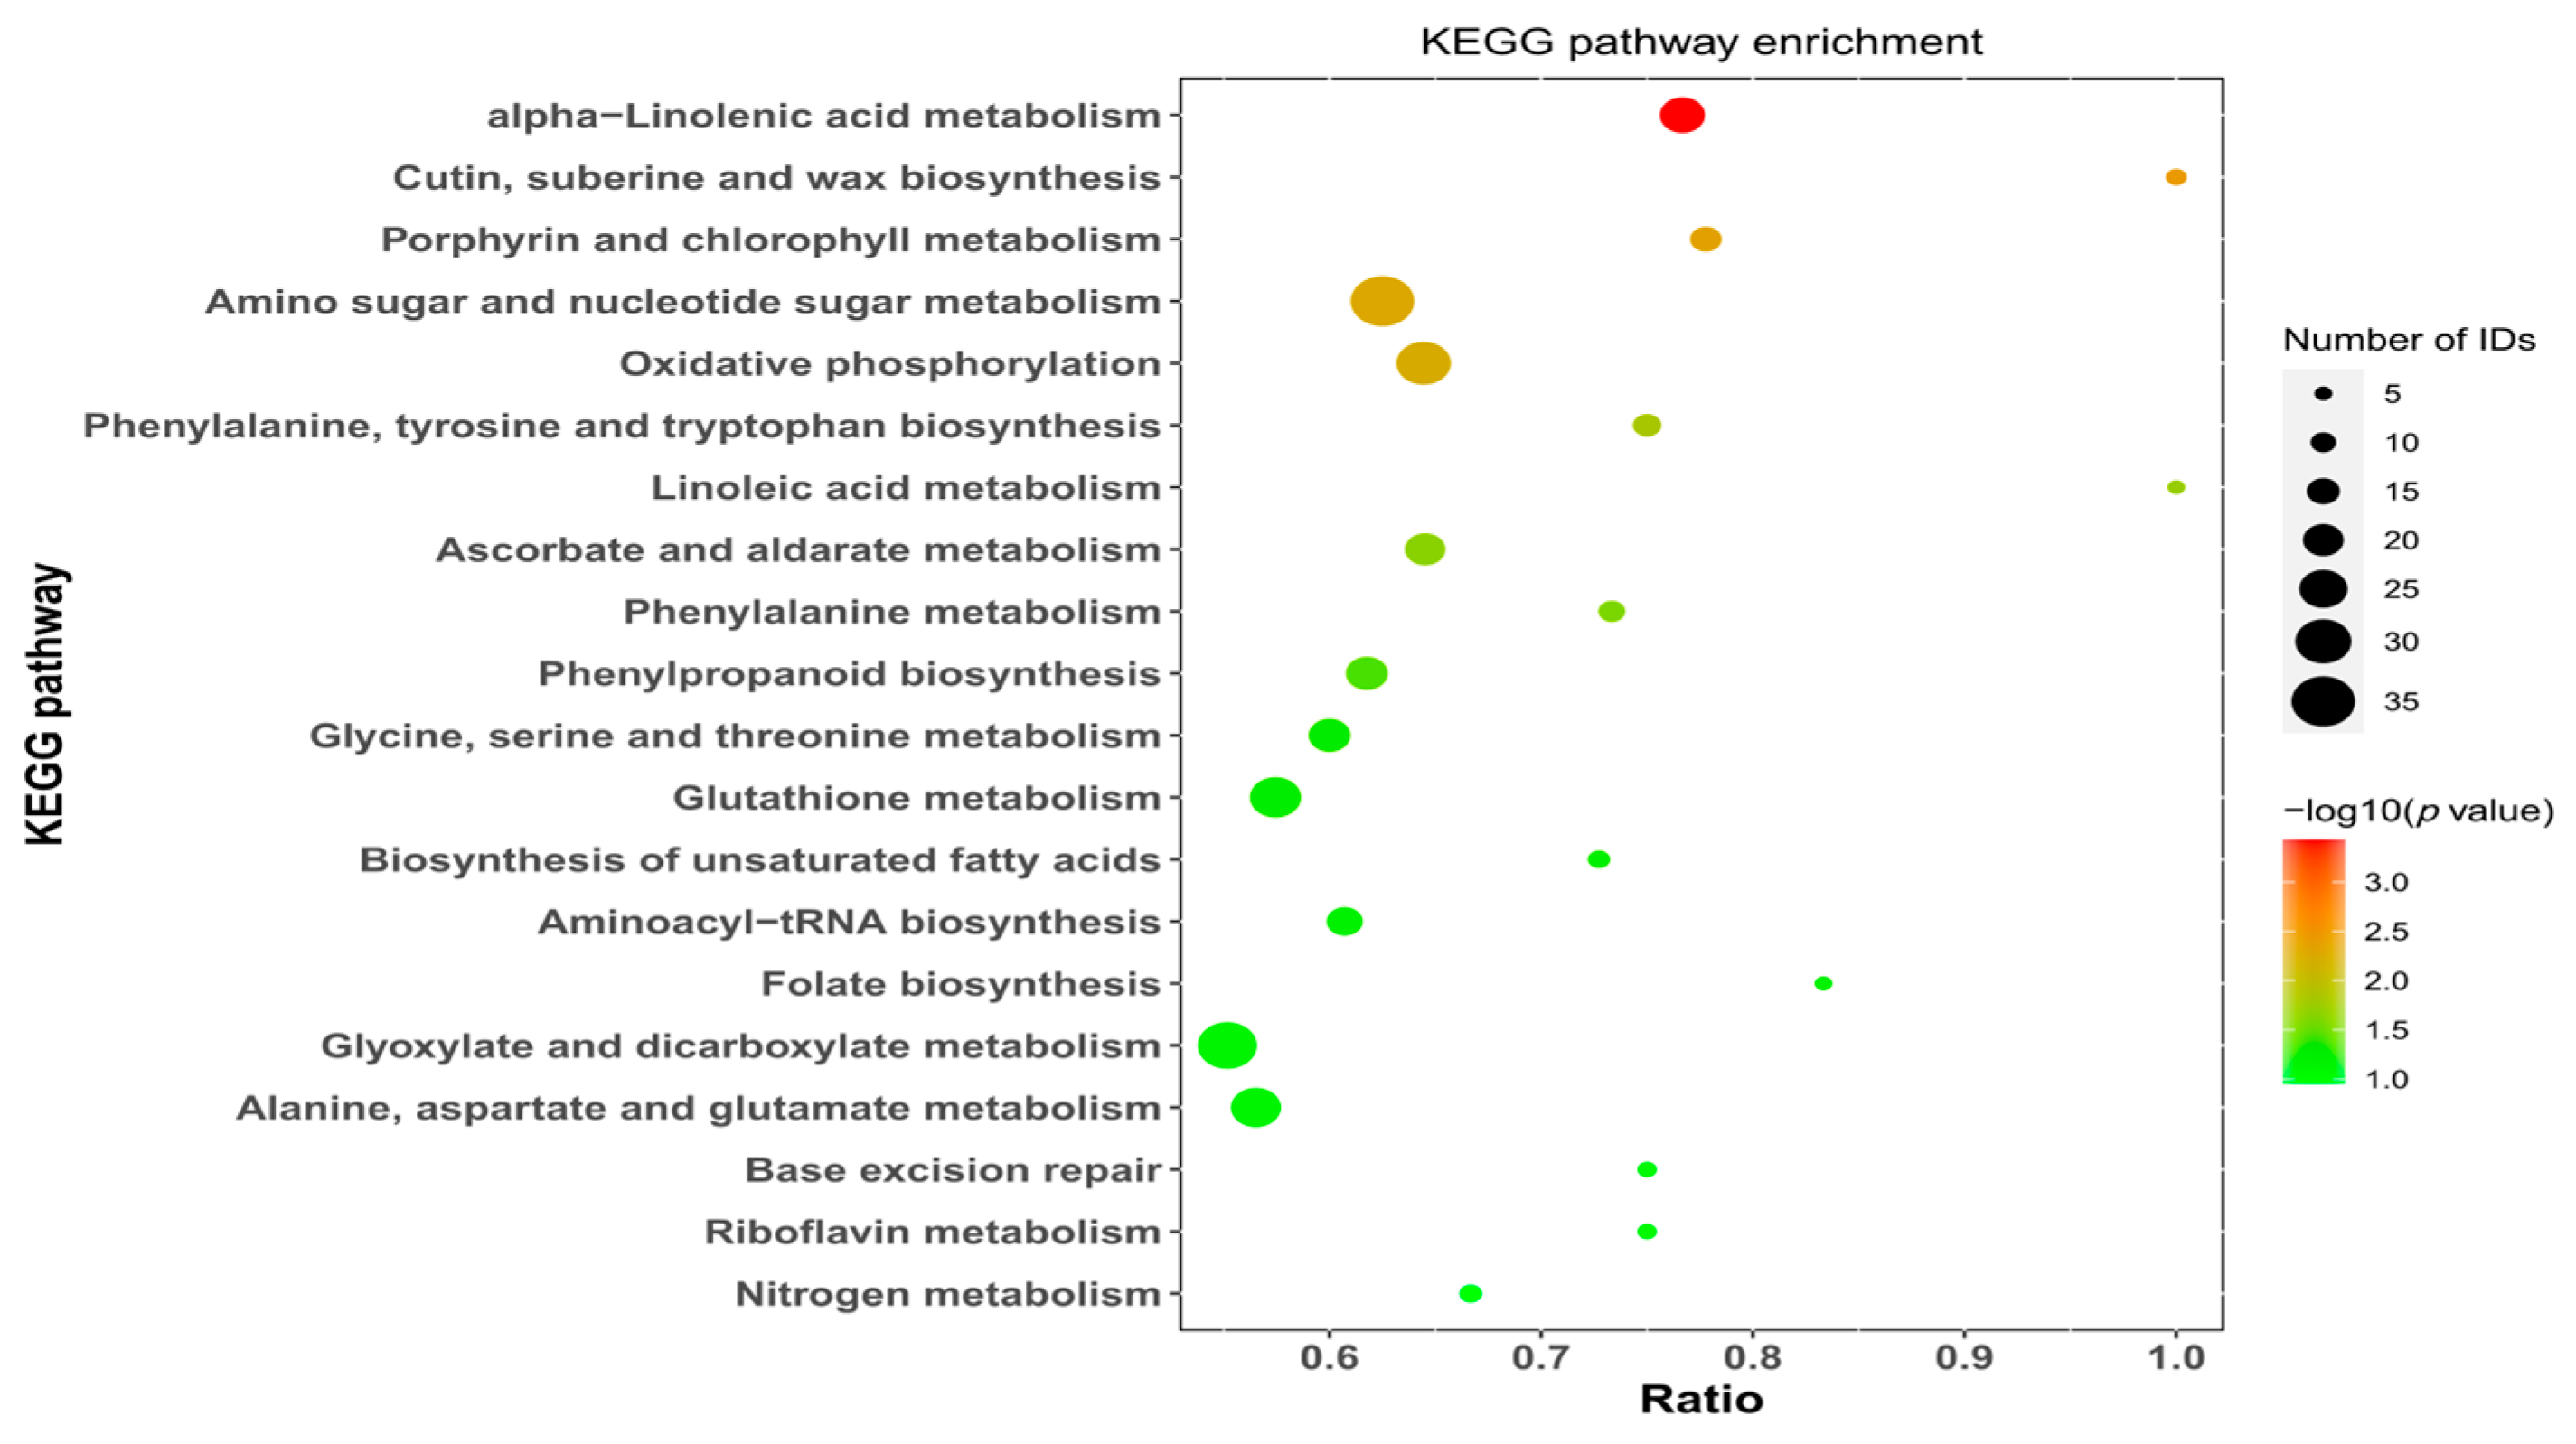
4.3.5. KEGG Pathway Annotation
The results revealed that 99 pathways were significantly enriched in the samples. Figure 8 shows the top 20 enriched pathways, which included alpha-linolenic acid metabolism; cutin, suberin and wax biosynthesis; porphyrin and chlorophyll metabolism; amino sugar and nucleotide sugar metabolism; and oxidative phosphorylation. KEGG enrichment analysis of the differentially expressed upregulated proteins in N. roborowskii seeds revealed that 42 pathways were significantly enriched, revealing the top 20 enriched pathways (Supplementary Figure S12), of which the 5 pathways with the greatest enrichment were cutin, suberin and wax biosynthesis; protein processing in the endoplasmic reticulum; ribosomes; the splicesome; and endocytosis. KEGG enrichment analysis of the differentially expressed proteins in N. roborowskii seeds revealed that 98 pathways were significantly enriched, representing the top 20 enriched pathways (Supplementary Figure S13), of which the 5 most enriched pathways were involved in alpha-linolenic acid metabolism; amino sugar and nucleotide sugar metabolism; oxidative phosphorylation; glyoxylate and dicarboxylate metabolism; and the citrate cycle (TCA).
4.3.6. Interaction Analysis
Interactions between proteins are a hotspot of cross-disciplinary research between life sciences and other disciplines in the postgenomic era. The combined_core in the PPI table of this study indicates the interaction score in the STRING database, and the larger the value is, the greater the possibility that the two proteins interact. The statistical data of this study show that the combined_core values are between 0.701 and 0.999, which indicates that the two proteins have greater interactions with each other.
4.3.7. Analysis of Differentially Expressed Proteins
This study revealed 63 proteins involved in seed germination (Table 4), 83 proteins involved in seed dormancy, 4 proteins involved in the positive regulation of seed germination (Supplementary Figure S14), 1 protein involved in the release of seeds from dormancy, 75 proteins involved in embryo development ending in seed dormancy, 4 proteins involved in the regulation of the seed dormancy process, and 42 proteins involved in the regulation of the seed dormancy process. Previous studies have shown that the activity of the enzymatic antioxidant system affects seed dormancy and germination. In this study, a total of 15 proteins were involved in the detoxification of ROS by antioxidant enzymes (SOD, CAT and POD) (Supplementary Figure S15). According to transcriptome studies, phytohormone signal transduction is a key factor affecting the dormancy and germination of seeds, mainly in terms of GA and ABA contents. A variety of proteins are involved in the phytohormone signal transduction pathway (Table 4), of which 11 proteins are involved in GA biosynthesis, one protein is involved in the positive regulation of the GA biosynthetic process, five proteins are involved in the GA-mediated signaling pathway, 12 proteins are involved in the regulation of the abscisic acid-activated signaling pathway, 83 proteins are involved in the response to ABA, 13 proteins are involved in the auxin-activated signaling pathway, 19 proteins are involved in the response to ethylene, 7 proteins are involved in the response to cytokinin, 27 proteins are involved in the salicylic acid biosynthetic process (SA), and 35 proteins are involved in the response to jasmonic acid (JA).
Table 4 shows that a variety of proteins are involved in metabolic pathways, including 58 proteins involved in glyoxylate and dicarboxylate metabolism, 56 proteins involved in amino and nucleotide sugar metabolism, 36 proteins involved in starch and sucrose metabolism, 6 proteins involved in sphingolipid metabolism, 14 proteins involved in glycerophospholipid metabolism, 16 proteins involved in glycerolipid metabolism, 12 proteins involved in cyanoamino acid metabolism, 6 proteins involved in folate biosynthesis, 24 proteins involved in galactose metabolism and 47 proteins involved in glutathione metabolism.
5. Discussion
The seeds of N. roborowskii are physiologically dormant, and physiological deficiency is closely related to gibberellin treatment and low-temperature stratification treatment [7]. In accordance with previous studies [23,24,25,26], gibberellin treatment and sand storage treatment for 90 days were used to release the dormancy of the seeds in this study. GA is reportedly required for the induction of seed germination [27]. RGL2 (for RGA-LIKE2) is the main DELLA transcription factor that represses seed germination, and GA promotes seed germination by enhancing the proteasome-mediated destruction of RGL2 [28].
In the postgenomic era, proteomic research is systematically and precisely investigating processes in organisms at the protein level [29], and many scholars have investigated seed dormancy and germination proteomics. Seed dormancy in Norway maple involves proteins from various processes, with ABA mainly downregulating proteins and GA mainly increasing protein abundance [30]. Although many of the available data from MS-based proteomic analysis of seeds are descriptive, they have nevertheless provided a preliminary metabolic picture explaining much of their biology [31]. In exploring the effects of hydrocyanic acid on dormancy in grape shoots, a total of 7135 proteins were identified (FC ≥ 1.5; p value ≤ 0.05), of which 6224 proteins were quantified, most of which were related to heat shock, oxidoreductase activity, energy metabolism, ribosomal, and hormonal signaling pathways and were found to be significantly enriched at both the transcriptional and translational levels [32].
5.1. Analysis of Differentially Expressed Proteins before and after the Release of Dormancy in N. roborowskii Seeds
In this study, on the basis of the transcriptome sequencing results obtained from the seeds of N. roborowskii, TMT quantitative protein analyses were carried out on dormant and germinated N. roborowskii seeds. Principal component analysis revealed that the two groups of samples were duplicated with high confidence and significant separation. A total of 1082 differentially expressed proteins were obtained by screening the seeds of dormant and germinated N. roborowskii with a protein change FC ≥ 1.5 and p value ≤ 0.05, among which 191 proteins were upregulated and 891 proteins were downregulated in the seeds of germinated plants.
In this study, we found that 13 pathways are involved in phytohormone signaling, and a variety of differentially expressed proteins are involved in phytohormone signaling pathways: one protein is involved in the positive regulation of the gibberellin biosynthetic process, and four proteins (WD40, cystatin, AMP-binding, helicase) are involved in the positive regulation of seed germination. WD40 was enriched in the MAPK signaling pathway-plant and plant hormone signal transduction pathways and was involved in the positive regulation of seed germination, with a significant increase in the expression of WD40 after the release of seeds from dormancy, from 757.5 to 1469.0. Positive regulation of actin filament depolymerization, positive regulation of the gibberellic acid-mediated signaling pathway, release of seeds from dormancy, negative regulation of the seed dormancy process, negative regulation of the abscisic acid-activated signaling pathway, and regulation of growth were observed. The role of plant hormones such as abscisic acid and gibberellins in seed germination and the global changes in proteome activity induced by redox regulation occur during seed development and germination [33]. Cystatin inhibits the polyphenol oxidase activity of Nicotiana tabacum [34].
The results of this study revealed that the dormant seeds of this plant, which is important for saline-alkaline soil improvement, contained 107 proteins involved in the response to salt stress and 6 proteins involved in drought recovery. LEA5-D, MGL3 and B19.3, which are proteins synthesized and accumulated by dehydration or induced by ABA during the late stage of embryo maturation when the embryo acquires dehydration tolerance, were detected in the dormant seeds of N. roborowskii. In GO_MF, there were 11 HSP proteins, including 7 HSP90 proteins and 4 HSP70 proteins, which were consistent with the key genes HSP18.0 and HSP15.7 of the transcriptome for releasing seed dormancy, proving that the correlation between the proteome and the transcriptome was high and that the two groupings were basically consistent with each other in terms of experimental conclusions. During seed development, smHSPs (small molecule heat shock proteins) are positively correlated with LEA expression, and both are positively correlated with ABA [22]. The expression of cytochrome c oxidases (COXs), mainly COX3, COX5C, COX6A, COX6B-2, COX-17, and COX17-2, in N. roborowskii seeds varied greatly before and after dormancy release. Studies have demonstrated the effects of the AOX and COX pathways on Alfalfa seed germination and juvenile root growth at different temperatures [35].
5.2. Analysis of Proteomic Metabolic Pathways before and after the Release of Dormancy in N. roborowskii Seeds
The differential expression of proteins involved in dormancy reversal in N. roborowskii seeds revealed that there were mainly functional proteins related to cell differentiation, cell formation, cell transport, signal transduction and stress resistance, reflecting the various physiological activities that occur during dormancy release in the seeds. The metabolic regulation theory put forward by Roberts suggests that seed dormancy is caused by the loss of balance among the tricarboxylic acid cycle (TCA), glycolysis, which utilizes glucose 6-phosphate, and the pentose phosphate pathway (PPP), which is an important component of respiration. An increase in the proportion of the PPP involved in respiration is important for the transition of dormant seeds to germination [36]. In this study, the expression level of the G6PDH protein significantly increased during the process of dormancy release in the seeds of N. roborowskii.
Compared with those in dormant seeds, the expression of genes related to glycolysis/gluconeogenesis, pyruvate metabolism, fatty acid degradation, tyrosine metabolism, fructose and mannose metabolism, and glycerolipid metabolism at the transcriptional and protein levels was significantly greater in dormant seeds of N. roborowskii, whereas the expression of genes related to endoplasmic reticulum protein processing, endocytosis, lipid transport, carbohydrate phosphorylation, galactose metabolism, spliceosomes, ribosomes, mitochondria, and base excision repair was also significantly different. The differences were significant compared with those in dormant seeds. The expression of various metabolic pathways, including purine metabolism, pyrimidine metabolism, linoleic acid metabolism, alpha-linolenic acid metabolism, the plant MAPK signaling pathway, aminoglycan and nucleotide metabolism, glycolate and dicarboxylic acid metabolism, glycine, serine and threonine metabolism, nitrogen metabolism, oxidative phosphorylation, arginine biosynthesis, and alanine and aspartate metabolism, at the transcriptional and protein levels differed significantly between dormant seeds and nondormant seeds of N. roborowskii. In addition to α-amylase, the upregulated proteins involved in glycolysis included UDP-glucose dehydrogenase, fructokinase, phosphoglucomutase, and pyruvate decarboxylase [37]. Moreover, the differentially expressed proteins were also involved in mRNA monitoring pathways and RNA transport, involving 18 positive regulators of transcription proteins, one basal transcription factor protein and one protein that regulates translation. There were 11 positive regulators of translation proteins, 10 cell wall modification proteins, 107 tRNA proteins, 3 mitochondrial mRNA modification proteins, and 10 plant cell wall modification proteins.
Changes in the physiological metabolism of seeds play a very important role in their release from dormancy. A total of 166 DEP spots representing 73 unique proteins were identified; these proteins are involved mainly in storage, stress/defense/detoxification, carbohydrate metabolism, photosynthesis, cell metabolism, and transcription/transposition [38]. The transcript and protein expression levels of genes involved in S-adenosylmethionine (SAM) biosynthesis metabolism (S-adenosylmethionine-homocysteine S-methyltransferase activity, S-adenosylmethionine biosynthesis, and S-adenosylmethionine-dependent methyltransferase activity) in the metabolism of methyl ethanethionine (MET) are relatively high in dormant N. roborowskii seeds. SAM is a compound produced by MET and adenosine triphosphate (ATP) enzymes. ATP compounds are produced by the action of adenosine methionine lyase. MET metabolism and SAM are genetic components that control metabolism and play key roles in controlling the transition from a quiescent state to a hyperactive state during seed germination [7]. SAM, an important metabolic intermediate in organisms, is catalyzed by ACC synthase to produce 1-aminocyclohexane carboxylic acid (ACC), which is converted to ethylene by ACC oxidase (ACO) in the presence of oxygen [39]. The DEPs upregulated by ethylene in Col included S-adenosylmethionine synthase 1, methionine adenosyltransferase 3 and ACC oxidase, which are involved in ethylene synthesis [40].
5.3. Combined Analysis of the Transcriptome and Proteome before and after Dormancy Release in N. roborowskii Seeds
Given that the research objectives of transcriptomics and proteomics in this study were the same, there must be some correlation. Combined with previous research on the differences between the two histologies, the results of the two histologies were jointly analyzed, and the molecular mechanism of the release of dormancy in N. roborowskii seeds was discussed from multiple perspectives. A total of 16,130 DEGs were identified, including 10,776 upregulated genes and 5354 downregulated genes. A total of 1082 differentially expressed proteins were identified, including 191 upregulated proteins and 891 downregulated proteins, and the correlation coefficient between D-threo-aldose 1-dehydrogenase activity and TGA7 was 99.95%. In this study, the correlation heatmap, correlation scatter plot (Supplementary Figure S16) and ROC validation (Supplementary Figure S17) of the transcriptome and proteome revealed that the absolute values of the correlation coefficients were large, which proved that the predictive accuracy of the association model of transcriptomics and proteomics of the seeds of N. roborowskii was reliable.
Only 300 DEGs were associated with the combined transcriptome and proteome analysis because some of the transcriptome and proteome results were not completely consistent. mRNA expression abundance ≠ protein expression abundance because translation is not simply a direct copy of mRNA information; from the transcriptome to the proteome is a complex regulatory stage, and there are a variety of reasons for the inconsistency of the two, such as the rate of mRNA degradation, the binding site of ribosomes, the density of ribosomes, the rate of mRNA expression, binding sites, and codon usage preference [41,42].
6. Conclusions
GA3 treatment significantly promoted the germination of physiologically dormant seeds. Using TMTTM technology, 2-D high-performance liquid chromatography tandem mass spectrometry (LC–MS) was used to quantitatively and qualitatively analyze the differentially expressed proteins of N. roborowskii seeds before and after the release of dormancy, and the transcriptome annotation information of N. roborowskii and the UniProt protein database were combined to identify the differential protein expression in the seeds of N. roborowskii between germinated and dormant N. roborowskii seeds and to analyze the differentially expressed proteins by function, pathway and other enriched biological information. The enriched proteins were identified, and their functions and pathways were analyzed. Seed dormancy is regulated by multiple metabolic pathways, including protein synthesis, nutrient utilization and phytohormone signal transduction. A comparison of the seed samples from dormant and germinated N. roborowskii revealed 1082 differentially expressed proteins with FC ≥ 1.5 and p values ≤ 0.05, among which 191 proteins were upregulated and 891 proteins were downregulated in the seeds of the germinated group, and proteins closely related to key genes of germinated N. roborowskii seeds were involved in the activity of D-threo-aldose 1-dehydrogenase. Four proteins (WD40, cystatin, AMP-binding, and helicase) were involved in the positive regulation of seed germination. Among the differentially expressed proteins in the seeds of N. roborowskii that release dormancy, functional proteins related to cell differentiation, formation, cellular transport, signaling and stress resistance, etc., were identified. KEGG analyses revealed that the differentially expressed proteins were involved mainly in carbon fixation, glycolysis/gluconeogenesis, the pentose phosphate pathway, protein processing in the endoplasmic reticulum, and pyruvic acid metabolism in photosynthetic organisms. GO_BP analyses of the results of nutrient utilization and processing, including protein folding, protein refolding, the glycolytic process, the response to heat, and gluconeogenesis, were performed.
Supplementary Materials
The following supporting information can be downloaded at: https://www.mdpi.com/article/10.3390/f15091661/s1, Figure S1: Peptide length statistics; Figure S2: Statistical distribution of the number of PSMs identified per peptide; Figure S3: Statistical map of the number of missed peptide cleavage sites; Figure S4: Statistical graph of the number of peptides matched to proteins; Figure S5: Statistical map of the distribution of the number of PSMs matched to proteins; Figure S6: Protein molecular weight distribution statistics; Figure S7: Statistical distribution of peptide coverage of identified proteins; Figure S8: Clustering heatmap for the global analysis of sample seeds; Figure S9: Heatmap of clustering of differentially expressed proteins in seeds; Figure S10: Enrichment map of the cellular fractions of differentially expressed proteins in seeds; Figure S11: Enrichment map of the molecular components of the differentially expressed proteins in the seeds; Figure S12: Scatter plot of the KEGG pathway annotation of the differentially expressed proteins enriched with the upregulated genes; Figure S13: Scatter plot of KEGG pathway-annotated differentially expressed proteins enriched with downregulated genes; Figure S14: Heatmap of proteins positively regulating seed germination in N. roborowskii (WD40, cystatin, AMP-binding, helicase); Figure S15: Heatmap of three antioxidant enzyme proteins from the seeds of N. roborowskii (CAT; SOD; POD); Figure S16: Scatter plots of the seed transcriptome and proteome associations (ASC); Figure S17: Seed transcriptome and proteome receiver operating characteristic curves (ROC).
Author Contributions
All the authors contributed to this study’s conception and design. Material preparation, data collection, and analyses were performed by S.R. and G.L. The first draft of the manuscript was written by S.R., and all the authors commented on previous versions of the manuscript. All authors have read and agreed to the published version of the manuscript.
Funding
This research was supported by the National Natural Science Foundation of China (42171026) and the Natural Science Foundation of Xinjiang (2022D01C42).
Data Availability Statement
The original contributions presented in the study are included in the article and Supplementary Materials, further inquiries can be directed to the corresponding author.
Conflicts of Interest
The authors declare that they have no conflicts of interest.
References
- Bewley, J. Derek. Seed germination and dormancy. Plant Cell 1997, 9, 1055–1066. [Google Scholar] [CrossRef] [PubMed]
- Liu, Y.X.; Zhou, L.H. Nitariaceae, Peganaceae, Zygophyllaceae. In Flora of China; Wu, Z.Y., Raven, P.H., Eds.; Science Press: Beijing, China; Missouri Botanical Garden Press: St. Louis, MO, USA, 2008; Volume 11, pp. 41–50. [Google Scholar]
- Liu, Y.K.; Li, Y.L.; Zhang, Z.J.; Wang, T.Q.; Wang, S.R.; Wang, Y. Adaptability and Soil Modification in Soda Salinized Soil by Lycium and Nitraria. J. Jilin Agric. Univ. 2024, 46, 1–11. [Google Scholar]
- Wu, D.; Jiang, S.; Wang, G.; Wang, L.; Wu, L.; Li, J.; Jia, W.; Liu, L.; Xu, J.; Zhang, D.; et al. Characterization of alkaloids and phenolics in Nitraria roborowskii Kom. fruit by UHPLC-triple-TOF-MS/MS and its sucrase and maltase inhibitory effects. Food Chem. 2024, 447, 138743. [Google Scholar] [CrossRef]
- Commander, L.; Merritt, D.; Rokich, D.; Dixon, K. Seed biology of Australian arid zone species: Germination of 18 species used for rehabilitation. J. Arid Environ. 2009, 73, 617–625. [Google Scholar] [CrossRef]
- Baskin, C.C.; Baskin, J.M. Seeds: Ecology, Biogeography, and Evolution of Dormancy and Germination, 2nd ed.; Elsevier Academic Press: San Diego, CA, USA, 2014. [Google Scholar]
- Zeng, Y.; Wei, J.; Yu, L.; Wang, Y. Seed viability, germination and dormancy of Nitraria roborowskii (Nitrariaceae). Seed Sci. Technol. 2016, 44, 647–653. [Google Scholar] [CrossRef]
- Lu, Y.; Lei, J.-Q.; Zeng, F.-J.; Xu, L.-S.; Liu, G.-J.; Peng, S.-L.; Huang, C.-B. Effects of salt stress on Nitraria roborowskii growth and physiological characteristics of stress resistance. Chin. J. Appl. Ecol. 2014, 25, 711–717. [Google Scholar]
- Lu, Y.; Lei, J.; Zeng, F. NaCl salinity-induced changes in growth, photosynthetic properties, water status and enzymatic antioxidant system of Nitraria roborowskii Kom. Pak. J. Bot 2016, 48, 843–851. [Google Scholar]
- Zhang, X.H.; Yan, L.; Zhang, W.B. Morphological and structural characteristics of Nitraria roborowskii Kom and its ecological adaptabilities. J. Arid Land Resour. Environ. 2013, 27, 74–79. [Google Scholar]
- Ren, S.F.; Jiang, L.M.; Lv, G.H. A Study on Endogenous Inhibitors of Nitraria roborowskii Kom. Seeds. Forests 2024, 15, 773. [Google Scholar] [CrossRef]
- Wasinger, V.C.; Cordwell, S.J.; Cerpa-Poljak, A.; Yan, J.X.; Gooley, A.A.; Wilkins, M.R.; Duncan, M.W.; Harris, R.; Williams, K.L.; Humphery-Smith, I. Progress with gene-product mapping of the Mollicutes: Mycoplasma genitalium. Electrophoresis 1995, 16, 1090–1094. [Google Scholar] [CrossRef]
- Gallardo, K.; Job, C.; Groot, S.P.; Puype, M.; Demol, H.; Vandekerckhove, J.; Job, D. Proteomic analysis of Arabidopsis seed germination and priming. Plant Physiol. 2001, 126, 835–848. [Google Scholar] [CrossRef] [PubMed]
- Kamo, M.; Kawakami, T.; Miyatake, N.; Tsugita, A. Separation and characterization of Arabidopsis thaliana proteins by two-dimensional gel electrophoresis. Electrophoresis 1995, 16, 423–430. [Google Scholar] [CrossRef] [PubMed]
- Chibani, K.; Ali-Rachedi, S.; Job, C.; Job, D.; Jullien, M.; Grappin, P. Proteomic analysis of seed dormancy in Arabidopsis. Plant Physiol. 2006, 142, 1493–1510. [Google Scholar] [CrossRef]
- Gallardo, K.; Job, C.; Groot, S.P.; Puype, M.; Demol, H.; Vandekerckhove, J.; Job, D. Proteomics of Arabidopsis seed germination. A comparative study of wild-type and gibberellin-deficient seeds. Plant Physiol. 2002, 129, 823–837. [Google Scholar] [CrossRef]
- Lane, B.G. Oxalate, germin, and the extracellular matrix of higher plants. FASEB J. 1994, 8, 294–301. [Google Scholar] [CrossRef]
- Machado, C.F. Gene Expression during Germination and Postgermination of Dried and Nondried Developing Seeds of Tomato. Diss. Ph.D. Thesis, University of Guelph, Guelph, ON, Canada, 2007. [Google Scholar]
- Xu, X.; Zheng, R.; Li, C.; Gai, J.Y.; Yu, D.Y. Differential Proteomic Analysis of Seed Germination in Soybean. Adv. Biochem. Biophys. 2006, 11, 1106–1112. [Google Scholar]
- Yamauchi, Y.; Ogawa, M.; Kuwahara, A.; Hanada, A.; Kamiya, Y.; Yamaguchi, S. Activation of gibberellin biosynthesis and response pathways by low temperature during imbibition of Arabidopsis thaliana seeds. Plant Cell 2004, 16, 367–378. [Google Scholar] [CrossRef] [PubMed]
- Bentsink, L.; Koornneef, M. Seed dormancy and germination. Arab. Book Am. Soc. Plant Biol. 2008, 6, e0119. [Google Scholar] [CrossRef]
- Bradford, M.M. A rapid and sensitive method for the quantitation of microgram quantities of protein utilizing the principle of protein-dye binding. Anal. Biochem. 1976, 72, 248–254. [Google Scholar] [CrossRef]
- Khan, A.A. The Physiology and Biochemistry of Seed Dormancy and Germination; North-Holland Publishing Company: Amsterdam, The Netherlands; New York, NY, USA; Oxford, UK, 1977. [Google Scholar]
- Bewley, J.D.; Bradford, K.J.; Hilhorst, H.W.M.; Nonogaki, H. Seeds: Physiology of Development, Germination and Dormancy, 3rd ed.; Springer: New York, NY, USA, 2013. [Google Scholar]
- Zhang, C.C.; Gao, Z.; Luo, L.N.; Zhang, Z.X.; Wang, J.; Lu, F.H.; Xiang, Z.X. Transcriptome analysis of seed embryos before and after dormancy release state of Thesium chinense. Chin. J. Tradit. Chin. Med. 2020, 45, 3837–3843. [Google Scholar]
- Luo, L.N.; Xiang, Z.X. The Relative Difference Genes in the Process of Dormancy Release of Polygonatum sibiricum Red Based on the Transcriptome Sequencing Analysis. Chin. Agron. Bull. 2021, 37, 1–8. [Google Scholar]
- Seo, M.; Hanada, A.; Kuwahara, A.; Endo, A.; Okamoto, M.; Yamauchi, Y.; North, H.; Marion-Poll, A.; Sun, T.; Koshiba, T.; et al. Regulation of hormone metabolism in Arabidopsis seeds: Phytochrome regulation of abscisic acid metabolism and abscisic acid regulation of gibberellin metabolism. Plant J. 2006, 48, 354–366. [Google Scholar] [CrossRef] [PubMed]
- Piskurewicz, U.; Jikumaru, Y.; Kinoshita, N.; Nambara, E.; Kamiya, Y.; Lopez-Molina, L. The Gibberellic Acid Signaling Repressor RGL2 Inhibits Arabidopsis Seed Germination by Stimulating Abscisic Acid Synthesis and ABI5 Activity. Plant Cell 2008, 10, 20. [Google Scholar] [CrossRef] [PubMed]
- Gao, Y.P. Study on the Physiological and Biochemical Changes and Molecular Mechanisms in Cercis Chinensis Seeds during Dormancy Releasing; Nanjing Forestry University: Nanjing, China, 2020. [Google Scholar]
- Pawłowski, T.A. Proteome analysis of Norway maple (Acer platanoides L.) seeds dormancy breaking and germination: Influence of abscisic and gibberellic acids. BMC Plant Biol. 2009, 9, 48. [Google Scholar] [CrossRef]
- Miernyk, J.A.; Hajduch, M. Seed proteomics. J. Proteom. 2011, 74, 389–400. [Google Scholar] [CrossRef]
- Khalil-Ur-Rehman, M.; Wang, W.; Dong, Y.; Faheem, M.; Xu, Y.; Gao, Z.; Shen, Z.G.; Tao, J. Comparative transcriptomic and proteomic analysis to deeply investigate the role of hydrogen cyanamide in grape bud dormancy. Int. J. Mol. Sci. 2019, 20, 3528. [Google Scholar] [CrossRef]
- Catusse, J.; Job, C.; Job, D. Transcriptome-and proteome-wide analyses of seed germination. Comptes Rendus Biol. 2008, 331, 815–822. [Google Scholar] [CrossRef]
- Wu, H.Z.; Jin, G. A Reasearch on the Interaction mechanism for Cystatin and Polyphenol Oxidase from Nicotaina Tobacum. J. Hefei Univ. (Nat. Sci.) 2006, 1, 45–48. [Google Scholar]
- Zhao, W.J.; Zhang, H.Y.; Xu, Y.N.; Luo, J.; Liu, M.J. Effects of the Alternative Oxidase and Cytochrome Oxidase Pathways on the Germination of Seeds and Growth of Roots of Alfalfa Seedlings Under Different Temperatures. J. Grassl. Sci. 2022, 30, 84–92. [Google Scholar]
- Roberts, E.H. Oxidative processes and the control of seed germination. Seed Ecol. 1973, 28, 189–218. [Google Scholar]
- Yang, P.; Li, X.; Wang, X.; Chen, H.; Chen, F.; Shen, S. Proteomic analysis of rice (Oryza sativa) seeds during germination. Proteomics 2007, 7, 3358–3368. [Google Scholar] [CrossRef] [PubMed]
- Dong, K.; Zhen, S.; Cheng, Z.; Cao, H.; Ge, P.; Yan, Y. Proteomic analysis reveals key proteins and phosphoproteins upon seed germination of wheat (Triticum aestivum L.). Front. Plant Sci. 2015, 6, 1017. [Google Scholar] [CrossRef]
- Zhang, J.J.; Zhang, L.Y.; Xia, K.; Jiang, M.; Wei, X. Transcriptomic Analysis of the Seed of Garcinia paucinervis, a Rare and Endangered Plant Species, During Dormancy Releasing. For. Sci. Res. 2021, 34, 35–46. [Google Scholar]
- Wang, X.; Davanture, M.; Zivy, M.; Bailly, C.; Nambara, E.; Corbineau, F. Label-Free Quantitative Proteomics Reveal the Involvement of PRT6 in Arabidopsis thaliana Seed Responsiveness to Ethylene. Int. J. Mol. Sci. 2022, 23, 9352. [Google Scholar] [CrossRef]
- Schwanhäusser, B.; Busse, D.; Li, N.; Dittmar, G.; Schuchhardt, J.; Wolf, J.; Chen, W.; Selbach, M. Global quantification of mammalian gene expression control. Nature 2011, 473, 337–342. [Google Scholar] [CrossRef]
- Kumar, D.; Bansal, G.; Narang, A.; Basak, T.; Abbas, T.; Dash, D. Integrating transcriptome and proteome profiling: Strategies and applications. Proteomics 2016, 16, 2533–2544. [Google Scholar] [CrossRef]
Figure 1.
SDS–PAGE electropherogram of sample seeds.

Figure 2.
Principal component analysis of sample seeds.

Figure 3.
Volcano map of differentially expressed proteins in seeds.
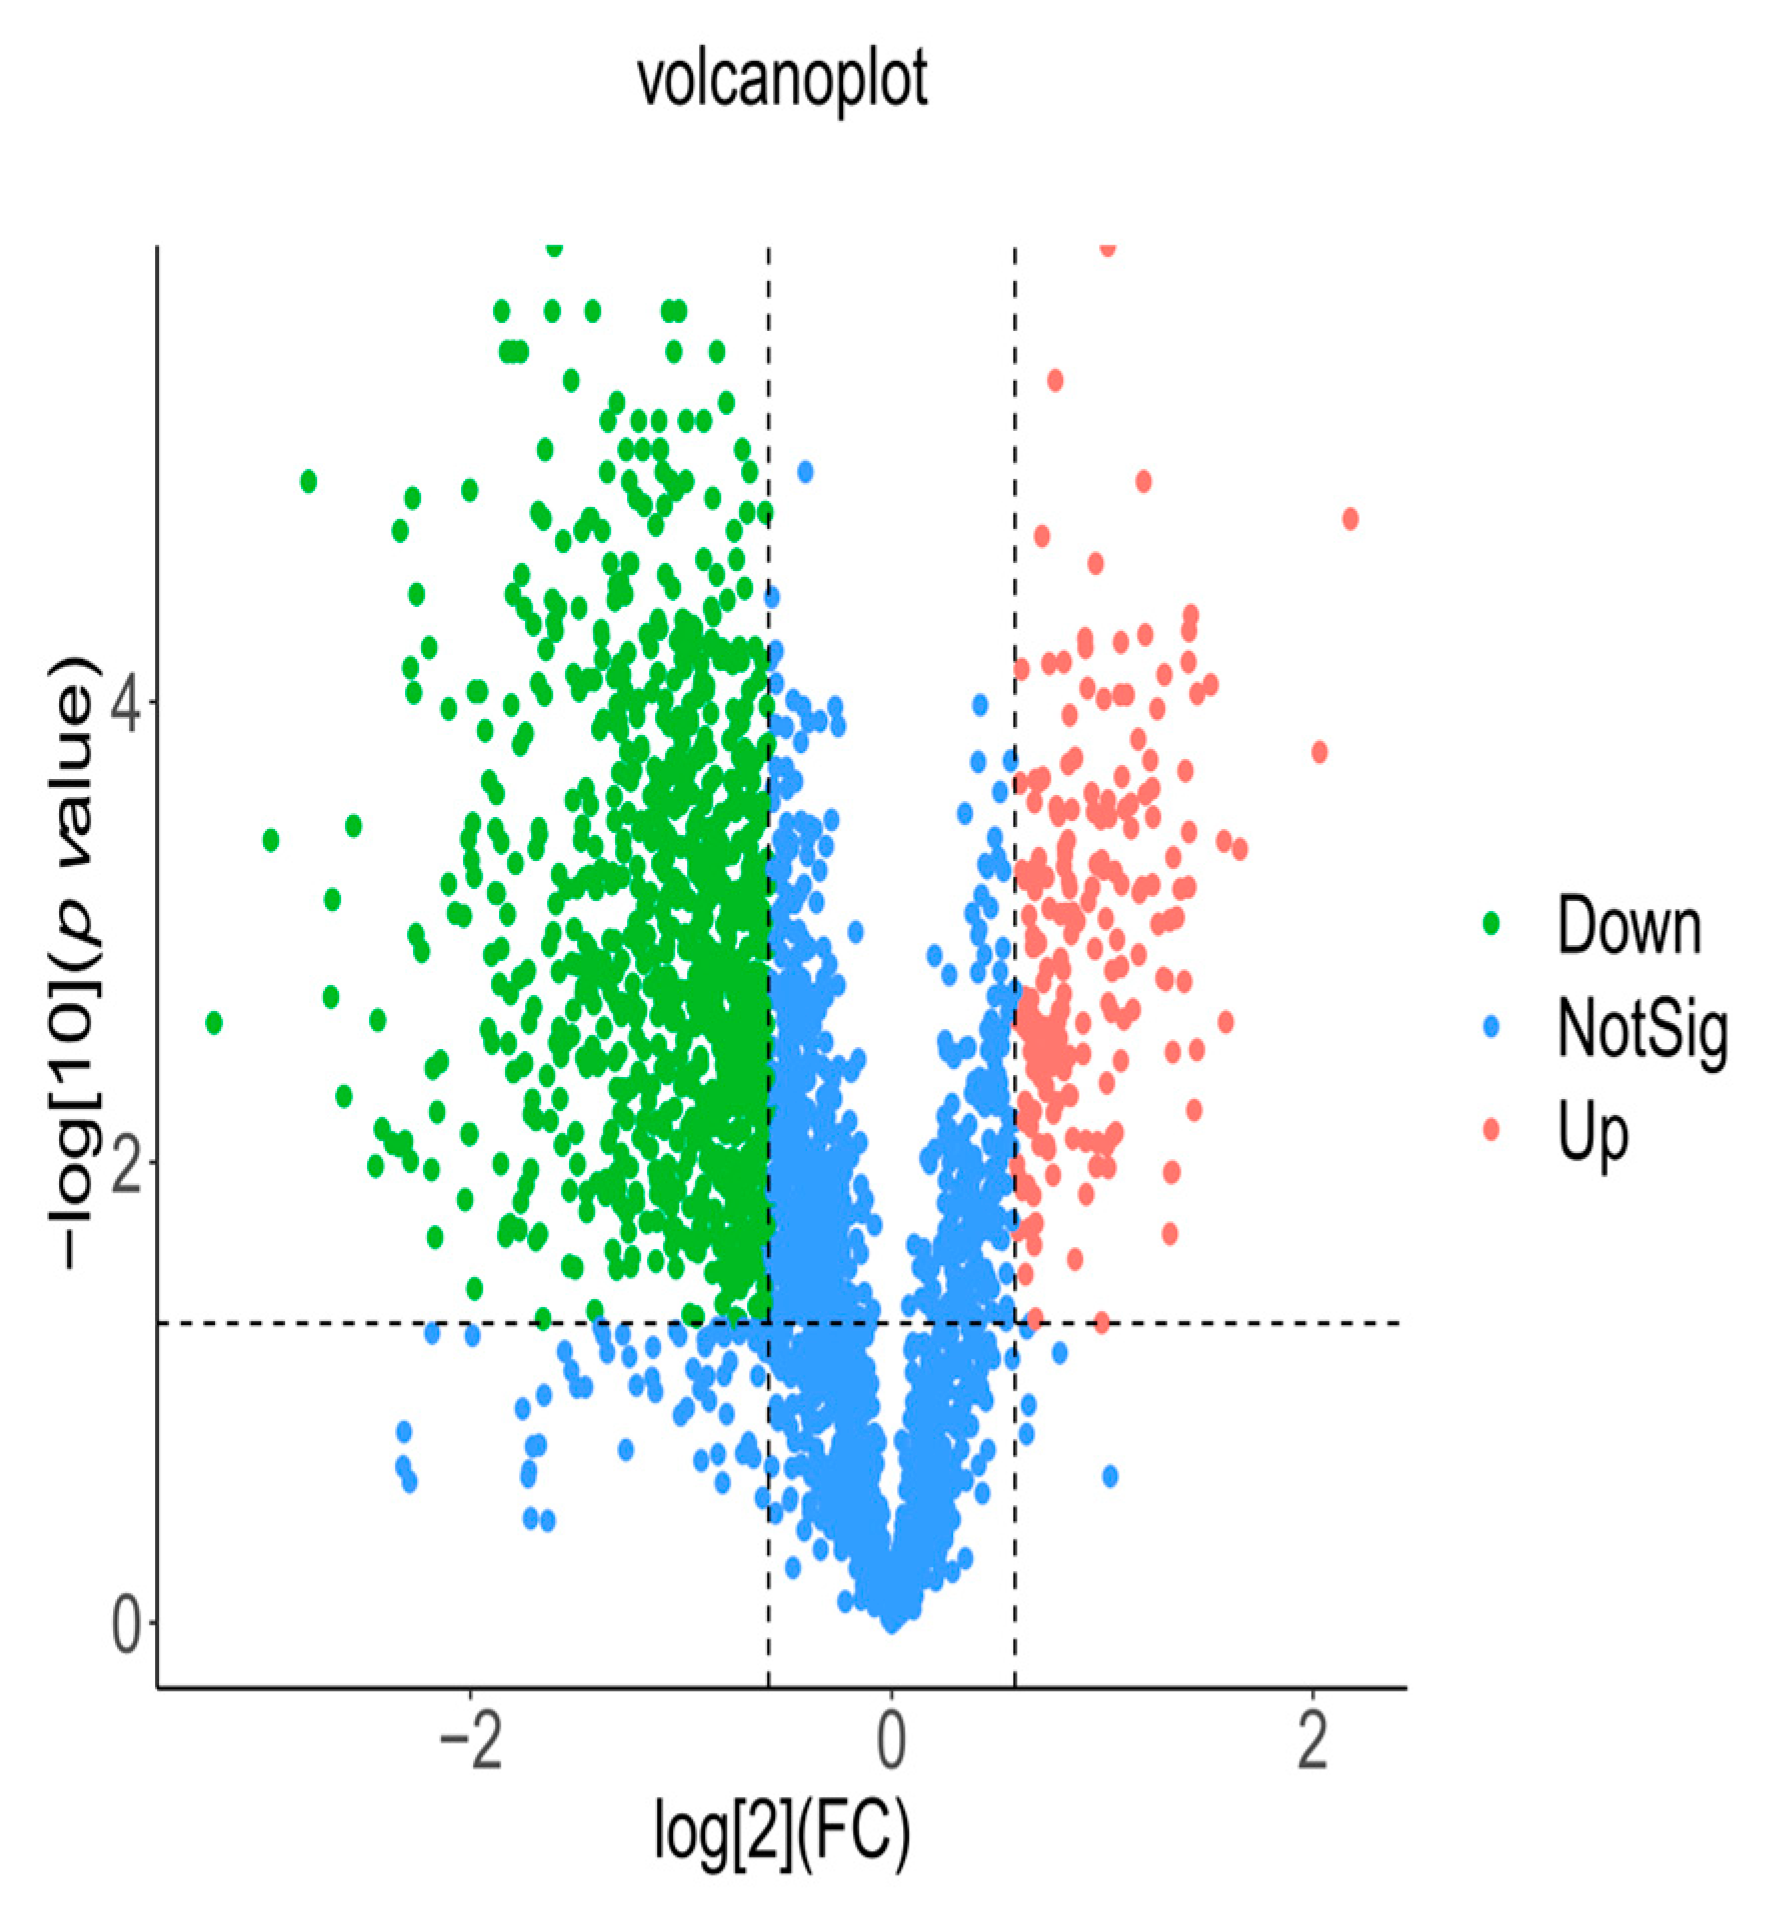
Figure 4.
GO classification map of differentially expressed proteins in seeds.
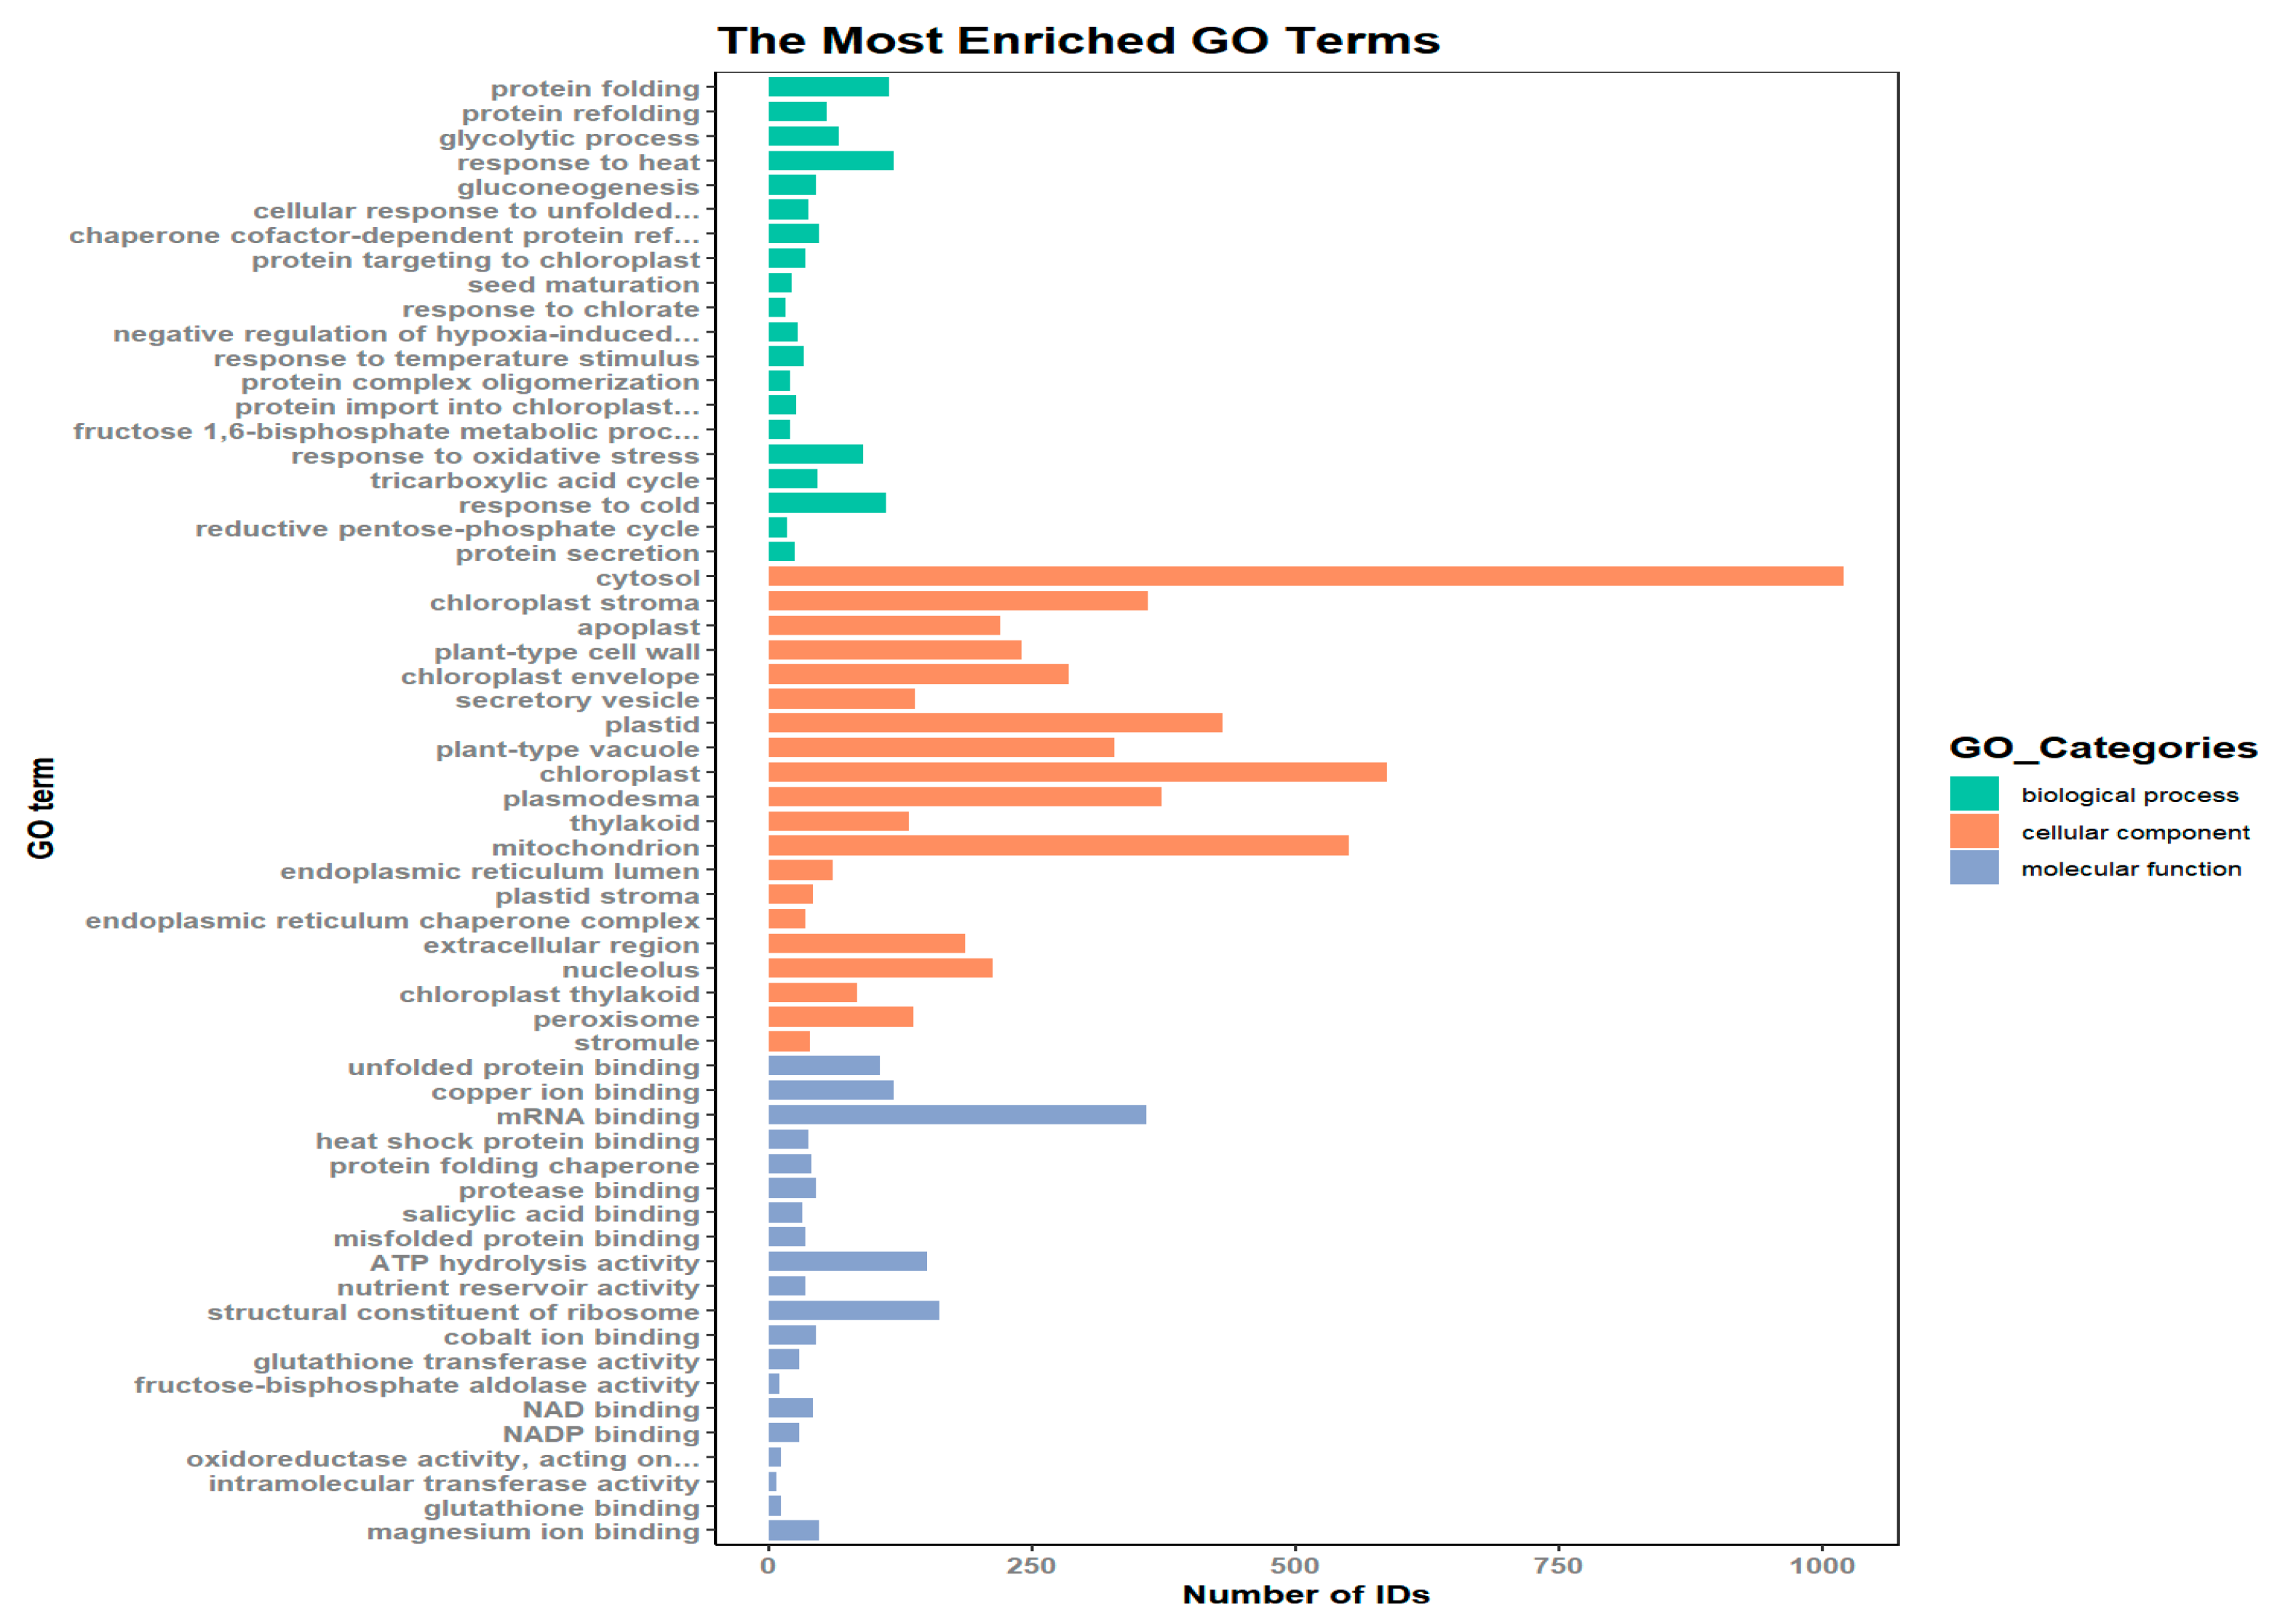
Figure 5.
Kidney Kyoto Encyclopedia (KEGG) pathway enrichment scatter plot of differentially expressed proteins in the kidney.
Figure 5.
Kidney Kyoto Encyclopedia (KEGG) pathway enrichment scatter plot of differentially expressed proteins in the kidney.
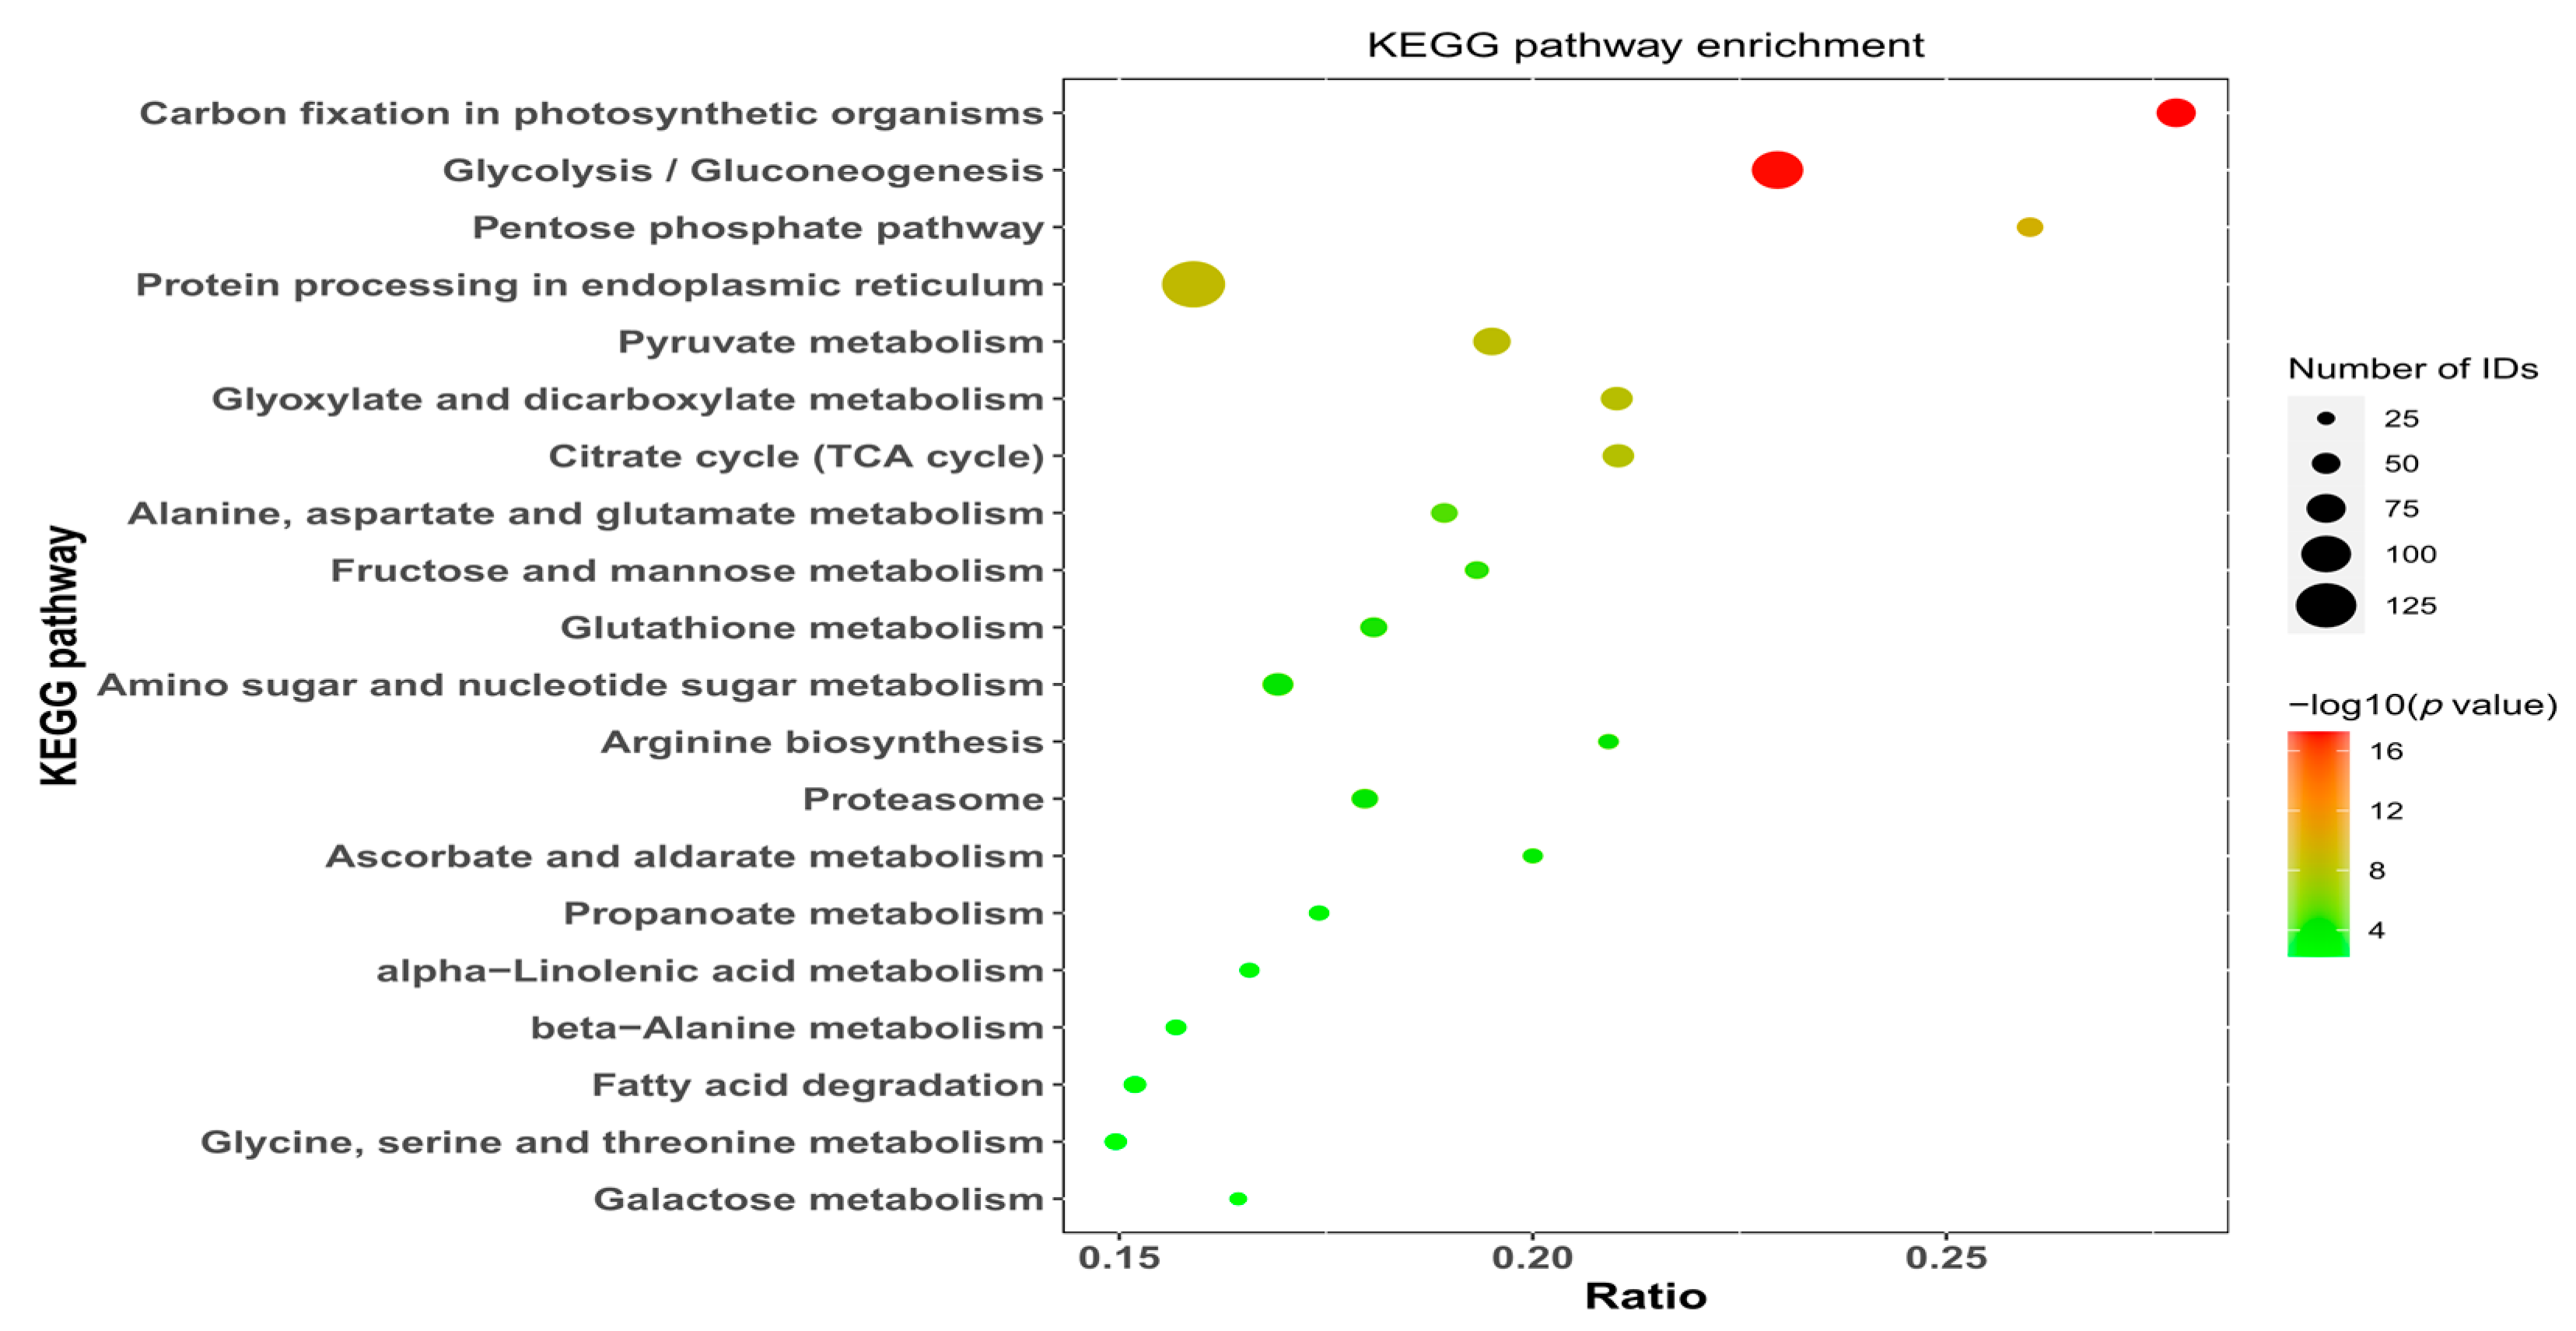
Figure 6.
COG classification map of differentially expressed proteins in seeds.

Figure 7.
Seed differentially expressed protein bioprocess enrichment map.
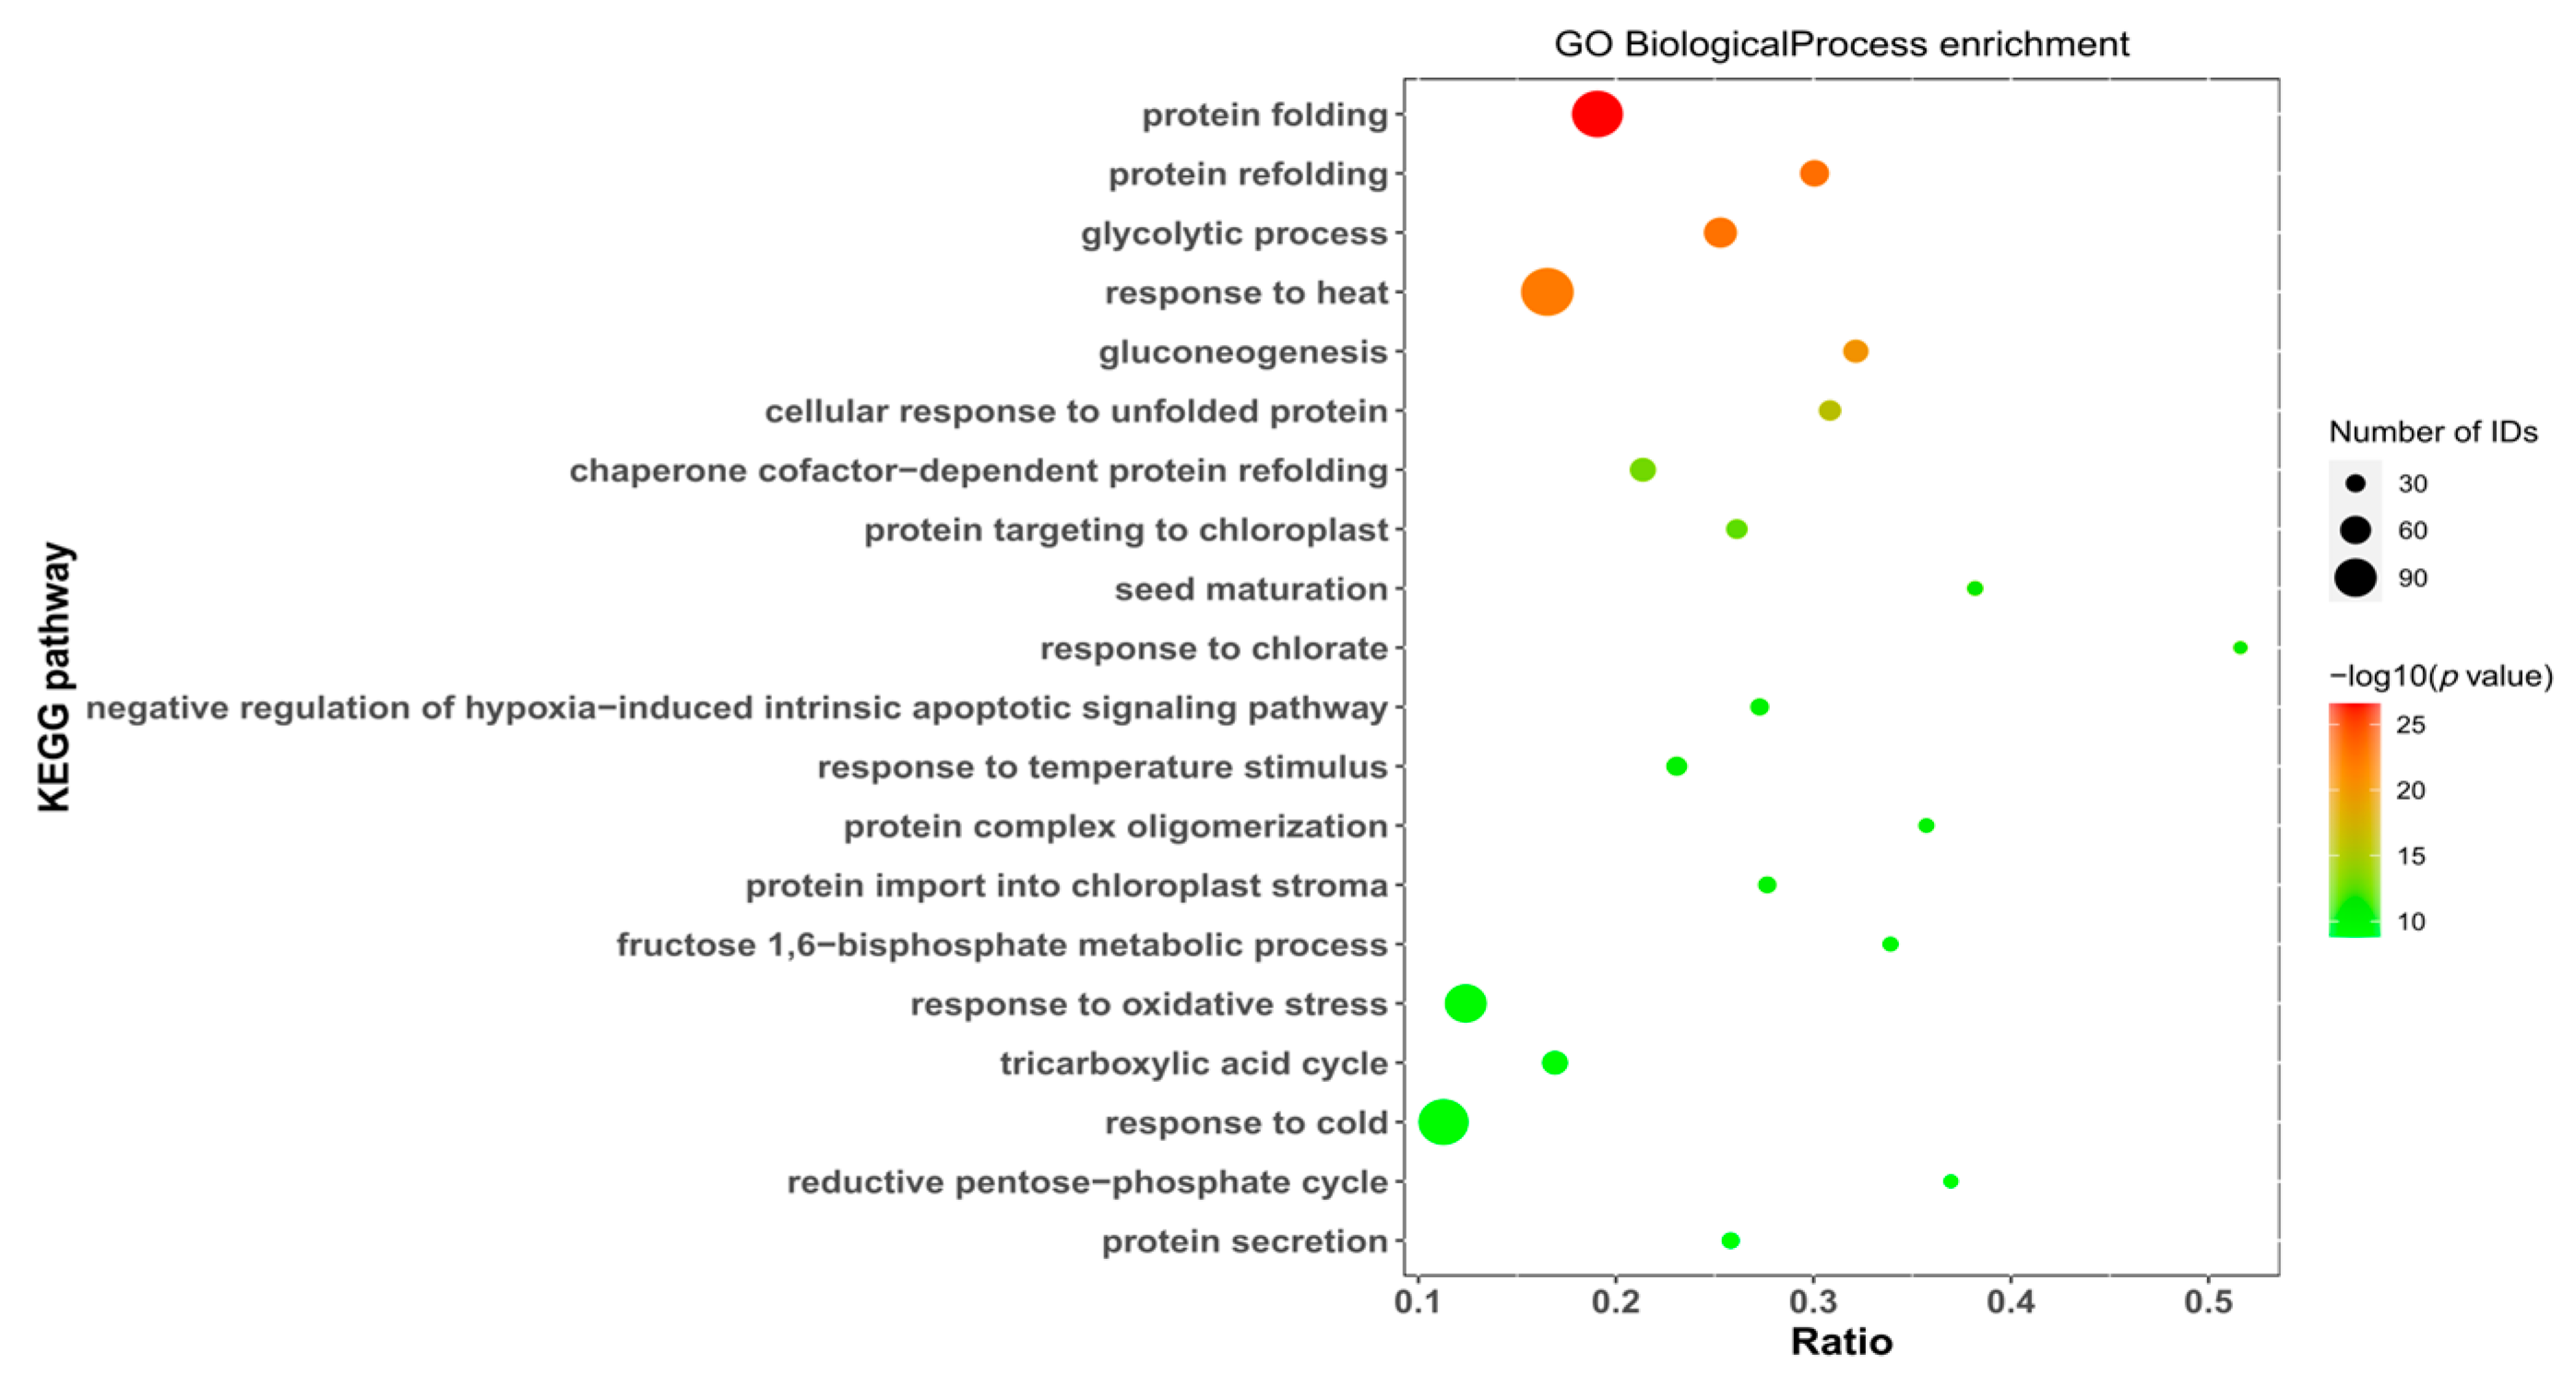
Figure 8.
Scatter plot of enriched KEGG pathway-annotated differentially expressed proteins.

Table 1.
Sample isotope labeling information.
| Samples | Labeling | Labeling Information |
|---|---|---|
| CK | CK1 | 128 C |
| CK | CK2 | 129 N |
| CK | CK3 | 129 C |
| GA3 | GA3_SC30 d1 | 130 N |
| GA3 | GA3_SC30 d2 | 130 C |
| GA3 | GA3_SC30 d3 | 131 N |
Table 2.
Experimental sample concentrations.
| Sample | Concentration (μg/μL) | Volumes (μL) | Total (μg) | Grade |
|---|---|---|---|---|
| CK1 | 9.58 | 900 | 8624.54 | A2 |
| CK2 | 9.35 | 900 | 8411.07 | A2 |
| CK3 | 9.6 | 800 | 7678.2 | A2 |
| GA3_SC30_d1 | 2.9 | 1000 | 2899.51 | A1 |
| GA3_SC30_d2 | 3.57 | 1000 | 3569.07 | A1 |
| GA3_SC30_d3 | 2.78 | 1000 | 2782.51 | A1 |
Table 3.
Proteome Discoverer 2.4 analysis parameters.
| Parameters | Value |
|---|---|
| Enzyme | Trypsin |
| Static modification | Carbamidomethyl (C) |
| Dynamic modification | M oxidation (15.995 Da); TMT-16plex (K, N-terminal) |
| Acetyl (protein N-terminal); | |
| Precursor ion mass tolerance | ±15 ppm |
| Fragment ion mass tolerance | ±0.02 Da |
| Max missed cleavages | 2 |
Table 4.
Statistics of the main differentially expressed proteins in dormant seeds.
| Type | GO_BP | Protein Number |
|---|---|---|
| Germination | Seed germination | 63 |
| Positive regulation of seed germination | 4 | |
| Regulation of seed germination | 42 | |
| Negative regulation of seed germination | 29 | |
| Dormancy | Seed dormancy | 83 |
| Release of seed from dormancy | 1 | |
| Regulation of seed dormancy process | 4 | |
| Embryo development ending in seed dormancy | 75 | |
| Antioxidase | Peroxidase | 4 |
| Superoxide dismutase | 8 | |
| Catalase | 4 | |
| Phytohormone | Gibberellin | 11 |
| Positive regulation of gibberellin biosynthetic process | 1 | |
| Gibberellic acid-mediated signaling pathway | 5 | |
| Response to abscisic acid | 83 | |
| Regulation of abscisic acid-activated signaling pathway | 12 | |
| Auxin-activated signaling pathway | 13 | |
| Response to ethylene | 19 | |
| Response to cytokinin | 7 | |
| Salicylic acid biosynthetic process | 27 | |
| Response to jasmonic acid | 35 | |
| Metabolism | Glyoxylate and dicarboxylate metabolism | 58 |
| Amino sugar and nucleotide sugar metabolism | 56 | |
| Starch and sucrose metabolism | 36 | |
| Sphingolipid metabolism | 6 | |
| Glycerophospholipid metabolism | 14 | |
| Glycerolipid metabolism | 16 | |
| Cyanoamino acid metabolism | 12 | |
| Folate biosynthesis | 6 | |
| Galactose metabolism | 24 | |
| Glutathione metabolism | 47 |
Disclaimer/Publisher’s Note: The statements, opinions and data contained in all publications are solely those of the individual author(s) and contributor(s) and not of MDPI and/or the editor(s). MDPI and/or the editor(s) disclaim responsibility for any injury to people or property resulting from any ideas, methods, instructions or products referred to in the content. |
© 2024 by the authors. Licensee MDPI, Basel, Switzerland. This article is an open access article distributed under the terms and conditions of the Creative Commons Attribution (CC BY) license (https://creativecommons.org/licenses/by/4.0/).
Share and Cite
MDPI and ACS Style
Ren, S.; Lv, G. A Proteomic Study on Seed Germination of Nitraria roborowskii Kom. Forests 2024, 15, 1661. https://doi.org/10.3390/f15091661
AMA Style
Ren S, Lv G. A Proteomic Study on Seed Germination of Nitraria roborowskii Kom. Forests. 2024; 15(9):1661. https://doi.org/10.3390/f15091661
Chicago/Turabian StyleRen, Shangfu, and Guanghui Lv. 2024. "A Proteomic Study on Seed Germination of Nitraria roborowskii Kom." Forests 15, no. 9: 1661. https://doi.org/10.3390/f15091661
Note that from the first issue of 2016, this journal uses article numbers instead of page numbers. See further details here.