Article

Prediction of Forest-Fire Occurrence in Eastern China Utilizing Deep Learning and Spatial Analysis

1
Wenzhou Key Laboratory of Resource Plant Innovation and Utilization, Zhejiang Institute of Subtropical Crops, Zhejiang Academy of Agricultural Sciences, Wenzhou 325005, China
2
School of Forestry, Central South University of Forestry and Technology, Changsha 410004, China
3
School of Surveying and Geoinformation Engineering, East China University of Technology, Nanchang 330013, China
4
Key Laboratory of Mine Environmental Monitoring and Improving around Poyang Lake of Ministry of Natural Resources, East China University of Technology, Nanchang 330013, China
5
Precision Forestry Key Laboratory of Beijing, Beijing Forestry University, Beijing 100083, China
6
School of Geographical Sciences, Harbin Normal University, Harbin 150028, China
7
Tianjin Centre of Geological Survey, China Geological Survey, Tianjin 300170, China
*
Author to whom correspondence should be addressed.
Forests 2024, 15(9), 1672; https://doi.org/10.3390/f15091672
Submission received: 22 August 2024 / Revised: 19 September 2024 / Accepted: 20 September 2024 / Published: 23 September 2024
(This article belongs to the Section Natural Hazards and Risk Management)

Abstract

:
Forest fires are a major natural calamity that inflict substantial harm on forest resources and the socio-economic landscape. The eastern region of China is particularly susceptible to frequent forest fires, characterized by high population density and vibrant economic activities. Precise forecasting in this area is essential for devising effective prevention strategies. This research utilizes a blend of kernel density analysis, autocorrelation analysis, and the standard deviation ellipse method, augmented by geographic information systems (GISs) and deep-learning techniques, to develop an accurate prediction system for forest-fire occurrences. The deep-learning model incorporates data on meteorological conditions, topography, vegetation, infrastructure, and socio-cultural factors to produce monthly forecasts and assessments. This approach enables the identification of spatial patterns and temporal trends in fire occurrences, enhancing both the precision and breadth of the predictions. The results show that global and local autocorrelation analyses reveal high-incidence areas mainly concentrated in Guangdong, Fujian, and Zhejiang provinces, with cities like Jiangmen exhibiting distinct concentration characteristics and a varied spatial distribution of fire occurrences. Kernel density analysis further pinpoints high-density fire zones primarily in Meizhou, Qingyuan, and Jiangmen in Guangdong Province, and Dongfang City in Hainan Province. Standard deviation ellipse and centroid shift analysis indicate a significant northward shift in the fire-occurrence centroid over the past 20 years, with an expanding spatial distribution range, decreasing flattening, and relatively stable fire-occurrence direction. The model performs effectively on the validation set, achieving an accuracy of 80.6%, an F1 score of 81.6%, and an AUC of 88.2%, demonstrating its practical applicability. Moreover, monthly fire zoning analysis reveals that high-incidence areas in spring and winter are mainly concentrated in Guangdong, Fujian, Zhejiang, and Hainan, while autumn shows widespread medium-incidence areas, and summer presents lower fire occurrences in most regions. These findings illustrate the influence of seasonal climate variations on fire occurrences and highlight the necessity for enhanced fire monitoring and prevention measures tailored to different seasons.

1. Introduction

Forests constitute vital components of land-based ecosystems, serving not only as a treasure trove of biodiversity but also playing a crucial role in mitigating global warming by absorbing carbon dioxide and releasing oxygen through photosynthesis [1,2,3]. Furthermore, forests protect soil, prevent erosion, maintain the water cycle, and provide clean water sources, making their conservation essential for ecological balance and sustainable development [4,5,6,7,8]. Forest fires not only destroy vast areas of plant and animal habitats but also release substantial amounts of carbon dioxide, thereby exacerbating global warming. Additionally, fires can lead to soil erosion and water pollution, which have long-lasting impacts on both ecological balance and human livelihoods [9,10,11]. Fire prediction is instrumental in identifying high-danger areas beforehand, enabling effective prevention and preparation measures. It optimizes resource allocation, reduces threats to life and property, and aids in developing emergency-response strategies to minimize the environmental damage caused by fires [12,13,14].
Forest-fire prediction and forecasting fall into three main categories: weather-based fire predictions, forecasts of fire incidents, and projections of fire behavior [15]. The occurrence and progression of forest fires are complex processes influenced by various factors, including weather patterns, landforms, fuel characteristics (such as type, moisture levels, and distribution), topographical features, and ignition sources (like human activities and natural causes) [10,12,16,17]. In particular, lightning and human activities are two frequently underestimated yet essential contributors to forest fires. Lightning strikes can directly trigger fires, particularly during dry periods and in regions with highly flammable vegetation, by providing the necessary spark in a conducive environment [18,19,20,21,22]. During dry seasons, the likelihood of lightning-induced fires increases as the combination of low moisture and high energy from electrical storms creates ideal conditions for ignition [23,24,25,26].
Forest-fire occurrence forecasting models illuminate the ways in which diverse fire-driving factors exert influence on the incidence of forest fires. These models can be categorized into five distinct types, each rooted in unique research perspectives: Deterministic–Probabilistic models, Empirical models, Physical models, Statistical models, and Machine Learning models [27,28,29]. Deterministic–Probabilistic models amalgamate deterministic analysis with probabilistic evaluation, striving to comprehensively account for both the explicit impacts of physical environmental conditions and the potential ramifications of uncertain factors in forecasting forest-fire occurrences [30,31,32,33]. Empirical models serve as instruments that lean on historical data and empirical rules to predict fire incidents by drawing on past instances [34,35]. Their strength resides in swift assessment and response, enabling timely initial judgments regarding fires. However, these models face constraints related to the completeness and precision of historical data, and they may encounter difficulties in adapting to novel environments or evolving conditions. Furthermore, the subjectivity inherent in expert knowledge may compromise the objectivity of prediction outcomes.
On the other hand, Deterministic–Probabilistic models excel in their capacity to integrate multiple deterministic and stochastic information, thereby enhancing the comprehensiveness and accuracy of predictions. Yet, their construction and application frequently necessitate intricate data processing and computational support, along with stringent demands for the setting and validation of model parameters. Physical models of forest-fire occurrence forecasting are based on physical mechanisms and accurately describe the forest-fire development process by incorporating multiple factors such as terrain, meteorology, and vegetation into numerical simulations and predictions [36]. These models can consider various factors including the combustion characteristics of fuels, topographic conditions, and meteorological factors, thereby providing a precise description of the fire development process [37,38,39,40,41]. These models are highly accurate and widely applicable, and they offer strong interpretability of the prediction results. However, their construction is complex, requiring high-quality data and significant computational resources.
Statistical models for forest-fire occurrence prediction rely on statistical analysis and data processing techniques to predict the probability and trends of forest-fire occurrence. These models are typically built by analyzing historical forest-fire data, topography, meteorological conditions, and vegetation status to forecast future fire occurrences. Common statistical models include logistic regression [42], Poisson regression [43], and negative binomial regression models [44]. Statistical models are based on historical fire data, and their coefficients can reveal the relationships between local fire occurrences and driving factors, which is important for understanding fire trend changes. However, selected explanatory variables often have some degree of correlation. While multicollinearity testing can help mitigate the impact of highly correlated factors on the model, it cannot completely eliminate the potential effects on prediction accuracy. Machine-learning models for forest-fire prediction primarily rely on mining and analyzing historical data. By constructing appropriate machine-learning algorithms, these models can learn the complex relationships between variables and forest-fire occurrences, allowing them to predict future fire [34,45,46]. Examples include Random Forest (RF) [47,48], Support Vector Machines (SVMs) [49,50,51,52], Gradient Boosting Decision Trees (GBDTs) [53,54,55], and Artificial Neural Networks (ANNs) [56,57,58]. Machine learning offers significant advantages in forest-fire prediction, such as the ability to handle large volumes of historical data and reveal complex patterns, which helps improve prediction accuracy and timeliness. However, traditional machine-learning methods often rely on feature engineering, requiring the manual extraction and selection of features, which may not fully uncover deep relationships within the data.
Deep learning, through automatic feature learning and multi-layered nonlinear mappings, proves to be more effective at capturing complex patterns and subtle differences within data, demonstrating superior performance and adaptability in forest-fire prediction [10,59,60]. Deep-learning models, by constructing deep neural network architectures, are capable of automatically extracting high-level abstract features from large and complex datasets. These features are crucial for understanding the intricate patterns and dynamic changes associated with forest-fire occurrences [61]. Compared to traditional machine-learning methods, deep learning offers enhanced capabilities in handling nonlinear relationships, large-scale data, and feature extraction. This results in improved accuracy and reliability in forest-fire forecasting. By leveraging multiple layers of neural networks, deep-learning models can learn hierarchical representations of data, allowing for a more nuanced understanding and prediction of fire dynamics, which often involve complex interactions between various influencing factors.
The objective of this study is to investigate the applicability of deep-learning methodologies and spatial analysis in forecasting the occurrence of forest fires. Specifically, the research aims to (i) utilize geographic information system (GIS) technology to analyze forest-fire patterns and trends over the past 20 years in eastern China; (ii) develop a deep-learning model that incorporates meteorological, lightning, topographic, socio-economic, and vegetation data for predicting forest fires; and (iii) generate monthly fire forecasts and maps to inform targeted prevention strategies, ultimately enhancing forest-fire prevention and management in the region.

2. Resources and Methods
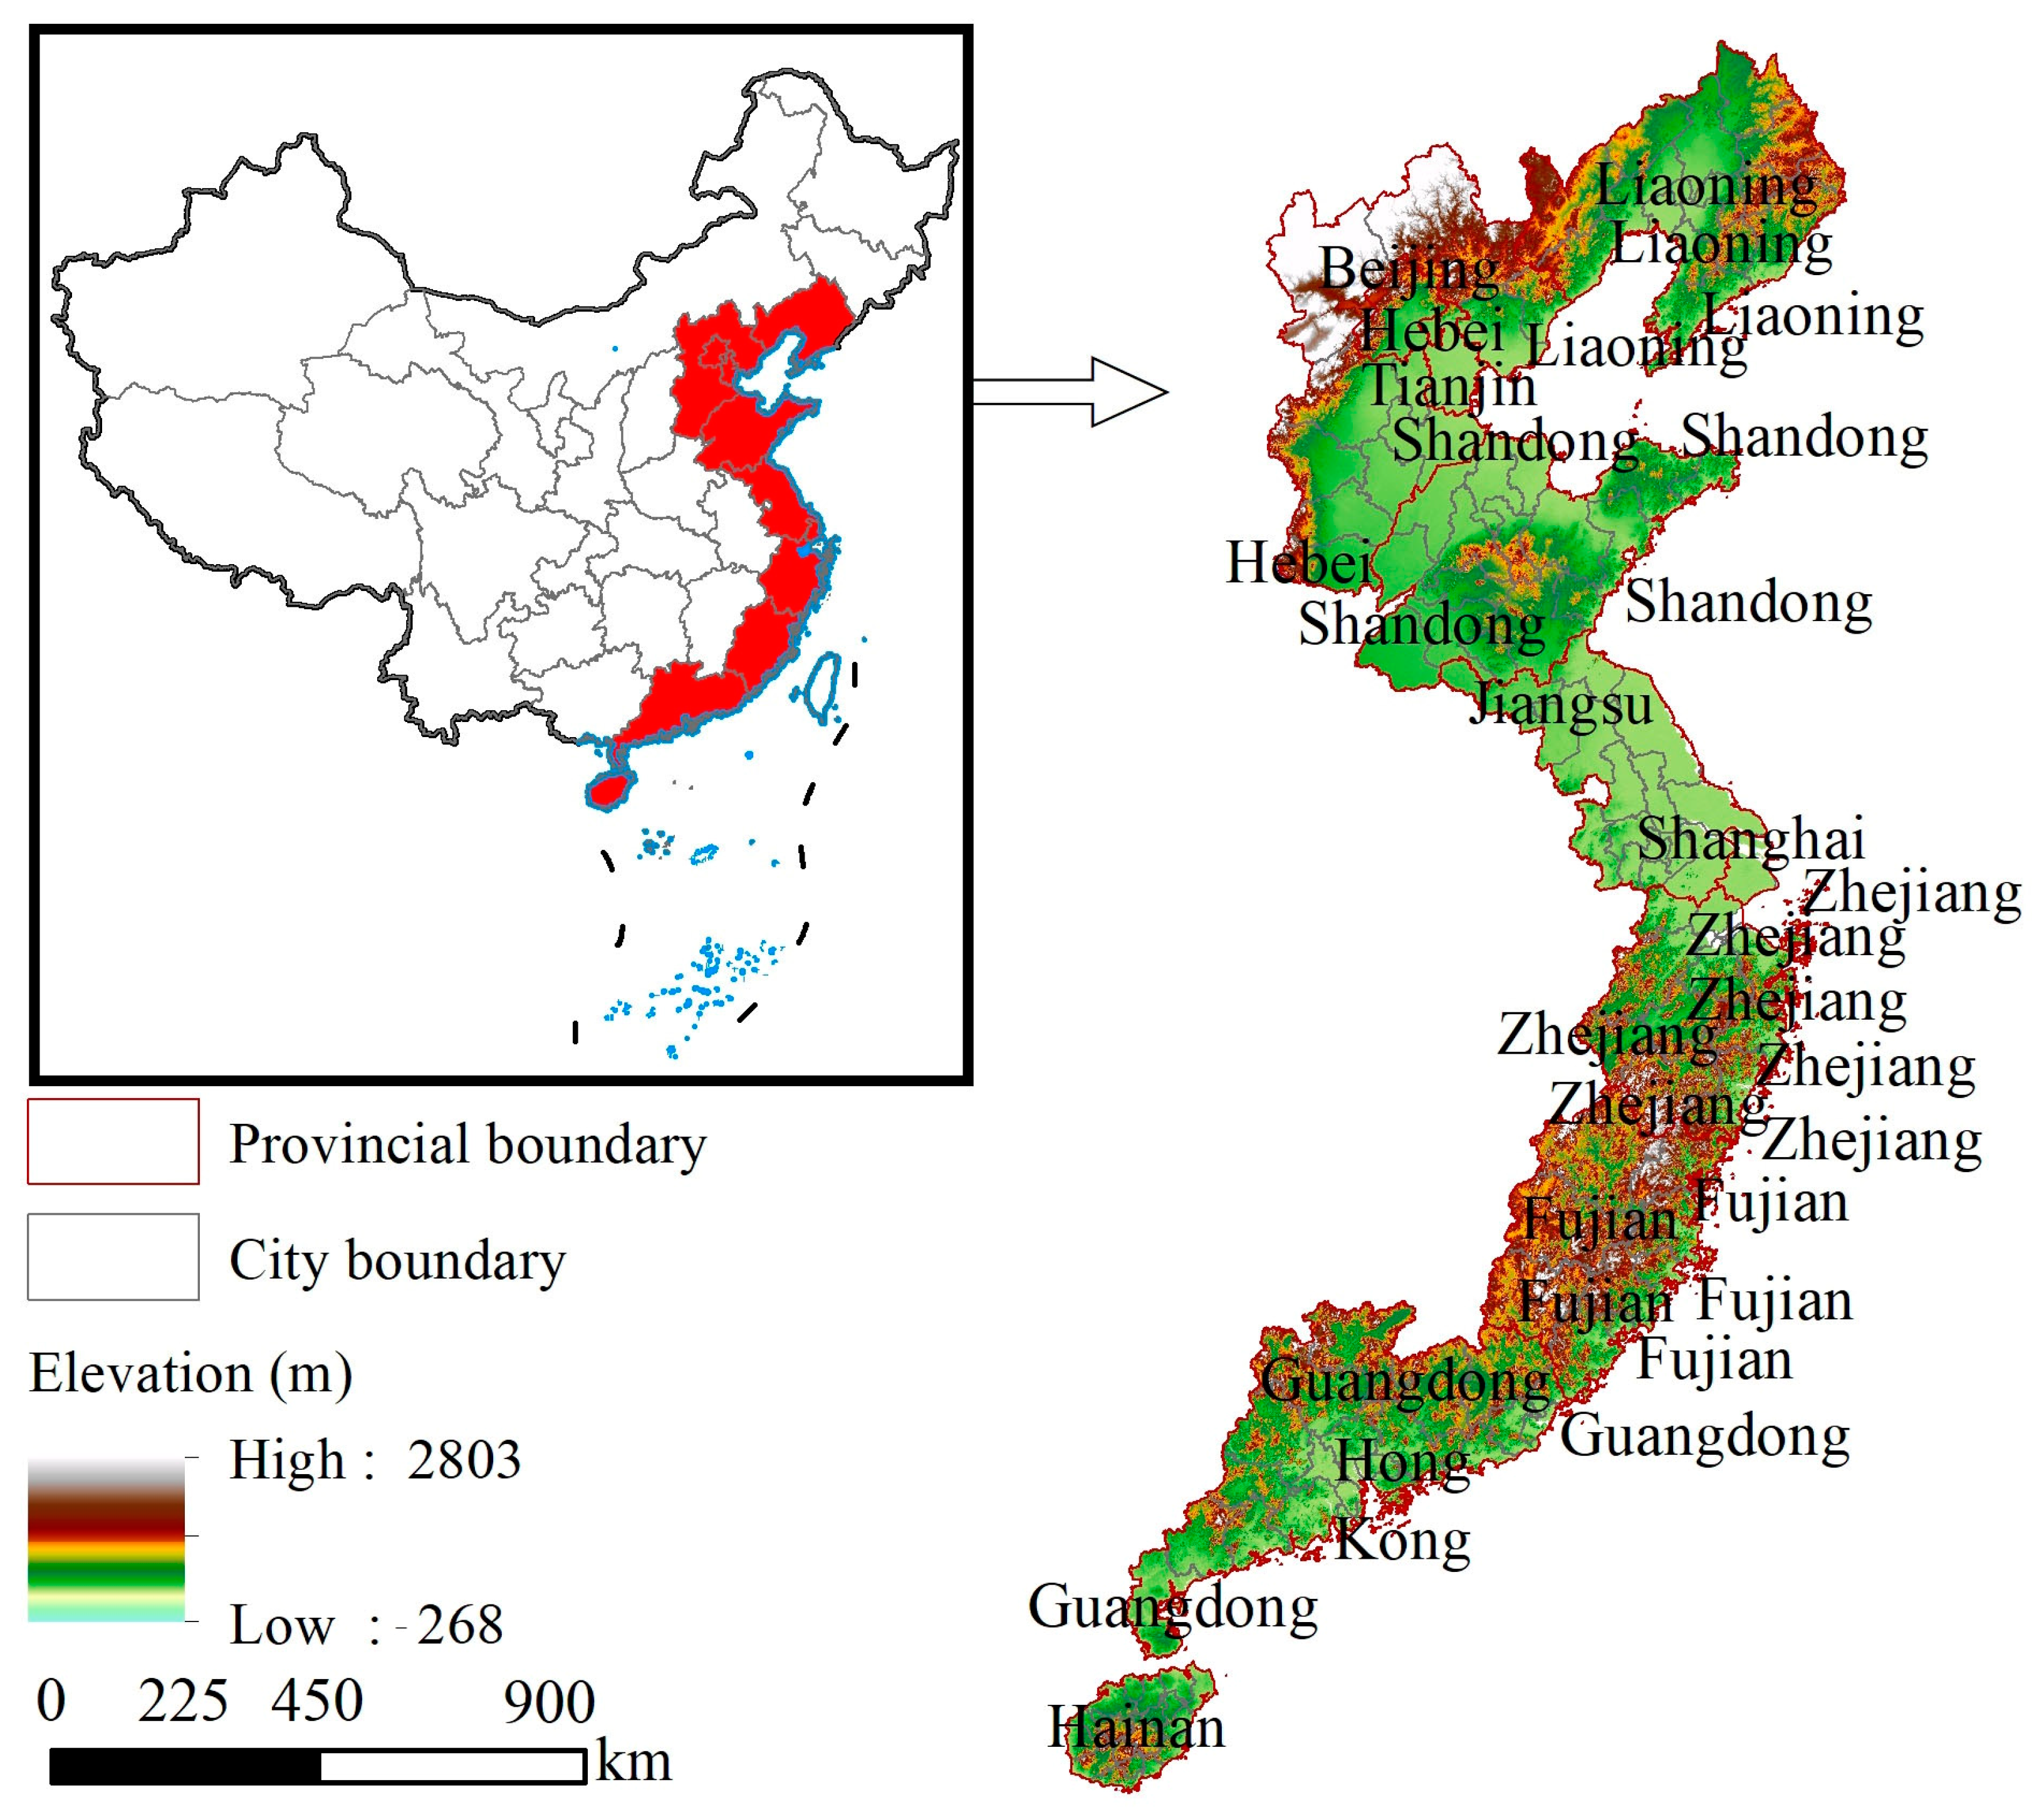
2.1. The Study Area

The eastern region of China, encompassing Liaoning, Hebei, Beijing, Tianjin, Shandong, Jiangsu, Shanghai, Guangdong, Fujian, and Hainan, features diverse climatic, topographic, and economic characteristics. Temperatures increase from north to south, with Liaoning and Hebei experiencing cold winters, while southern provinces like Guangdong and Hainan remain warm and humid year-round. Precipitation varies geographically, with the south receiving abundant rainfall compared to the relatively drier north. The region’s topography includes plains, hills, and some mountainous areas, and forest resources are unevenly distributed; southern provinces such as Fujian, Guangdong, and Hainan have higher forest cover, while northern areas have less. Densely populated, especially in major cities like Beijing and Shanghai, this region boasts the highest GDP in the country, making it the most economically developed area in China (Figure 1).

2.2. Data Sources

This study used data from the Moderate Resolution Imaging Spectroradiometer (MODIS), which was developed and manufactured under the leadership of the National Aeronautics and Space Administration (NASA) in the United States. The manufacturing process involved multiple NASA research centers and facilities across the country, rather than being limited to a single city. The data can be accessed at Earthdata MODIS (retrieved on 1 May 2023) [62,63]. The dataset information is based on the MOD14/MYD14 products. MODIS data feature a spatial resolution of 1 km, meaning that each data pixel represents an area of approximately 1 square kilometer on the ground. This resolution is particularly useful for large-scale fire monitoring, providing sufficient detail for regional fire-occurrence tracking and prediction. The data include ignition times, location coordinates, fire types, and confidence levels [64].
For this study, we specifically focused on analyzing high-confidence fire points, defined as those with a confidence level greater than 80%, and reviewed fire records from January 2001 to December 2019. In the kernel density analysis, the fire points (coordinates) were derived from the high-confidence fire occurrences in the MODIS dataset. These points were filtered to include only fire events with a confidence level exceeding 80%, ensuring the use of highly reliable data. The coordinates of these fire events were then applied to the kernel density analysis to identify areas with concentrated fire occurrences.
Meteorological data, encompassing variables such as temperature, precipitation, wind speed, pressure, and relative humidity, were utilized in this study. Topographic data, vegetation types, gross domestic product (GDP), population, and demographic information were sourced from the Data Cloud Platform (https://www.resdc.cn/, accessed on 1 May 2023). Additionally, road and settlement information was obtained from WebMap, as detailed in Table 1.
Furthermore, the lightning data utilized in this analysis are derived from the extensive and reputable Global Lightning Climatology of the World Wide Lightning Location Network (WWLLN). This dataset offers a diverse and unique perspective by capturing lightning events on a global scale, thereby minimizing redundancy and ensuring a comprehensive coverage [65,66,67]. The time of each lightning occurrence is recorded with precision to the microsecond. Individual lightning observation data are aggregated onto a geographic grid at the desired spatial resolution and corrected for WWLLN detection efficiency using hourly gridded fields provided by the network. Subsequently, these data are compiled into daily and monthly raster datasets.
Before being fed into the model, each individual layer that represents various forest-fire impact factors underwent a preprocessing step known as min–max normalization. This technique was employed to meticulously scale the pixel values within a standardized range of [0, 1]. By doing so, it ensured a uniform data representation across all layers. Such standardization is crucial as it eliminates discrepancies arising from different scales and units of measurement among the input features. This, in turn, augments the precision and dependability of the subsequent predictive modeling endeavors. Moreover, by normalizing the data, the model is better equipped to learn from the underlying patterns and relationships within the dataset, ultimately leading to more accurate and reliable predictions regarding forest-fire impacts (Figure 2).
Table 1. The main data source in this study.
ClassificationDataResolutionSourceReferences
Meteorological dataDaily minimum relative hu-midity, Mean wind speed, etc.-https://data.cma.cn, accessed on 1 May 2020[37,68]
Economic and SocialRoad Network, Public Holi-days, and Other Factors.1 km, 1 km,https://www.resdc.cn, accessed on 15 May 2020
https://www.webmap.cn, accessed on 2 May 2020
[27,28]
Lightning dataLightning observation data records latitude, longitude, and timestamps.--[65,66,67]
VegetationVegetation type1 kmhttps://www.resdc.cn, accessed on 7 May 2020[69]
TopographicSlope/Aspect/Elevation1 kmhttps://www.resdc.cn, accessed on 20 May 2020[70]

2.3. Method

Figure 3 presents a comprehensive illustration of the intricate research process conducted to explore the multifaceted nature of forest fires. Initially, (i) an extensive array of datasets was compiled, encompassing detailed fire records, land use patterns, meteorological observation data, socio-economic factors, vegetation descriptions, topographic data, and importantly, lightning data. This broad spectrum of information lays a solid foundation for subsequent research, ensuring that all pertinent aspects of forest fires are taken into account. To facilitate comparability and analyzability among these disparate data sources, sophisticated standardization techniques were meticulously applied. These techniques effectively mitigate amplitude differences between datasets, thereby enabling a more accurate and reliable analysis. By establishing a unified data framework, the research team ensured consistency and balance in their analyses across all datasets.
Subsequently, (ii) during the rigorous data preparation phase, a diverse range of methodologies was employed to meticulously identify and dissect fire events. These methodologies encompassed kernel density analysis, standard deviational ellipse analysis, centroid shift analysis, and spatial autocorrelation analysis.
Finally, (iii) to further enrich and refine these analytical insights, an advanced fully connected network deep-learning algorithm was incorporated into the study. This cutting-edge machine-learning approach seamlessly integrates a multitude of variables, including historical fire data, meteorological conditions, land use patterns, socio-economic factors, and lightning data, to attain unparalleled accuracy in predicting forest fires. By leveraging this methodology, the research team was able to undertake monthly prediction result mapping and zoning, ultimately proposing targeted and effective forest-fire prevention and control strategies.

2.3.1. Spatial Autocorrelation Analysis

Spatial autocorrelation is a statistical technique for examining relationships between spatial data and is commonly utilized in disciplines like geography and environmental science [71,72,73]. This analysis encompasses both global and local spatial autocorrelation. The global spatial autocorrelation elucidates the spatial distribution pattern throughout the entire study region, indicating whether the spatial data demonstrate clustering or dispersion tendencies, along with assessing the magnitude and statistical significance of such trends [74]. On the other hand, local spatial autocorrelation focuses on characterizing the spatial data features within distinct areas or units of the study region. It reveals the extent and statistical significance of spatial variability between each area or unit and its immediate surroundings [75]. In the study of forest fires, understanding spatial distribution characteristics, predicting fire occurrence, and developing effective prevention strategies are critically dependent on spatial autocorrelation analysis.
The formulas are outlined below [76]:
G l o b a l   a u t o c o r r e l a t i o n : I = n i = 1 n     j = 1 n     W i j x i x x j x n i = 1 n     j = 1 n     W i j x i x 2 ,
I stands for the global Moran’s I index, which measures spatial autocorrelation across the entire dataset. Here, n denotes the total number of spatial units analyzed. W i j stands for the weights assigned to spatial relationships that quantify the influence of spatial units i and j. Meanwhile, x i and x j are the values of the variable x for units i and j, respectively. Additionally, x signifies the average value of the variable x across all spatial units, providing a baseline for comparison.
L o c a l   a u t o c o r r e l a t i o n : I = n x i x j = 1 n     W i j x j x / i = 1 n   x i x 2 ,
I represents the local Moran’s I index, with n denoting the total number of spatial units analyzed. The term W i j stands for the weights assigned to spatial relationships assigned between units i and j, capturing their interrelationships. x i indicates the value of the variable x for unit i, while x denotes the average value of x across all spatial units. This index is used to assess the degree of spatial autocorrelation for each unit, helping to identify clusters or spatial patterns in the data.

2.3.2. Kernel Density Estimation (KDE)

KDE is a statistical technique employed for estimating the probability density of geographic spatial data points or line features within their surrounding neighborhoods. It calculates the density of points or lines over a unit area using a kernel function and fits a probability distribution curve to analyze the spatial clustering of the study object. In KDE, each point or line feature is treated as a smooth surface, with the height of the surface decreasing gradually as the distance from the point or line increases, until it reaches zero at the boundary defined by the search radius [77,78].
KDE estimates the probability density of forest-fire points in their surrounding neighborhoods without any prior density assumptions. By adjusting the bandwidth, KDE reveals the spatial distribution patterns and trends of forest fires. KDE assumes that points closer to a known fire have a higher influence, which diminishes as the distance increases. This assumption aligns well with the actual behavior of fire spread, where proximity to existing fires affects the likelihood of new fire occurrences.
Mathematical formula [79]:
f ( x ) = i = 1 n   1 π r 2 Φ d ix r
“r” defines how far we look for fire incidents, “n” tells us how many such incidents we have recorded, “dix” measures the spatial separation between specific fire points, and “Φ” accounts for the influence of this separation on our analysis.

2.3.3. Standard Deviation Ellipse

The standard deviation ellipse is a spatial statistical tool that generates an elliptical graphic reflecting the spatial distribution characteristics of data points by calculating the mean, variance, and covariance of the data [80,81].
The long axis of the ellipse represents the primary direction of data distribution, while the short axis represents the secondary direction. The size of the ellipse reflects the dispersion degree of the data points. In fields such as geographic data visualization, spatial pattern analysis, and outlier detection, the standard deviation ellipse plays a crucial role, helping researchers and decision-makers better understand the spatial distribution characteristics of data and make more informed decisions [82,83].
The formula is as follows [80]:
S D E x = i = 1 n     x i X 2 n ,   S D E y = i = 1 n     y i Y 2 n ,
In this equation, S D E x and S D E y   indicate the standard deviations associated with the variables x and y , respectively, with n denoting the count of observations. The standard deviation serves as a quantitative measure of variability or dispersion within a dataset. Specifically, S D E x captures the extent to which values of X , while S D E y indicates the degree of dispersion of y values around their mean Y .
tan θ = i = 1 n     x ~ i 2 i = 1 n     y ~ i 2 + i = 1 n     x ~ i 2 i = 1 n     y ~ i 2 2 + 4 i = 1 n   x ~ i y ~ i 2 2 i = 1 n     x ~ i y ~ i ,
tan θ denotes the tangent of the rotation angle, whereas x ˜ i and y ˜ i represent the coordinates of individual points i after they have been transformed or rotated within the new coordinate system. In simpler terms, tan θ describes the angle of rotation, and   x ~ i and y ~ i are the new positions of points i resulting from this rotation.
σ x = 2 i = 1 n     x ~ i cos θ y ~ i sin θ 2 n ,
σ y = 2 i = 1 n     x ~ i sin θ + y ~ i cos θ 2 n ,
In this equation, σ x and σ y denotes the tangent of the rotation angle, while x ˜ i and y ˜ i represent the transformed or rotated coordinates of the individual points i within the new coordinate system.
The use of the standard deviational ellipse method was employed to better capture the spatial distribution and directional trends of fire occurrences. This method calculates the spatial dispersion of fire events and provides insights into the overall orientation and spread of these occurrences over time. The ellipse’s axes offer valuable information on the directional bias and distribution range of the fire occurrences, allowing researchers to visualize the geographic shifts and expansion patterns of fire-prone areas.

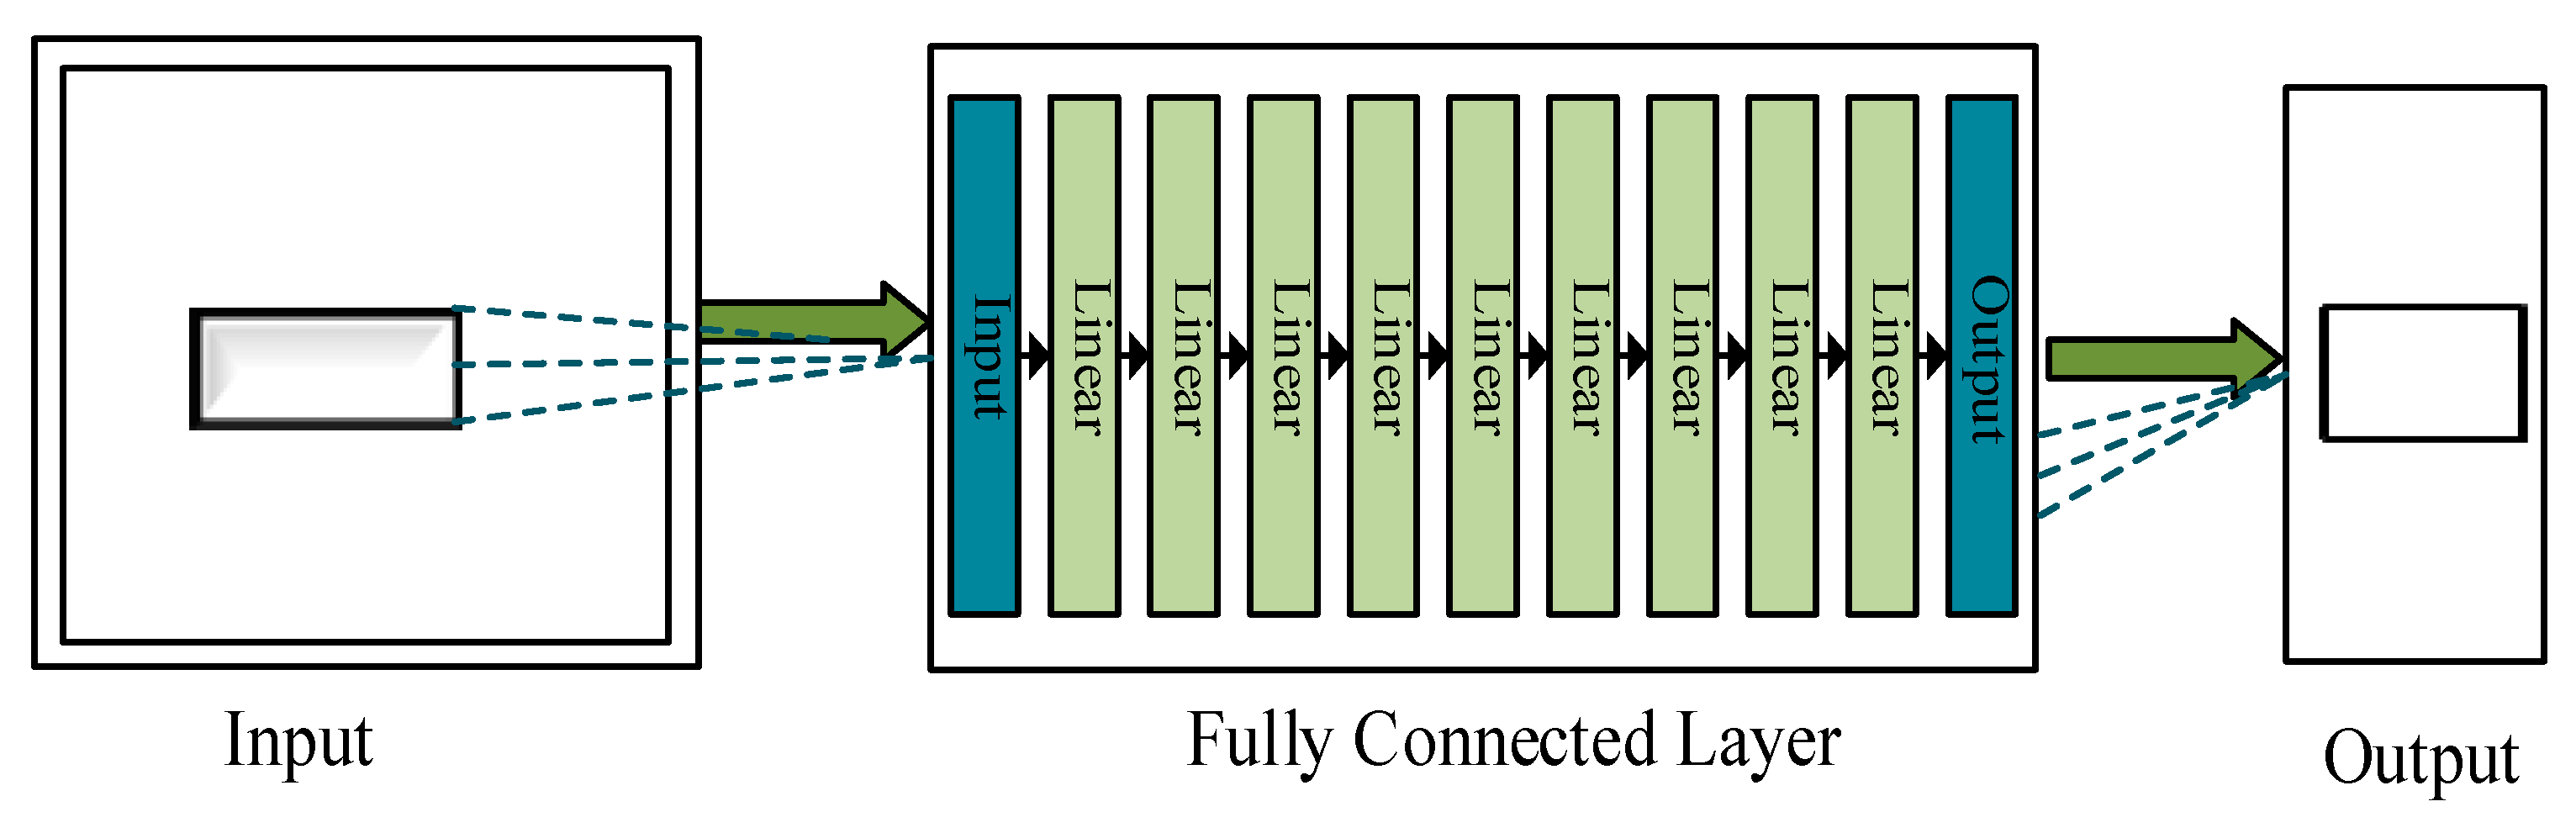
2.3.4. Deep Learning Model

As illustrated in Figure 4, the study employs a nine-layer fully connected neural network designed to effectively capture and leverage data features. The network consists of three fundamental components: linear layers, batch normalization layers, and LeakyReLU activation layers. (i) Linear Layers: These foundational layers perform linear transformations to extract basic features from the raw data, mapping the input through weighted matrices to generate preliminary feature representations. (ii) Batch Normalization Layers: This layer normalizes each batch of data, accelerating training, enhancing model stability, and mitigating overfitting by standardizing the data within each batch to have similar mean and variance. (iii) LeakyReLU Activation Layers: By introducing non-linearity, LeakyReLU enhances the model’s ability to learn complex data features and addresses the issue of zero gradients in the negative range of the standard ReLU activation function, allowing for more effective learning. The unique design of this network structure enables the efficient processing of input data through successive layers, ultimately providing accurate fire prediction results. The model also exhibits high flexibility and scalability, allowing for adjustments in the number of layers, nodes, and activation functions based on specific needs and task complexity.
The deep-learning method and network were trained using a 70:30 training-to-test data split. This approach ensured that a sufficient amount of data was dedicated to training the model, while the remaining data provided an objective evaluation of the model’s performance during testing. This split provides sufficient data for effective training while allowing the test set to offer a thorough and objective evaluation of the model’s performance. During training, hyperparameters such as learning rate, weight decay, momentum, and L1 regularization coefficient were meticulously tuned. The learning rate was set to 0.001 to ensure stable and effective parameter updates; weight decay was set to 0.01 to prevent overfitting and improve model generalization; momentum was set to 0.9 to accelerate convergence and reduce training oscillations; and the L1 regularization coefficient was set to 0.01 to control model complexity and enhance generalization.
The optimization process was carried out using the Stochastic Gradient Descent (SGD) algorithm, which is renowned for its efficiency and straightforward implementation. By iteratively optimizing with SGD, the model incrementally acquires pertinent features and patterns linked to fire occurrences, resulting in accurate predictions. To cater to the distinct requirements of fire prediction tasks, specific adjustments and improvements were implemented in the SGD algorithm, thereby bolstering its adaptability and enhancing its performance.
Optimization is performed using Stochastic Gradient Descent (SGD), which updates the model’s parameters based on individual or small batches of data samples [84,85]. The SGD update rule is
θ t + 1 = θ t η θ J θ ; x i , y i ,
θ t represents the model parameters (weights) at iteration t, η is the learning rate, controlling the step size for updates, θ J θ ; x i , y i is the gradient of the loss function J ( θ ) , calculated with respect to θ using a randomly selected training sample x i , y i .
Momentum is introduced to accelerate convergence by smoothing the update process, reducing oscillations in parameter updates. The momentum-based update is defined as
v t + 1 = μ v t + η θ J θ ; x i , y i ,
θ t + 1 = θ t v t + 1 ,
v t is the velocity, representing the accumulated gradient, μ is the momentum coefficient, which controls the contribution of past gradients.
By integrating SGD with momentum, the model effectively learns intricate patterns within fire-related data, ultimately producing precise prediction outcomes. This methodology not only accelerates the convergence rate but also elevates the overall performance of the model, rendering it exceptionally adaptable to large-scale datasets.

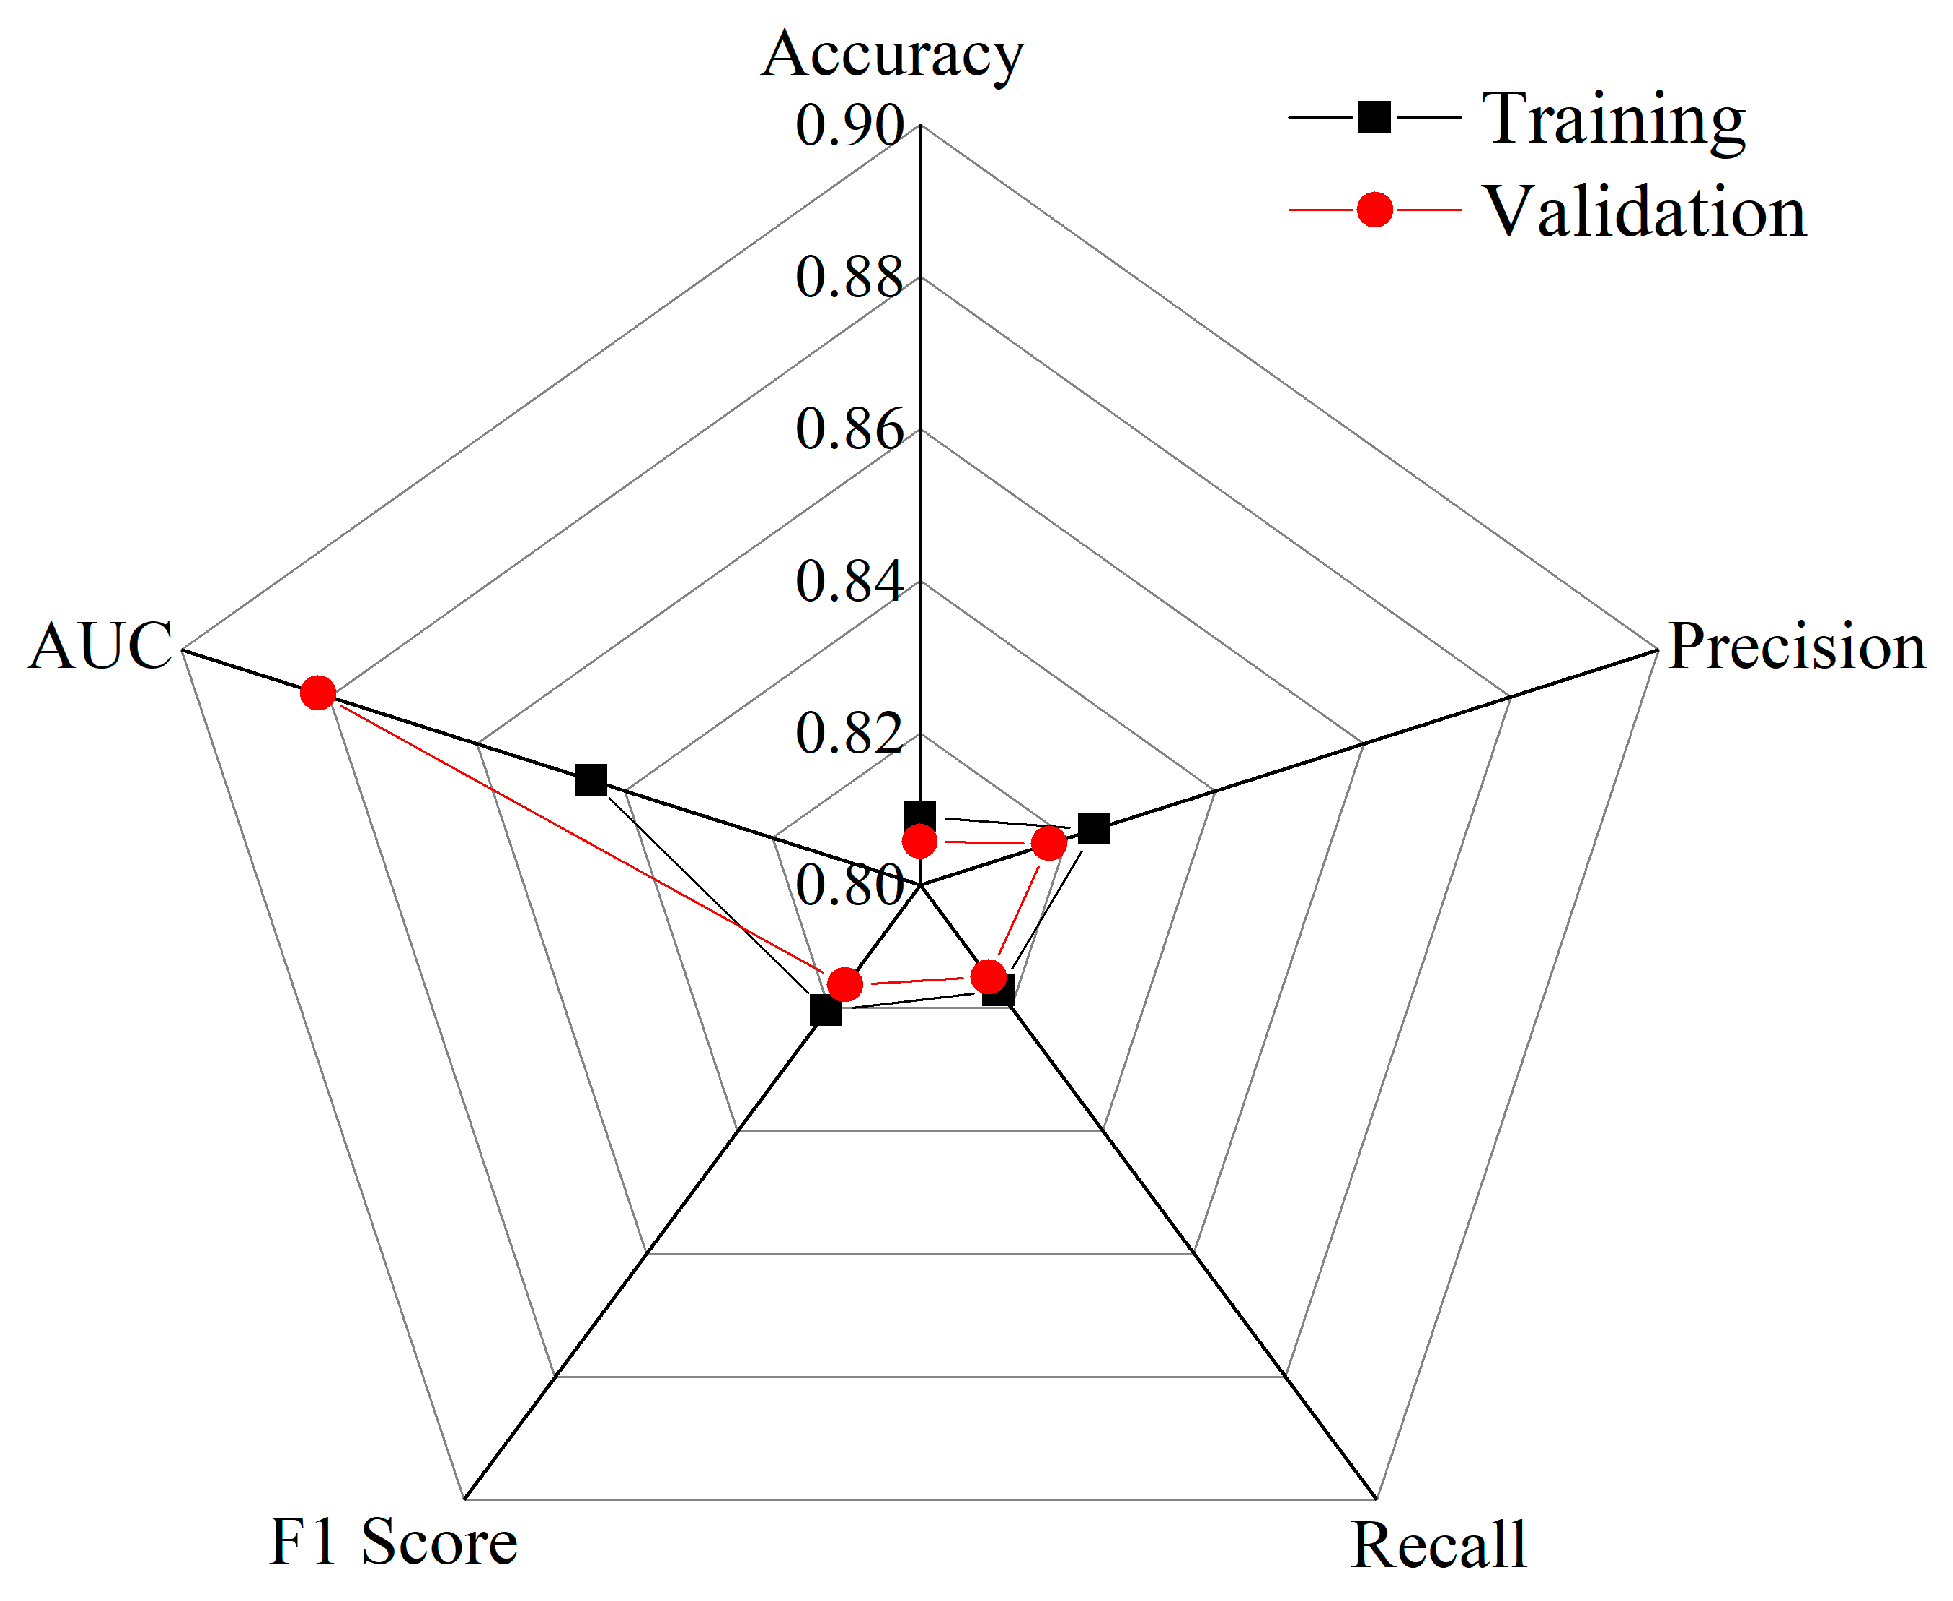
2.3.5. Assessment Criteria

When assessing model performance, several key metrics are essential: Accuracy , which measures the overall correctness of predictions across all classes; Precision , focusing on the accuracy of positive predictions by calculating the ratio of true positives to all positive predictions; Recall , evaluating the model’s ability to detect all true-positive instances by determining the proportion of true positives identified; the F 1 Score, offering a harmonized measure that combines both Precision and Recall into one indicator of balance between accuracy and completeness; and AUC, representing the model’s proficiency in distinguishing between classes as depicted by the ROC curve. Below are the formulas for these metrics, presented without redundancy [27,86,87]:
Accuracy = ( TP + TN ) / ( TP + FP + TN + FN ) ,
Precision = TP / ( TP + FP ) ,
Recall = TP / ( TP + FN ) ,
F 1 = 2   × ( Precision × Recall ) / ( Precision + Recall ) ,
In binary classification, True Positive ( TP ) signifies the count of instances where the model correctly identifies a positive case, while True Negative ( TN ) denotes the count of instances where the model accurately recognizes a negative case. Conversely, False Positive ( FP ) represents instances where the model incorrectly classifies a negative case as positive, and False Negative ( FN ) indicates instances where the model mistakenly classifies a positive case as negative. These metrics— TP , TN , FP , and FN —are crucial for evaluating a classification model’s performance as they offer insights into both correct and incorrect predictions for both classes, thereby providing a comprehensive understanding of the model’s ability to distinguish between positive and negative instances.

3. Results

3.1. Autocorrelation Analysis Findings on Forest Fire in Eastern China

As depicted in Figure 5, The H-H pattern, present in 19 cities including Maoming, Shaoguan, and Heyuan in Guangdong, Sanming, Nanping, and Ningde in Fujian, and Lishui and Wenzhou in Zhejiang, indicates high forest-fire frequencies and strong spatial clustering, suggesting these areas have elevated and concentrated fire occurrences and should be prioritized for prevention and control efforts. The L-H pattern, observed in 13 cities such as Zhanjiang and Guangzhou in Guangdong and Quanzhou and Putian in Fujian, shows overall low fire occurrences but higher occurrence in specific localized areas, highlighting the need for targeted fire-prevention measures in these regions. The H-L pattern, found in fewer cities like Jiangmen in Guangdong, features high overall fire frequencies but lacks significant spatial concentration, which may indicate regional differences or localized hotspots within the city.
Further, the local spatial autocorrelation analysis identifies 11 cities with an H-H pattern, mainly in Guangdong (such as Zhaoqing, Qingyuan, and Heyuan) and Fujian (such as Fuzhou, Sanming, and Longyan). These cities not only have high overall fire frequencies but also show strong spatial clustering. This finding highlights severe fire-occurrence points and spatial correlations, underscoring the need for enhanced fire-prevention and emergency-response mechanisms in these areas. Conversely, cities with an L-H pattern are relatively isolated, with only Guangzhou in Guangdong fitting this description. This suggests that while Guangzhou’s overall fire occurrence is low, certain localized areas may have higher concentrations of fire events, necessitating focused monitoring and prevention efforts. Cities with an L-L pattern (number 25) are mainly found in Jiangsu and Shandong provinces. These cities exhibit low fire-occurrence rates and lack significant spatial clustering, indicating relatively low fire occurrence and dispersed fire events.
Finally, regions identified as not significant in local spatial autocorrelation analysis display no clear clustering or dispersion patterns in fire occurrences, suggesting uniform fire occurrence. However, this uniformity might make it challenging to pinpoint potential occurrence areas accurately. Therefore, more refined analytical methods may be required to uncover latent fire-occurrence patterns in these areas, ensuring comprehensive and effective fire-prevention measures.

3.2. Results of Kernel Density Analysis in Eastern China

As shown in Figure 6, the kernel density analysis reveals the spatial distribution of fire occurrences across different regions. The results highlight high-density areas primarily in Meizhou, Qingyuan, and Jiangmen cities in Guangdong Province, as well as Dongfang City in Hainan Province. These high-density regions indicate a significant clustering of fire occurrences, suggesting elevated fire activity and a pronounced spatial concentration of incidents. In Guangdong Province, the high-density areas in Meizhou, Qingyuan, and Jiangmen point to increased fire occurrences, potentially related to local climate conditions, geographical features, vegetation cover, or socio-economic activities. Further investigation is needed to identify specific causes and contributing factors. Similarly, Dongfang City in Hainan exhibits notable fire-occurrence clustering, likely influenced by its climate and environmental conditions. Located in western Hainan Island, Dongfang may be affected by monsoon patterns and climate variability, leading to higher fire frequencies.
Identifying these high-density regions is crucial for developing targeted fire-prevention and emergency-response strategies. Enhanced monitoring and management of these high-occurrence areas, combined with efforts from local governments and relevant agencies, will help reduce fire occurrences, improve response capabilities, and protect residents and property. Additionally, the kernel density analysis results can guide resource allocation and the formulation of precise fire control strategies to effectively address potential fire occurrences.

3.3. Standard Deviation Ellipse Outcome Analysis

As illustrated in Figure 7 and Table 2, the analysis of the standard deviation ellipse and centroid shift for Eastern China unveils a pronounced trend of fire centroids migrating northward over the span of the past two decades. Specifically, the X-axis standard distance has seen a gradual increase, rising from 252.25 km in 2001 to 326.69 km in 2012, and ultimately reaching 327.22 km by 2019. This expansion indicates a broadening of the spatial distribution of forest fires along the X-axis. Similarly, the Y-axis standard distance has exhibited significant growth, escalating from 647.63 km in 2001 to 921.9 km in 2012, and culminating at 1364.01 km in 2019. This substantial increase suggests a notable expansion in the spatial distribution range of forest fires along the Y-axis, potentially mirroring an enlargement of fire areas.
With regard to the rotation angle, it has undergone minor fluctuations, decreasing from 29.46 degrees in 2001 to 19.71 degrees in 2012, and subsequently increasing slightly to 21.39 degrees by 2019. This variation indicates that, while the overall rotation angle has experienced slight shifts, the primary direction of fire occurrences has remained relatively stable, with no discernible alteration in the spatial distribution direction.
Furthermore, the oblateness value has decreased over time, dropping from 0.38 in 2001 to 0.35 in 2012, and further declining to 0.23 in 2019. This reduction in oblateness suggests that the spatial distribution of fire occurrences has become more circular, potentially indicating an increase in the uniformity of fire occurrences within the region.

3.4. Assessment of Predictive Model

As illustrated in Figure 8, the model demonstrates consistent performance across both the training and validation datasets. The model demonstrated strong performance on the training set, attaining an accuracy rate of 85.50%, along with a precision of 87.50%, a recall of 86.50%, an F1 score of 87.00%, and an AUC of 90.20%. Likewise, the validation set exhibited remarkable results, with an accuracy of 84.80%, a precision of 86.80%, a recall of 85.70%, an F1 score of 86.25%, and an AUC of 89.70%. These results highlight the model’s strong classification and prediction capabilities across different datasets.
Moreover, the model’s strong classification and prediction capabilities can contribute to the development of early warning systems for forest fires. By leveraging real-time data and advanced machine-learning algorithms, these systems can provide timely alerts to relevant stakeholders, enabling them to take proactive measures to prevent or mitigate the impact of forest fires.
In summary, the model’s performance in forest-fire prediction highlights its potential to enhance the effectiveness of forest-fire management and contribute to the protection of natural resources and human safety.

3.5. Regions for Forest-Fire Predictions

As illustrated in Figure 9, the monthly forest-fire occurrence zoning in Eastern China is categorized into four stages:
(i) Spring (March to May): High-occurrence areas include Jiangmen, Heyuan, and Guangzhou in Guangdong; Fuzhou and Ningde in Fujian; Wenzhou in Zhejiang; Yantai in Shandong; and Jinzhou in Liaoning. During spring, rising temperatures and the revival of vegetation, combined with persistently dry conditions, significantly increase the likelihood of forest fires. The combination of high winds and elevated temperatures further exacerbates the occurrence. To mitigate these fire occurrences, it is important to enhance monitoring and early warning systems, regularly clear flammable materials, increase patrols in dry, windy areas, and boost public awareness through educational campaigns.
(ii) Summer (June to August): Forest-fire occurrence is generally lower in summer due to abundant rainfall, high humidity, and lush vegetation, which collectively reduce fire occurrences. However, localized high temperatures and periods of dry conditions can still elevate fire occurrence in specific areas. To address this, fire safety awareness should be enhanced through community outreach and educational campaigns.
(iii) Autumn (September to November): Medium-occurrence areas in autumn include Qingyuan, Heyuan, and Shaoguan in Guangdong; Sanming, Nanping, and Fuzhou in Fujian; Lishui and Wenzhou in Zhejiang; Dongfang and Haikou in Hainan; and Yingkou, Anshan, and Fuxin in Liaoning. The transition to cooler temperatures and reduced rainfall leads to drier conditions, which, combined with higher wind speeds, increase fire occurrence. To manage these occurrences, fire-prevention efforts should be strengthened by conducting regular drills and emergency-response exercises, clearing dried vegetation, managing water sources, and promoting regional cooperation and information-sharing among local authorities and communities to enhance overall preparedness.
(iv) Winter (December to February): High-occurrence areas during winter include Qingyuan, Heyuan, and Shaoguan in Guangdong; Sanming, Nanping, and Fuzhou in Fujian; Lishui and Wenzhou in Zhejiang; Dongfang and Haikou in Hainan. Winter conditions, characterized by cold temperatures, dry air, and withered vegetation, contribute to an increased likelihood of forest-fire occurrence. To mitigate these occurrences, it is essential to intensify inspections, manage fire sources in high-occurrence areas, promptly address potential hazards, enhance community coordination, and invest in fire-prevention infrastructure. Additionally, promoting community awareness and preparedness through educational programs and emergency-response planning will further reduce winter fire occurrences.

4. Discussion

Forest fires constitute a grave natural disaster, exerting substantial impacts on environmental resources and socio-economic systems [48,88]. In Eastern China, where forest fires are a frequent occurrence amidst dense populations and vibrant economic activities, the effective prediction and management of their occurrences are of paramount importance. The findings presented here provide invaluable insights that can enhance fire-prevention strategies in the region.
Our analysis has pinpointed Guangdong, Fujian, and Zhejiang provinces as the primary high-occurrence areas for forest fires, with cities like Jiangmen exhibiting a notable concentration of fire incidents. This spatial concentration is of great significance as it underscores the regions where fire management resources and strategies ought to be concentrated. This finding is in agreement with previous research that has also identified heightened forest-fire incidences in specific areas, which can be attributed to factors such as vegetation types, climatic conditions, and human activities [28,46].
The analyses employing the standard deviation ellipse and centroid shift reveal a significant northward migration of the centroid of fire occurrences over the past two decades. Furthermore, the spatial distribution range of fire occurrences has broadened, while the oblateness has diminished, indicating that fires have become more widespread and are no longer restricted to particular regions. Despite this expansion, the fundamental patterns of fire occurrences remain consistent, mirroring broader climatic and environmental shifts, such as changes in precipitation patterns and vegetation growth, which impact fire behavior. This spatial expansion of fire occurrences underscores the necessity for adaptive management strategies to cope with these evolving patterns.
This study draws upon meteorological, topographical, vegetation, infrastructure, and socio-cultural data; however, the spatial and temporal resolutions of these datasets may impose limitations on the model’s precision and predictive capabilities. In areas where data are sparse or of low quality, the accuracy of predictions may be compromised. To enhance the model’s predictive power and precision, future research should incorporate additional data types, such as remote sensing images, high-resolution topographical data, and a broader range of socio-economic data [45,89,90]. Continual updates to the data are also essential to reflect the latest environmental changes. Furthermore, regional adjustments and localizations of the model should be considered to accommodate diverse geographic and climatic conditions. Local validation and adjustments should be implemented to improve the model’s generalizability.
Using data from the World Wide Lightning Location Network (WWLLN) to predict the likelihood of forest fires is a highly promising research area, as lightning is one of the key natural factors that can ignite wildfires. By combining WWLLN lightning data with other environmental factors, researchers can significantly enhance the accuracy of forest-fire prediction models, particularly those focused on fires ignited by lightning. This approach contributes to the development of more comprehensive prediction models. In fact, lightning accounts for a substantial proportion of wildfires in various regions, such as 68.28% in the Daxinganling Mountains of China and 80% of the burned area in high-latitude regions [91,92]. Although WWLLN data are valuable, they may underestimate the number of lightning events compared to regional networks, which could affect the accuracy of predictions [93]. Although WWLLN data provide a solid foundation for predicting forest fires ignited by lightning, integrating them with other environmental data and advanced machine-learning techniques is crucial for improving prediction accuracy. However, challenges such as the under-reporting of data and regional variability must be addressed to enhance the reliability of these models.
While lightning data are a critical factor in forest-fire prediction [18,25,94], given the scarcity of lightning occurrences in the study area and the challenges associated with data collection, particularly in regions with sparse lightning-monitoring networks, this study did not utilize such data directly. Instead, WWLLN data were used as a substitute. The initial focus was on integrating easily accessible meteorological, topographical, and vegetation data to develop a high-precision predictive model. Incorporating lightning data could potentially increase model complexity and computational load, thereby affecting model stability and reliability. Therefore, this study prioritized other data sources to ensure the model’s effectiveness. In future research, the integration of more refined lightning data should be considered to enhance the comprehensiveness and accuracy of forest-fire predictions. This can be achieved by establishing denser lightning-monitoring networks and developing efficient data processing methods. The incorporation of precise lightning data will facilitate a deeper analysis of fire causes, ultimately improving the overall performance of the predictive model. Future developments should focus on optimizing the collection and processing of lightning data to ensure effective integration with existing data sources, thereby enhancing the accuracy and practicality of the prediction system.

5. Conclusions

This study developed a high-precision forest-fire prediction system by integrating kernel density analysis, autocorrelation analysis, standard deviation ellipse methods, GIS, deep learning, and notably, WWLLN lightning data. The study’s significance lies in its capacity to address the escalating demand for precise fire-occurrence predictions, particularly in regions with substantial economic activity and considerable ecological impact. The key findings and conclusions are as follows:
(i) Identification of High-Occurrence Zones: The system effectively pinpointed high-occurrence areas, with a particular emphasis on Guangdong, Fujian, and Zhejiang provinces. Jiangmen stood out due to its concentration of fire occurrences and spatial diversity. Kernel density analysis further underscored Meizhou, Qingyuan, and Dongfang in Hainan as high-density fire zones. These areas should be prioritized for targeted fire-prevention efforts, especially considering their recurring vulnerability and concentrated fire events. The inclusion of WWLLN lightning data refined the identification of these zones by correlating lightning activity with fire occurrences.
(ii) Shift in Fire-Occurrence Patterns: The analyses revealed a significant northward shift in fire occurrences over the past 20 years, characterized by an expanding spatial distribution but stable directional trends. This shift indicates that fire-prone areas are dynamic, necessitating geographically adjusted prevention strategies to accommodate changes in fire distribution patterns. The steady directional trends also suggest that fire-occurrence drivers, such as meteorological and environmental factors, including lightning activity captured by WWLLN, remain influential over time. This underscores the importance of continuous monitoring and adaptive fire management strategies.
(iii) Model Performance, Seasonal Variation, and Lightning Correlation: The deep-learning model, augmented with WWLLN lightning data, demonstrated high performance on the validation set, achieving an accuracy of 80.6%, an F1 score of 81.6%, and an AUC of 88.2%. This validates its robustness and effectiveness for real-world applications. The monthly analysis revealed that fire occurrences peak in spring and winter, with moderate levels in autumn and lower occurrences in summer. This seasonal variation highlights the need for tailored prevention measures, as fire activity fluctuates with changing climatic conditions. Specifically, spring and winter should be prioritized for fire monitoring and resource deployment, while autumn requires moderate attention, and summer poses relatively lower fire risks. Additionally, the correlation between WWLLN lightning data and fire occurrences underscores the importance of considering lightning activity in seasonal fire-prevention strategies.
This study’s main findings include the identification of key fire-prone areas, the detection of shifting fire-occurrence patterns over time, and the validation of a high-performing prediction model. These findings are essential for refining fire-prevention strategies and ensuring that efforts are targeted at the most vulnerable regions during the most critical seasons. By expanding on these findings and offering targeted recommendations for fire management, the study adds substantial value to the existing body of research on forest-fire prediction and prevention.

Author Contributions

J.L. and D.H. were instrumental in the conception and oversight of the study. J.L. additionally spearheaded the acquisition of funding and project management, whereas D.H. was vital in the validation process and contributed substantially to writing, reviewing, and editing the manuscript. Y.S., A.W., Y.L., J.W. and C.C. made notable contributions to data organization, rigorous analysis, and data visualization. Specifically, Y.S. and J.L. were also responsible for drafting the initial manuscript. X.L. provided crucial assistance in the validation phase. All authors have read and agreed to the published version of the manuscript.

Funding

This research endeavor was generously funded by the Jiangxi Provincial Natural Science Foundation (20224BAB213038), the Wenzhou High-level Innovation Team “Coastal Characteristic Plant Innovation and Utilization Project” (NY202401), the East China University of Technology Ph.D. Project (DHBK2019179), as well as by the Open Fund of Key Laboratory of Mine Environmental Monitoring and Improving around Poyang Lake, Ministry of Natural Resources (MEMI-2021-2022-16).

Data Availability Statement

The data underpinning the conclusions of this study can be obtained from the corresponding author, provided that the request is reasonable and adheres to applicable data sharing policies and ethical considerations. This ensures that the research findings are supported by verifiable and accessible data, fostering transparency and reproducibility in scientific research.

Acknowledgments

We express our heartfelt appreciation to the Editorial team for their outstanding mentorship and assistance throughout the entire review procedure. We are particularly grateful to the reviewers for their perceptive remarks and valuable suggestions, which have substantially enhanced the overall quality of our manuscript.

Conflicts of Interest

The authors declare that they have no conflicts of interest to disclose. There are no financial or personal relationships that could influence the work presented in this manuscript.

References

  1. Garrett, R.D.; Cammelli, F.; Ferreira, J.; Levy, S.A.; Valentim, J.; Vieira, I. Forests and sustainable development in the Brazilian Amazon: History, trends, and future prospects. Annu. Rev. Environ. Resour. 2021, 46, 625–652. [Google Scholar] [CrossRef]
  2. Hahn, W.A.; Knoke, T. Sustainable development and sustainable forestry: Analogies, differences, and the role of flexibility. Eur. J. For. Res. 2010, 129, 787–801. [Google Scholar] [CrossRef]
  3. Qiu, Z.; Feng, Z.; Song, Y.; Li, M.; Zhang, P. Carbon sequestration potential of forest vegetation in China from 2003 to 2050: Predicting forest vegetation growth based on climate and the environment. J. Clean. Prod. 2020, 252, 119715. [Google Scholar] [CrossRef]
  4. Paudel, A.; Yadav, A. Soil conservation practices in forest of Nepal. J. Clean. WAS 2021, 5, 73–77. [Google Scholar] [CrossRef]
  5. Goeking, S.A.; Tarboton, D.G. Forests and water yield: A synthesis of disturbance effects on streamflow and snowpack in western coniferous forests. J. For. 2020, 118, 172–192. [Google Scholar] [CrossRef]
  6. Yakui, S.; Lei, W.; Changming, Z.; Hui, F.; Xin, Z.; Duan, H.; Li, T. Forest survey and spatio-temporal analysis in West Tianshan mountains supported by Google Earth Engine. Bull. Surv. Mapp. 2020, 13. [Google Scholar]
  7. Yakui, S.; Changming, Z.; Xinliang, X.; Xin, Z.; Qian, S. Remote sensing mapping and spatiotemporal changes of forest land in Anhui Province from 2000 to 2012. Ecol. Sci. 2020, 38, 15–21. [Google Scholar]
  8. Valjarević, A.; Djekić, T.; Stevanović, V.; Ivanović, R.; Jandziković, B. GIS numerical and remote sensing analyses of forest changes in the Toplica region for the period of 1953–2013. Appl. Geogr. 2018, 92, 131–139. [Google Scholar] [CrossRef]
  9. Agbeshie, A.A.; Abugre, S.; Atta-Darkwa, T.; Awuah, R. A review of the effects of forest fire on soil properties. J. For. Res. 2022, 33, 1419–1441. [Google Scholar] [CrossRef]
  10. Naderpour, M.; Rizeei, H.M.; Ramezani, F. Forest fire risk prediction: A spatial deep neural network-based framework. Remote Sens. 2021, 13, 2513. [Google Scholar] [CrossRef]
  11. Xiong, Q.; Luo, X.; Liang, P.; Xiao, Y.; Xiao, Q.; Sun, H.; Pan, K.; Wang, L.; Li, L.; Pang, X. Fire from policy, human interventions, or biophysical factors? Temporal–spatial patterns of forest fire in southwestern China. For. Ecol. Manag. 2020, 474, 118381. [Google Scholar] [CrossRef]
  12. Bhadoria, R.S.; Pandey, M.K.; Kundu, P. RVFR: Random vector forest regression model for integrated & enhanced approach in forest fires predictions. Ecol. Indic. 2021, 66, 101471. [Google Scholar]
  13. Preeti, T.; Kanakaraddi, S.; Beelagi, A.; Malagi, S.; Sudi, A. Forest fire prediction using machine learning techniques. In Proceedings of the 2021 International Conference on Intelligent Technologies (CONIT), Hubli, India, 25–27 June 2021; pp. 1–6. [Google Scholar]
  14. Sevinc, V.; Kucuk, O.; Goltas, M. A Bayesian network model for prediction and analysis of possible forest fire causes. For. Ecol. Manag. 2020, 457, 117723. [Google Scholar] [CrossRef]
  15. Shu, L.; Zhang, X.L.; Dai, X.A.; Tian, X.R.; Wang, M.Y. Review on Forest Fire Research (II)—Forest Fire Prediction and Forecasting. World For. Res. 2003, 16, 34–37. [Google Scholar]
  16. Li, Y.; Feng, Z.; Chen, S.; Zhao, Z.; Wang, F. Application of the artificial neural network and support vector machines in forest fire prediction in the guangxi autonomous region, China. Discrete Dyn. Nat. Soc. 2020, 2020, 5612650. [Google Scholar] [CrossRef]
  17. Li, W.; Xu, Q.; Yi, J.; Liu, J. Predictive model of spatial scale of forest fire driving factors: A case study of Yunnan Province, China. Sci. Rep. 2022, 12, 19029. [Google Scholar] [CrossRef]
  18. Couto, F.T.; Iakunin, M.; Salgado, R.; Pinto, P.; Viegas, T.; Pinty, J.-P. Lightning modelling for the research of forest fire ignition in Portugal. Atmos. Res. 2020, 242, 104993. [Google Scholar] [CrossRef]
  19. Janssen, T.A.J.; Jones, M.W.; Finney, D.; van der Werf, G.R.; van Wees, D.; Xu, W.; Veraverbeke, S. Extratropical forests increasingly at risk due to lightning fires. Nat. Geosci. 2023, 16, 1136–1144. [Google Scholar] [CrossRef]
  20. Ivanov, V.A.; Ponomarev, E.I.; Ivanova, G.A.; Mal’kanova, A.V. Lightning and Forest Fires under Modern Climatic Conditions of Central Siberia. Russ. Meteorol. Hydrol. 2023, 48, 630–638. [Google Scholar] [CrossRef]
  21. Soler, A.; Pineda, N.; San Segundo, H.; Bech, J.; Montanyà, J. Characterisation of thunderstorms that caused lightning-ignited wildfires. Int. J. Wildland Fire 2021, 30, 954–970. [Google Scholar] [CrossRef]
  22. Aftergood, O.S.R.; Flannigan, M.D. Identifying and analyzing spatial and temporal patterns of lightning-ignited wildfires in Western Canada from 1981 to 2018. Can. J. For. Res. 2022, 52, 1399–1411. [Google Scholar] [CrossRef]
  23. Müller, M.M.; Vacik, H. Characteristics of lightnings igniting forest fires in Austria. Agric. For. Meteorol. 2017, 240–241, 26–34. [Google Scholar] [CrossRef]
  24. Smith, J.A.; Baker, M.B.; Weinman, J.A. Do forest fires affect lightning? Q. J. R. Meteorolog. Soc. 2006, 129, 2651–2670. [Google Scholar] [CrossRef]
  25. Jiao, Q.; Fan, M.; Tao, J.; Wang, W.; Liu, D.; Wang, P. Forest Fire Patterns and Lightning-Caused Forest Fire Detection in Heilongjiang Province of China Using Satellite Data. Fire 2023, 6, 166. [Google Scholar] [CrossRef]
  26. Schumacher, V.; Setzer, A.; Saba, M.M.F.; Naccarato, K.P.; Mattos, E.; Justino, F. Characteristics of lightning-caused wildfires in central Brazil in relation to cloud-ground and dry lightning. Agric. For. Meteorol. 2022, 312, 108723. [Google Scholar] [CrossRef]
  27. Shao, Y.; Wang, Z.; Feng, Z.; Sun, L.; Yang, X.; Zheng, J.; Ma, T. Assessment of China’s forest fire occurrence with deep learning, geographic information and multisource data. J. For. Res. 2023, 34, 963–976. [Google Scholar] [CrossRef]
  28. Shao, Y.; Fan, G.; Feng, Z.; Sun, L.; Yang, X.; Ma, T.; Li, X.; Fu, H.; Wang, A. Prediction of forest fire occurrence in China under climate change scenarios. J. For. Res. 2023, 34, 1217–1228. [Google Scholar] [CrossRef]
  29. Nikolić, G.; Vujović, F.; Golijanin, J.; Šiljeg, A.; Valjarević, A. Modelling of Wildfire Susceptibility in Different Climate Zones in Montenegro Using GIS-MCDA. Atmosphere 2023, 14, 929. [Google Scholar] [CrossRef]
  30. Baranovskiy, N. Deterministic-Probabilistic Approach to Predict Lightning-Caused Forest Fires in Mounting Areas. Forecasting 2021, 3, 695–715. [Google Scholar] [CrossRef]
  31. Baranovskiy, N.V. Predicting Forest Fire Numbers Using Deterministic-Probabilistic Approach. In Predicting, Monitoring, and Assessing Forest Fire Dangers and Risks; Advances in Environmental Engineering and Green Technologies; IGI Global: Hershey, PA, USA, 2020; pp. 89–100. [Google Scholar]
  32. Baranovskiy, N.V.; Vyatkina, V.A.; Chernyshov, A.M. Deterministic–Probabilistic Prediction of Forest Fires from Lightning Activity Taking into Account Aerosol Emissions. Atmosphere 2022, 14, 29. [Google Scholar] [CrossRef]
  33. Baranovskiy, N.V.; Kirienko, V.A. Forest Fuel Drying, Pyrolysis and Ignition Processes during Forest Fire: A Review. Processes 2022, 10, 89. [Google Scholar] [CrossRef]
  34. Pham, B.T.; Jaafari, A.; Avand, M.; Al-Ansari, N.; Dinh Du, T.; Yen, H.P.H.; Phong, T.V.; Nguyen, D.H.; Le, H.V.; Mafi-Gholami, D.; et al. Performance Evaluation of Machine Learning Methods for Forest Fire Modeling and Prediction. Symmetry 2020, 12, 1022. [Google Scholar] [CrossRef]
  35. Galván, L.; Magaña, V. Forest fires in Mexico: An approach to estimate fire probabilities. Int. J. Wildland Fire 2020, 29, 753–763. [Google Scholar] [CrossRef]
  36. Preisler, H.K.; Ager, A.A. Forest-Fire Models. Encycl. Environmetrics 2012, 3, 2181–2185. [Google Scholar]
  37. Shokouhi, M.; Asadi Oskouei, E.; Sadeghi, H.; Rahnama, M. Calibration and evaluation of the Forest Fire Weather Index (FWI) in the Hamoun wetland area. J. Nat. Environ. Hazards 2024, 13, 45–60. [Google Scholar]
  38. Trucchia, A.; D’Andrea, M.; Baghino, F.; Fiorucci, P.; Ferraris, L.; Negro, D.; Gollini, A.; Severino, M. PROPAGATOR: An operational cellular-automata based wildfire simulator. Fire 2020, 3, 26. [Google Scholar] [CrossRef]
  39. Lopes, A.; Cruz, M.G.; Viegas, D. FireStation—An integrated software system for the numerical simulation of fire spread on complex topography. Environ. Modell. Softw. 2002, 17, 269–285. [Google Scholar] [CrossRef]
  40. Fujioka, F.M.; Weise, D.R.; Chen, S.-C.; Kim, S.H.; Kafatos, M.C. Reaction intensity partitioning: A new perspective of the National Fire Danger Rating System Energy Release Component. Int. J. Wildland Fire 2021, 30, 351–364. [Google Scholar] [CrossRef]
  41. Keane, R.E.; Rollins, M.; Zhu, Z.-L. Using simulated historical time series to prioritize fuel treatments on landscapes across the United States: The LANDFIRE prototype project. Ecol. Modell. 2007, 204, 485–502. [Google Scholar] [CrossRef]
  42. Jin, T.; Hu, X.; Liu, B.; Xi, C.; He, K.; Cao, X.; Luo, G.; Han, M.; Ma, G.; Yang, Y. Susceptibility prediction of post-fire debris flows in Xichang, China, using a logistic regression model from a spatiotemporal perspective. Remote Sens. 2022, 14, 1306. [Google Scholar] [CrossRef]
  43. Graff, C.A.; Coffield, S.R.; Chen, Y.; Foufoula-Georgiou, E.; Randerson, J.T.; Smyth, P. Forecasting daily wildfire activity using poisson regression. IEEE Trans. Geosci. Remote Sens. 2020, 58, 4837–4851. [Google Scholar] [CrossRef]
  44. Bugallo, M.; Esteban, M.D.; Marey-Pérez, M.F.; Morales, D. Wildfire prediction using zero-inflated negative binomial mixed models: Application to Spain. J. Environ. Manag. 2023, 328, 116788. [Google Scholar] [CrossRef] [PubMed]
  45. Yang, S.; Lupascu, M.; Meel, K.S. Predicting forest fire using remote sensing data and machine learning. Proc. AAAI Conf. Artif. Intell. 2021, 35, 14983–14990. [Google Scholar] [CrossRef]
  46. Pang, Y.; Li, Y.; Feng, Z.; Feng, Z.; Zhao, Z.; Chen, S.; Zhang, H. Forest fire occurrence prediction in China based on machine learning methods. Remote Sens. 2022, 14, 5546. [Google Scholar] [CrossRef]
  47. Hong, H.; Tsangaratos, P.; Ilia, I.; Liu, J.; Zhu, A.-X.; Xu, C. Applying genetic algorithms to set the optimal combination of forest fire related variables and model forest fire susceptibility based on data mining models. The case of Dayu County, China. Remote Sens. Environ. 2018, 630, 1044–1056. [Google Scholar] [CrossRef]
  48. Mohajane, M.; Costache, R.; Karimi, F.; Pham, Q.B.; Essahlaoui, A.; Nguyen, H.; Laneve, G.; Oudija, F. Application of remote sensing and machine learning algorithms for forest fire mapping in a Mediterranean area. Ecol. Indic. 2021, 129, 107869. [Google Scholar] [CrossRef]
  49. Li, E.; Fei, Y. Prediction of forest fires based on least squares support vector machine. Hans J. Data Min 2016, 6, 15–27. [Google Scholar] [CrossRef]
  50. Sakr, G.E.; Elhajj, I.H.; Mitri, G. Efficient forest fire occurrence prediction for developing countries using two weather parameters. Eng. Appl. Artif. Intell. 2011, 24, 888–894. [Google Scholar] [CrossRef]
  51. Ma, T.; Wang, G.; Guo, R.; Chen, L.; Ma, J. Forest fire susceptibility assessment under small sample scenario: A semi-supervised learning approach using transductive support vector machine. J. Environ. Manag. 2024, 359, 120966. [Google Scholar] [CrossRef]
  52. Veysi, R.; Fattahi, B.; Khosrobeigi, S. Predicting and preparing a risk map of rangeland fires using random forest algorithms and support vector machine (Case study: Arak rangelands). Rangeland 2022, 16, 413–426. [Google Scholar]
  53. Tan, C.; Feng, Z. Mapping forest fire risk zones using machine learning algorithms in Hunan province, China. Sustainability 2023, 15, 6292. [Google Scholar] [CrossRef]
  54. Li, Y.; Li, G.; Wang, K.; Wang, Z.; Chen, Y. Forest fire risk prediction based on stacking ensemble learning for yunnan Province of China. Fire 2023, 7, 13. [Google Scholar] [CrossRef]
  55. Ramalingam, R. An Innovative Investigation on Predicting Forest Fire Using Machine Learning Approach. In AI and IoT for Proactive Disaster Management; Advances in Computational Intelligence and Robotics; IGI Global: Hershey, PA, USA, 2024; pp. 61–77. [Google Scholar]
  56. Merabet, M.; Kourtiche, A. Embedded ANN-Based Forest Fire Prediction Case Study of Algeria. Int. J. Distrib. Artif. Intell. 2022, 14, 1–18. [Google Scholar] [CrossRef]
  57. Safi, Y.; Bouroumi, A. Prediction of forest fires using artificial neural networks. Appl. Math. Sci. 2013, 7, 271–286. [Google Scholar] [CrossRef]
  58. Abid, F. A survey of machine learning algorithms based forest fires prediction and detection systems. Fire Technol. 2021, 57, 559–590. [Google Scholar] [CrossRef]
  59. Saha, S.; Bera, B.; Shit, P.K.; Bhattacharjee, S.; Sengupta, N. Prediction of forest fire susceptibility applying machine and deep learning algorithms for conservation priorities of forest resources. Remote Sens. Appl. Soc. Environ. 2023, 29, 100917. [Google Scholar] [CrossRef]
  60. Yandouzi, M.; Grari, M.; Idrissi, I.; Moussaoui, O.; Azizi, M.; Ghoumid, K.; Elmiad, A.K. Review on forest fires detection and prediction using deep learning and drones. J. Theor. Appl. Inf. Technol. 2022, 100, 4565–4576. [Google Scholar]
  61. Ghali, R.; Akhloufi, M.A. Deep learning approaches for wildland fires using satellite remote sensing data: Detection, mapping, and prediction. Fire 2023, 6, 192. [Google Scholar] [CrossRef]
  62. Yang, S.; Huang, Q.; Yu, M. Advancements in remote sensing for active fire detection: A review of datasets and methods. Remote Sens. Environ. 2024, 943, 173273. [Google Scholar] [CrossRef]
  63. Schiks, T.J.; Wotton, B.M.; Martell, D.L. Remote Sensing Active Fire Detection Tools Support Growth Reconstruction for Large Boreal Wildfires. Fire 2024, 7, 26. [Google Scholar] [CrossRef]
  64. Albar, I.; Jaya, I.N.S.; Saharjo, B.H.; Kuncahyo, B.; Vadrevu, K.P. Spatio-temporal analysis of land and forest fires in Indonesia using MODIS active fire dataset. In Land-Atmospheric Research Applications in South and Southeast Asia; Springer: Berlin/Heidelberg, Germany, 2018; pp. 105–127. [Google Scholar]
  65. Kaplan, J.O.; Lau, K.H.-K. The WGLC global gridded lightning climatology and time series. Earth Syst. Sci. Data 2021, 13, 3219–3237. [Google Scholar] [CrossRef]
  66. Kaplan, J.O.; Lau, K.H.-K. World Wide Lightning Location Network (WWLLN) Global Lightning Climatology (WGLC) and time series, 2022 update. Earth Syst. Sci. Data 2022, 14, 5665–5670. [Google Scholar] [CrossRef]
  67. Kaplan, J.; Lau, K. The WWLLN Global Lightning Climatology and Timeseries (WGLC), v2022. 0.0, Zenodo [Data Set]. 2022. Available online: https://zenodo.org/records/6007052 (accessed on 20 September 2024).
  68. Alisjahbana, A.S.; Busch, J.M. Forestry, forest fires, and climate change in Indonesia. Bull. Indones. Econ. Stud. 2017, 53, 111–136. [Google Scholar] [CrossRef]
  69. Lindenmayer, D.; MacGregor, C.; Welsh, A.; Donnelly, C.; Crane, M.; Michael, D.; Montague-Drake, R.; Cunningham, R.; Brown, D.; Fortescue, M. Contrasting mammal responses to vegetation type and fire. Wildl. Res. 2008, 35, 395–408. [Google Scholar] [CrossRef]
  70. Ciesielski, M.; Balazy, R.; Borkowski, B.; Szczesny, W.; Zasada, M.; Kaczmarowski, J.; Kwiatkowski, M.; Szczygiel, R.; Milanovic, S. Contribution of anthropogenic, vegetation, and topographic features to forest fire occurrence in Poland. iForest Biogeosci. For. 2022, 15, 307. [Google Scholar] [CrossRef]
  71. Griffith, D.A. What is spatial autocorrelation? Reflections on the past 25 years of spatial statistics. L’Espace Géogr. 1991, 21, 265–280. [Google Scholar]
  72. Li, L.; Tang, H.; Lei, J.; Song, X. Spatial autocorrelation in land use type and ecosystem service value in Hainan Tropical Rain Forest National Park. Ecol. Indic. 2022, 137, 108727. [Google Scholar] [CrossRef]
  73. Ren, H.; Shang, Y.; Zhang, S. Measuring the spatiotemporal variations of vegetation net primary productivity in Inner Mongolia using spatial autocorrelation. Ecol. Indic. 2020, 112, 106108. [Google Scholar] [CrossRef]
  74. Lemmerz, T.; Herlé, S.; Blankenbach, J. Geostatistics on Real-Time Geodata Streams—High-Frequent Dynamic Autocorrelation with an Extended Spatiotemporal Moran’s I Index. ISPRS Int. J. Geo-Inf. 2023, 12, 350. [Google Scholar] [CrossRef]
  75. Chen, Y. An analytical process of spatial autocorrelation functions based on Moran’s index. PLoS ONE 2021, 16, e0249589. [Google Scholar] [CrossRef]
  76. Moran, P.A. Notes on continuous stochastic phenomena. Biometrika 1950, 37, 17–23. [Google Scholar] [CrossRef]
  77. Zambom, A.Z.; Dias, R. A review of kernel density estimation with applications to econometrics. Int. Econom. Rev. 2013, 5, 20–42. [Google Scholar]
  78. Chen, Y.-C. A tutorial on kernel density estimation and recent advances. Biostat. Epidemiol. 2017, 1, 161–187. [Google Scholar] [CrossRef]
  79. Kuter, N.; Yenilmez, F.; Kuter, S. Forest fire risk mapping by kernel density estimation. Croat. J. For. Eng. 2011, 32, 599–610. [Google Scholar]
  80. Zhao, Y.; Wu, Q.; Wei, P.; Zhao, H.; Zhang, X.; Pang, C. Explore the mitigation mechanism of urban thermal environment by integrating geographic detector and standard deviation ellipse (SDE). Remote Sens. 2022, 14, 3411. [Google Scholar] [CrossRef]
  81. Huang, J.; Song, L.; Yu, M.; Zhang, C.; Li, S.; Li, Z.; Geng, J.; Zhang, C. Quantitative spatial analysis of thermal infrared radiation temperature fields by the standard deviational ellipse method for the uniaxial loading of sandstone. Infrared Phys. Technol. 2022, 123, 104150. [Google Scholar] [CrossRef]
  82. Polajžer, B.; Brezovnik, R.; Ritonja, J. Evaluation of load frequency control performance based on standard deviational ellipses. IEEE Trans. Power Syst. 2016, 32, 2296–2304. [Google Scholar] [CrossRef]
  83. Zhao, Z.; Zhao, Z.; Zhang, P. A new method for identifying industrial clustering using the standard deviational ellipse. Sci. Rep. 2023, 13, 578. [Google Scholar] [CrossRef]
  84. Fjellström, C.; Nyström, K. Deep learning, stochastic gradient descent and diffusion maps. J. Comput. Math. Data Sci. 2022, 4, 100054. [Google Scholar] [CrossRef]
  85. Haji, S.H.; Abdulazeez, A.M. Comparison of optimization techniques based on gradient descent algorithm: A review. PalArch’s J. Archaeol. Egypt/Egyptol. 2021, 18, 2715–2743. [Google Scholar]
  86. Chicco, D.; Jurman, G. The advantages of the Matthews correlation coefficient (MCC) over F1 score and accuracy in binary classification evaluation. BMC Genom. 2020, 21, 1–13. [Google Scholar] [CrossRef]
  87. Alakus, T.B.; Turkoglu, I. Comparison of deep learning approaches to predict COVID-19 infection. Chaos Solitons Fractals 2020, 140, 110120. [Google Scholar] [CrossRef] [PubMed]
  88. Gale, M.G.; Cary, G.J.; Van Dijk, A.I.; Yebra, M. Forest fire fuel through the lens of remote sensing: Review of approaches, challenges and future directions in the remote sensing of biotic determinants of fire behaviour. Remote Sens. Environ. 2021, 255, 112282. [Google Scholar] [CrossRef]
  89. Kalantar, B.; Ueda, N.; Idrees, M.O.; Janizadeh, S.; Ahmadi, K.; Shabani, F. Forest fire susceptibility prediction based on machine learning models with resampling algorithms on remote sensing data. Remote Sens. 2020, 12, 3682. [Google Scholar] [CrossRef]
  90. Nuthammachot, N.; Stratoulias, D. Multi-criteria decision analysis for forest fire risk assessment by coupling AHP and GIS: Method and case study. Environ. Dev. Sustain. 2021, 23, 17443–17458. [Google Scholar] [CrossRef]
  91. Zhang, Z.; Tian, Y.; Wang, G.; Zheng, C.; Zhao, F. A Forest Fire Prediction Method for Lightning Stroke Based on Remote Sensing Data. Forests 2024, 15, 647. [Google Scholar] [CrossRef]
  92. Wang, R.; Zorzetto, E.; Malyshev, S.; Shevliakova, E. Characterizing lightning-ignited wildfire occurrences at sub-grid scales in orography-aware NOAA/GFDL land model LM4. 2. In Proceedings of the EGU General Assembly 2024, Vienna, Austria, 14–19 April 2024. [Google Scholar]
  93. Taori, A.; Suryavanshi, A.; Goenka, R.; Venkatesh, D.; Rao, G.S. Inter-comparison of World Wide Lightning Location Network (WWLLN) and Lightning Detection Sensor Network (LDSN) data over India. J. Atmos. Sol. Terr. Phys. 2024, 261, 106286. [Google Scholar] [CrossRef]
  94. Coughlan, R.; Di Giuseppe, F.; Vitolo, C.; Barnard, C.; Lopez, P.; Drusch, M. Using machine learning to predict fire-ignition occurrences from lightning forecasts. Meteorol. Appl. 2021, 28, e1973. [Google Scholar] [CrossRef]
Figure 1. Study area.
Forests 15 01672 g001
Figure 2. The main data chart used in this article((ah) respectively represent meteorological station, POP (population), GDP (Gross Domestic Product), Road, residential area, forest type, Lightning stroke density, and (repeated) Lightning stroke density).
Forests 15 01672 g002aForests 15 01672 g002b
Figure 3. Technology roadmap.
Forests 15 01672 g003
Figure 4. Schematic diagram of the model.
Forests 15 01672 g004
Figure 5. Autocorrelation analysis, where (a) represents overall autocorrelation, and (b) signifies regional autocorrelation.
Forests 15 01672 g005
Figure 6. Results of kernel density analysis in Eastern China.
Forests 15 01672 g006
Figure 7. Results from the standard deviation ellipse analysis for Eastern China.
Forests 15 01672 g007
Figure 8. Assess the performance of the model.
Forests 15 01672 g008
Figure 9. Monthly regions prone to forest fires (categories I to V represent ranges from very low to extremely high).
Forests 15 01672 g009aForests 15 01672 g009b
Table 2. Standard deviation ellipse metrics for forest-fire distribution in Eastern China.
YearXStdDist (km)YStdDist (km)RotationOblateness
2001252.2531647.631329.46440.389501041
2004472.2580181.579247.41662.600836827
2005265.1277647.929436.64000.409192231
2012326.6989921.909119.71770.35437217
2014271.2652940.043323.38050.288566668
2015270.2658957.621625.66330.28222607
2019327.22041364.012521.39580.239895437
Disclaimer/Publisher’s Note: The statements, opinions and data contained in all publications are solely those of the individual author(s) and contributor(s) and not of MDPI and/or the editor(s). MDPI and/or the editor(s) disclaim responsibility for any injury to people or property resulting from any ideas, methods, instructions or products referred to in the content.

