Abstract
Voluntary carbon markets (VCMs) are gaining momentum as a strategy for climate change mitigation through forest carbon offset (FCO) projects in the United States (US). Despite this, few studies have examined the carbon storage performance and co-benefits associated with FCO projects, including afforestation/reforestation (A/R) and avoided conversion (AC). This study examines the current status of all existing A/R, AC, and avoided grassland conversion (AGC) projects registered within the VCM in the US. Using data from public carbon offset registries, we focus our analysis on the geographical and ownership distributions, project size, issued and retired credits, and co-benefits generated by these project types. Results showed a significant concentration of FCO projects in southern and western states, with 168,253 acres in Arkansas, 71,105 acres in Montana, and 42,857 acres in Colorado. Regarding project ownership, approximately 60% of all projects were owned by private companies and individuals or families. Analysis of offset credits by vintage period revealed that A/R projects generate a higher volume of both issued and retired credits compared to AC and AGC projects. Additionally, content analysis indicated that A/R projects provide a greater number of environmental and socioeconomic co-benefits than their AC and AGC counterparts. The findings from this study can improve our understanding of markets for forest-based ecosystem services and provide valuable insights for program administrators and policymakers to inform the decisions surrounding climate investments.
1. Introduction
In 1997, the Kyoto Protocol agreed on emission reduction targets through carbon offset credit trading, leading to the establishment of a global compliance carbon market under the Clean Development Mechanism (CDM) [1]. While the CDM was developed to support countries in meeting their Kyoto targets, it was highly criticized for pricing and methodological issues as well as social and environmental impacts. However, the CDM laid the groundwork for the voluntary carbon market (VCM), a more flexible approach to carbon trading for companies that demonstrate commitments towards environmental sustainability and corporate social responsibility. Broadly speaking, the VCM includes the voluntary, legally binding Chicago Climate Exchange and non-binding offset market. The Chicago Climate Exchange, established in 2003, was the world’s first voluntary carbon trading system in North America [2]. Other non-binding markets include project-based voluntary transactions involving different players such as public registries, carbon project developers, verifiers, retailers, and brokers. These are mostly decentralized and non-standardized marketplaces. However, in recent years, governmental bodies in different countries have initiated regulation of the voluntary trade of carbon credits. For example, Japan launched a voluntary emission reduction and trading system called GX League in 2022, which allows the voluntary participation of corporations. The London Stock Exchange announced the creation of a new market designation for companies intending to invest in carbon removal [3].
Over the past two decades, VCMs have continued to develop and gain attention as a crucial mechanism to mitigate carbon emissions through initiatives such as improved forest management practices, environmentally friendly agricultural methods, and the transition to renewable energy sources [4]. In 2021, the global VCM was valued at approximately USD 2 billion and is projected to grow significantly, up to USD 40 billion by 2030, with forest-based carbon credits expected to make up essential portions of the market [5,6]. In fact, in 2022, 54% of newly registered projects were focused on forestry and land use activities, indicating a likely increase in the future supply of credits from such project types [7]. In 2023, forestry projects became the second largest contributor to global credits issued, accounting for 32.7% of the total credits after renewable energy (36.8%) [8].
While a centralized marketplace for voluntary carbon emission reductions in the US does not exist, the VCM has gained significant momentum, with many corporations entering the market by establishing ambitious net-zero targets. At the federal level, several climate policy and investment initiatives have been taken to enhance market transparency and integrity of carbon credits. For instance, the 2022 Inflation Reduction Act represents the single largest investment (about USD 369 billion) in climate and energy action in US history, enacted to reduce US carbon emissions by approximately 40% by 2030 and achieve a net-zero economy by 2050 [9]. In addition, a coalition of federal agencies issued a Joint Policy Statement in early 2024, outlining non-mandatory guidelines and key principles for VCMs to enhance transparency, integrity, and effectiveness of these rapidly growing carbon credit markets [10]. The US has been at the forefront of developing forest-based carbon projects, with the number of projects growing from 116 to 297 between 2021 and 2023. Following the US is Mexico, with 232 forest-based offset projects, and China, with 143 projects, within VCMs in 2023 [8]. Mexico is the first country to establish an emission trading system in tropical rainforests of Latin America and the only country that has implemented carbon taxes [11]. As one of the largest Greenhouse Gas (GHG) emitters globally, China also established a national emission trading system, based on the Chinese-certified emissions reduction credits, in 2021 [12].
Various studies on VCM have focused on the status and dynamics of the market and associated key challenges. Kreibich [13] examined the evolution of VCM and identified concerns regarding double claiming of credits, adequacy of offsetting, and its effectiveness in driving genuine decarbonization. Chen et al. [14] studied the challenges associated with VCM by interviewing key international stakeholders and found that the high cost of top-down protocols and compliance needed to improve the key issues of transparency and quality among participants may also limit the growth of the marketplace. They suggested a need to establish a system that tracks the success of offset projects back to both the developers and buyers. Along the same lines, Delbeke et al. [15] outlined how the European Union’s (EU) actions can help improve VCM transparency and effectiveness and argue that the EU’s new regulations on disclosure and reporting, as well as those on certification of removals and claims, may contribute to ambitious climate actions.
Forest carbon offset (FCO) projects within compliance and voluntary markets fall into three categories: Afforestation/Reforestation (A/R), Avoided Conversion (AC), including Avoided Grassland Conversion (AGC), and Improved Forest Management (IFM). A/R projects establish forest cover by planting trees or encouraging natural regeneration on previously non-forested lands as well as restoring tree cover on lands subject to severe disturbances. A/R projects have emerged as effective mitigation strategies to combat climate change because of their greater potential to capture and store atmospheric carbon [16]. AC projects focus on conserving forestlands that are at significant risk of being converted into agriculture croplands or urban development [17]. Forests within an AC project can be prevented from over-exploitation or deforestation by permanently conserving them through mechanisms such as conservation easements. AGC projects conserve grasslands from development and conversion into croplands and avoid substantial carbon emissions from soil disturbances and wildlife habitat loss. IFM projects, the most common type of FCO project in the US, involve the implementation of forest management activities to increase carbon stocks beyond baseline levels. Such practices include extending rotation lengths, thinning trees, and utilizing reduced-impact logging techniques to enhance long-term carbon sequestration on forested lands. In 2023, IFM accounted for 79.9% of the total credits issued and 79.1% of the total number of projects among FCO project types within the VCM in the US [8].
Several studies have examined the climate and other environmental impacts of A/R, AC, AGC, and IFM projects in the US. Sauer et al. [18] reported a 30% increase in soil organic carbon in A/R projects in northeastern Iowa compared to tilled cropland. Zhang et al. [19] highlighted that commercial A/R projects with innovative wood-use are more likely to achieve greater GHG mitigation in the long term compared to protection A/R and commercial A/R with traditional lumber production. Brantley et al. [17] examined the suitability of parcels for AC projects in North Carolina and found that the parcels at higher conversion risk and conservation values are more promising for AC projects. Ahlering et al. [20] used scenario modeling simulation to estimate the GHG emission reductions associated with AGC projects in the northern Great Plains and found that the AGC projects could lead to a reduction of 11.7 million tCO2e over a 20-year period. Studies have also shown that IFM projects can potentially yield significant carbon storage benefits if effective management practices (e.g., extending rotation lengths, reducing harvest intervals and intensity, and managing stand density) are implemented [21,22,23]. Furthermore, Kaarakka et al. [24] discovered that IFM projects located on forestland in the US exhibit higher carbon densities both above and below ground, although 26% of the projects also present a moderate wildfire hazard. Stapp et al. [25] examined 136 IFM projects in the US and found that these projects are mainly in forests with high carbon stocks, showing 127% more than regional averages, and in locations with low historical disturbance, experiencing 28% less disturbance than regional averages.
Another stream of research examined the relationship between socioeconomic factors and FCO projects. Schirmer and Bull [26] investigated private landowners’ willingness to adopt A/R in New South Wales, Australia, and found that landowners tend to prefer smaller planting areas to minimize disturbance to land management and that their willingness to adopt A/R is influenced by income benefits as well as the flexibility of land management options. Sexton [27] found that AC projects could provide a significant revenue source for land trusts in Tennessee depending on their ability to meet the legal and performance standards outlined in the protocol. Using the economic rent difference threshold, Baker et al. [28] investigated determinants influencing landowners’ participation in AGC projects in the Prairie Pothole Region and found that lands with higher rent difference thresholds tend to have greater enrollment in AGC projects. They also suggested a higher break-even price incentive for lands with low rent difference thresholds. In another study, Griscom and Cortez [21] underlined the importance of adopting IFM as a REDD+ strategy, highlighting its potential benefits for local communities and employment. Their findings suggest that implementing IFM can enhance jobs, increase income, and improve ecosystem services for local communities that depend on the preservation of standing native forests.
Given the increasing role of FCO projects in mitigating climate change, it is important to assess the overall performance of forest-based projects within the VCM. However, most prior analyses of forest carbon projects have primarily focused on IFM projects within compliance markets. There has been relatively little effort to explore the geographical distributions, ownership categories, and carbon credits issued and retired from A/R and AC projects in the voluntary market. In addition, to the best of our knowledge, the co-benefits generated by the implementation of these project types have not been examined. To address this gap, we compiled a comprehensive new database of FCO projects by focusing on existing A/R, AC, and AGC projects within the VCM in the US. We focused on two main questions: (1) What trends are emerging from A/R, AC, and AGC projects concerning the location, size, ownership type, and issued and retired credits? (2) To what extent do A/R, AC, and AGC projects provide co-benefits? This study makes a few contributions to the relevant literature. First, it expands the research on forest carbon projects beyond the relatively well-studied IFM project type to include other project types. Second, analysis of issues and retired credits by vintage informs the supply and demand dynamics of carbon credits. Third, it evaluates the co-benefits provided by different types of forest carbon projects in the US. Overall, the findings from this study are expected to improve our understanding of markets for forest-based ecosystem services and provide valuable insights for policy designs and decisions surrounding climate investments.
2. Materials and Methods
We examined the status of forest carbon offset projects focusing on A/R, AC, and AGC within voluntary markets in the US. Details of individual A/R, AC, and AGC projects were collected from three carbon registries, including Climate Action Reserve (CAR), American Carbon Registry (ACR), and Verra [29,30,31]. These are the most common offset registries in the US that serve as a database for tracking the issuance, transfer, and retirement of carbon credits and establishing marketplace accountability. We considered all registered, completed, and listed projects in the VCM (projects categorized as ‘non-ARB eligible’), provided they contained data and other useful information for further analysis.
Data collection and project selection involved multiple steps (Table 1). First, we used the public registry webpages to collect GHG project designs or plans of individual A/R, AC, and AGC projects. Project submittal forms and verification reports were also consulted for supplemental information. Then, we identified key project attributes, including location, acreage, ownership, number of credits issued and retired, and socioeconomic and environmental benefits. Heterogeneity among landowner types was examined by using the forest landowner classification stratum developed by the US Forest Service [25,32]. Landowner types included private companies, individuals or families, non-profit organizations (NGOs) including land trusts, government or federal entities, and timber investment management organizations (TIMOs) or timber real estate investment trusts (REITs). Finally, out of 51 projects, we selected 46 projects, excluding 5 projects due to insufficient data. Of 46 projects, 16 were A/R, 8 were AC, and 22 were AGC projects.

Table 1.
Description of data collection.
To map the project location and ownership, we followed Kaarakka et al.’s [24] approach and integrated our data with a spatial data frame from the U.S. Census Bureau [33]. This allowed for the random positioning of plots within the corresponding counties of each state, as precise latitude and longitude coordinates were not available for all projects. To estimate the proportion of retired credits by project type, we calculated the total issued and registered credits by vintage year, subtracted the registered credits from the issued ones, and estimated the percentage. The analysis of total issued credits encompassed 31 projects, which is less than the total of 46 projects examined in this study. This discrepancy arises due to the unavailability of credit information for 15 projects. There are 6 A/R projects (3 completed, 2 registered, 1 under development), 2 completed AC projects, and 7 listed AGC projects. Further, we obtained issued credit data for some A/R projects from project design documents due to the lack of actual carbon emission reduction estimates. In contrast, for AC and AGC projects, we collected issued credit data from actual carbon emission reduction reports detailing the quantity issued by vintage year.
Lastly, we utilized qualitative content analysis to determine key information on project history and co-benefits based on the carbon project GHG plans available in three public registries. Content analysis is a structured qualitative process that entails analyzing existing texts from accessible databases. The core of this qualitative analysis lies in a category system, which comprises the key attributes used to organize and examine the text [34]. In establishing these characteristics, we examined four major subsections of the GHG project designs or plans that were extracted identically for most of the projects. Subsections included pre-project use, land pressure (threats), environmental benefits, and socioeconomic benefits. After proofing the documents, we extracted and organized descriptive information related to those subsections into Microsoft Excel. Then, we categorized the texts into specific attributes based on the subsection, counted the number of projects, and summed the acreage of project types under each category. Environmental benefits identified across projects included the preservation of wildlife habitat and water resources, reduction of soil erosion, and protection from exotic species, whereas the socio-economic benefits included recreation, cultural/historical values, and local economies.
3. Results
3.1. Status of A/R, AC, and AGC Projects
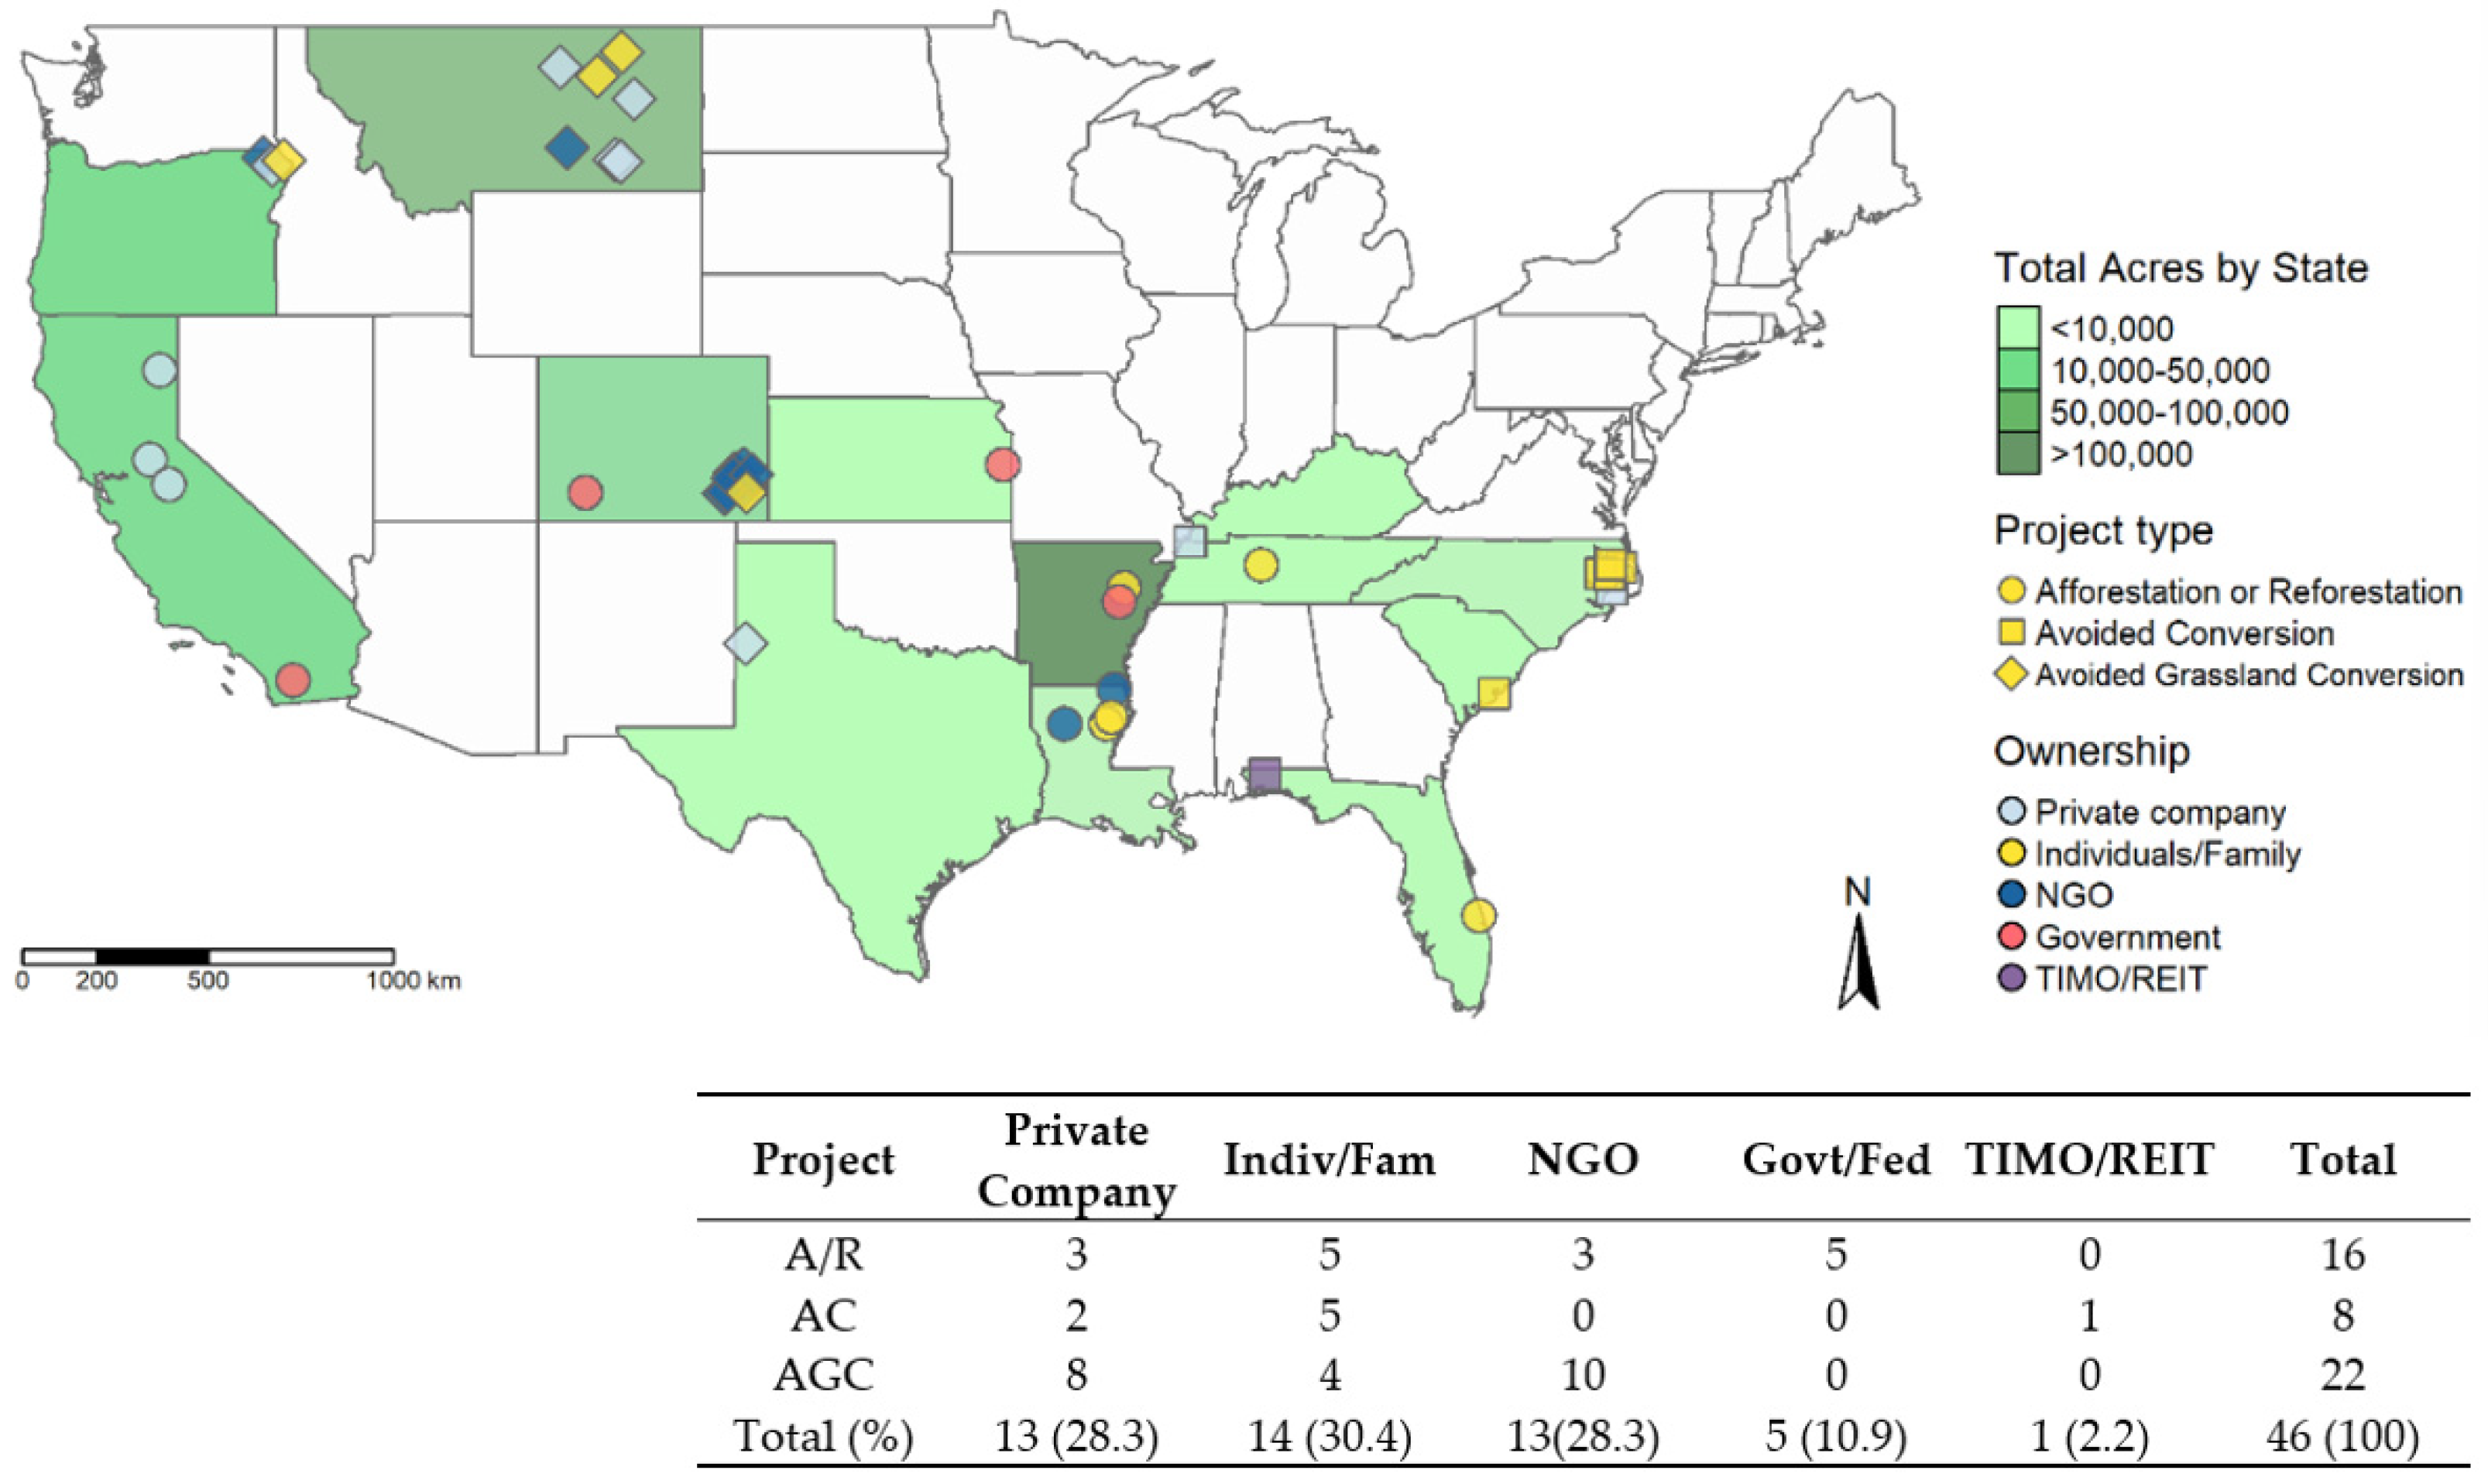
Figure 1 shows the geographical heterogeneity of three project types in terms of location, acreage, and ownership types. We found that the projects were distributed across 13 states within the US, with a significant concentration in 8 Southern states: Arkansas, Florida, Kentucky, Louisiana, North Carolina, South Carolina, Tennessee, and Texas. Five states in the Western region included California, Colorado, Kansas, Montana, and Oregon. Most A/R projects were located in Arkansas, Louisiana, and California, while AC projects were primarily found in North Carolina and South Carolina, and AGC projects were concentrated in Montana, Colorado, and Oregon. In terms of project area, Arkansas exhibited the largest carbon offset project coverage, with 168,253 acres across 2 A/R projects, followed by Montana with 71,105 acres and Colorado with 42,857 acres in 10 and 8 AGC projects, respectively. In Arkansas, the A/R projects primarily focused on planting fast-growing cottonwoods and native bottomland hardwood tree species such as Black Willow, Overcup Oak, Baldcypress, and Willow Oak in the Mississippi Alluvial Valley. AGC projects in Montana and Colorado have preserved grasslands through perpetual conservation easements that prevent tillage for commercial crop cultivation. These projects also aid in converting non-native vegetation (e.g., crested wheatgrass) to native grasslands (e.g., western wheatgrass). AC projects in North Carolina and South Carolina have preserved native tree species, such as Bay and Blackgum, while being managed permanently under conservation easements that restrict commercial timber harvesting.

Figure 1.
Locations, acreage, and ownership of forest carbon offset projects by state in the US (n = 46). Note: NGO, Non-governmental Organizations; TIMO/REIT, Timber Investment Management Organizations/ Real Estate Investment Trusts. Mapping was done using ‘tmap’ package in the R software version 4.3.1.
Regarding project ownership, individuals or families (30.4%), private companies (28.3%), and NGOs (28.3%) owned most projects (87.0%, 40 out of 46). However, distinct ownership patterns emerged across project types. Government or federal entities, such as the US Fish and Wildlife Service, exclusively owned A/R projects (5 out of 5). AC projects were predominantly owned by individuals or families (5 out of 8). In contrast, AGC projects were mainly owned by NGOs (10 out of 22) and private companies (8 out of 22). Several states revealed their own representative type of ownership. In Colorado, for example, NGOs owned 87.5% of projects (7 out of 8), while in North Carolina, 80% of projects (4 out of 5) involved individual or family-owned forest lands. In California, 75% of projects (3 out of 4) were located on land owned by private companies. However, the rest of the states did not exhibit any consistent patterns. For instance, Arkansas, the largest state in terms of project size, had projects divided between individual and government ownership. Montana, the second-largest state by project area, had a mix of private company, individual, and NGO ownership.
3.2. Issuance of Credits by Ownership Type
Table 2 shows the number of offset credits issued with respect to ownership types. Overall, individual or family landowners issued the most credits across all three project types: 58.9% (7,269,186 credits) in A/R, 64.6% (983,489 credits) in AC, and 50.8% (150,883 credits) in AGC projects. For A/R projects, government or federal-owned land was the second-largest ownership type after individuals, accounting for 41.0% (5,054,914 credits). For AC projects, private companies held the next largest share at 35.4% (539,428 credits). For AGC projects, NGOs accounted for 34.8% (103,336 credits), followed by private companies at 14.4% (42,615 credits). As discussed earlier, the credit information for 15 projects was not available. For example, no credit issuance data were available for AC projects owned by TIMOs/REITs.
Table 2.
Summary of total credits issued by ownership type.
3.3. Trends of Issued and Retired Carbon Offset Credits by Vintage Year
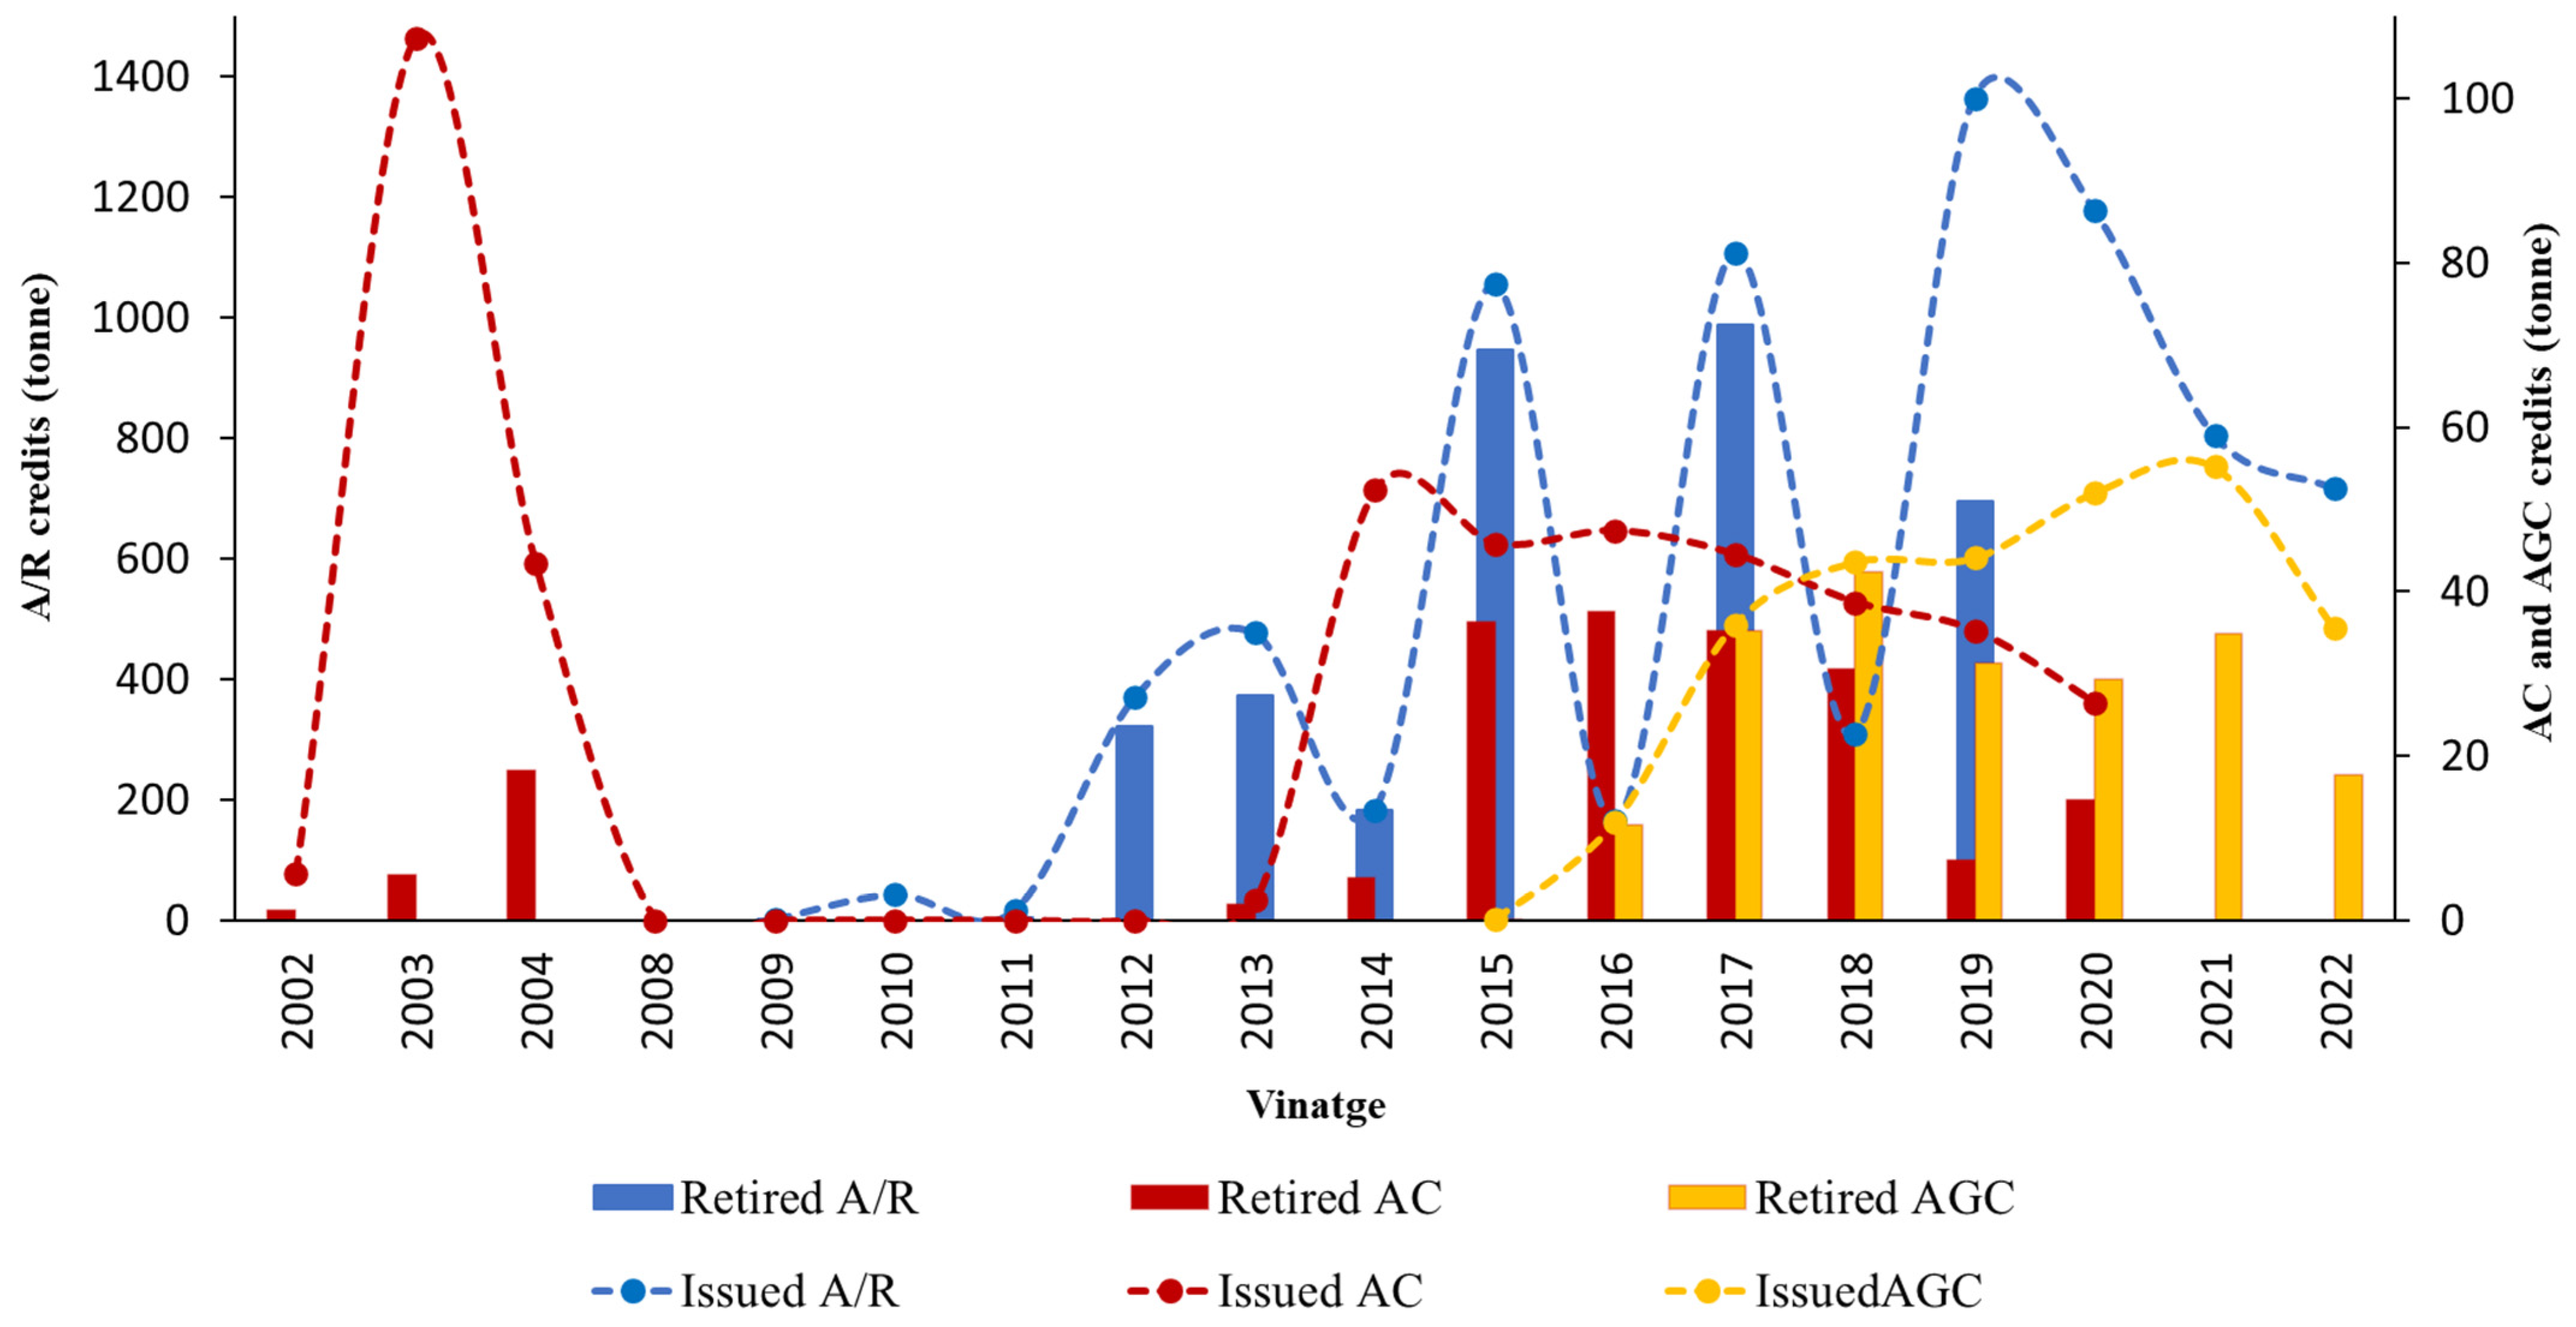
Figure 2 illustrates the trends of issued and retired credits by project type between the 2002 and 2022 vintage periods. We found fluctuations in the number of issued and retired credits, with notable differences in trends across project types. Credit issued through A/R projects increased steadily until 2013. Between vintages 2014 and 2019, there was a dramatic surge, with the number of credits rising nearly eightfold from 182,626 credits in 2014 to 1,364,185 credits in 2019, despite significant variations every other year. However, the number of issued credits declined by 47% subsequently. Of the total issued credits from A/R projects, 80.8% were retired between 2012 and 2017. However, the retirement percentage dropped significantly to 16.7% after that. For AC projects, issuance of credits began in 2002, peaked in 2003 at 107,323 credits, and then plummeted by 40% the following year to 43,380 credits. Since then, no credits were issued until 2013. Beginning in 2013, an average of 36,600 credits were issued each year until vintage 2020. About 79.1% of issued credits in AC projects were retired between 2015 and 2018, but this proportion was relatively low in other years. Credits from AGC projects were issued later than those from other project types, with the first credits being issued in 2015. The issuance of credits steadily increased from 11,891 credits in 2016 to 55,190 credits in 2021, and then dropped to 35,592 credits in 2022, marking a 19% decrease from 2019. The average retirement proportion of carbon credits for AGC projects was significantly higher at 79.0% compared to 49.6% for A/R and 47.1% for AC projects.
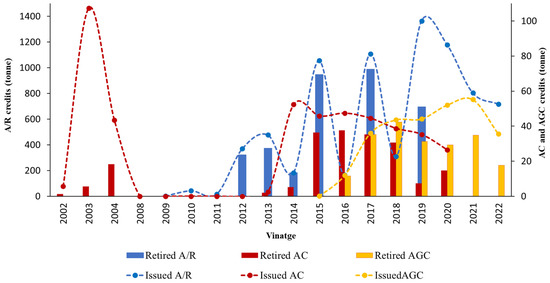
Figure 2.
Issued and retired credits by vintage period for three project types. Notes: A/R, Afforestation/Reforestation; AC, Avoided Conversion; AGC, Avoided Grassland Conversion. Issued and retired credits in this graph are calculated before removing buffer pool credits.
The quantity of credits issued through AC and AGC projects notably fell short compared to A/R projects. On average, A/R projects issued roughly 17 times more credits than AC projects and 28 times more than AGC projects during the observed period. The retired credits in A/R were also significantly higher at 14 and 19 times greater than those in AC and AGC projects, respectively. It is noteworthy that beginning in 2018, the trends in the issuance and retirement of credits for AC and AGC projects have shifted. AC projects had fewer issuance and retirement credits than AGC projects, which gained prominence thereafter. Credits issued by AC projects consistently declined after reaching their peak at 52,409 in 2014. In contrast, credits issued by AGC projects showed an upward trend starting in 2015, reaching a peak of 55,190 credits in 2021.
3.4. Content Analysis Results
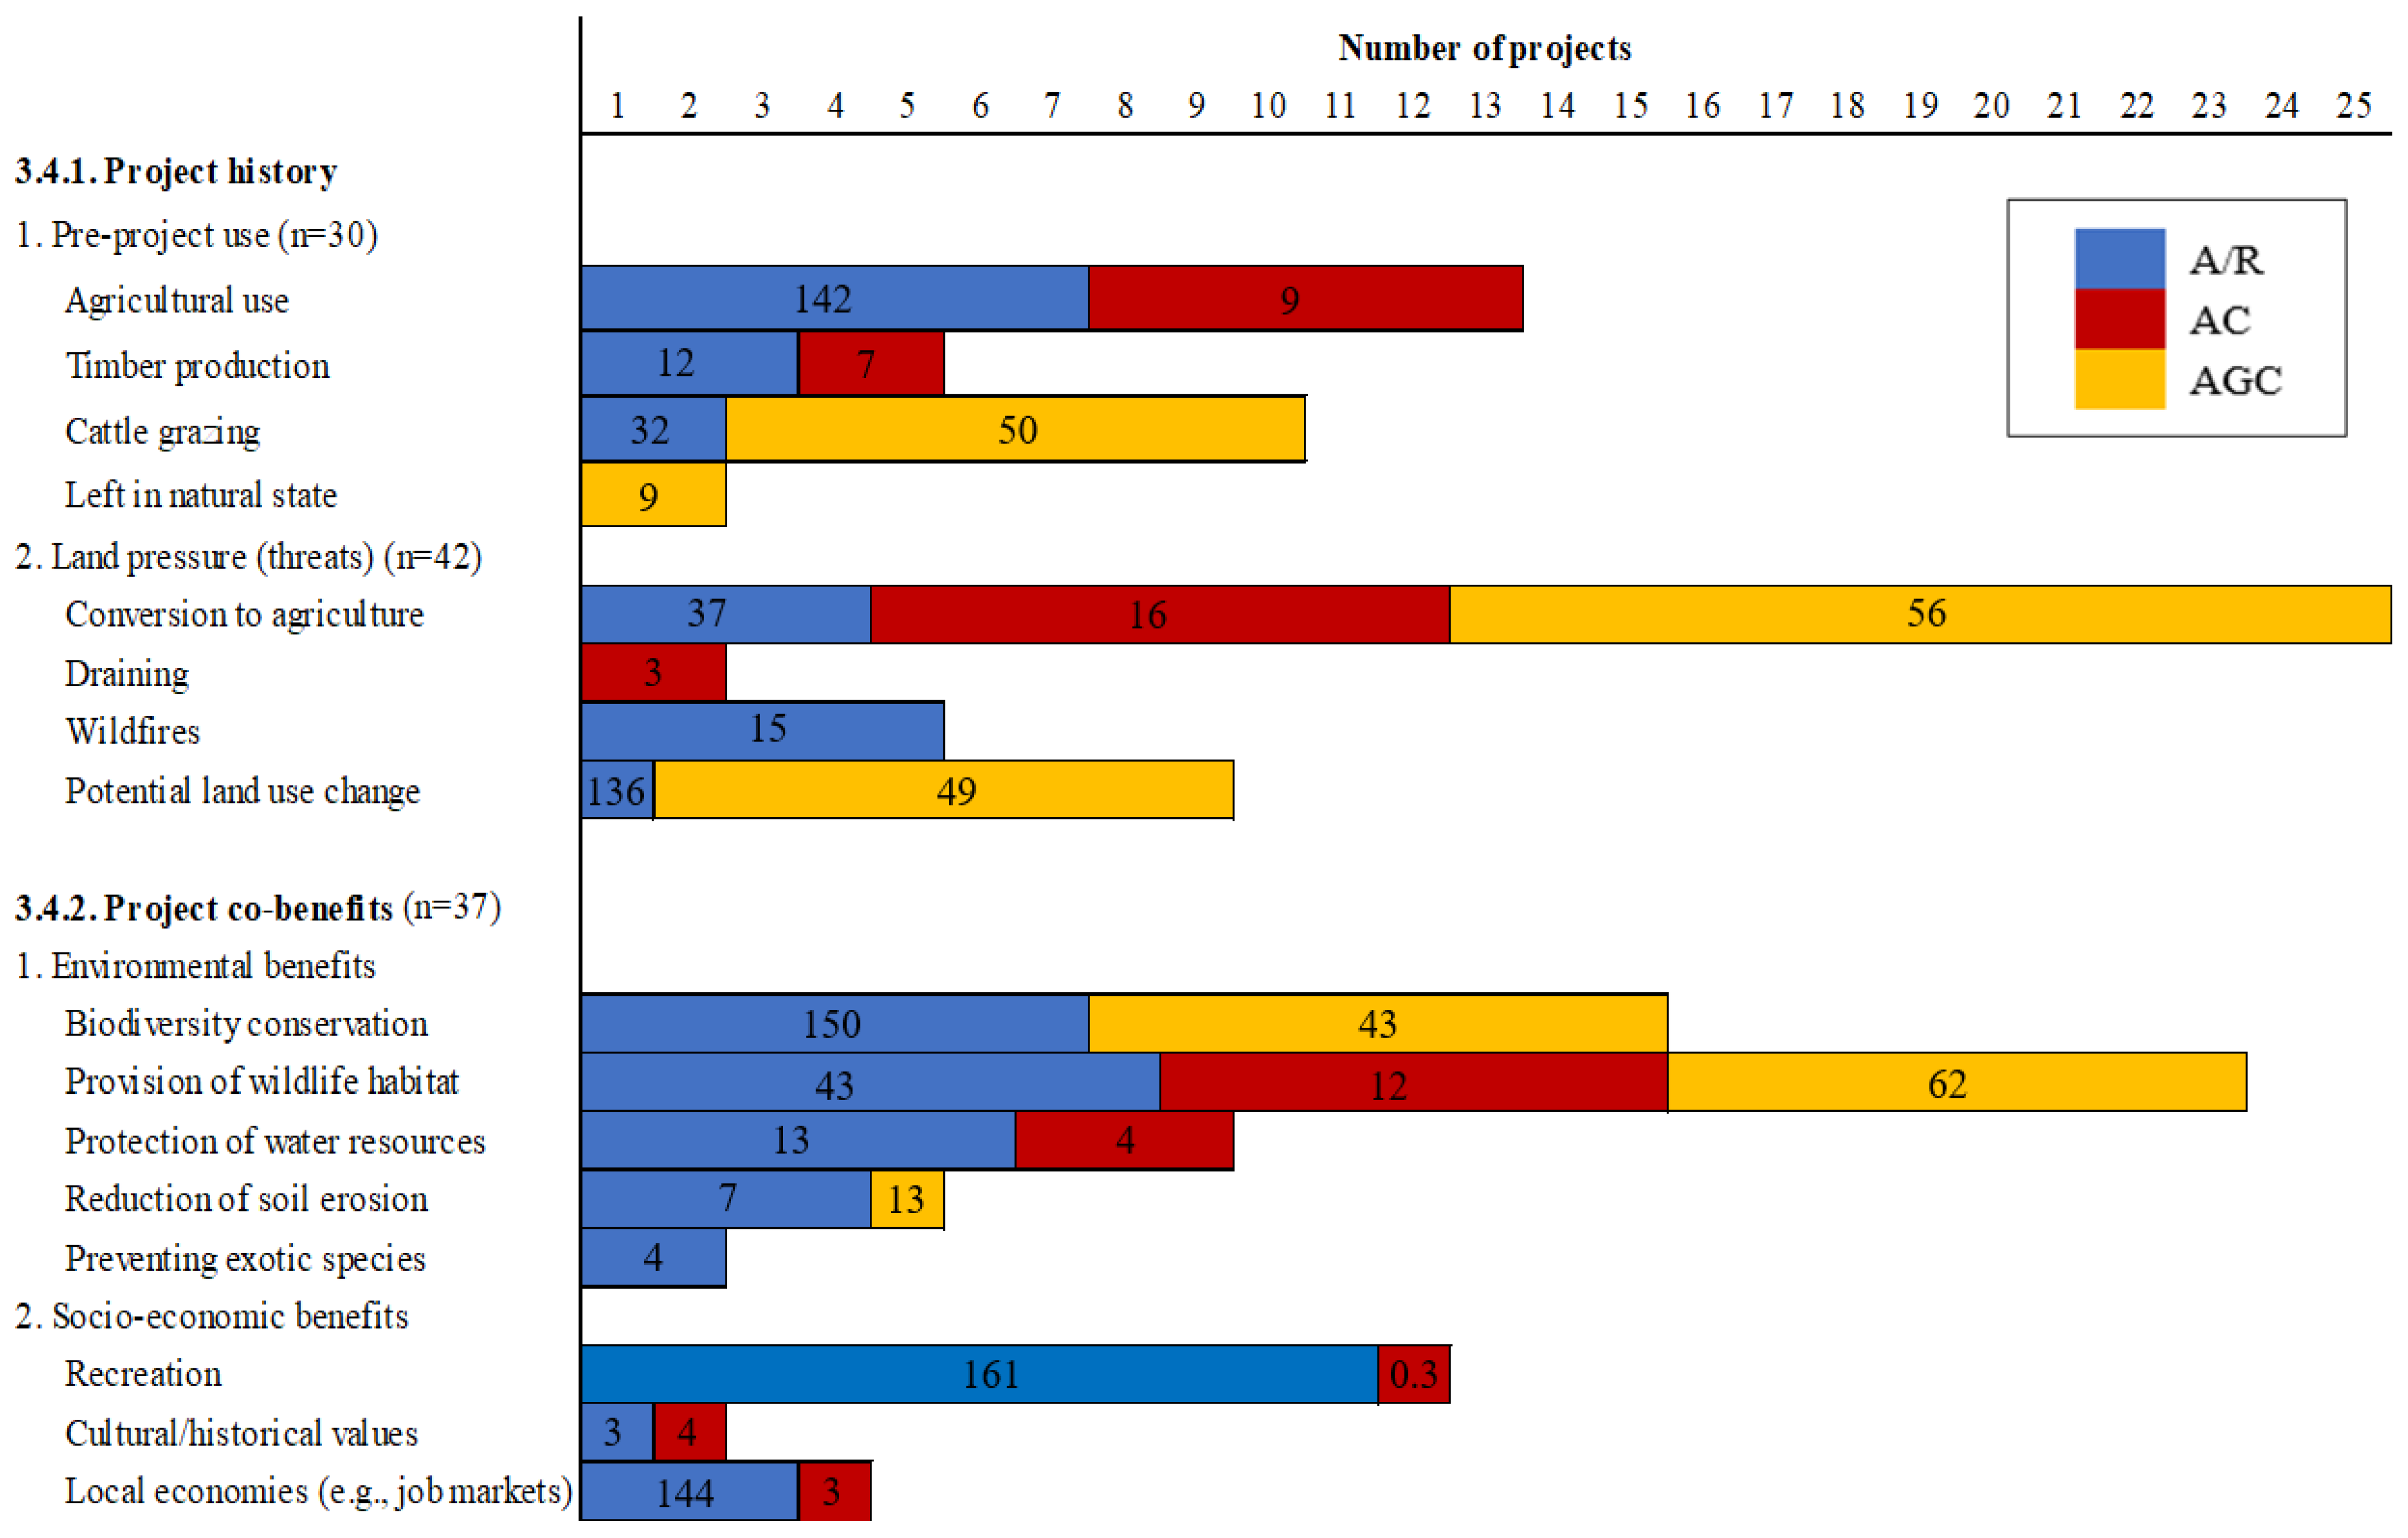
Figure 3 illustrates the number of projects across different project attributes identified through content analysis in the four subsections. Due to the variability in guidelines and components of project design documents among different developers, the number of projects associated with each attribute varies. However, it is also important to note that the absence of a specific co-benefit in these documents does not necessarily indicate that the co-benefit does not exist.

Figure 3.
The number of projects associated with each attribute based on the content analysis. Notes: the figures in individual bars represent the total acreage in thousands with respect to the project.
3.4.1. Project History
- Pre-project use: Agricultural use and cattle grazing were the most common pre-project uses for FCO projects, but these varied by project type. For A/R and AC projects, row crop production was the predominant pre-project usage (7 A/R and 4 AC projects), followed by timber production in commercial forests (3 A/R and 2 AC projects). In contrast, livestock grazing, such as cattle ranching on land with little to no tree canopy, was the typical pre-project use for eight AGC projects. Meanwhile, two AGC projects had been left naturally for no particular reason, while preserving native shortgrass prairie. In terms of acreage, agricultural use accounted for the largest land size with approximately 151,000 acres (142,000 acres from A/R and 9000 acres from AC projects).
- Land pressure/threats: The main land pressure on project areas included conversion to agriculture or cropland across all project types, encompassing four A/R, eight AC, and thirteen AGC projects. Agricultural practices like plowing may put pressure on the land, thereby degrading soil organic matter and reducing plant cover. For instance, before the implementation of AC projects, bottomland hardwoods and pine forests in the North Carolina region had been converted into agricultural croplands for the production of soybeans, wheat, corn, and other crops. This led to the loss of wildlife habitats and contributed to soil erosion. Five A/R projects also experienced severe wildfires before they started, which killed most of the existing trees and left limited seeds for natural regeneration. Furthermore, eight AGC projects faced the potential threat of grasslands being converted to agricultural or developmental uses due to land use change. Regarding the acreage, potential land use change represented the largest land area, totaling about 185,000 acres (136,000 acres from A/R and 49,000 acres from AGC projects).
3.4.2. Project Co-Benefits
All project types developed and operated different activities for creating environmental and socio-economic co-benefits. Of all, A/R projects had the highest average number of co-benefits, with a mean of 3.1. In contrast, AC projects averaged 2.5 co-benefits, while AGC projects had an average of 1.8 co-benefits.
- Environmental benefits
- Biodiversity conservation: A/R (150,000 acres) and AGC (43,000 acres) projects underscored the significance of biodiversity and ecosystem services (e.g., protection of native flora and fauna, species richness, and land restoration) as key benefits. Eight AGC projects focused on enhancing ecological functions associated with grassland ecosystems through the conservation of native prairies. Seven A/R projects focused on improving forest health and restoring native plant and wildlife communities by enhancing carbon sequestration. However, these benefits were not documented in AC projects.
- Provision of wildlife habitat: Most projects across the types emphasized the importance of providing habitats for wildlife, with some specifically targeted for threatened and endangered species, including eight A/R (43,000 acres), seven AC (12,000 acres), and eight AGC (62,000 acres) projects. For example, A/R projects in Louisiana planted a diverse mix of native bottomland hardwood tree species to protect the habitats of waterfowl, neotropical migrant songbirds, and black bears. Furthermore, AC and AGC projects were engaged in conserving the habitats of federally endangered species, such as the Red Wolf, Bald Eagle, and black-footed ferret through natural forest management practices.
- Protection of water resources: Six A/R (13,000 acres) projects emphasized the importance of enhancing groundwater recharge by reducing surface runoff and evaporation and trapping water underground through root systems. Such activities could help restore impaired water bodies by reducing nonpoint source sediment and nutrient pollution from agricultural landscapes. In three AC (4000 acres) projects in wetland forests, activities such as draining and altering water control structures are prohibited because of a permanent conservation easement, which ensures that the natural water table is maintained. This management approach helps promote wetland forest restoration and is connected to a larger water network of similar ditches, ensuring sufficient water pressure and quality.
- Reduction of soil erosion: Four A/R (7000 acres) and one AGC (13,000 acres) projects focused on controlling soil erosion and sedimentation while enhancing soil moisture and fertility within the project areas. For instance, an A/R project reported that the project activities are expected to reduce human-induced soil erosion and degradation and soil compaction caused by grazing and cropping in the Tensas River, which has been classified as a state-impaired waterbody. The improved moisture and soil nutrients resulting from tree planting can significantly enhance carbon storage capability by fostering the development of a dense network of lateral roots. The enhancement of subsoil nutrients boosts land productivity, which in turn reduces the need for fertilizers and minimizes water waste and runoff pollution.
- Protection from exotic species: Two A/R projects (4000 acres) emphasized preventing the growth of exotic species. The A/R project in California state park, where 95% of the area was destroyed by the cedar wildfire in 2003, focused on restoring the forest canopy to reduce shade-intolerant exotics such as Bromus tectorum (cheatgrass), B. diandrus (ripgut brome), and other invasive non-native grasses, which are highly flammable and expected to increase the frequency of wildfires. Another A/R project in Florida established a monitoring plan to prevent or minimize the spread of potential exotic species. In addition, the project obtained a non-native species planting permit, which includes effective safeguarding measures to prevent the spread of exotic species.
- Socio-economic benefits
- Recreation: Eleven A/R (161,000 acres) and one AC (300 acres) projects indicated that reforestation efforts will enhance public recreational opportunities by improving habitats for game animals such as deer, turkey, and waterfowl. These projects will also support other leisure activities, including camping, hiking, fishing, birding, mountain biking, and wildlife photography. Furthermore, the projects are expected to facilitate environmental education for visitors on restoration, soil fertility, and wildfire recovery.
- Cultural/historical values: A/R (3000 acres) and AC (4000 acres) projects offered the opportunity to protect cultural resources and sites. For example, an A/R project in a California state park implemented protective measures to preserve trails, archaeological sites, and other culturally significant resources from the effects of vegetation management activities. These projects highlighted the importance of finding a qualified cultural resource specialist to evaluate any discovered cultural resources prior to moving forward with project activities. Another AC project at the historic Middleton Place Gardens site has been preserved through archival and field research, incorporating appropriate historic protection measures and vegetation management.
- Local economies (e.g., job markets): Three A/R (144,000 acres) and one AC (3000 acres) projects emphasized engagement with landowners throughout the development and implementation phases in supporting the employment of local residents. Furthermore, such projects have the potential to stimulate local economic development by increasing demand for goods such as stationery items, food provisions, local hotel accommodations, and services related to site monitoring. This can significantly improve livelihoods by boosting revenue for landowners and contributing positively to the local economy.
4. Discussion
VCMs have emerged as the main nature-based climate solutions to achieve global GHG reduction targets since the Kyoto Protocol. In addition to their effectiveness in mitigating carbon emissions, VCMs also provide a range of co-benefits such as biodiversity conservation and improved livelihoods. However, most previous analyses of forestry projects within VCM have focused on empirical analyses of individual projects, especially IFM, which limits our understanding of other FCO project types. Through a comprehensive review of publicly available project documents from three main offset registries, we analyzed the status of 46 existing A/R, AC, and AGC projects within VCM in the US. Our analysis examined geographical characteristics of acreage and ownerships by project types, issued credits by ownership types, credit issuance and retirement trends over the last two decades, and detailed contents of the project’s implementation practice, including project history and co-benefits.
Our findings reveal the concentration of carbon projects in the southern and western states. This may be attributed to the suitability of lands for establishing a carbon project, dynamics of forest growth and management, variations in carbon policies, forest ownership structure, presence of forest products processing, and land use for other sectors of the economy [35]. Forests in the Northwest and Southeast are highly productive and efficient in sequestering carbon. They are also susceptible to land use conversions and disturbances such as wildfire and insect-pest damage. A/R projects in such landscapes help restore degraded or damaged forests by planting trees. For example, the Feather River Restoration Project of California is expected to restore areas burned by the 2020 Bear Mountain Fire through reforestation activities [36]. The establishment of AC projects in the Southeast could be attributed to the relatively lower land values for forestlands compared to those for residential and commercial uses [37]. In addition, state funding and carbon policies for carbon mitigation, as well as forest landowners’ knowledge and willingness to enroll their land in carbon programs, may have influenced the project distributions. Altogether, these factors likely contribute to landowner’s active engagement in carbon programs in these regions.
The types of FCO projects implemented vary across different states as they are driven by each state’s unique environmental conditions, economic priorities, and regulatory frameworks [38]. For instance, in Arkansas, where A/R projects are a priority and project sizes are among the largest in comparison to other states, many croplands along the Mississippi River were originally forested wetlands. The reliance on groundwater for irrigation in this region raised issues with high irrigation costs and land degradation resulting from groundwater overdrafts. Such environmental situations make afforestation a cost-effective alternative for carbon sequestration relative to traditional agriculture in Arkansas [39,40]. On the other hand, Montana and Colorado are susceptible to wildfires and have experienced significant population growth and urban expansion, which have increased the pressure to convert forested areas to non-forested lands. For instance, Colorado recorded 56,580 wildfires in 2023 that burned a total of 2,693,910 acres [41], while the state population grew by 14% between 2010 and 2020 [42]. In this context, AC projects may play a critical role in mitigating the effects of urban sprawl by preventing the conversion of existing forestlands and preserving stored carbon.
Regarding project ownership, individuals or families (30.4%), private companies (28.3%), and NGOs (28.3%) own most projects. This aligns with the findings of Engel et al. [43], who suggested that private landowners and companies are often motivated by economic incentives such as carbon credits, subsidies, and tax benefits. Van Kooten et al. [44] also highlighted that private ownership presents relatively low barriers to entry into the offset market due to the flexibility and rapid decision-making that facilitate the successful implementation of forest carbon projects. Further, NGOs have become increasingly involved in climate mitigation services as intermediaries for local communities, including private landowners [45]. Regarding credits issued by ownership types, our findings reveal that individuals or family landowners have issued the highest share of credits across all three project types, with an average of 58.1%. With regard to IFM projects, however, Kaarakka et al. [24] reported different findings, indicating that private companies owned 75% of IFM projects and issued nearly 70% of total credits.
Our analysis of issued and retired carbon credits by vintage period shows that A/R projects have a substantially higher volume of both issued and retired credits compared to AC and AGC projects. This can be attributed to the fact that A/R projects involve establishing new forests on previously deforested or non-forested lands, resulting in a greater volume of credits compared to AC projects [46]. While the cost of establishing A/R projects may be higher than forest conservation projects, the number of A/R projects has been growing worldwide, thereby increasing the amount of issued credits [47]. For example, 125 A/R projects are currently registered under Verra [48]. These include projects from various regions, including Latin America, Africa, Asia, Oceania, North America, and Europe. As more A/R projects are issued, the VCM may observe an increased supply of credits. Since 2018, AGC projects have outpaced AC projects in credit generation, indicating a shift in their relative trends. This change may be driven by the increased recognition of the importance of grassland restoration. As grassland degradation intensified between 2001 and 2011, restoring grasslands has become a central focus of global efforts to achieve ecosystem biodiversity targets, including the Aichi Biodiversity Targets of the Convention on Biological Diversity and the United Nations Sustainable Development Goals [49]. After 2019, however, the total number of issued and retired credits across all project types has shown a downward trend. This aligns with the trends in VCM, where credit issuances are expected to decline by 66%, and retirements are projected to drop by 72% between 2021 and 2023 [50]. This may be attributed to the effects of the COVID-19 pandemic, which led to a significant reduction in carbon emission reductions [51] and diminished demand for offsets due to growing criticism regarding the transparency and accuracy of credit mechanisms [4]. The vintage period can also impact the transaction and retirement of issued credits. The vintage period of credit refers to the year in which the credits are issued or retired. Older vintages may raise quality concerns regarding their effectiveness in reducing emissions due to improvements in protocols and monitoring methodologies that may not apply to earlier projects. This may lead to a decline in both the perceived quality and market value of these credits. As a result, demand for credits from older vintages may decline, causing their prices to fall relative to those from newer vintages [52]. However, there is limited evidence regarding the variations in the quality of credits from different vintages, making it difficult to fully understand its long-term impact.
The results of the content analysis have important implications for understanding project history and its co-benefits. One of the primary land pressures prior to project implementation was the conversion of land for agricultural purposes. This finding is supported by Bellarby et al. [53], who noted that the largest sources of agricultural GHG emissions come from nitrous oxide released from fertilized soils and methane from cattle. This suggests that land with higher carbon emissions may be more likely to engage in forest carbon programs. In terms of co-benefits, project documents show that A/R projects provide more diverse co-benefits compared to AC and AGC projects. These benefits include habitat restoration, water and soil provision, recreational opportunities, and support for local economies, with A/R projects averaging more than three co-benefits. This may be due to a relatively large A/R project that covered 136,000 acres. Our findings are in line with Lazdinis et al. [54] and Kemppinen et al. [55], who stressed that A/R is a crucial mechanism in creating functional habitat networks that maintain biodiversity and serve as migratory pathways. Wang and Li [56] also found that large-scale afforestation enhances soil and water conservation. Moreover, Harbi et al. [57] described that afforestation positively affects living organisms and provides socioeconomic benefits to human society, (e.g., increasing daily income and improving human livelihood). Khan et al. [58] similarly identified a positive effect of the afforestation program on social sustainability and local economies, with a 24% rise in household income between 2014 and 2018. Overall, the number of projects and the acreage correspond well with the co-benefits provided by carbon projects after accounting for one exceptionally large A/R project.
Investments in A/R and AC carbon projects have grown unprecedentedly in the past few decades. Several factors may have contributed to this growth. On the demand side, due to increasing commitments from corporations to reduce and offset their emissions to achieve net-zero targets, the demand for verified removal offset credits (credits from tree growth) has surged. This has likely driven the development of carbon projects such as A/R that offer higher removal credits. On the supply side, about 130 million acres of land in the US are suitable for A/R activities [59]. Private landowners, including individuals and private companies, may be interested in expanding carbon projects on their land base for additional revenue streams and non-carbon ecosystem benefits. While there are many projects in the registration pipeline across registries, the issuance of credits from these projects may take several years. For example, Chestnut Carbon announced a contract with Microsoft in 2023 for the delivery of 362,000 A/R credits, with the first credit delivery expected by 2027 [60]. Due to the challenges associated with maintaining the pace of issuances, offset credits may be priced higher. In addition, as carbon project standards and methodologies continue to evolve, the supply of credits may slow down, and buyers’ focus could shift to credits from newer methodologies.
The lack of transparency surrounding voluntary carbon credit transactions is an urgent and pervasive issue. While certain information related to carbon projects (e.g., project background, issuance and retirement of credits) is accessible to the public, there is a need for greater transparency and clarity regarding other program attributes [4]. These attributes may include the price at which the credits from different vintages are traded, as well as the quality and integrity of credits. Kaarakka et al. [24] pointed out that many FCO projects provide limited detailed information on the specific management activities and their timelines. Guizar-Coutiño et al. [61], Stapp et al. [25], and West et al. [62,63] reported quality issues, particularly concerning the availability of data on baseline emissions as well as the ecological and socioeconomic impacts of carbon projects. In our study, we also found similar discrepancies in the content of project design documents. While several projects included detailed descriptions of management activities, such as the number of seedlings planted, site preparation, and baseline and project scenario carbon stocks, many others were missing some of this information. Due to the lack of accountability on both the demand and supply sides of the market, the trust in the VCM has been consistently low. As such, questions surrounding the accuracy of data, uniqueness of credit, and the use of credits for offsetting are often raised. The Integrity Council for the VCM was established in 2021 to maintain a global standard of ethics and transparency for the high integrity of carbon credits [64]. In response to the pressing challenge in the VCM, the US government also released a joint Policy Statement and principles aimed at enhancing market transparency and fostering participation in the carbon market with trust [10].
5. Conclusions
FCO projects are among the most important mechanisms for mitigating climate change by sequestering carbon through activities such as A/R, AC, and IFM. Despite their importance, there has been limited research examining the carbon storage performance and co-benefits associated with different types of forest carbon projects. This study provides a detailed overview of A/R, AC, and AGC carbon projects within VCMs in the US, focusing on key aspects, including locations, acreage, ownership, credit volumes, and co-benefits. The results show a significant concentration of carbon projects in southern and western states. Additionally, individuals or families and private companies are the predominant owners across all three project types. Our analysis further reveals that A/R projects generate higher volumes of carbon offset credits and offer greater co-benefits compared to AC and AGC projects. These findings can contribute to advancing the current knowledge on the performance of FCO projects within VCMs and provide valuable insights for future research. This study has important limitations that warrant future research. First, the content analysis was exclusively based on project documents and reports from registries. Thus, there were similarities in the co-benefits reported across projects of the same type. Future research could further explore the project-level co-benefits from different regions of the US through case studies. Second, due to inconsistencies in data disclosure and the lack of comprehensive information, we were unable to provide an in-depth quantitative analysis of the factors influencing credit issuance and retirement. As more information on carbon projects becomes publicly available, future research could investigate how factors such as credit price and co-benefits influence carbon credit transactions and project establishments in different regions of the country.
Author Contributions
Conceptualization, S.B.; methodology, S.C. and S.B.; software, D.B.; validation, S.C., S.B. and D.B.; formal analysis, S.C.; investigation, S.C.; resources, S.C.; data curation, S.C.; writing—original draft, S.C.; writing—review and editing, S.C., S.B. and D.B.; visualization, S.B. and D.B.; supervision, S.B.; project administration, S.B.; funding acquisition, S.B. All authors have read and agreed to the published version of the manuscript.
Funding
This research was partially funded by the USDA NIFA Hatch Grant #7004797.
Data Availability Statement
Data can be supplied upon request. Carbon offset project documents we used in our study are publicly available at https://thereserve2.apx.com/mymodule/mypage.asp (accessed on 24 November 2024), https://acr2.apx.com/myModule/rpt/myrpt.asp?r=111 (accessed on 24 November 2024), and https://registry.verra.org/app/search/vcs (accessed on 24 November 2024).
Acknowledgments
We would like to thank Alisha Sharma and Kritagya Gyawali for assisting with data collection and reviewing the earlier drafts of this paper.
Conflicts of Interest
The authors declare no conflict of interest.
References
- Spilker, G.; Nugent, N. Voluntary Carbon Market Derivatives: Growth, Innovation & Usage. Borsa Istanb. Rev. 2022, 22, 109–118. [Google Scholar] [CrossRef]
- Hamilton, K.; Bayon, R.; Turner, G.; Higgins, D. State of the Voluntary Carbon Market 2007: Picking Up Steam. Ecosystem Marketplace. 2007. Available online: https://www.ecosystemmarketplace.com/publications/picking-up-steam/ (accessed on 23 December 2024).
- Dawes, A.; McGeady, C.; Majkut, J. Voluntary Carbon Markets: A Review of Global Initiatives and Evolving Models. Center for Strategic and International Studies. Available online: https://www.csis.org/analysis/voluntary-carbon-markets-review-global-initiatives-and-evolving-models (accessed on 23 December 2024).
- Delacote, P.; L’Horty, T.; Kontoleon, A.; West, T.A.P.; Creti, A.; Filewod, B.; LeVelly, G.; Guizar-Coutiño, A.; Groom, B.; Elias, M. Strong Transparency Required for Carbon Credit Mechanisms. Nat. Sustain. 2024, 7, 706–713. [Google Scholar] [CrossRef]
- Shell and BCG. The Voluntary Carbon Market: 2022 Insights and Trends. Available online: https://www.shell.com/shellenergy/othersolutions/carbonmarketreports.html (accessed on 2 June 2024).
- TSVCM. Taskforce on Scaling Voluntary Carbon Markets: Final Report. Available online: https://www.iif.com/Portals/1/Files/TSVCM_Report.pdf (accessed on 2 June 2024).
- World Bank. State and Trends of Carbon Pricing 2023; World Bank: Washington, DC, USA, 2023; ISBN 978-1-4648-2006-9. [Google Scholar]
- Haya, B.K.; Abayo, A.; So, I.; Elias, M.V. Voluntary Registry Offsets Database V10. Available online: https://gspp.berkeley.edu/faculty-and-impact/centers/cepp/projects/berkeley-carbon-trading-project/offsets-database (accessed on 14 August 2024).
- The White House. FACT SHEET: One Year In, President Biden’s Inflation Reduction Act Is Driving Historic Climate Action and Investing in America to Create Good Paying Jobs and Reduce Costs. Available online: https://www.whitehouse.gov/briefing-room/statements-releases/2023/08/16/fact-sheet-one-year-in-president-bidens-inflation-reduction-act-is-driving-historic-climate-action-and-investing-in-america-to-create-good-paying-jobs-and-reduce-costs/ (accessed on 13 December 2024).
- The White House. Voluntary Carbon Markets Joint Policy Statement and Principles. Available online: https://home.treasury.gov/system/files/136/VCM-Joint-Policy-Statement-and-Principles.pdf (accessed on 6 September 2024).
- Blanton, A.; Mohan, M.; Galgamuwa, G.A.P.; Watt, M.S.; Montenegro, J.F.; Mills, F.; Carlsen, S.C.H.; Velasquez-Camacho, L.; Bomfim, B.; Pons, J.; et al. The Status of Forest Carbon Markets in Latin America. J. Environ. Manag. 2024, 352, 119921. [Google Scholar] [CrossRef]
- Ke, S.; Zhang, Z.; Wang, Y. China’s Forest Carbon Sinks and Mitigation Potential from Carbon Sequestration Trading Perspective. Ecol. Indic. 2023, 148, 110054. [Google Scholar] [CrossRef]
- Kreibich, N. Toward Global Net Zero: The Voluntary Carbon Market on Its Quest to Find Its Place in the Post-Paris Climate Regime. WIREs Clim. Change 2024, 15, e892. [Google Scholar] [CrossRef]
- Chen, S.; Marbouh, D.; Moore, S.; Stern, K. Voluntary Carbon Offsets: An Empirical Market Study. Available online: https://papers.ssrn.com/sol3/papers.cfm?abstract_id=3981914 (accessed on 14 December 2024).
- Delbeke, J.; Marro, E.; Vis, P. School of Transnational Governance; European University Institute: Florence, Italy, 2023; ISBN 978-92-9466-388-7. [Google Scholar]
- Putney, J.D.; Kline, N.; Fitzgerald, S.; Grand, L.; Schnepf, C.; Latta, G.; Shults, P.; Rizza, J. Introduction to Forest Carbon, Offsets and Markets. Pac. Northwest Ext. 2023, PNW 775, 1–17. Available online: https://extension.oregonstate.edu/catalog/pub/pnw-775-introduction-forest-carbon-offsets-markets (accessed on 23 December 2024).
- Brantley, M.; Mize, C.; Qiao, S. Multi-Objective GIS Analysis for Avoided Conversion Carbon Credits and Biodiversity Conservation. Ph.D. Thesis, Duke University, Durham, NC, USA, 2019. [Google Scholar]
- Sauer, T.J.; James, D.E.; Cambardella, C.A.; Hernandez-Ramirez, G. Soil Properties Following Reforestation or Afforestation of Marginal Cropland. Plant Soil 2012, 360, 375–390. [Google Scholar] [CrossRef]
- Zhang, B.; Lan, K.; Harris, T.B.; Ashton, M.S.; Yao, Y. Climate-Smart Forestry through Innovative Wood Products and Commercial Afforestation and Reforestation on Marginal Land. Proc. Natl. Acad. Sci. USA 2023, 120, e2221840120. [Google Scholar] [CrossRef]
- Ahlering, M.; Fargione, J.; Parton, W. Potential Carbon Dioxide Emission Reductions from Avoided Grassland Conversion in the Northern Great Plains. Ecosphere 2016, 7, e01625. [Google Scholar] [CrossRef]
- Griscom, B.W.; Cortez, R. The Case for Improved Forest Management (IFM) as a Priority REDD+ Strategy in the Tropics. Trop. Conserv. Sci. 2013, 6, 409–425. [Google Scholar] [CrossRef]
- Fargione, J.E.; Bassett, S.; Boucher, T.; Bridgham, S.D.; Conant, R.T.; Cook-Patton, S.C.; Ellis, P.W.; Falcucci, A.; Fourqurean, J.W.; Gopalakrishna, T.; et al. Natural Climate Solutions for the United States. Sci. Adv. 2018, 4, eaat1869. [Google Scholar] [CrossRef] [PubMed]
- Kaarakka, L.; Cornett, M.; Domke, G.; Ontl, T.; Dee, L.E. Improved Forest Management as a Natural Climate Solution: A Review. Ecol. Solut. Evid. 2021, 2, e12090. [Google Scholar] [CrossRef]
- Kaarakka, L.; Rothey, J.; Dee, L.E. Managing Forests for Carbon–Status of the Forest Carbon Offset Markets in the United States. PLoS Clim. 2023, 2, e0000158. [Google Scholar] [CrossRef]
- Stapp, J.; Nolte, C.; Potts, M.; Baumann, M.; Haya, B.K.; Butsic, V. Little Evidence of Management Change in California’s Forest Offset Program. Commun. Earth Environ. 2023, 4, 331. [Google Scholar] [CrossRef]
- Schirmer, J.; Bull, L. Assessing the Likelihood of Widespread Landholder Adoption of Afforestation and Reforestation Projects. Glob. Environ. Change 2014, 24, 306–320. [Google Scholar] [CrossRef]
- Sexton, J.M. Feasibility Study of Carbon Offsets as a Source of Revenue for a Land Trust Using the Climate Action Reserve’s Avoided Conversion Protocol. Master’s Thesis, The University of Tennessee at Chattanooga, Chattanooga, TN, USA, 2011. [Google Scholar]
- Baker, J.S.; Proville, J.; Latané, A.; Cajka, J.; Aramayo-Lipa, L.; Parkhurst, R. Additionality and Avoiding Grassland Conversion in the Prairie Pothole Region of the United States. Rangel. Ecol. Manag. 2020, 73, 201–215. [Google Scholar] [CrossRef]
- CAR. Public Reports—Projects. Available online: https://thereserve2.apx.com/mymodule/mypage.asp (accessed on 13 May 2024).
- ACR Public Reports. Public Reports—Projects. Available online: https://acr2.apx.com/myModule/rpt/myrpt.asp?r=111 (accessed on 13 May 2024).
- Verra Verified Carbon Standard. All Projects. Available online: https://registry.verra.org/app/search/vcs (accessed on 13 May 2024).
- Sass, E.M.; Butler, B.J.; Markowski-Lindsay, M.A. Forest Ownership in the Conterminous United States circa 2017: Distribution of Eight Ownership Types—Geospatial Dataset. Available online: https://www.fs.usda.gov/rds/archive/Catalog/RDS-2020-0044 (accessed on 18 July 2024).
- U.S. Census Bureau. 2023 TIGER/Line Shapefiles 2023. Available online: http://www.census.gov/geographies/mapping-files/time-series/geo/tiger-line-file.html (accessed on 11 June 2024).
- Fischer, R.; Hargita, Y.; Günter, S. Insights from the Ground Level? A Content Analysis Review of Multi-National REDD+ Studies since 2010. For. Policy Econ. 2016, 66, 47–58. [Google Scholar] [CrossRef]
- Adams, D.M.; Alig, R.; Latta, G.; White, E.M. Regional Impacts of a Program for Private Forest Carbon Offset Sales. J. For. 2008, 109, 444–453. [Google Scholar] [CrossRef]
- Carbon Streaming. Feather River Reforestation. Available online: https://www.carbonstreaming.com/project/feather-river-reforestation/ (accessed on 29 December 2024).
- Malmsheimer, R.W.; Heffernan, P.; Brink, S.; Crandall, D.; Deneke, F.; Galik, C.; Gee, E.; Helms, J.A.; McClure, N.; Mortimer, M.; et al. Forest Management Solutions for Mitigating Climate Change in the United States. J. For. 2008, 106, 115–173. [Google Scholar] [CrossRef]
- Malmsheimer, R.W.; Bowyer, J.L.; Fried, J.S.; Gee, E.; Izlar, R.L.; Miner, R.A.; Munn, I.A.; Oneil, E.; Stewart, W.C. Managing Forests Because Carbon Matters: Integrating Energy, Products, and Land Management Policy. J. For. 2011, 109, S7. [Google Scholar] [CrossRef]
- Konikow, K.M. Groundwater Depletion in the United States (1900–2008): U.S. Geological Survey Scientific Investigations Report 2013−5079. Available online: https://pubs.usgs.gov/publication/sir20135079 (accessed on 10 August 2024).
- Kovacs, K.F.; Haight, R.G.; Moore, K.; Popp, M. Afforestation for Carbon Sequestration in the Lower Mississippi River Basin of Arkansas, USA: Does Modeling of Land Use at Fine Spatial Resolution Reveal Lower Carbon Cost? For. Policy Econ. 2021, 130, 102526. [Google Scholar] [CrossRef]
- National Interagency Coordination Center. Wildland Fire Summary and Statistics Annual Report 2023. Available online: https://www.nifc.gov/sites/default/files/NICC/2-Predictive%20Services/Intelligence/Annual%20Reports/2023/annual_report_2023_0.pdf (accessed on 17 October 2024).
- U.S. Census Bureau. 2020 Census Data. Available online: https://www.census.gov/programs-surveys/decennial-census/decade/2030/planning-management/plan/research-and-testing/2024-national-census-survey.html (accessed on 17 October 2024).
- Engel, S.; Pagiola, S.; Wunder, S. Designing Payments for Environmental Services in Theory and Practice: An Overview of the Issues. Ecol. Econ. 2008, 65, 663–674. [Google Scholar] [CrossRef]
- Van Kooten, G.C.; Shaikh, S.L.; Suchánek, P. Mitigating Climate Change by Planting Trees: The Transaction Costs Trap. Land Econ. 2002, 78, 559–572. [Google Scholar] [CrossRef]
- Jones, L.; Harvey, B.; Godfrey-Wood, R. The Changing Role of NGOs in Supporting Climate Services. Available online: https://odi.cdn.ngo/media/documents/10885.pdf (accessed on 1 November 2024).
- Griscom, B.W.; Adams, J.; Ellis, P.W.; Houghton, R.A.; Lomax, G.; Miteva, D.A.; Schlesinger, W.H.; Shoch, D.; Siikamäki, J.V.; Smith, P.; et al. Natural Climate Solutions. Proc. Natl. Acad. Sci. USA 2017, 114, 11645–11650. [Google Scholar] [CrossRef] [PubMed]
- Grafton, R.Q.; Chu, H.L.; Nelson, H.; Bonnis, G. A Global Analysis of the Cost-Efficiency of Forest Carbon Sequestration. In OECD Environment Working Papers; No. 185; Organization for Economic Co-Operation and Development: Paris, France, 2021. [Google Scholar]
- Verra Verified Carbon Standard. Registered ARR Projects. Available online: https://registry.verra.org/app/search/VCS/All%20Projects (accessed on 29 December 2024).
- Bardgett, R.D.; Bullock, J.M.; Lavorel, S.; Manning, P.; Schaffner, U.; Ostle, N.; Chomel, M.; Durigan, G.; Fry, E.L.; Johnson, D.; et al. Combatting Global Grassland Degradation. Nat. Rev. Earth Environ. 2021, 2, 720–735. [Google Scholar] [CrossRef]
- Carbon Direct. 2023 State of the Voluntary Carbon Market. Available online: https://www.carbon-direct.com/research-and-reports/state-of-the-voluntary-carbon-market (accessed on 8 September 2024).
- IEA. CO2 Emissions in 2022. Available online: https://www.iea.org/reports/co2-emissions-in-2022 (accessed on 27 July 2024).
- CarbonBetter. Understanding Carbon Offset Vintages in Important for Choosing the Right Offsets. Available online: https://carbonbetter.com/story/carbon-offset-vintages/ (accessed on 4 November 2024).
- Bellarby, J.; Foereid, B.; Hastings, A.F.S.J.; Smith, P. Cool Farming: Climate Impacts of Agriculture and Mitigation Potential. Available online: https://www.greenpeace.org/usa/wp-content/uploads/legacy/Global/usa/report/2009/4/cool-farming-climate-impacts.pdf (accessed on 4 November 2024).
- Lazdinis, M.; Roberge, J.-M.; Kurlavičius, P.; Mozgeris, G.; Angelstam, P. Afforestation Planning and Biodiversity Conservation: Predicting Effects on Habitat Functionality in Lithuania. J. Environ. Plan. Manag. 2005, 48, 331–348. [Google Scholar] [CrossRef]
- Kemppinen, K.M.S.; Collins, P.M.; Hole, D.G.; Wolf, C.; Ripple, W.J.; Gerber, L.R. Global Reforestation and Biodiversity Conservation. Conserv. Biol. 2020, 34, 1221–1228. [Google Scholar] [CrossRef]
- Wang, Y.; Li, B. Dynamics Arising from the Impact of Large-scale Afforestation on Ecosystem Services. Land Degrad. Dev. 2022, 33, 3186–3198. [Google Scholar] [CrossRef]
- Harbi, J.; Erbaugh, J.T.; Sidiq, M.; Haasler, B.; Nurrochmat, D.R. Making a Bridge between Livelihoods and Forest Conservation: Lessons from Non Timber Forest Products’ Utilization in South Sumatera, Indonesia. For. Policy Econ. 2018, 94, 1–10. [Google Scholar] [CrossRef]
- Khan, N.; Shah, S.J.; Rauf, T.; Zada, M.; Yukun, C.; Harbi, J. Socioeconomic Impacts of the Billion Trees Afforestation Program in Khyber Pakhtunkhwa Province (KPK), Pakistan. Forests 2019, 10, 703. [Google Scholar] [CrossRef]
- American Carbon Registry. Afforestation and Reforestation of Degraded Lands. Available online: https://acrcarbon.org/resources/afforestation-reforestation/#:~:text=Establishing%20forests%20on%20marginal%20and,R)%20activities%5B1%5D (accessed on 4 January 2025).
- Chestnut Carbon. Chestnut Carbon to Deliver High-Quality Carbon Removal Credits Through a Multi-Year Offtake Agreement with Microsoft. Available online: https://chestnutcarbon.com/chestnut-carbon-to-deliver-high-quality-carbon-removal-credits-through-a-multi-year-offtake-agreement-with-microsoft/ (accessed on 4 January 2025).
- Guizar-Coutiño, A.; Jones, J.P.G.; Balmford, A.; Carmenta, R.; Coomes, D.A. A Global Evaluation of the Effectiveness of Voluntary REDD+ Projects at Reducing Deforestation and Degradation in the Moist Tropics. Conserv. Biol. 2022, 36, e13970. [Google Scholar] [CrossRef] [PubMed]
- West, T.A.P.; Börner, J.; Sills, E.O.; Kontoleon, A. Overstated Carbon Emission Reductions from Voluntary REDD+ Projects in the Brazilian Amazon. Proc. Natl. Acad. Sci. USA 2020, 117, 24188–24194. [Google Scholar] [CrossRef]
- West, T.A.P.; Wunder, S.; Sills, E.O.; Börner, J.; Rifai, S.W.; Neidermeier, A.N.; Frey, G.P.; Kontoleon, A. Action Needed to Make Carbon Offsets from Forest Conservation Work for Climate Change Mitigation. Science 2023, 381, 873–877. [Google Scholar] [CrossRef] [PubMed]
- The Integrity Council for the VCM. Available online: https://icvcm.org/ (accessed on 29 December 2024).
Disclaimer/Publisher’s Note: The statements, opinions and data contained in all publications are solely those of the individual author(s) and contributor(s) and not of MDPI and/or the editor(s). MDPI and/or the editor(s) disclaim responsibility for any injury to people or property resulting from any ideas, methods, instructions or products referred to in the content. |
© 2025 by the authors. Licensee MDPI, Basel, Switzerland. This article is an open access article distributed under the terms and conditions of the Creative Commons Attribution (CC BY) license (https://creativecommons.org/licenses/by/4.0/).