Article

Response of Non-Structural Carbohydrates and Carbon, Nitrogen and Phosphorus Stoichiometric Characteristics of Ochroma lagopus Leaves to Nitrogen Addition

1
College of Forestry, Southwest Forestry University, Kunming 650224, China
2
The Key Laboratory of Forest Resources Conservation and Utilization in the Southwest Mountains of China Ministry of Education, Southwest Forestry University, Kunming 650224, China
3
Key Laboratory of National Forestry and Grassland Administration on Biodiversity Conservation in Southwest China, Southwest Forestry University, Kunming 650224, China
4
College of Materials and Chemical Engineering, Southwest Forestry University, Kunming 650224, China
*
Author to whom correspondence should be addressed.
Forests 2025, 16(1), 117; https://doi.org/10.3390/f16010117
Submission received: 29 November 2024 / Revised: 31 December 2024 / Accepted: 8 January 2025 / Published: 10 January 2025
(This article belongs to the Section Forest Ecophysiology and Biology)

Abstract

:
The response of non-structural carbohydrates and stoichiometric characteristics of Ochroma lagopus to nitrogen addition is currently unclear. In this study, a 2-year-old O. lagopus was selected, and seven nitrogen addition treatments were set up to investigate the effects of nitrogen addition on the non-structural carbohydrates and stoichiometric characteristics. O. lagopus tree height and diameter increased by 2.00%–14.00% and 3.74%–16.93%, respectively. Nitrogen addition significantly increased leaf soluble sugar, starch, and NSC (non-structural carbohydrates) contents of O. lagopus forests. Their changing trends showed a first increasing and then decreasing trend with increasing fertiliser application in both urea and slow-release fertilisation treatments. Nitrogen addition significantly increased soil N content, leaf N content, and leaf N/P in O. lagopus forests, all of which increased with the increase in urea and slow-release fertiliser application; while leaf P content in O. lagopus forests was significantly lower in nitrogen addition treatments compared with CK (no fertiliser treatment), and decreased with the increase in urea and slow-release fertiliser application. O. lagopus leaf NSC had highly significant positive correlations with soil N, leaf N content, and N/P, and significant negative correlations with leaf P content and C/N. As a result, the application of both urea and slow-release fertiliser increased the soil N content, improved N uptake and utilisation, and promoted the growth of O. lagopus, with the application of slow-release fertiliser at 450 g/plant being the best treatment, and the slow-release fertiliser being superior to urea.

1. Introduction

Nitrogen (N) is a crucial element for plants. It influences plant growth, nutrient uptake and utilisation, and energy storage. When plant growth is limited by nitrogen, adding nitrogen improves plant growth and development [1]. In contrast, excessive nitrogen inhibits plant growth and adversely affects plant productivity [2]. Nitrogen addition can improve soil nitrogen content, increase the ability of soil to supply nitrogen, and affect the photosynthetic capacity and biomass accumulation of plants [3]. Quick-release N fertilisers are commonly used in agroforestry to increase the nitrogen content of forest stands [4]; however, quick-release N fertilisers have a low utilisation rate that only meets the short-term nitrogen demand of plants [5]. Slow-release fertilisers, which are long-lasting and stable, provide nutrients, as plants require them during different growth stages [6]. They slowly release nutrients into the soil over a long period to ensure a continuous supply of nitrogen, meeting the plant’s demand for nitrogen and reducing the loss of nitrogen [7].
Non-structural carbohydrates (NSC) are compounds necessary for carbon assimilation and consumption during plant growth and survival. They include soluble sugars (SSs), which regulate cellular osmotic pressure and resist stress and starches (STs), which are used for long-term energy storage [8]. Changes in the leaf carbohydrate content reflect the dynamic balance between assimilated products and those used for growth [9]. Nitrogen addition affects the ability of leaves to assimilate NSC, in turn affecting the nitrogen fixation capacity and NSC content of leaves [10]. Global-scale meta-analyses have shown that nitrogen addition increases leaf SSs content and decreases leaf STs content [11]. However, the effect of nitrogen addition on NSC content differs for different species. The leaf STs content of spruce decreased with an increase in nitrogen application, whereas the SSs content did not change significantly [12]. Studies on the effect of nitrogen addition on the NSC content have provided contradictory results.
Carbon (C), nitrogen (N), and phosphorus (P) are crucial elements for plant growth. The N and P contents reflect the nutrient uptake capacity of plants, a critical indicator of the nutrient status of plants [13]. Carbon is a structural element required for the plant skeleton. N and P are functional elements that are more sensitive to environmental changes than structural elements [14]. Leaf C, N, and P contents are related to many key functions of plant growth and reproduction and can be used as indicators of plant nutrient utilisation and response to environmental changes [15]. Leaf stoichiometry has been used to assess plant genetic characteristics and plant adaptations to environmental conditions [16]. Nitrogen addition affects the distribution of elements in plants. Some studies have shown that nitrogen addition can increase plant leaf nitrogen content, but the effect on the phosphorus content differs for different amounts of N applications [17]. Low concentrations of nitrogen improve plant growth and the uptake of phosphorus, increasing leaf phosphorus content. However, excess amounts of nitrogen exacerbate phosphorus depletion in leaves, resulting in lower phosphorus contents. Nitrogen addition substantially affects the C, N, and P contents and the stoichiometric ratio of plant leaves by changing N availability in the soil [18]. Therefore, analysing the influence of different amounts of N addition on plant C, N, and P contents and their stoichiometric ratio provides information on nutrient cycling and ecological stoichiometric characteristics.
Ochroma lagopus, a large evergreen tree in the family of Bombacaceae, is a tropical fast-growing timber species with excellent characteristics, such as a fast growth rate, low density, and short production cycle [19,20]. O. lagopus has other properties suitable for construction, such as good elasticity, uniform material, easy processing, sound insulation, and heat insulation. It can be used not only as a material for many light structures, but also as a special material for aviation, navigation, and military industries. It can also be used to make various models or plastic panels for exhibitions. The only success in trial planting in China occurred in the low altitude area of Xishuangbanna, Yunnan province, but the cultivation and management techniques are still immature. Studies on O. lagopus have focused on seed viability [21] and seedling growth, whereas no studies have been conducted on the effects of nitrogen fertiliser application on the growth of O. lagopus. In this experiment, two-year-old O. lagopus trees were used to study the effects of soil nutrients and the application of urea and slow-release fertiliser on NSC and the stoichiometric characteristics. The objectives were to determine the optimal nitrogen application amount to improve O. lagopus growth and provide a scientific basis and technological support for O. lagopus cultivation.

2. Materials and Methods

2.1. Study Area

This experiment was carried out at the O. lagopus plantation of Mengxing Farm, Mengla County, Xishuangbanna Dai Autonomous Prefecture, Yunnan Province (21°54′ N~21°55′ N, 101°10′ E~101°30′ E, 550 m elevation). The plots had a size of 3.0 m × 5.0 m, with no plot overlap. The area has a southwestern tropical monsoon climate with distinct dry and wet seasons.
The soil in the study area is red loam with a pH of 4.28, an organic matter content of 23.6 g/kg, a total nitrogen content of 1.59 g/kg, a total phosphorus content of 0.32 g/kg, and a total potassium content of 12.0 g/kg. The average height of the trees in the standard plots in the nitrogen addition experiment was 7.5 m, and the average diameter at breast height (DBH) was 9.8 cm.

2.2. Experimental Design

Two-year-old O. lagopus were used in the nitrogen addition experiment. The fertiliser application rate was based on local production practises and fertiliser trials of fast-growing species, such as eucalyptus and tropical tree species. The tree spacing was 3 m between the rows and 5 m within the rows. Three amounts of fertiliser were used: 92 kg/ha of N, 136 kg/ha of N, and 184 kg/ha of N. We used three urea treatments (N1 (urea 300 g/plant), N2 (urea 450 g/plant), and N3 (urea 600 g/plant)), three slow-release fertiliser treatments (H1 (slow-release fertiliser 300 g/plant), H2 (slow-release fertiliser 450 g/plant), and H3 (slow-release fertiliser 600 g/plant)), and one control treatment, CK (no nitrogen fertiliser). The experiment was a completely randomised block design with 30 O. lagopus trees per treatment for a total of 7 treatments and 3 replications per treatment (630 O. lagopus trees) (Table 1) Protective rows of 4–6 m were used between adjacent sample plots to avoid fertiliser contamination between different fertiliser treatments.
Nitrogen was applied in the form of urea (containing N ≥ 46%) and resin-coated slow-release fertiliser (containing N ≥ 46% slow-release fertiliser—a kind of fertiliser with relatively slow nutrient release rate. It encapsulates or fixes the nutrients in the fertiliser in a specific form inside the fertiliser particles by physical, chemical, or biochemical means, so that the nutrients are gradually released in the soil at a certain rate to meet the needs of the whole growth cycle of the crop. This release mode not only reduces the loss and waste of nutrients, but also avoids the damage to crop roots due to excessive nutrient concentration). Both were obtained from the Yunnan Yuntianhua Group. The urea fertiliser was applied in a cyclic extra-root application. A ditch with a width of 5–10 cm and 50–60 cm from the base of the tree was dug, filled with fertiliser, and covered to reduce the volatilisation of the fertiliser. The fertiliser was applied in two applications to prevent root burning. The first addition of nitrogen fertiliser was carried out at the end of June 2023, and 1/2 the amount of urea application test was designed. The slow-release fertiliser was applied as a base fertiliser once. The second application was at the end of July. During the trial period, the woodland was managed normally with regular weeding, but no additional fertiliser was applied. Sampling was conducted 90 d after the end of fertilisation.

2.3. Sample Collection and Measurements

Nine representative standard trees were randomly selected in the sample plots, and their height (H) and diameter at breast (DBH) were measured. Use high-branch scissors to collect leaves and bring them back to the laboratory. Immediately after cleaning, put it in an oven at 120 °C for 30 min, then dry at 80 °C until it reaches constant weight in the oven (Taisite Instrument Co., Ltd., Tianjin, China). The dried samples were ground and stored in sealed bags for the determination of carbon, nitrogen, phosphorus, soluble sugar, and starch contents. Soluble sugar concentrations were determined using the concentrated H2SO4-phenol method [22]. 0.2 g of each sample was placed in a centrifuge tube (Bkmamlab, Changsha, China) and 8 mL of distilled water was added. The mixture is bathed in 95 °C water for 30 min, then centrifuged at 5000 rpm for 10 min. Take the supernatant, constant volume, save spare. Afterwards, 1 mL phenol reagent and 5 mL concentrated sulfuric acid were added to 1 mL soluble sugar extract (Solarbio, Beijing, China). After the reaction was completed, the color was developed for 30 min. The absorbance at 485 nm was measured and the soluble sugar concentration was calculated according to the standard curve. Extraction of starch: 7 mL distilled water was added to the above extraction residue and placed in a boiling water bath for 15 min. Then, 2 mL 9.2 mol/L perchloric acid (Beijing Zhongke Erhuan Technology Co., Ltd., Beijing, China) was added during heating, shaken well, and boiled in a boiling water bath for 15 min. Then the supernatant was centrifuged and diluted for the determination of starch content. The sum of the two contents is the non-structural carbohydrate (NSC) content [23]. The C content was determined by the potassium dichromate method plus dilution heating, the N content was determined by the colorimetric method, and the P content was determined by the molybdenum antimony anti-colorimetric method [24].
Soil samples were collected from nine randomly selected sampling points in each sample plot. Roots, stones, and other debris were removed, and the samples were brought back to the laboratory. The material was spread out at room temperature to allow the soil to dry naturally. The samples were ground, sieved, and stored in a self-sealing bag labelled with the sample number and time of collection. The soil total N, total P, and total K contents were determined using Naïve’s colourimetric method, vanadium–molybdenum yellow colourimetric method, and flame photometric method, respectively. A spectrophotometer was used to determine the total nitrogen and total phosphorus absorbance value, calculate the standard curve, and calculate the content. The total K was determined with a flame spectrophotometer (Sherwood M425) [24].

2.4. Data Processing

The experimental data were collated and analysed using Microsoft Excel 2010 and SPSS 27.0. Analysis of variance (ANOVA) was used to test for differences between the means of the treatment effects at a significance level of p < 0.05). Origin 2021 was used to plot the results.

3. Results and Analyses

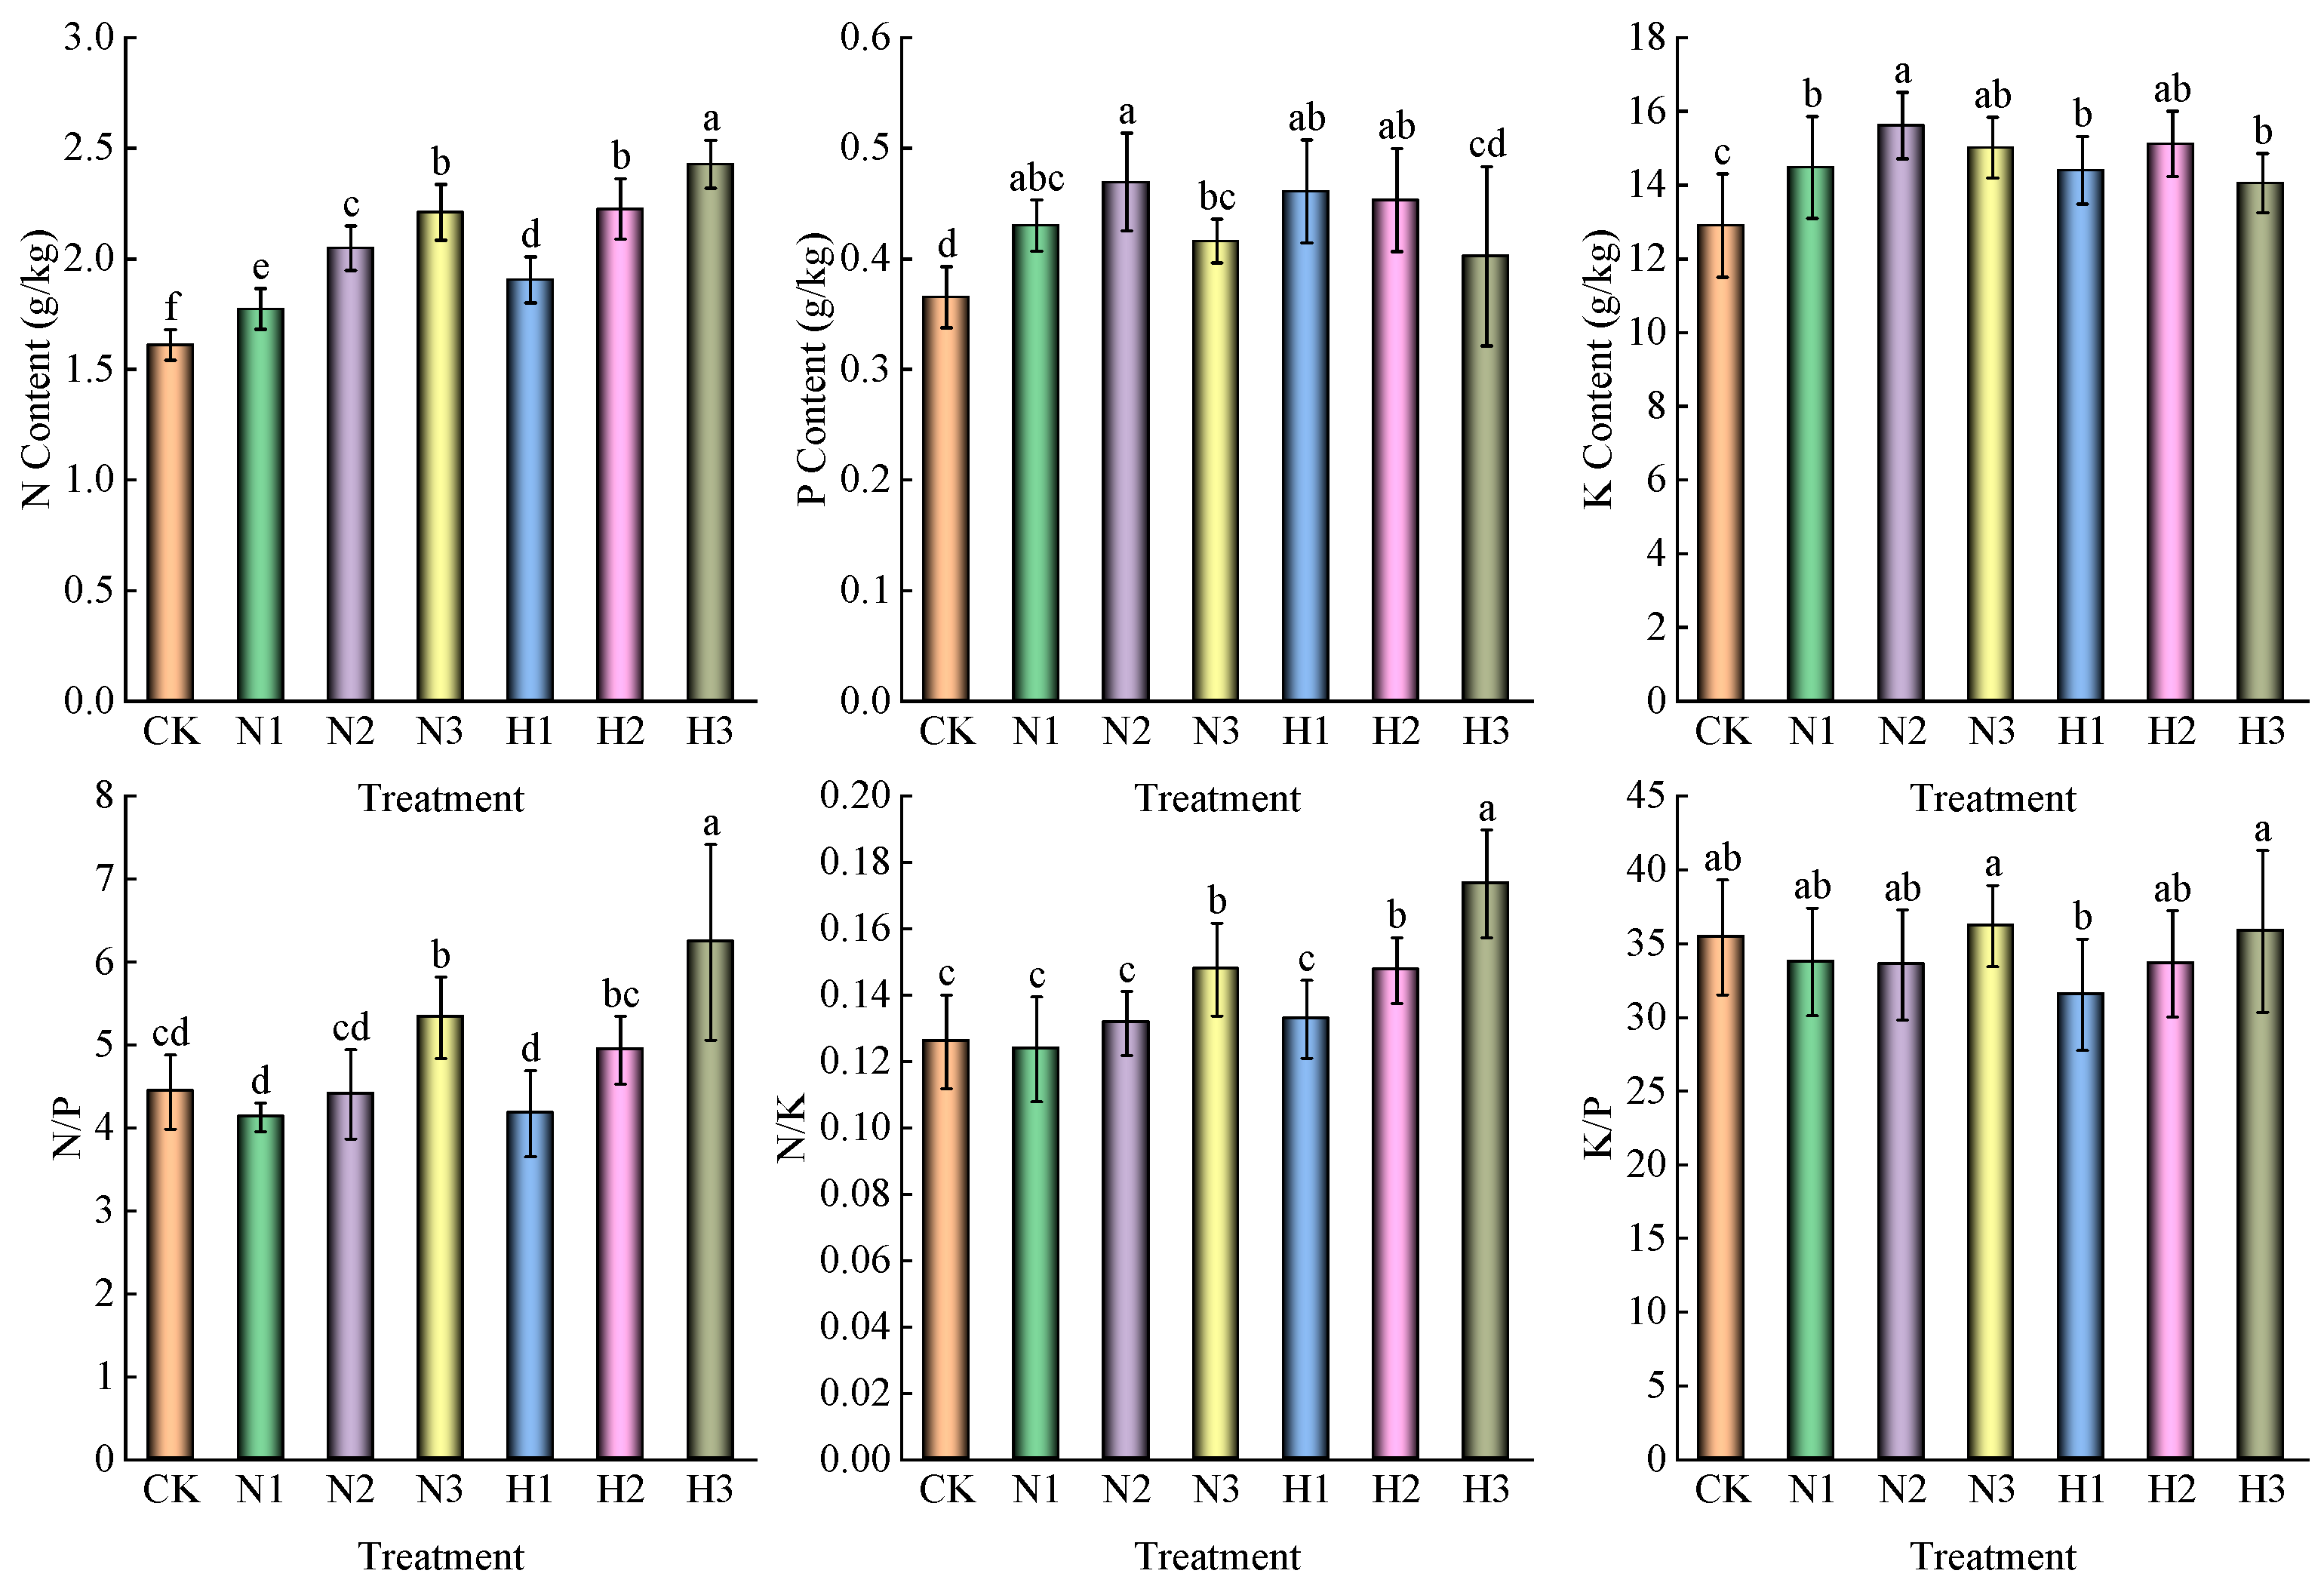
3.1. Effect of Nitrogen Addition on Soil Nutrient and Stoichiometric Characteristics

As shown in Figure 1, soil N, P, and K contents were higher in the fertiliser treatment than in the CK. The soil N content was significantly higher (10.16%–50.89%) in the N-addition treatments than in the CK. It increased in the amount of fertiliser in the urea and slow-release fertiliser treatments. At the same fertiliser amount, the soil N content was significantly higher in the slow-release fertiliser treatments than in the urea treatments. It was 7.41% higher in H3 than in N3, 8.69% higher in H2 than in N2, and 9.87% higher in H1 than in N1. The soil P content was higher in all N-addition treatments than in the CK. It was 10.19% higher in H3 than in CK and significantly higher in the other N-added treatments (11.63%–21.06%) than in the CK. The soil P content did not significantly differ between the urea and slow-release fertiliser treatments at the same fertiliser application rate. The soil K content was significantly higher (8.91%–21.06%) in the N-addition treatments than in the CK. The content increased and decreased as the fertiliser amount increased in the urea and slow-release fertiliser treatments. The soil K content was not significantly different between the urea and slow-release fertiliser treatments at the same fertiliser application rate. The soil N:P rate was significantly higher (20.19% and 40.70%,) in the N3 and H3 treatments, respectively, than in the CK. It did not differ significantly between all other treatments and the CK. The soil N:K rate was significantly higher (17.22%, 17.06%, and 37.78%) in the N3, N2, and H3 treatments, respectively, than in the CK. It did not differ significantly between all other treatments and the CK. The content increased with an increase in the fertiliser application rate in the urea treatment, followed by the slow-release fertiliser treatment.

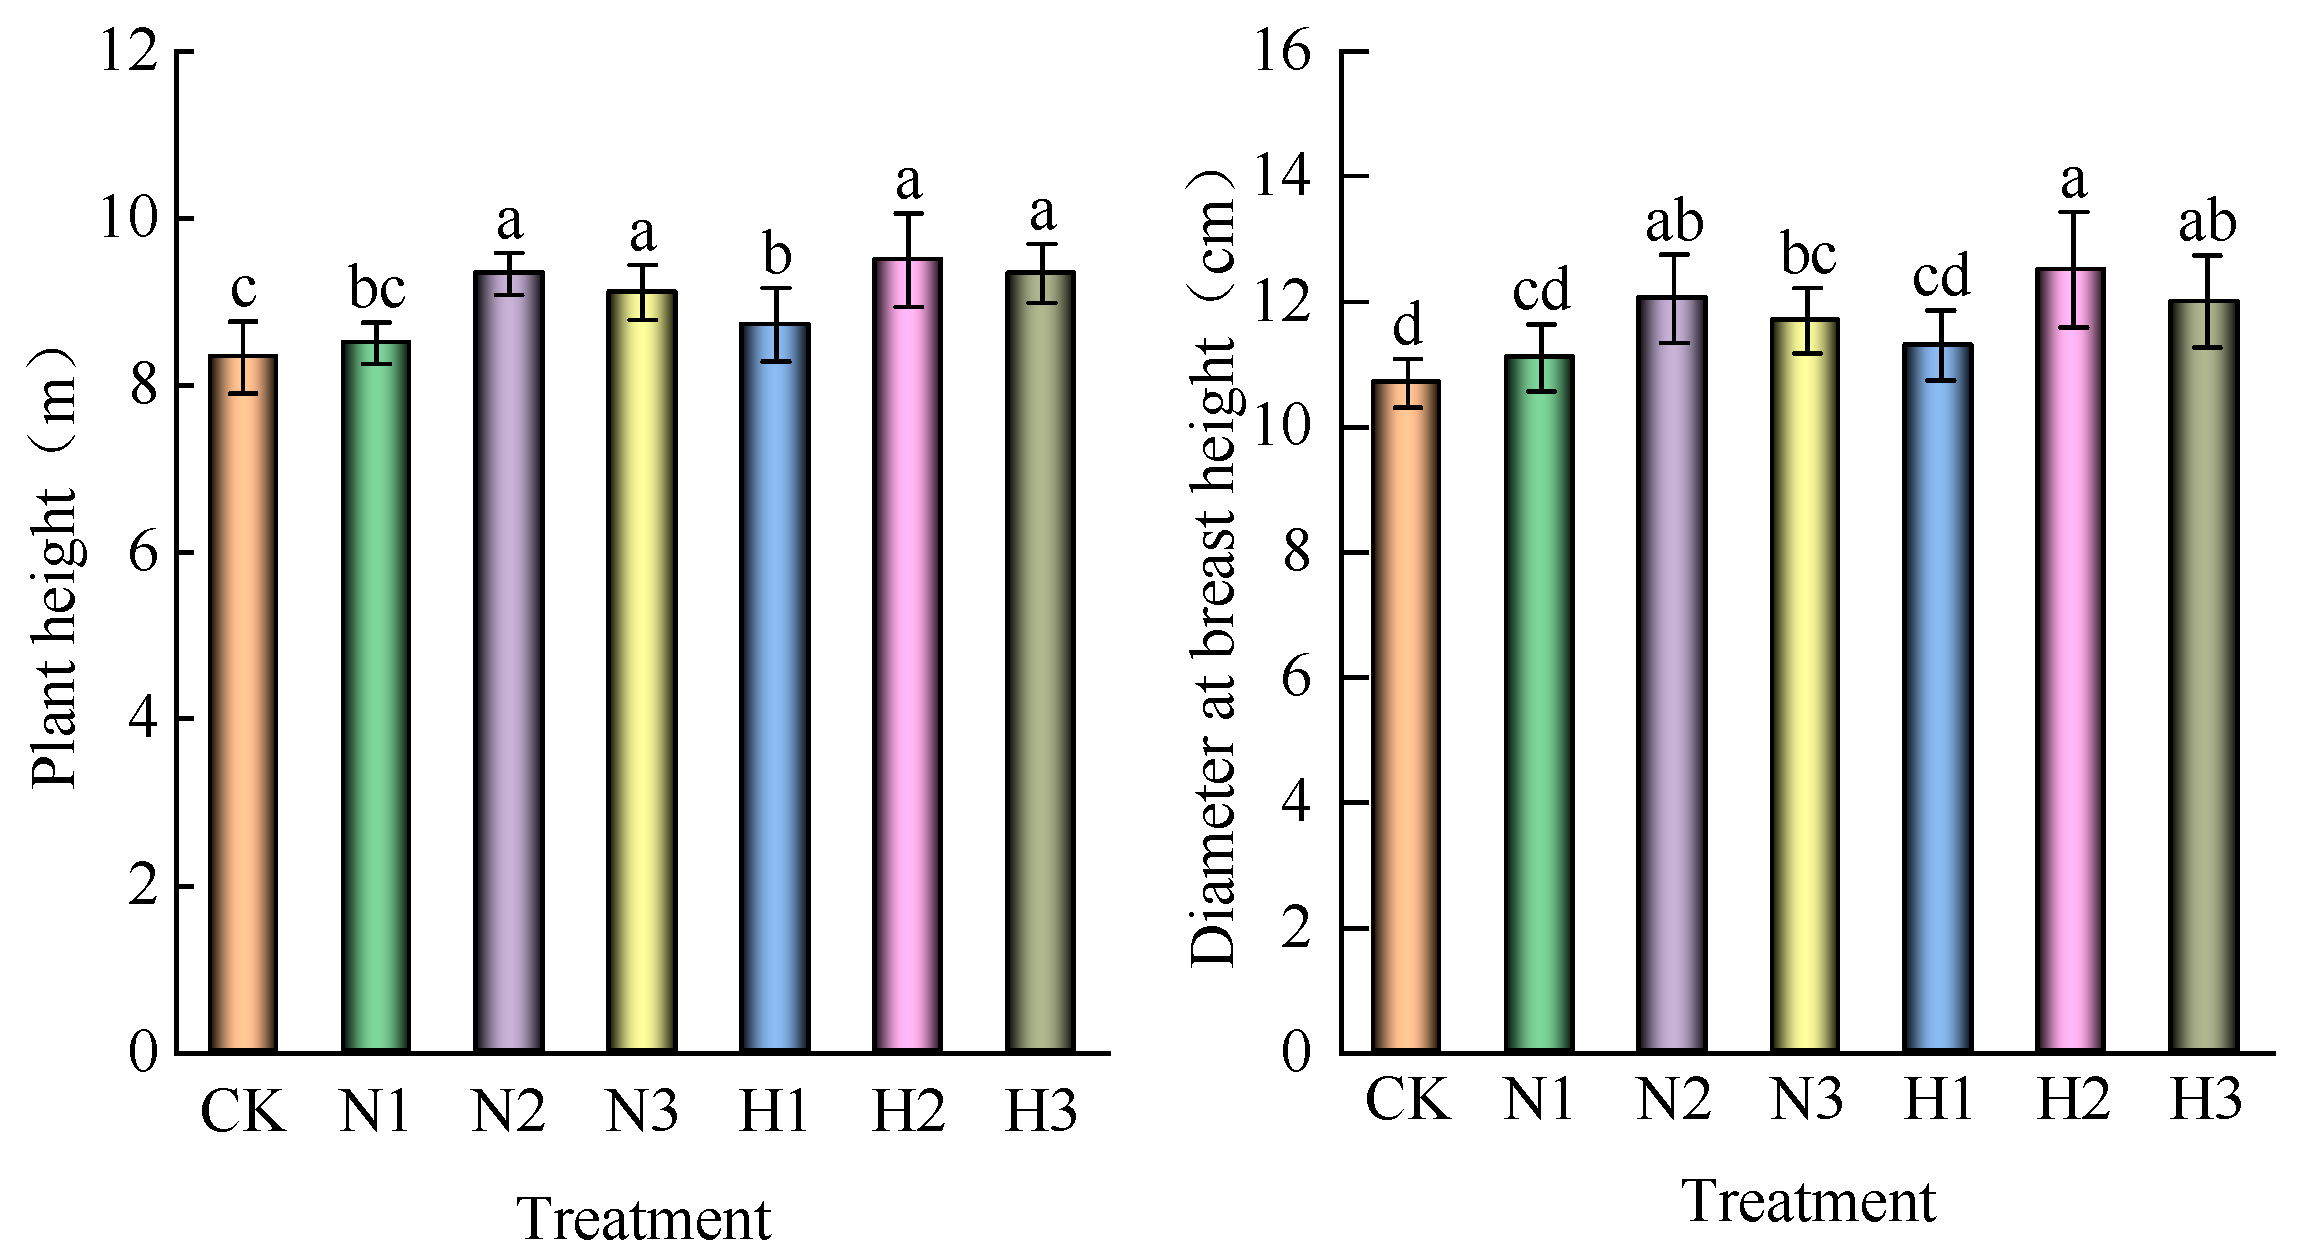
3.2. Effect of Nitrogen Addition on Height and Diameter at Breast Height of O. lagopus

As shown in Figure 2, the height of O. lagopus was 2.00%–14.00% larger in the N-addition treatments than in the CK treatments. The height increased and decreased with an increase in the fertiliser rate in the urea and slow-release fertiliser treatments. The DBH was 3.74%–16.93% larger in the N-addition treatments than in the CK. It increased and decreased with an increase in the fertiliser rate in the urea and slow-release fertiliser treatments. There was no significant difference in the height and DBH O. lagopus between the urea and slow-release fertiliser treatments at the same fertiliser application rate.

3.3. Effect of Nitrogen Addition on NSC Content of O. lagopus Leaves

As shown in Figure 3, the SSs content was significantly higher (83.82%–129.70%) in the N-addition treatments than in the CK. The content increased and decreased as the fertiliser application increased in the urea and slow-release fertiliser treatments. It was 17.95% higher in H3 than in N3 at the same fertiliser application rate. The STs content was significantly higher (19.07%–42.03%) in the N-addition treatments than in the CK. It increased and decreased as the fertiliser application increased in the urea and slow-release fertiliser treatments. There was no significant difference in STs between the same fertiliser application in urea and slow-release fertiliser treatments at the same fertiliser application rate. The NSC content was significantly higher (57.74%–86.95%) in the N-addition treatments than in the CK. It increased and decreased as the fertiliser application increased in the urea and with slow-release fertiliser treatments. The NSC content was 12.48% higher in H3 than in N3 at the same fertiliser application rate. The SSs and STs contents were 44.59%–68.21% higher in the N-addition treatments than in the CK. They decreased in the urea treatments and increased and decreased in the slow-release fertiliser treatments with an increase in the fertiliser application rate. At the same fertiliser application rate, the contents were 14.45% higher in H3 than in N3.

3.4. Effect of Nitrogen Addition on Carbon, Nitrogen, and Phosphorus Contents of O. lagopus Leaves

As shown in Figure 4, the C content decreased with the increasing fertiliser application rate in the urea and slow-release fertiliser treatments. The C content of N3 and H3 was significantly lower than that of CK by 5.73% and 5.33%, respectively. It was 15.83%–44.60% higher in the N-addition treatments than in the CK and increased as the fertiliser application rate rose in the urea and with slow-release fertiliser treatments. At the same fertiliser application rate, the leaf N content was significantly higher in the slow-release fertiliser treatments than in the urea treatments. It was 20.21% higher in H1 than in N1, 21.69% higher in H2 than in N2, and 15.36% higher in H3 than in N3. The leaf P content was significantly lower (7.94%–14.26%) in the N-addition treatments than in the CK. It decreased as the fertiliser application rate increased in the urea and slow-release fertiliser treatments. There was no significant difference in leaf P content between the urea and slow-release fertiliser treatments at the same fertiliser application rate. The leaf C/N rate was significantly lower (15.80%–47.77%) in the N-addition treatments than in the CK. It decreased with an increase in the fertiliser application rate in the urea and slow-release fertiliser treatments. The leaf C/P ratio was significantly higher in the N-addition treatments than in the CK, but there was no significant difference in the ratio between the N-addition treatments. The leaf N/P was significantly higher (29.18%–109.40%) in the N-addition treatments than in the CK. It increased as the fertiliser application rate rose in the urea and with slow-release fertiliser treatments. At the same fertiliser application rate, the N/P ratio was significantly higher in the slow-release fertiliser treatment than in the urea treatment. It was 23.89% higher in H1 than in N1, 23.62% higher in H2 than in N2, and 14.62% higher in H3 than in N3.

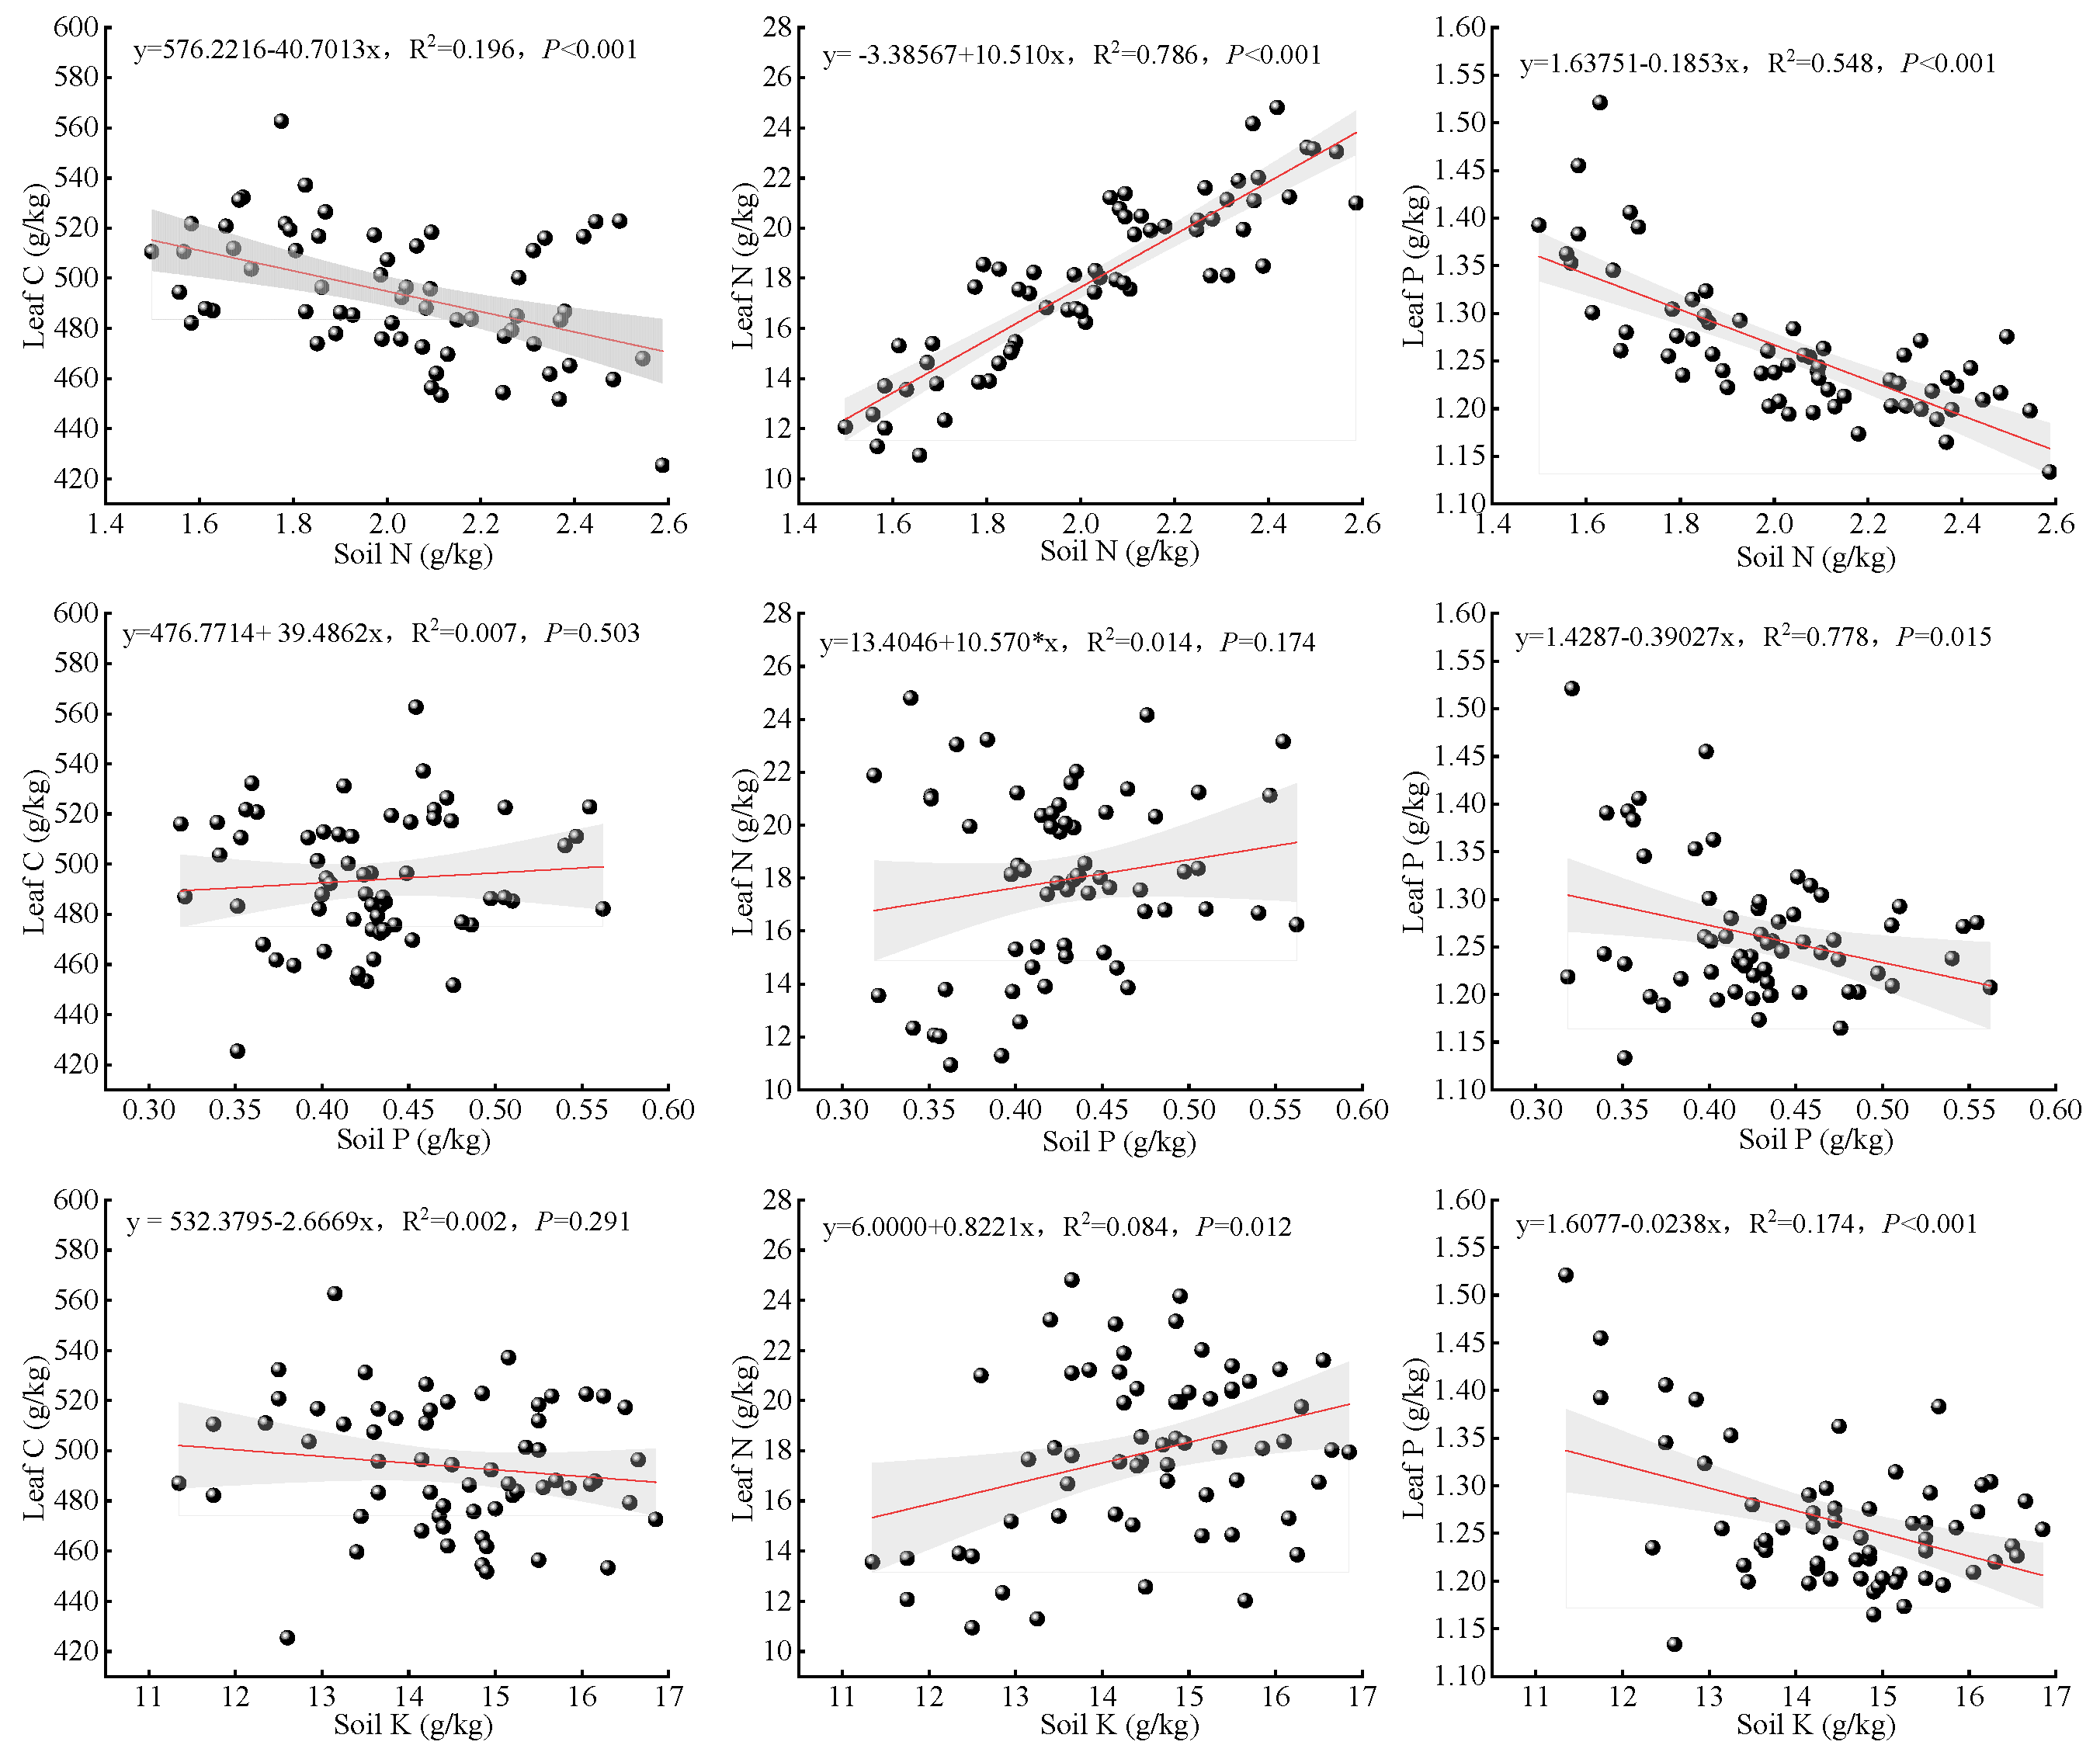
3.5. Correlation Between Soil Nutrients and O. lagopus Leaf NSC and Carbon, Nitrogen, and Phosphorus Contents

As shown in Figure 5, soil N had highly significant positive correlations (p < 0.01) with O. lagopus leaf SSs (R2 = 0.403, p < 0.001), STs (R2 = 0.322, p < 0.001), and NSC (R2 = 0.422, p < 0.001). Soil P had highly significant positive correlations (p < 0.01) with SSs (R2 = 0.220, p < 0.001), STs (R2 = 0.116, p = 0.004), and NSC (R2 = 0.215, p < 0.001). Soil K had highly significant positive correlations (p < 0.01) with SSs (R2 = 0.229, p < 0.001), STs (R2 = 0.221, p < 0.001), and NSC (R2 = 0.253, p < 0.001).
As shown in Figure 6, soil N content had highly significant negative correlations (p < 0.01) with O. lagopus leaf C content (R2 = 0.196, p < 0.001) and P content (R2 = 0.548, p < 0.001) and a highly significant positive correlation (p < 0.01) with the N content (R2 = 0.786, p < 0.001). There was a significant negative correlation (p < 0.05) between soil P content and leaf P content (R2 = 0.778, p = 0.015). There was a significant negative correlation (p < 0.05) between soil K content and leaf N content (R2 = 0.084, p = 0.012) and a highly significant negative correlation (p < 0.01) between soil K and P content (R2 = 0.174, p < 0.001).

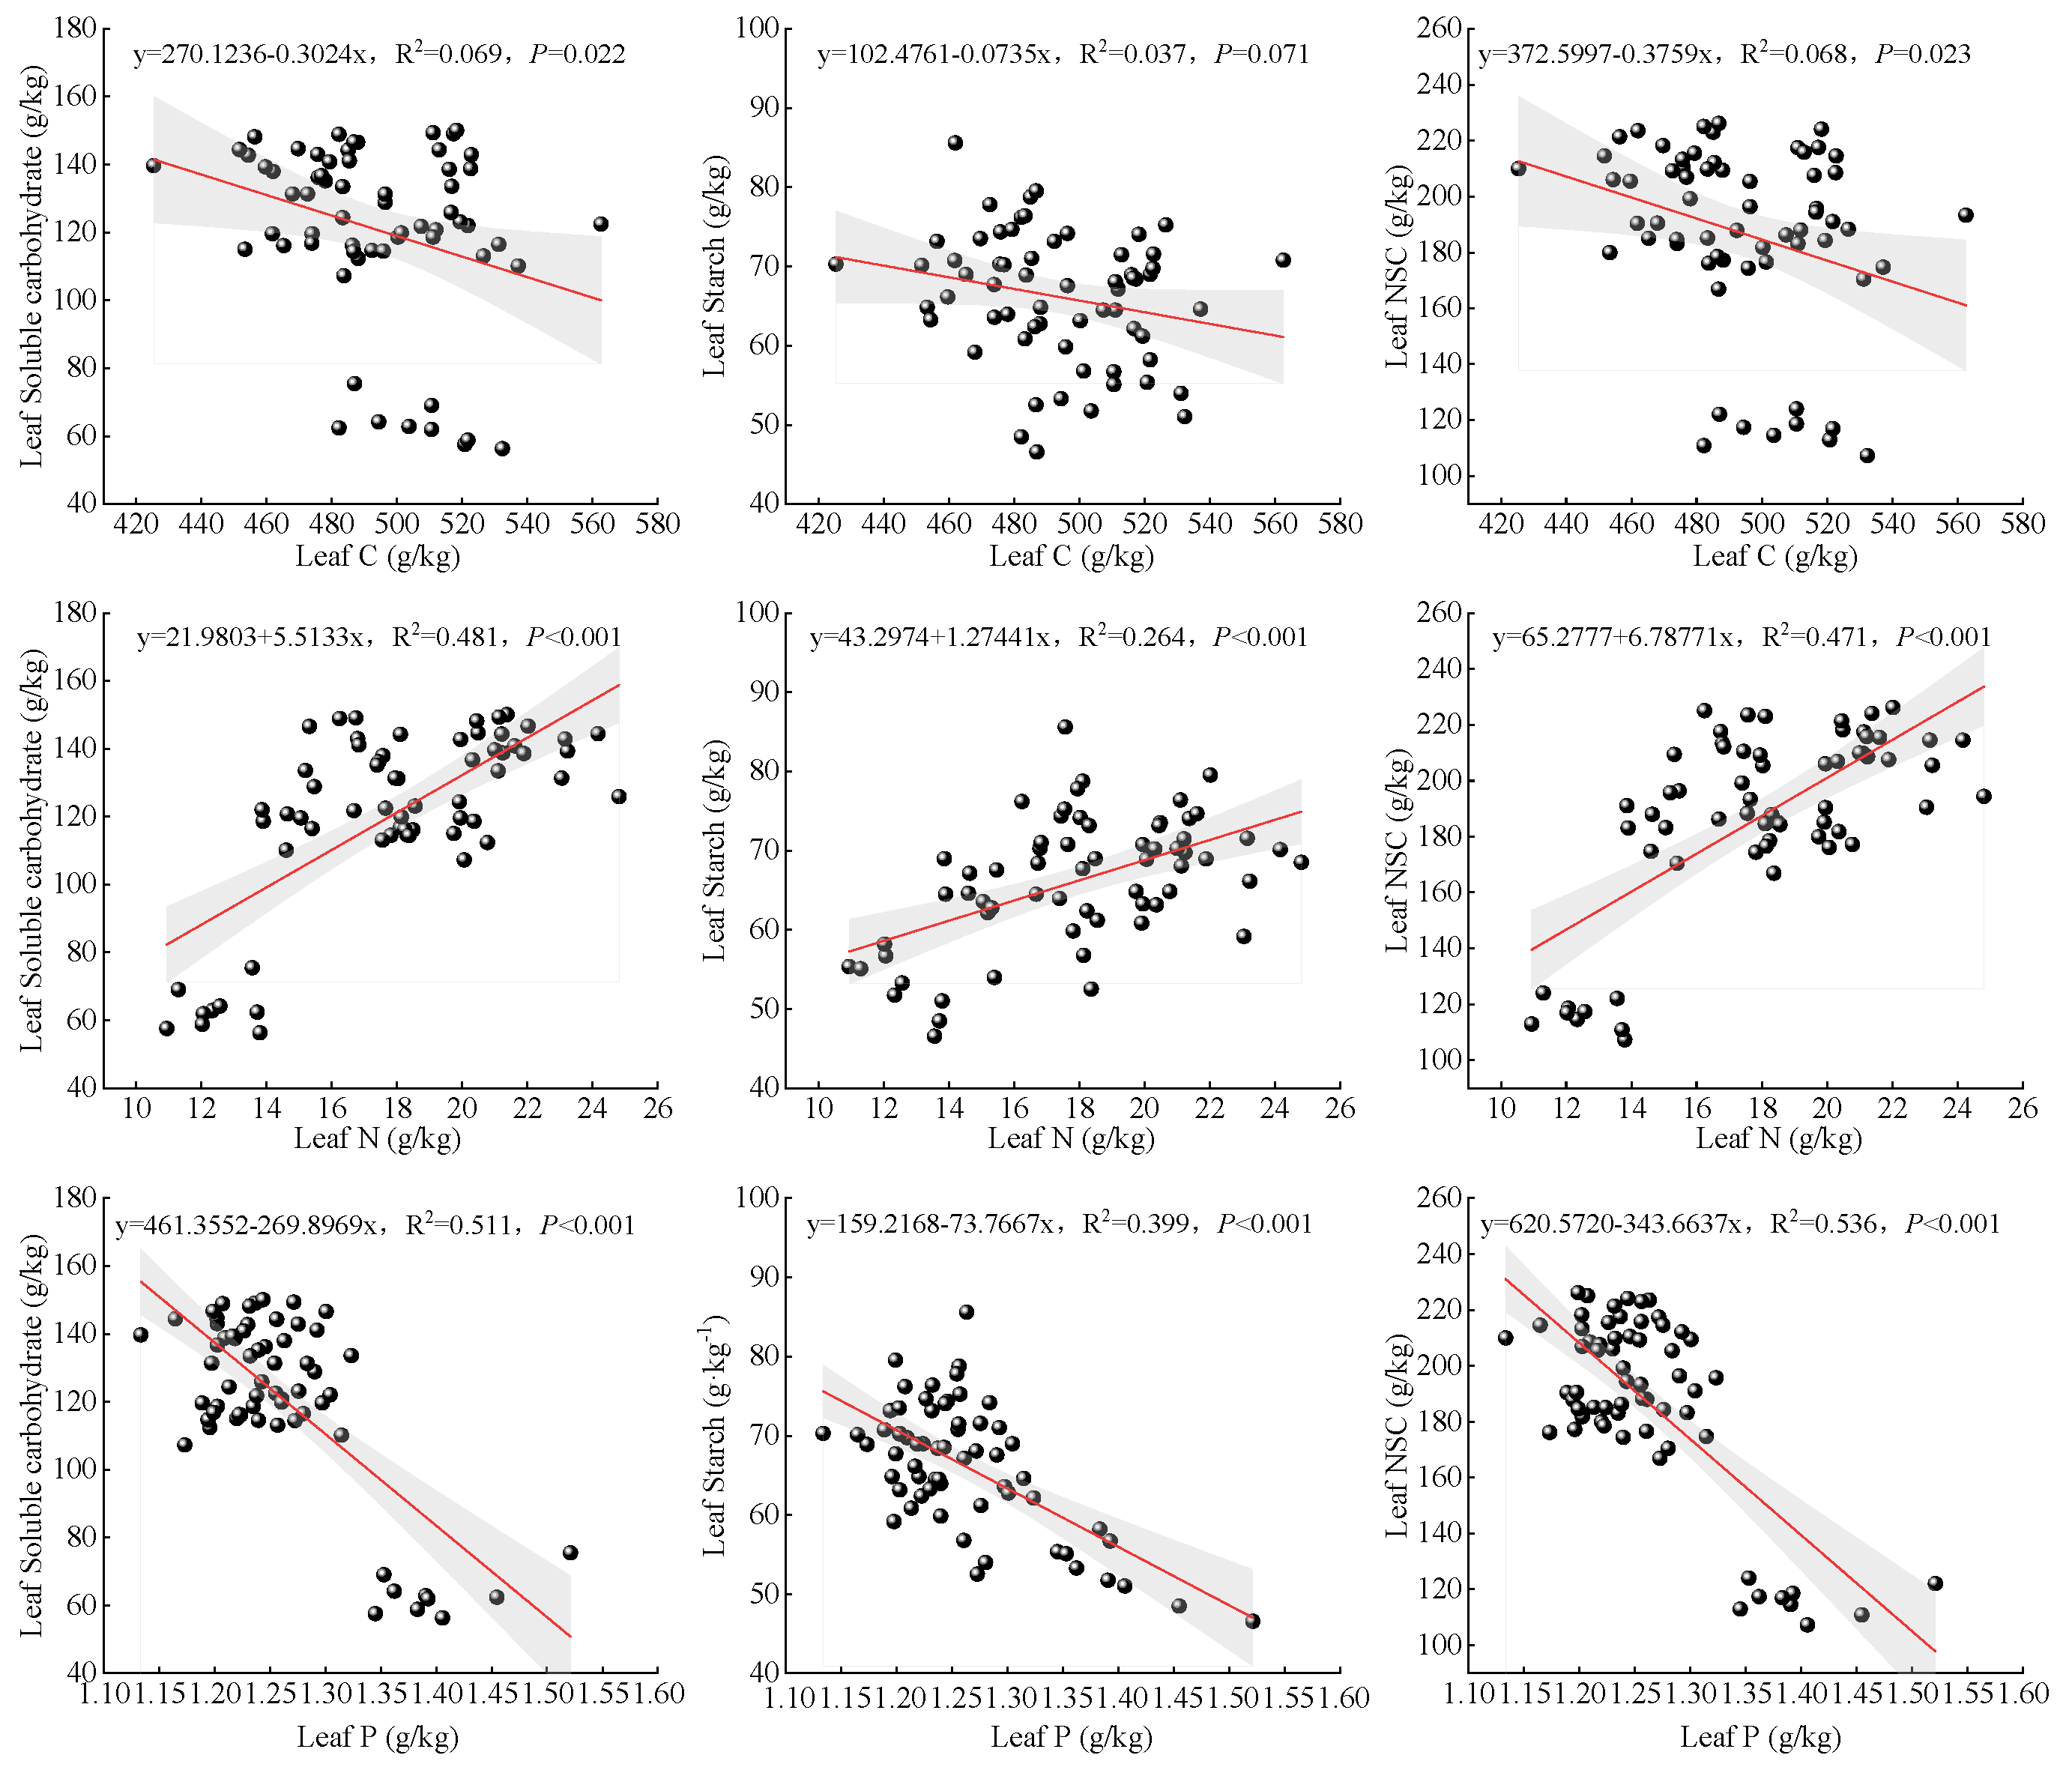
3.6. Correlation Between O. lagopus Leaf NSC Content and Carbon, Nitrogen, and Phosphorus Contents

As shown in Figure 7, the leaf C content was negatively correlated with the contents of SSs (R2 = 0.069, p = 0.022) and NSC (R2 = 0.068, p = 0.023). The leaf N content had highly significant positive correlations (p < 0.01) with the contents of leaf SSs (R2 = 0.481, p < 0.001), STs (R2 = 0.264, p < 0.001), and NSC (R2 = 0.471, p < 0.001). There was a highly significant negative correlation (p < 0.01) between leaf P content and the content of leaf SSs (R2 = 0.511, p < 0.001), STs (R2 = 0.399, p < 0.001), and NSC (R2 = 0.536, p < 0.001).
As shown in Figure 8, the leaf C/N ratio had highly significant negative correlations (p < 0.01) with the contents of leaf SSs (R2 = 0.5746, p < 0.001), STs (R2 = 0.311, p < 0.001), and NSC (R2 = 0.560, p < 0.001). The leaf C/P ratio was significantly positively correlated with the contents of leaf SSs (R2 = 0.151, p < 0.001), STs (R2 = 0.131, p = 0.002), and NSC (R2 = 0.163, p < 0.001). The leaf N/P ratio had highly significant positive correlations (p < 0.01) with the contents of leaf SSs (R2 = 0.502, p < 0.001), STs (R2 = 0.298, p < 0.001), and NSC (R2 = 0.499, p < 0.001).

3.7. Integrated Evaluation

Principal component analysis of O. lagopus growth, leaf NSC content, and chemometric indices was performed. Two principal components were extracted, with a contribution of 80.51% from principal component Y1, 10.71% from principal component Y2, and a cumulative contribution of 91.22% (Table 2). Principal component Y1 consisted of DBH, tree height, leaf SSs, leaf STs, leaf NSC, leaf SS/ST ratio, leaf N content, leaf C/P ratio, and leaf N/P ratio. Principal component Y2 consisted of the leaf C content. Since the cumulative contribution of principal component Y1 and principal component Y2 was 91.22%, the two components reflected most of the effects of N addition on growth and leaf physiology of O. lagopus.
Table 3 lists the principal component and composite scores of different treatments. The ranking of the treatments based on the scores of the effects of nitrogen addition on the growth of O. lagopus was H2 > H3 > N2 > N3 > H1 > N1 > CK. The nitrogen addition treatments had higher scores than the CK, indicating that nitrogen addition improved the growth of O. lagopus. The H2 treatment was superior to H3 and H1 for slow-release fertiliser treatments, and the N2 treatment was superior to N3 and N1 for urea treatments. At the same fertiliser application rate, the slow-release fertiliser treatment H2 was superior to N2, N3 was superior to H3, and H1 was superior to N1.

4. Discussion

4.1. O. lagopus Growth Response to Nitrogen Addition

Tree height and DBH are important indicators of tree growth [25,26,27]. In this study, nitrogen addition treatments effectively promoted the growth of tree height and DBH of O. lagopus, which was consistent with the results of Zhang’s fertilisation study [28]. In this study, the N addition treatments significantly improved the growth of height and DBH of O. lagopus. The optimum growth occurred in N2 and H2. The tree height and DBH was lower in other treatments than in N2 and H2 as the N application rate increased. These results indicated that the nitrogen utilisation efficiency of O. lagopus declined after the N application rate reached a certain level. The growth rate was lower in N3 and H3 than in N2 and H2 at the same N application rate. The tree height and DBH were higher in the slow-release fertiliser treatment than in the urea treatment. The slow-release fertiliser improved growth more than the urea. The likely reason is that the rate of nutrient release from the slow-release fertiliser was more suitable for the requirement of O. lagopus. Therefore, in the cultivation process of O. lagopus forest, the best physiological and economic benefits can be achieved by applying slow-release fertiliser at 450 g/plant to O. lagopus.

4.2. Response of Leaf NSC to Nitrogen Addition

The NSC content reflects the relationship between stored C and plant respiration and growth [29]. In this study, leaf SSs, STs, and NSC contents had highly significant positive correlations with the soil N content (Figure 5). Soil nutrients are required for plant growth and development [30]. The soil N content differed between the fertiliser and non-fertiliser treatments in this study. The leaf NSC content was higher in the N addition treatments than in the CK. The reason is that leaves are the location of photosynthesis and carbon assimilation. The nitrogen addition significantly increased the soil N content (Figure 1), which improved nitrogen uptake and photosynthetic rate, resulting in more photosynthetic products. An increase in the leaf N content improved carbon sequestration [31]. Excessive SSs were converted into STs, and the NSC content increased because STs accounts for the highest proportion of NSC. As the fertiliser application rate increased, the leaf NSC content increased and decreased in the fertiliser treatments and reached the maximum in the N2 and H2 treatments. NSC are synthesised by leaves, and an appropriate amount of N addition improves the photosynthetic capacity. Organic matter accumulates, indicating that the soil N content was not a limiting factor for O. lagopus growth after the level of N addition reached a certain amount. The competition between individuals changed from competition for N to competition for other nutrient elements, light, water, and space; thus, the leaf NSC showed a decreasing trend. The allocation pattern of NSC and its components for different amounts of N additions reflected the adaptation to the environment. Therefore, the effect of the fertiliser application rate on O. lagopus should be considered to maximise economic and ecological benefits.

4.3. Effect of Nitrogen Addition on O. lagopus Leaf C, N, and P Contents and Stoichiometric Ratio

Ecological stoichiometry is used to analyse the efficiency of plant energy use and the plant’s ability to maintain nutrient levels and produce photosynthetic products [32]. Photosynthesis requires enzyme (N) catalysis, and enzyme synthesis requires RNA (P) replication, influencing the coupling between C, N, and P [33]. In this study, N addition significantly increased soil N content (Figure 1), and a positive correlation existed between soil N content and leaf N content (Figure 6), indicating that N uptake by O. lagopus was significantly improved by N addition, which is consistent with previous findings [34]. The soil P content was significantly increased under nitrogen addition treatment compared with no fertilisation treatment, which may be due to the fact that higher levels of nitrogen addition would accelerate the loss of soil NO3−1, resulting in soil acidification and the release of active aluminium [35]. Soil acidification increased the solubility of phosphorus in soil to a certain extent [36], so the P content in soil increased. As the N application rate increased, the leaf N content showed an increasing trend in the urea and slow-release fertiliser treatments, indicating that the effect of nitrogen addition on O. lagopus is significant. The results are consistent with McNulty ’s research [37]. At the same application rate, the leaf N content was significantly higher in the slow-release fertiliser treatment than in the urea treatment. The main reason may be that the nutrient release patterns differ for the urea and slow-release fertiliser. Urea releases nutrients faster, and slow-release fertiliser releases them slower. The latter provides a steady supply of nutrients needed during the growth and development of trees. Therefore, slow-release fertiliser is more conducive to the accumulation of N in the leaves of O. lagopus than urea. The leaf P content was negatively correlated with leaf N and soil P contents (Figure 6). The leaf P content decreased with an increase in the amount of N. The likely reason is that adding N reduces the P content, causing a nutrient imbalance in the soil, exacerbating the P-limiting effect of the stand, and restricting the tree’s uptake of P.
Leaf C/N and C/P ratios are key physiological indicators of plant growth rate and carbon assimilation capacity [38]. Changes in the leaf C/N and C/P ratios primarily depend on changes in N and P contents. In previous studies, the effect of nitrogen application on the nitrogen content of plant leaves was positively correlated [39]. The increase in leaf nitrogen after nitrogen application indicates that plants can utilise or absorb excess nitrogen. The leaf C/N were lower in the N-addition treatments than in the CK, suggesting that the N uptake efficiency of O. lagopus decreased as the fertiliser application rate increased. The C/P ratio were higher in the N addition treatments than in the CK, indicating that the P uptake efficiency of O. lagopus was significantly higher in the fertiliser treatments. The leaf N/P ratio indicates nitrogen saturation and nutrient limitation [38]. Plant growth is limited by P when the N/P ratio exceeds 16 and by N when the N/P ratio is less than 14 [40]. In the present study, the leaf N/P increased with an increase in the fertiliser application rate in the urea and slow-release fertiliser treatments. The leaf N/P ratio was lower than 14 (N1 = 11.50 and N2 = 13.85) in the N1 and N2 treatments. Plant growth was limited by the N content. At fertiliser application rates up to the level of N3, the N/P ratio exceeded 16 (N3 = 16.26), and growth was limited by the P content. The leaf N/P ratio was higher than 14 and lower than 16 in the slow-release fertiliser H1 treatment, and growth was limited by N and P. As the fertiliser application rate increased, the leaf N/P ratio exceeded 16 in the H2 and H3 treatments (H2 = 17.12, H3 = 18.63), and growth was limited by P. This finding indicated that the P supply did not match the P demand as the N application rate increased. Although the growth of O. lagopus improved significantly, the P-limitation was exacerbated, changing the N-limited growth to P-limited growth with an increase in the N application rate. At the same application rate of different fertiliser types, the leaf N/P ratio was significantly higher in the slow-release fertiliser treatment than in the urea treatment. The reason is that slow-release fertiliser provides more nutrients than urea in the later stage. Therefore, the photosynthetic rate is higher, enabling better N absorption and assimilation. As the N content in the leaves increased, the P content decreased, increasing the N/P ratio significantly. This finding suggests that the N/P ratio rose significantly during growth; however, the P limitation was exacerbated by the higher N content. Thus, the leaves were more susceptible to P limitation in the slow-release fertiliser treatment than in the urea treatment. In summary, it is necessary to add appropriate amounts of N and P elements in O. lagopus plantation forests to alleviate P limitation during tree growth.

4.4. Relationship Between O. lagopus Leaf NSC Content and C, N, and P Contents

The correlation between the leaf carbon, nitrogen, and phosphorus contents and the NSC content and stoichiometric relationships is an indicator of plant physiological and ecological characteristics. The leaf N content is positively correlated with the ability to assimilate NSC, and the P content is correlated with the net photosynthetic rate, which affects NSC synthesis [41]. Thus, it is evident that the N and P contents in plant leaves reflect plant growth. The results of this study showed that leaf NSC was significantly correlated with leaf C, N, and P contents and the C/N, C/P, and N/P ratios (Figure 7), indicating that leaf C, N, and P contents contributed to the NSC content. The leaf NSC content increased with the leaf N content. The reason is that N is essential for photosynthesis. As the nitrogen fertiliser rate increased, the uptake of N by O. lagopus increased, increasing the NSC content. This result further validates Fox’s research [42]. The leaf NSC content was positively correlated with soil P content, leaf N content, and leaf N/P ratio and negatively correlated with leaf P content. Nitrogen addition improved O. lagopus growth but not in all treatments. It is possible that the P content in the fertiliser was insufficient, resulting in P limitation. With the increase in exogenous N, the content of SSs did not continue to rise, and it was converted into STs to resist the adverse environment. The lack of N in soil no longer became a limiting factor for tree growth. The competition pattern among tree individuals may change from competition for N to competition for other nutrient elements, light, water, and space [43]. In summary, different N and P contents of O. lagopus leaves resulted in the fluctuation of the NSC contents and affected the interconversion between leaf SSs and STs. This finding was confirmed by the correlations between the N and P contents and the N/P ratio on the one hand and SSs, STs, and NSC content on the other. Therefore, the relationship between the NSC and nutrient contents and the limiting effect of elemental P on O. lagopus should be considered to improve the productivity of O. lagopus forests.

5. Conclusions

The application of urea and slow-release fertilisers increased the soil N content and leaf nitrogen content of O. lagopus plantation, improved the N uptake and utilisation efficiency, and increased the NSC content of the leaves. The H2 treatment was the most effective, and the slow-release fertiliser performed better than urea. After a certain amount of N application was reached, the soil N content was no longer a limiting factor for O. lagopus growth. Continued N additions might result in P becoming the limiting factor for O. lagopus growth.
The cultivation of O. lagopus holds great potential, with its rapid growth, high economic value, and versatile applications making it an important choice for the sustainable timber industry. In the tropical and subtropical regions of southern China, the O. lagopus industry is particularly promising, representing a key growth area for the future forestry economy. This study provides practical guidance for the cultivation of O. lagopus plantations.

Author Contributions

G.C. wrote the manuscript and finalised the article. J.W. designed the experiments, provided important revisions, and gave final approval of the article. Z.Z., Z.L., G.D. (Guihe Duan), C.W. and G.D. (Guanben Du) performed the experiments and data processing. All authors have read and agreed to the published version of the manuscript.

Funding

This study was supported by the National Natural Science Foundation of China (32071688).

Data Availability Statement

The data presented in this study are available on request from the corresponding author.

Conflicts of Interest

The authors declare no conflicts of interest.

References

  1. Yan, G.N.; Xing, Y.J.; Han, S.J.; Zhang, J.H.; Wang, Q.G.; Mu, C.C. Long-time precipitation reduction and nitrogen deposition increase alter soil nitrogen dynamic by influencing soil bacterial communities and functional groups. Pedosphere 2020, 30, 363–377. [Google Scholar] [CrossRef]
  2. Lin, J.X.; Wang, Y.N.; Sun, S.N.; Mu, C.S.; Yan, X.F. Effects of arbuscular mycorrhizal fungi on the growth, photosynthesis and photosynthetic pigments of Leymus chinensis seedlings under salt-alkali stress and nitrogen deposition. Sci. Total Environ. 2017, 576, 234–241. [Google Scholar] [CrossRef] [PubMed]
  3. Deng, L.; Peng, C.H.; Zhu, G.Y.; Chen, L.; Liu, Y.L.; Shangguan, Z.P. Positive responses of belowground C dynamics to nitrogen enrichment in China. Sci. Total Environ. 2018, 616, 1035–1044. [Google Scholar] [CrossRef] [PubMed]
  4. Sutton, M.A.; Oenema, O.; Erisman, J.W.; Leip, A.; Van Grinsven, H.; Winiwarter, W. Too much of a good thing. Nature 2011, 472, 159–161. [Google Scholar] [CrossRef]
  5. Zhu, X.; Zhang, W.; Chen, H.; Mo, J. Impacts of nitrogen deposition on soil nitrogen cycle in forest ecosystems: A review. Acta Ecol. Sin. 2015, 35, 35–43. [Google Scholar] [CrossRef]
  6. Shen, Y.M.; Wang, H.; Liu, Z.J.; Li, W.; Liu, Y.H.; Li, J.J.; Wei, H.L.; Han, H. Fabrication of a water-retaining, slow-release fertilizer based on nanocomposite double-network hydrogels via ion-crosslinking and free radical polymerization. J. Ind. Eng. Chem. 2020, 93, 375–382. [Google Scholar] [CrossRef]
  7. Song, C.; Guan, Y.; Wang, D.; Zewudie, D.; Li, F.M. Palygorskite-coated fertilizers with a timely release of nutrients increase potato productivity in a rain-fed cropland. Field Crop Res. 2014, 166, 10–17. [Google Scholar] [CrossRef]
  8. Körner, C. Carbon limitation in trees. J. Ecol. 2003, 91, 4–17. [Google Scholar] [CrossRef]
  9. Li, M.H.; Cherubini, P.; Dobbertin, M.; Arend, M.; Xiao, W.F.; Rigling, A. Responses of leaf nitrogen and mobile carbohydrates in different Quercus species/provenances to moderate climate changes. Plant Biol. 2013, 15, 177–184. [Google Scholar] [CrossRef] [PubMed]
  10. McGroddy, M.E.; Daufresne, T.; Hedin, L.O. Scaling of C:N:P stoichiometry in forests worldwide: Implications of terrestrial redfield-type ratios. Ecology 2004, 85, 2390–2401. [Google Scholar] [CrossRef]
  11. Du, Y.; Lu, R.L.; Xia, J.Y. Impacts of global environmental change drivers on non-structural carbohydrates in terrestrial plants. Funct. Ecol. 2020, 34, 1525–1536. [Google Scholar] [CrossRef]
  12. Thomas, V.F.D.; Braun, S.; Flückiger, W. Effects of simultaneous ozone exposure and nitrogen loads on carbohydrate concentrations, biomass, and growth of young spruce trees (Picea abies). Environ. Pollut. 2005, 137, 507–516. [Google Scholar] [CrossRef]
  13. Qiu, X.C.; Wang, H.B.; Peng, D.L.; Liu, X.; Yang, F.; Li, Z.; Cheng, S. Thinning drives C:N:P stoichiometry and nutrient resorption in Larix principis-rupprechtii plantations in North China. For. Ecol. Manag. 2020, 462, 117984. [Google Scholar] [CrossRef]
  14. Hessen, D.O.; Ågren, G.I.; Anderson, T.R.; Elser, J.J.; De Ruiter, P.C. Carbon sequestration in ecosystems: The role of stoichiometry. Ecology 2004, 85, 1179–1192. [Google Scholar] [CrossRef]
  15. Qin, J.; Shangguan, Z.P.; Xi, W.M. Seasonal variations of leaf traits and drought adaptation strategies of four common woody species in South Texas, USA. J. For. Res. 2019, 30, 1715–1725. [Google Scholar] [CrossRef]
  16. Bai, Y.F.; Chen, S.Y.; Shi, S.R.; Qi, M.J.; Liu, X.H.; Wang, H.; Wang, Y.X.; Jiang, C.Q. Effects of different management approaches on the stoichiometric characteristics of soil C, N, and P in a mature Chinese fir plantation. Sci. Total Environ. 2020, 723, 137868. [Google Scholar] [CrossRef]
  17. Marklein, A.R.; Houlton, B.Z. Nitrogen inputs accelerate phosphorus cycling rates across a wide variety of terrestrial ecosystems. New Phytol. 2012, 193, 696–704. [Google Scholar] [CrossRef] [PubMed]
  18. Tian, D.; Yan, Z.B.; Niklas, K.J.; Han, W.X.; Kattge, J.; Reich, P.B.; Luo, Y.K.; Chen, Y.H.; Tang, Z.Y.; Hu, H.F.; et al. Global leaf nitrogen and phosphorus stoichiometry and their scaling exponent. Natl. Sci. Rev. 2018, 5, 728–739. [Google Scholar] [CrossRef]
  19. Miyajima, R.H.; Barreto, V.C.S.; de Oliveira, P.A.; Batistela, G.C.; Simões, D. Risk Analysis of the Economic Benefits of Ochroma pyramidale: A Case Study of Forest Planting in Brazil. J. Agric. Sci. Tech.-Iran. B 2018, 8, 444–453. [Google Scholar]
  20. Borrega, M.; Ahvenainen, P.; Serimaa, R.; Gibson, L. Composition and structure of balsa (Ochroma pyramidale) wood. Wood Sci. Technol. 2015, 49, 403–420. [Google Scholar] [CrossRef]
  21. Malagat, B.; Iamba, K. Seed viability trial of two balsa varieties through direct sowing in East New Britain. Int. J. Agric. For. 2021, 11, 25–31. [Google Scholar]
  22. Wang, X.K.; Huang, J.L. Principles and Techniques of Plant Physiological and Biochemical Experiments, 3rd ed.; Higher Education Press: Beijing, China, 2006. [Google Scholar]
  23. Guo, D.L.; Mitchell, R.J.; Hendricks, J.J. Fine root branch orders respond differentially to carbon source-sink manipulations in a longleaf pine forest. Oecologia 2004, 140, 450–457. [Google Scholar] [CrossRef] [PubMed]
  24. Bao, S.D. Soil Agrochemical Analysis, 3rd ed.; China Agricultural Press: Beijing, China, 2000. [Google Scholar]
  25. Nakashizuka, T. Species coexistence in temperate, mixed deciduous forests. Trends Ecol. Evol. 2001, 16, 205–210. [Google Scholar] [CrossRef]
  26. Wyckoff, P.H.; Clark, J.S. The relationship between growth and mortality for seven cooccurring tree species in the southern Appalachian Mountains. J. Ecol. 2002, 90, 604–615. [Google Scholar] [CrossRef]
  27. Pérez-Ramos, I.M.; Ourcival, J.M.; Limousin, J.M.; Rambal, S. Mast seeding under increasing drought: Results from a long-term data set and from a rainfall exclusion experiment. Ecology 2010, 91, 3057–3068. [Google Scholar] [CrossRef] [PubMed]
  28. Zhang, Y.R.; Lan, Z.P.; Mi, H.L.; Peng, J.J.; Ma, X.; Qin, X.Y. The growth and photosynthetic characteristics of Cinnamomum longepaniculatum ‘Longnao Xiangzhang’ steckling under different N, P and K level by drip fertilization. J. Nanjing For. Univ. 2019, 43, 39–45. [Google Scholar]
  29. Richardson, A.D.; Carbone, M.S.; Huggett, B.A.; Furze, M.E.; Czimczik, C.I.; Walker, J.C.; Xu, X.M.; Schaberg, P.G.; Murakami, P. Distribution and mixing of old and new nonstructural carbon in two temperate trees. New Phytol. 2015, 206, 590–597. [Google Scholar] [CrossRef] [PubMed]
  30. Devi, N.B.; Yadava, P.S. Seasonal dynamics in soil microbial biomass C, N and P in a mixed-oak forest ecosystem of Manipur, Northeast India. Appl. Soil Ecol. 2006, 31, 220–227. [Google Scholar] [CrossRef]
  31. Farquhar, G.D.; Sharkey, T.D. Stomatal conductance and photosynthesis. Annu. Rev. Plant Physiol. 1982, 33, 317–345. [Google Scholar] [CrossRef]
  32. Zhang, J.H.; Zhao, N.; Liu, C.C.; Yang, H.; Li, M.L. C:N:P stoichiometry in China’s forests: From organs to ecosystems. Funct. Ecol. 2018, 32, 50–60. [Google Scholar] [CrossRef]
  33. Domingues, T.F.; Meir, P.; Feldpausch, T.R.; Saiz, G.; Veenendaal, E.M.; Schrodt, F.; Bird, M.; Djagbletey, G.; Hien, F.; Compaore, H.; et al. Co-limitation of photosynthetic capacity by nitrogen and phosphorus in West Africa woodlands. Plant Cell Environ. 2010, 33, 959–980. [Google Scholar] [CrossRef]
  34. Rowe, E.C.; Smart, S.M.; Kennedy, V.H.; Emmett, B.A.; Evans, C.D. Nitrogen deposition increases the acquisition of phosphorus and potassium by heather Calluna vulgaris. Environ. Pollut. 2008, 155, 201–207. [Google Scholar] [CrossRef] [PubMed]
  35. Cameron, K.C.; Di, H.J.; Moir, J.L. Nitrogen losses from thesoil/plant system: A review. Ann. Appl. Biol. 2013, 162, 145–173. [Google Scholar] [CrossRef]
  36. Nakaji, T.; Fukami, M.; Dokiya, Y.; Izuta, T. Effects of high nitrogen load on growth, photosynthesis and nutrient status of Cryptomeria japonica and Pinus densiflora seedlings. Trees 2001, 15, 453–461. [Google Scholar] [CrossRef]
  37. McNulty, S.G.; Boggs, J.; Aber, J.D.; Rustad, L.; Magill, A. Red spruce ecosystem level changes following 14 years of chronic N fertilization. Forest Ecol. Manag. 2005, 219, 279–291. [Google Scholar] [CrossRef]
  38. Wang, N.; Fu, F.; Wang, B.; Wang, R. Carbon, nitrogen and phosphorus stoichiometry in Pinus tabulaeformis forest ecosystems in warm temperate Shanxi Province, north China. J. For. Res. 2018, 29, 1665–1673. [Google Scholar] [CrossRef]
  39. Liu, J.; Zhou, G.; Yang, C.; Ou, Z.; Peng, C. Responses of chlorophyll fluorescence and xanthophyll cycle in leaves of Schima superba Gardn. & Champ. and Pinus massoniana Lamb. to simulated acid rain at Dinghushan Biosphere Reserve, China. Acta Physiol. Plant. 2007, 29, 33–38. [Google Scholar]
  40. Koerselman, W.; Meuleman, A.F.M. The vegetation N:P ratio: A new tool to detect the nature of nutrient limitation. J. Appl. Ecol. 1996, 33, 1441–1450. [Google Scholar] [CrossRef]
  41. Millard, P.; Sommerkorn, M.; Grelet, G.A. Environmental change and carbon limitation in trees: A biochemical, ecophysiological and ecosystem appraisal. New Phytol. 2007, 175, 11–28. [Google Scholar] [CrossRef] [PubMed]
  42. Fox, T.R.; Lee Allen, H.; Albaugh, T.J.; Rubilar, R.; Carlson, C.A. Tree nutrition and forest fertilization of pine plantations in the southern United States. South. J. Appl. For. 2007, 31, 5–11. [Google Scholar] [CrossRef]
  43. Wan, H.W.; Yang, Y.; Bai, S.Q.; Xu, Y.H.; Bai, Y.F. Variations in leaf functional traits of six species along a nitrogen addition gradientin leymus chinensis steppeininner mongolia. J. Plant Ecol. 2008, 32, 611–621. [Google Scholar]
Figure 1. Effects of nitrogen addition on soil nutrients and stoichiometric characteristics. Note: Different lowercase letters in the figure represent significant differences between treatments.
Forests 16 00117 g001
Figure 2. Effects of nitrogen addition on tree height and DBH of O. lagopus. Note: Different lowercase letters in the figure represent significant differences between treatments.
Forests 16 00117 g002
Figure 3. Effects of nitrogen addition on the NSC content of the leaves of O. lagopus. Note: Different lowercase letters in the figure represent significant differences between treatments.
Forests 16 00117 g003
Figure 4. Effects of nitrogen addition on carbon, nitrogen, and phosphorus contents in the leaves of O. lagopus. Note: Different lowercase letters in the figure represent significant differences between treatments.
Forests 16 00117 g004
Figure 5. Correlation between soil N, P, and K contents and the NSC contents in the leaves of O. lagopus.
Forests 16 00117 g005
Figure 6. Correlation between soil N, P, and K contents and the C, N, and P contents in the leaves of O. lagopus.
Forests 16 00117 g006
Figure 7. Correlation between NSC content and C, N, and P contents in the leaves of O. lagopus.
Forests 16 00117 g007
Figure 8. Correlation between NSC content and the C/N, C/P, and N/P ratios in the leaves of O. lagopus.
Forests 16 00117 g008
Table 1. Ochroma lagopus nitrogen fertiliser test design table.
TreatmentFertiliser Amount/Per Plant/gFertilisation Tree/Plant
CK090
N1Urea 30090
N2Urea 45090
N3Urea 60090
H1Slow-release fertiliser 30090
H2Slow-release fertiliser 45090
H3Slow-release fertiliser 60090
Table 2. Coefficients, eigenvalues, variance contribution rates, and cumulative contribution rates of principal components.
IndexY1 Principal ComponentY2 Principal Component
Diameter at breast height0.92 −0.22
Plant height0.92 −0.33
Leaf Soluble carbohydrate0.93 0.28
Leaf Starch0.91 −0.02
Leaf NSC0.94 0.22
Leaf Soluble carbohydrate/Starch0.85 0.51
Leaf C−0.73 0.63
Leaf N0.92 −0.16
Leaf P−0.95 −0.06
Leaf C/N−0.97 0.11
Leaf C/P0.77 0.54
Leaf N/P0.93 −0.15
Eigenvalue variance9.661.29
Contribution rate (%)80.5110.71
Cumulative contribution rate (%)80.5191.22
Table 3. Principal component scores and composite scores.
IndexPrincipal
Component Y1 Score
Principal
Component Y2 Score
Aggregate ScoreRanking
CK−5.36 −13.77 −5.79 7
N1−1.51 −4.92 −1.74 6
N21.37 2.59 1.38 3
N30.78 3.47 1.00 4
H1−0.42 −1.17 −0.47 5
H22.78 6.48 2.93 1
H32.36 7.33 2.69 2
Disclaimer/Publisher’s Note: The statements, opinions and data contained in all publications are solely those of the individual author(s) and contributor(s) and not of MDPI and/or the editor(s). MDPI and/or the editor(s) disclaim responsibility for any injury to people or property resulting from any ideas, methods, instructions or products referred to in the content.

