Article

Multi-Level Matching Optimization Design of Thin-Walled Beam Cross-Section for Tri-Axle Unmanned Forestry Vehicle Frame

School of Technology, Beijing Forestry University, Beijing 100083, China
*
Author to whom correspondence should be addressed.
Forests 2025, 16(1), 69; https://doi.org/10.3390/f16010069
Submission received: 18 November 2024 / Revised: 1 January 2025 / Accepted: 2 January 2025 / Published: 3 January 2025
(This article belongs to the Section Forest Operations and Engineering)

Abstract

:
With the advancement of forestry modernization, the research and development of forestry vehicles provide solid technical support for the efficiency and sustainability of forest operations. This study aims to reduce the mass of the forest-use tri-axle unmanned vehicle frame through structural optimization design, improve its static and dynamic characteristics, and enhance vehicle mobility and environmental adaptability while maintaining or enhancing its structural strength and stability. Initially, the finite element model of the vehicle frame was established using the finite element software Hypermesh (2022), and its static and dynamic characteristics were analyzed using OptiStruct (2022) software. The accuracy of the finite element calculations was verified through experiments. Subsequently, a sensitivity analysis method was employed to screen the design variables of the thin-walled beam structure of the forest-use tri-axle unmanned vehicle. Response surface models were created using least squares regression (LSR) and radial basis function network (RBF). Considering indicators such as frame mass, modal frequency, and maximum bending and torsional stresses, the multi-objective genetic algorithm (MOGA) was applied to achieve a multi-objective lightweight design of the vehicle frame. This comprehensive optimization method is rarely reported in forestry vehicle design. By employing the proposed optimization approach, a weight reduction of 10.1 kg (a 7.44% reduction) was achieved for the vehicle frame without compromising its original static and dynamic performance. This significant lightweighting result demonstrates considerable practical application potential in the field of forestry vehicle lightweight design. It responds to the demand for efficient and environmentally friendly forestry machinery under forestry modernization and holds important implications for reducing energy consumption and operational costs.

1. Introduction

The application of forestry vehicles [1,2,3] has become a prominent hallmark in the process of forestry modernization. With the strategic shift from traditional logging to forest cultivation and protection, the research and development of forestry operational vehicles continue to occupy a leading position in the field of forestry machinery. These vehicles, with their superior performance, significantly enhance operational efficiency in forested areas and greatly improve the working conditions for personnel, playing an invaluable role in advancing forestry modernization. Among the diverse needs for forestry machinery [4,5], a wide variety of operational vehicles have been developed, including but not limited to skidders, fire trucks, personnel carriers, and harvesting machines. The in-depth research and extensive application of these vehicles have not only greatly increased operational efficiency in forests but also played a crucial role in reducing the labor intensity for operators. The presence of these vehicles epitomizes the development of mechanization, automation, and intelligence in forestry, marking a milestone in modernizing forestry operations.
With continuous technological innovation and progress, the research on forestry operation vehicles is expected to continue driving the development of forestry machinery, providing robust technical support for sustainable forestry development. However, the extensive use of vehicles in complex forest environments presents significant challenges for their structural design [6,7,8,9]. Among these challenges, the vehicle frame, as the core load-bearing component, is of particular importance, as its weight directly impacts energy consumption, maneuverability, and passability. Forestry operation vehicles are often required to operate in rugged terrains, muddy roads, and dense forests, demanding higher mobility and energy efficiency. Traditional forestry vehicle frames are predominantly designed using high-strength steel, which offers excellent load-bearing capacity and durability but results in significant vehicle weight. Excessive frame weight not only increases energy consumption but also limits the passability and operational flexibility of the vehicle. Additionally, the excessive mass of the frame can impose extra burdens on the suspension system, leading to increased maintenance costs and a higher risk of failure. To address the demands for lightweight [10,11,12,13] and efficient forestry operation vehicles in forest environments, research into the lightweight design of frames for forestry tri-axle unmanned vehicles [14] has become a critical topic. By incorporating new materials and multi-objective structural optimization designs, the frame weight can be effectively reduced while maintaining strength and durability, thereby improving overall vehicle performance. Lightweight frame design not only enhances the energy efficiency and operational effectiveness of forestry vehicles [15,16] but also minimizes environmental impacts, providing technical support for the green and sustainable development of forestry machinery.
Zhi-Ling Fang et al. [17] achieved a 13.9% weight reduction in a lightweight integrated front engine compartment through topology optimization using the SIMP method. Xu-Yun Qiu et al. [18] applied the Kriging surrogate model to optimize structural parameters of an orchard vehicle frame, achieving frame weight reduction. Ming-Jun Zheng et al. [19] combined multi-body dynamics, finite element analysis, and orthogonal experiments, employing gray correlation to process orthogonal test results, resulting in a 6.93% reduction in an all-terrain mobile robot’s body weight. Tang et al. [20] used Latin hypercube sampling and established a multi-condition, multi-objective optimization model to reduce the frame weight of an unmanned sightseeing vehicle by 5.4%. This study employs a comprehensive structural optimization approach that combines sensitivity analysis [21,22,23,24,25] with a multi-objective genetic algorithm, which proves more effective in screening reasonable design variables and conducting efficient analysis compared to using a single multi-objective [26,27,28,29,30] optimization method. To ensure the accuracy of response surface fitting, this research selects highly compatible fitting algorithms based on the characteristics of different design variables, including the least squares regression (LSR) [31,32] and radial basis function network (RBF) [33,34,35,36]. Compared with traditional structural optimization methods, the proposed approach enhances computational accuracy, reduces testing costs, and improves optimization efficiency. Additionally, it achieves lightweighting of the forest-use tri-axle unmanned vehicle frame while maintaining its original structural performance. The technical route is shown in Figure 1.
This study aims to explore the lightweight design of the chassis for forestry tri-axle unmanned vehicles by employing a comprehensive optimization method that integrates sensitivity analysis and multi-objective genetic algorithms. The objective is to effectively reduce the weight of the chassis while ensuring its strength and stiffness, thereby improving the energy efficiency, operational efficiency, and environmental adaptability of forestry operation vehicles. This research provides theoretical foundations and technical support for the green and sustainable development of forestry machinery.

2. Performance Analysis of the Three-Axle Unmanned Vehicle Frame

2.1. Establishment of the Vehicle Frame Structural Model

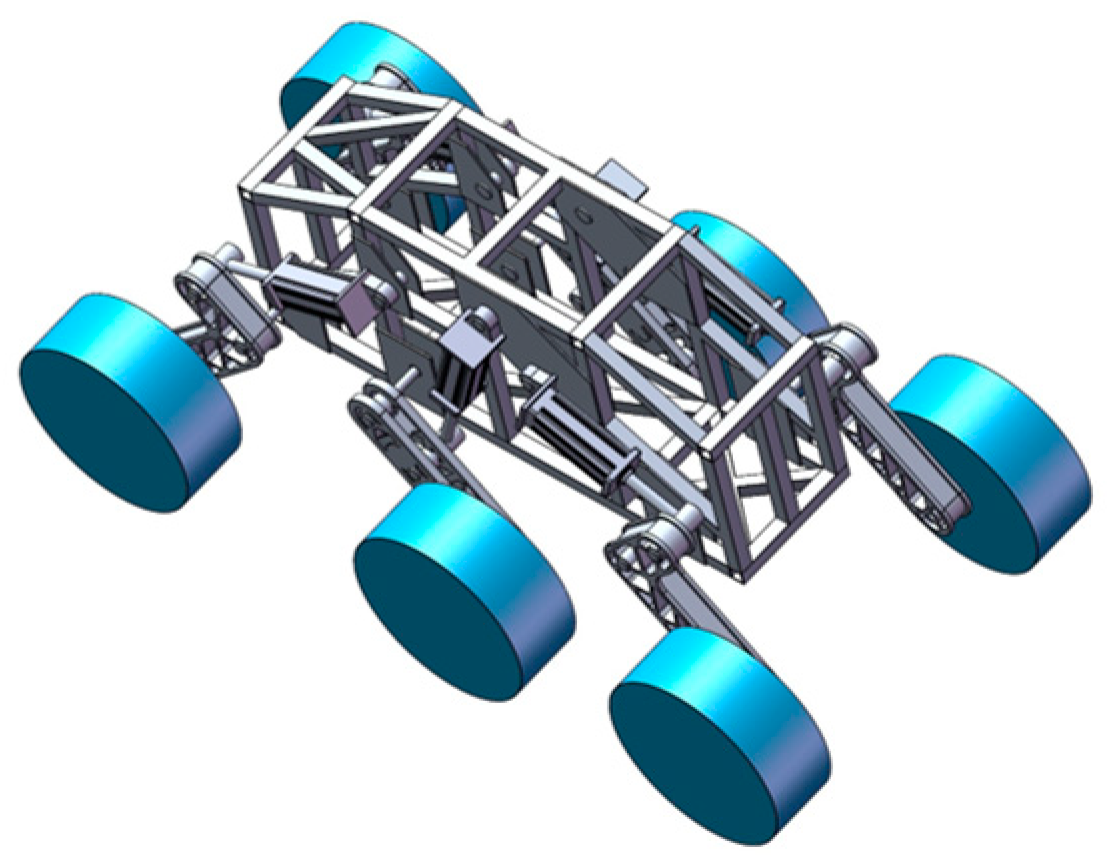
The tri-axle unmanned vehicle studied in this paper is primarily designed for forestry transport and remote monitoring operations. Initially, the vehicle frame was designed based on empirical knowledge, followed by the creation of a simplified 3D model in SolidWorks. This model includes key components such as the frame, front, middle, and rear swing arms, electric cylinder, wheels, and connecting shafts. The geometric model of the initially designed tri-axle unmanned vehicle is shown in Figure 2. The frame, which serves as the vehicle’s main structure, is constructed from welded, thin-walled aluminum alloy (7A58AL) beams. The frame has a total length of 2590 mm, a width of 690 mm, and a height of 1190 mm, with the cross-sectional dimensions of the thin-walled beams [37,38,39] measuring 70 mm × 70 mm and a thickness of 5 mm. The total mass of the frame is 135.8 kg (excluding the side connection plates). The material parameters for the aluminum alloy (7A58AL) are listed in Table 1.
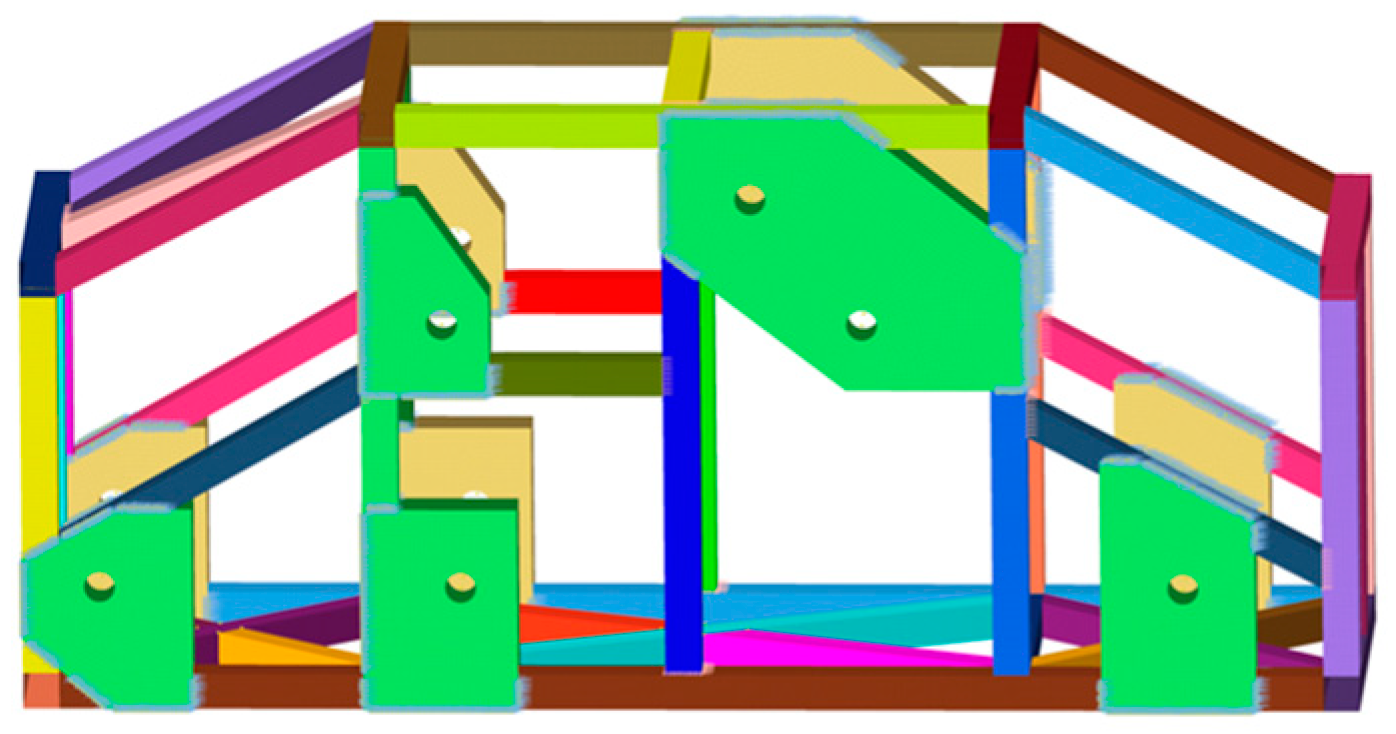
In this study, the 3D model of the forest-use tri-axle unmanned vehicle frame was initially constructed using SolidWorks (2022) software. To perform finite element analysis [40,41,42], the model was simplified and subsequently imported into HyperMesh (2022) for preprocessing. In HyperMesh, shell elements were employed to mesh the vehicle frame. Shell element meshes are particularly suitable for simulating thin-walled structures such as plates and shells, where the thickness dimension is significantly smaller than the other two dimensions. Moreover, shell elements are highly effective for the FEA of thin-walled structures, providing relatively accurate analysis results while minimizing computational resource consumption.
The welding connections between various components of the frame were simulated using seam welds. To facilitate the application of constraints, RBE2 elements were employed to establish master-slave node relationships at the drive shaft holes. Similarly, RBE3 elements were used to create master-slave node connections at the bottom of the frame to enable load application. During the meshing process, a mesh size of 10 mm was specified. The final finite element model consisted of 139,943 elements and 138,496 nodes. A quality check was performed on the overall mesh of the vehicle frame. As shown in Table 2, the mesh quality is excellent, ensuring the precision of subsequent computational analyses. The finite element model of the forest-use tri-axle unmanned vehicle frame is illustrated in Figure 3.

2.2. Frame Structure Model Establishment

To address the operational requirements of the tri-axle unmanned vehicle in challenging environments such as forested, mountainous, and rugged terrains, this paper analyzes the static performance of its frame under typical working conditions. The focus is primarily on evaluating the frame under two critical load cases: full-load bending and full-load torsion.
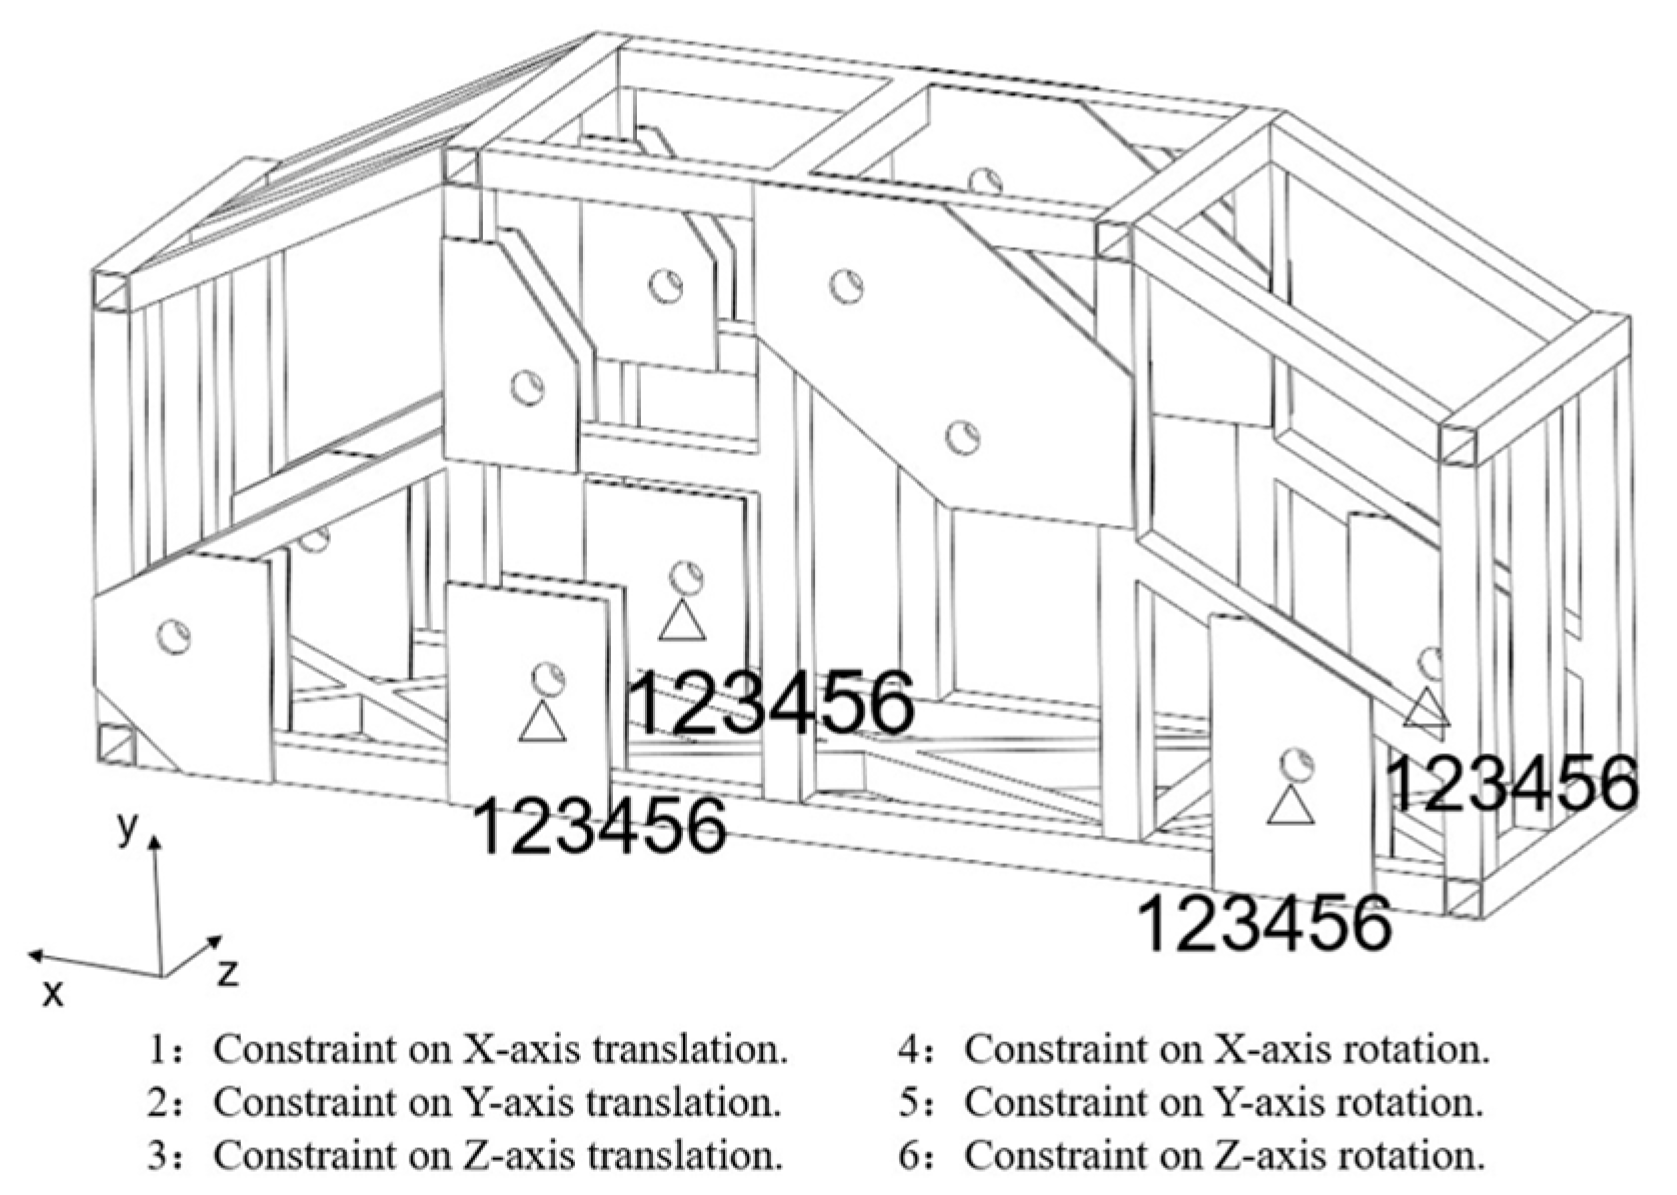
The X, Y, and Z axes represent the lateral, vertical, and longitudinal directions of the vehicle frame, respectively. The translational degrees of freedom in the X, Y, and Z directions are denoted by 1, 2, and 3, while the rotational degrees of freedom about the X, Y, and Z axes are denoted by 4, 5, and 6, respectively. During the full-load bending condition analysis of the frame, the translational degrees of freedom in the X, Y, and Z directions at the front drive shaft holes are constrained, while the rotational degrees of freedom in the corresponding X, Y, and Z directions are released. The translational degrees of freedom in the X and Y directions at the left side of the middle and rear drive shaft holes are constrained, while the translational degree of freedom in the Z direction is released, as well as the rotational degrees of freedom in the X, Y, and Z directions. The translational degree of freedom in the Y direction at the right side of the middle and rear drive shaft holes is constrained, while the translational degrees of freedom in the X and Z directions and the rotational degrees of freedom in the X, Y, and Z directions are released, as shown in Figure 4.
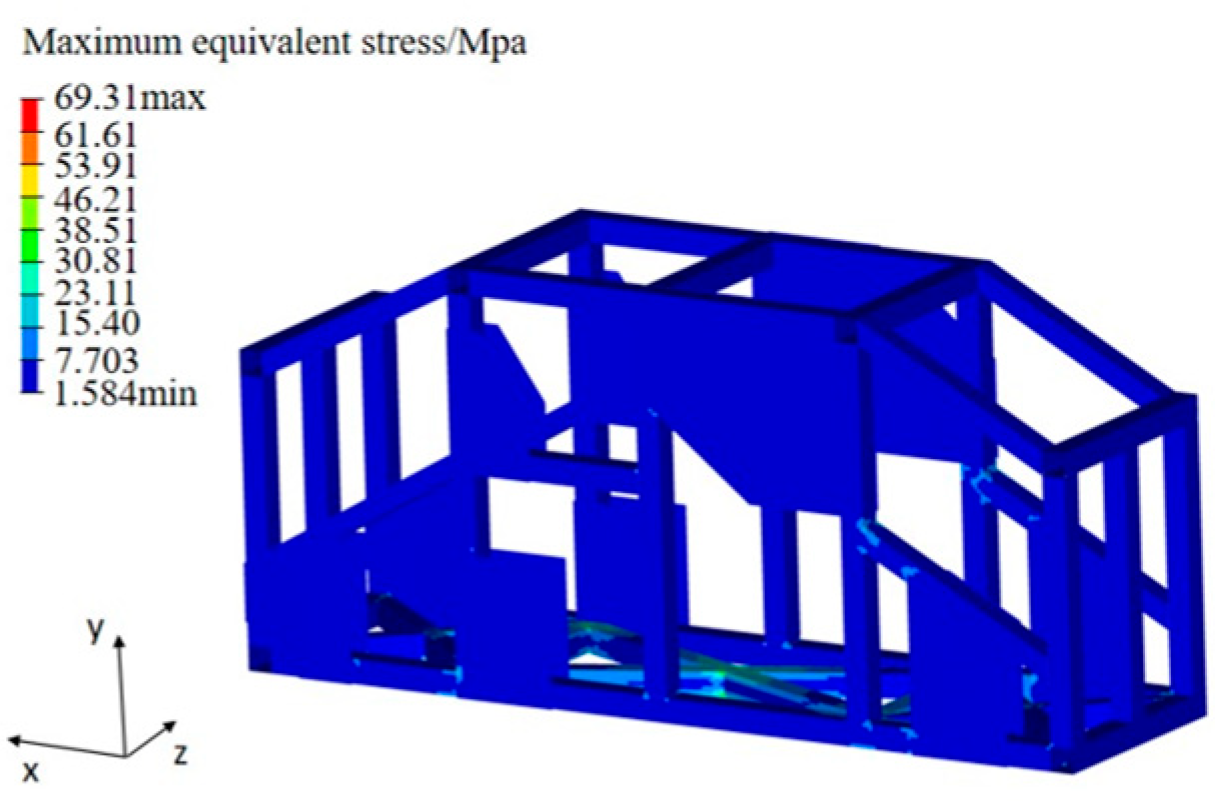
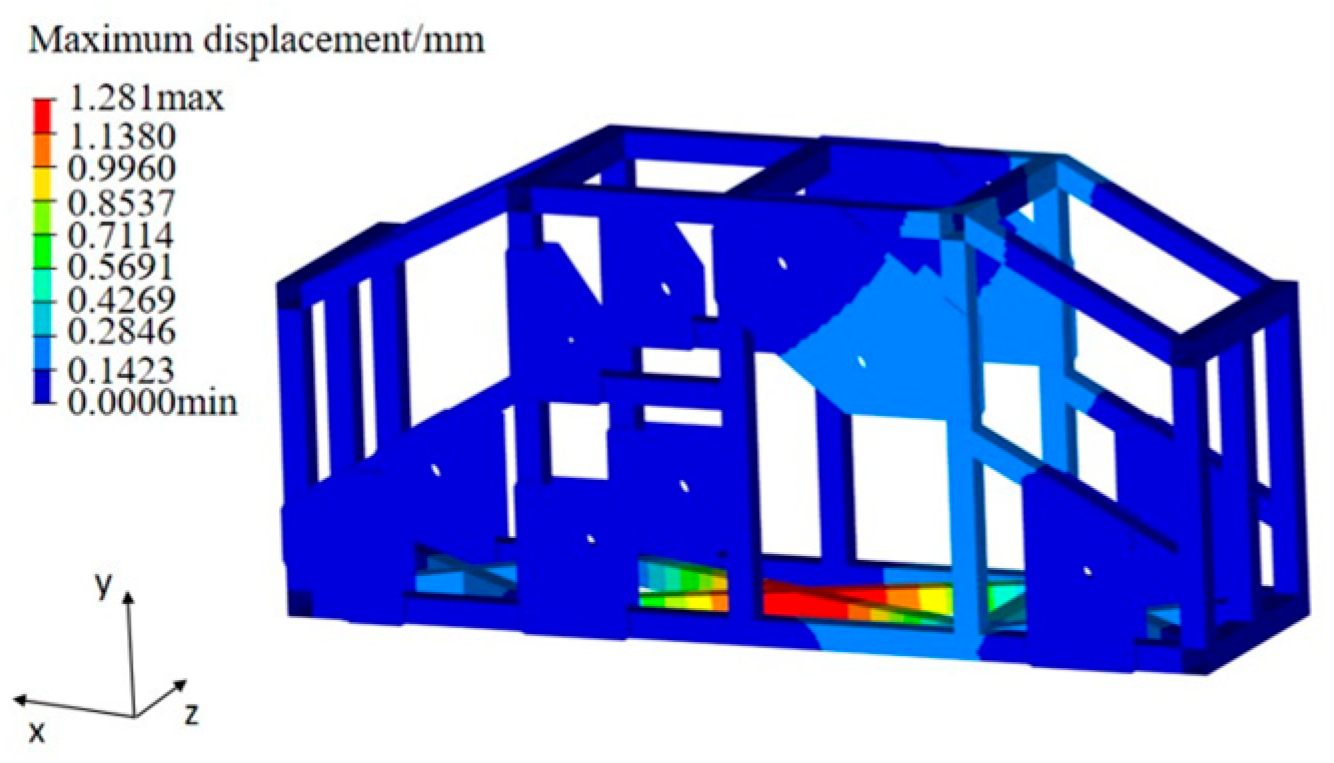
RBE3 elements were used to connect the nodes at the front, middle, and rear of the bottom surface of the vehicle frame. Considering the full-load condition of the 3-ton three-axle unmanned vehicle, along with the distribution of components such as the motor, battery, and controller, Y-direction loads of 7000 N, 15,000 N, and 7000 N were applied to the front, middle, and rear of the frame, respectively. Figure 5 shows the stress distribution contour under the full-load bending condition, with the maximum stress on the frame being 69.31 MPa, which is much lower than the yield strength of the 7A58 AL aluminum profile, indicating significant room for optimization. Figure 6 shows the displacement distribution contour under the full-load bending condition, with the maximum displacement of the frame being 1.281 mm.
In the analysis of the full-load torsion condition of the frame, the translational degrees of freedom in the X, Y, and Z directions, as well as the corresponding rotational degrees of freedom in the X, Y, and Z directions, at the front drive shaft holes are released. The translational degrees of freedom in the X, Y, and Z directions, along with the corresponding rotational degrees of freedom, at the left side of the middle and rear drive shaft holes are constrained. Similarly, the translational degrees of freedom in the X, Y, and Z directions, as well as the corresponding rotational degrees of freedom, at the right side of the middle and rear drive shaft holes are also constrained, as shown in Figure 7.
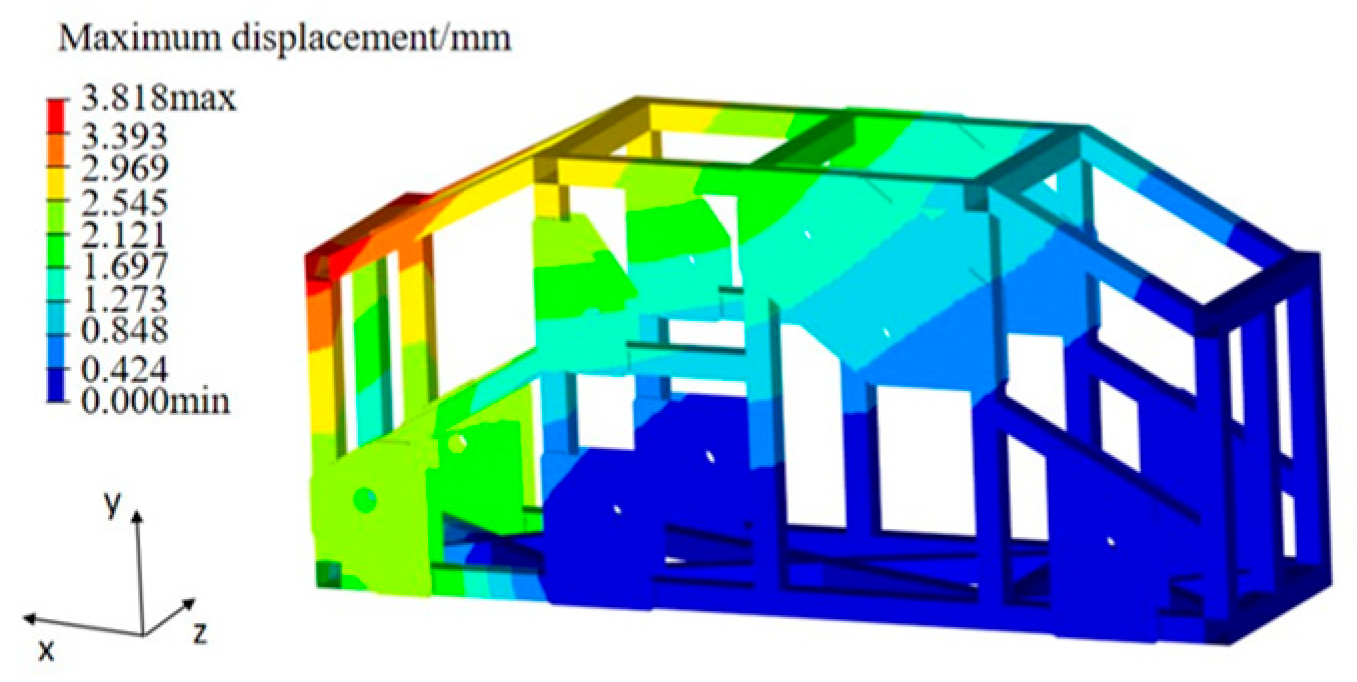
In simulating the operation of the tri-axle unmanned vehicle in forested, mountainous, and rugged terrains, particularly under conditions where the right front wheel crosses a step, causing the left front wheel to suddenly lose contact with the ground, a torsional load case analysis was conducted. For the vehicle fully loaded with 3 tons, an inertial release method was used to apply triple the normal load torque—equivalent to 31,050 Nm—on the front drive shaft hole. As shown in Figure 8, the stress distribution cloud diagram under full-load torsion reveals a maximum stress of 189.2 MPa, which is below the yield strength of the 7A58AL aluminum profile, resulting in a safety factor of 1.82. This indicates a substantial potential for further optimization. Additionally, Figure 9 displays the displacement distribution cloud diagram under the full-load bending load case, with a maximum displacement value of 3.818 mm.

2.3. Modal Analysis

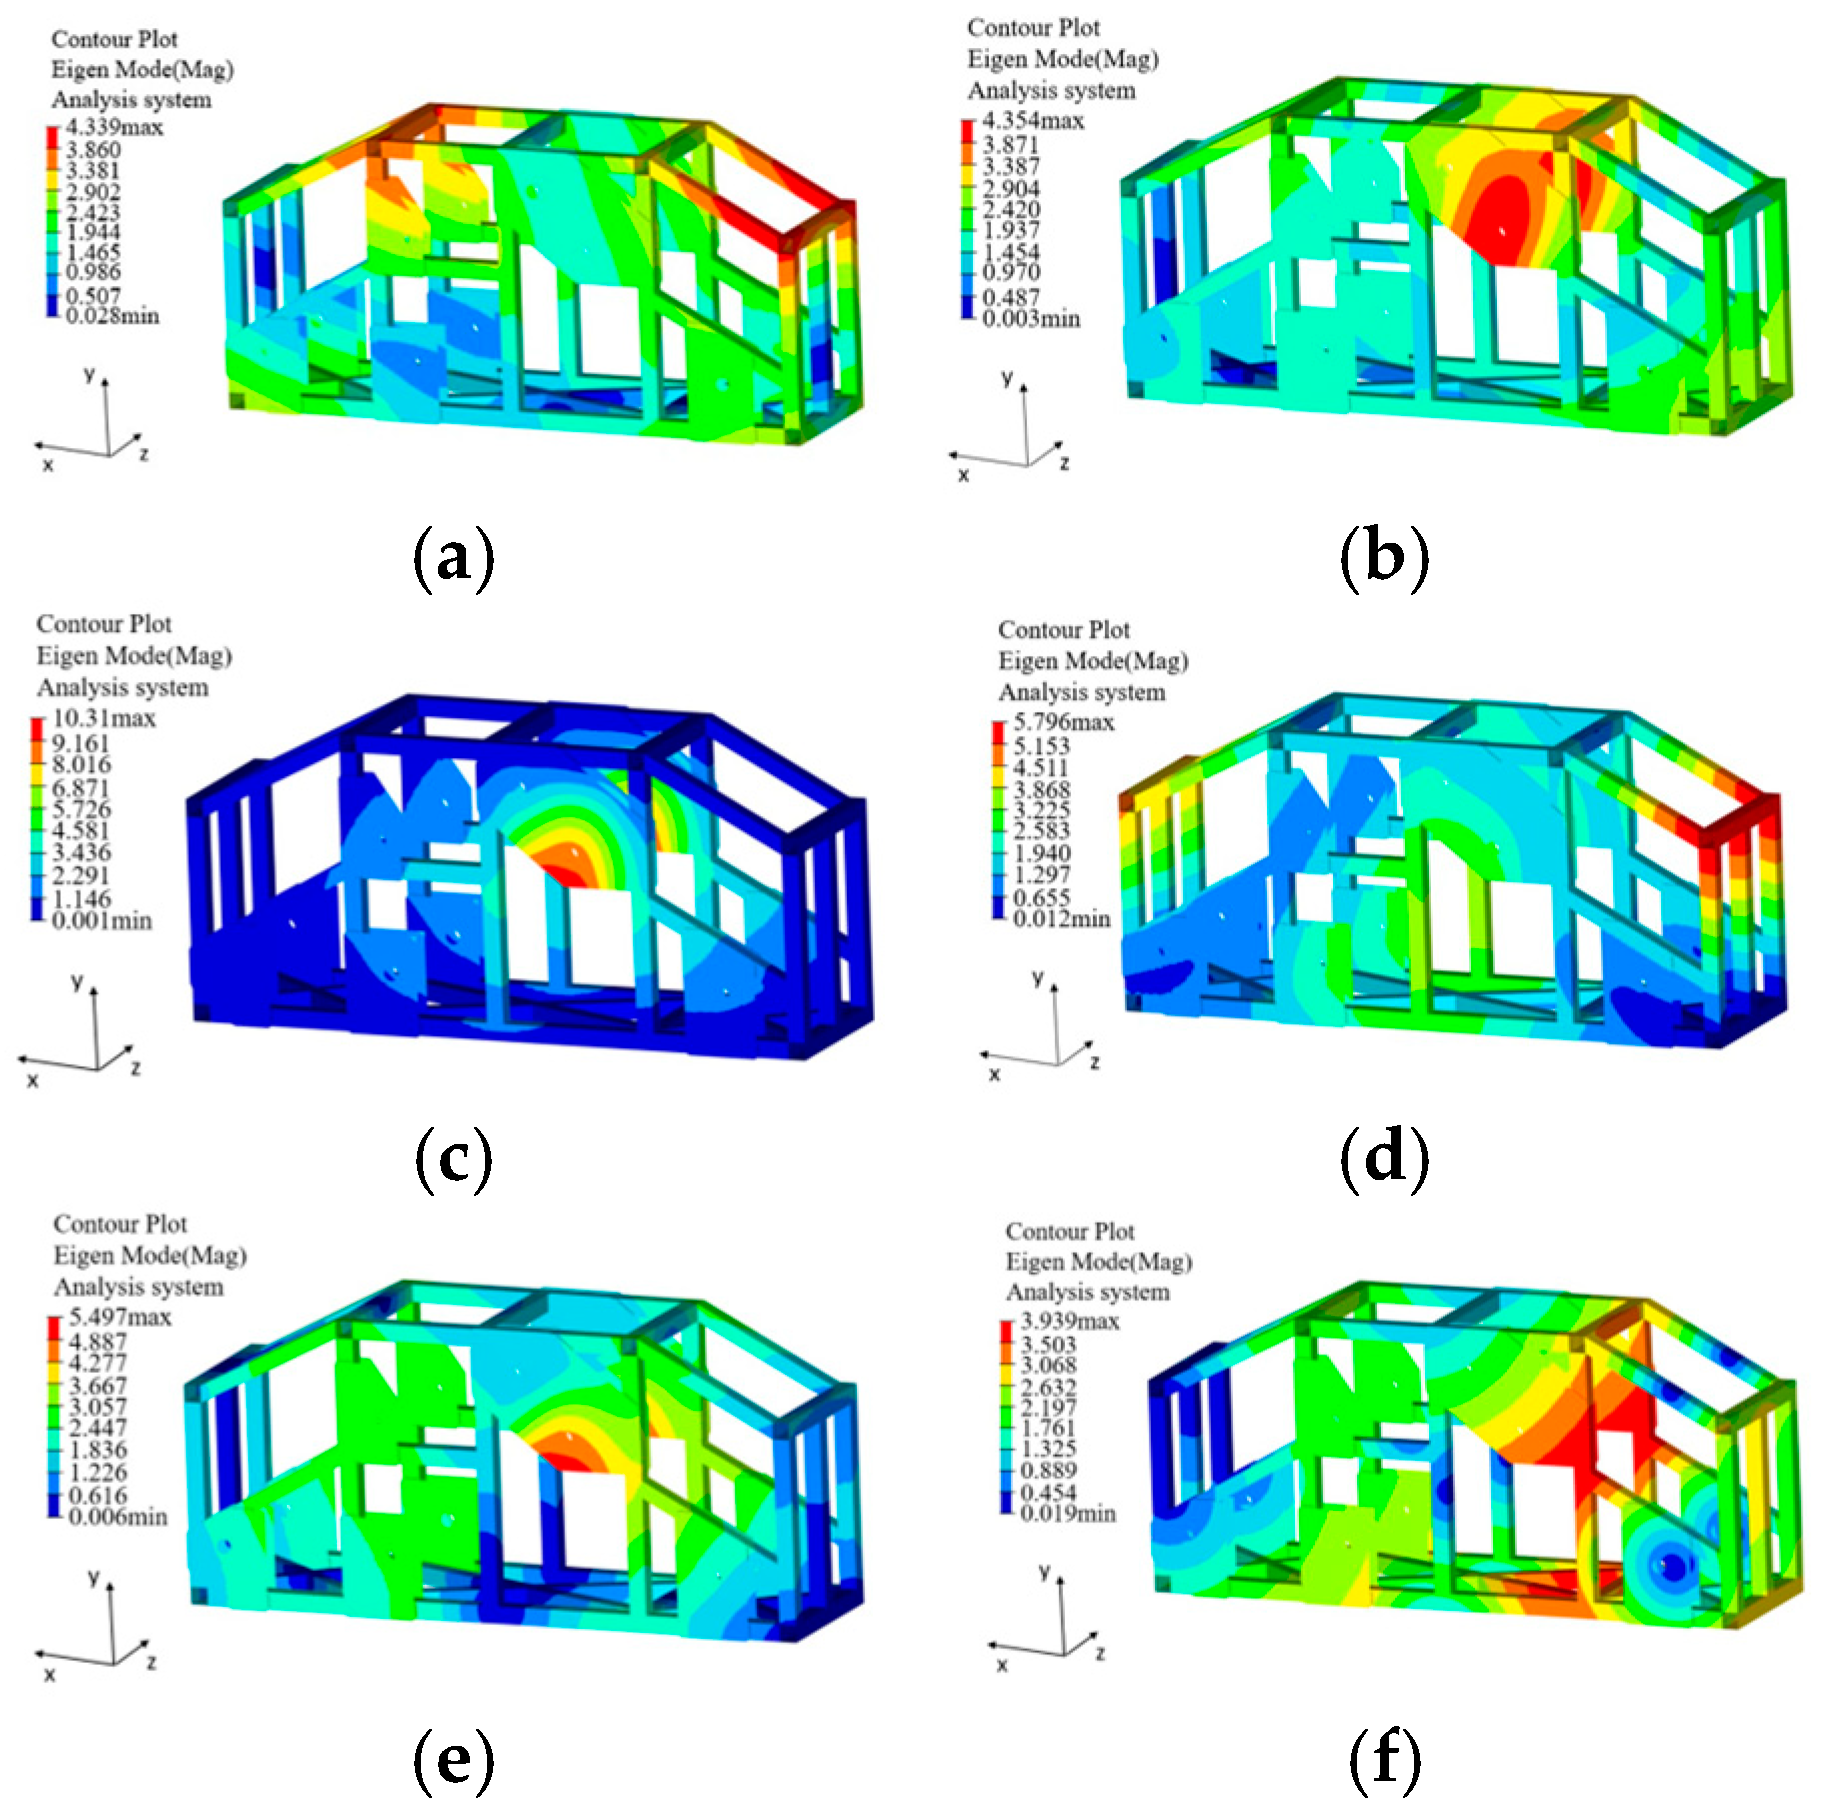
In the modal analysis of the tri-axle unmanned vehicle frame under free boundary conditions, the Block Lanczos method was used, with the number of modes set to 12. Since the first six modes are rigid body modes with modal frequencies close to zero, the focus was on analyzing the 7th to 12th modal frequencies. As shown in Table 3 and Figure 10, the non-rigid body modal frequencies and mode shapes of the tri-axle unmanned vehicle frame are presented. The natural frequencies of the frame are mainly concentrated in the range of 80 Hz to 145 Hz, effectively avoiding the 1 Hz to 20 Hz excitation frequencies from uneven road surfaces [43] and the 60 Hz vibration frequency of the drive motor, thereby preventing the occurrence of resonance.
Based on the results of the static and dynamic analysis of the tri-axle unmanned vehicle frame, it can be observed that there is potential for further optimization of the structural parameters of the thin-walled beams. To minimize the impact of structural parameter optimization on the overall frame structure, the subsequent optimization work will maintain the structural layout and overall dimensions of the frame while focusing on optimizing the cross-sectional dimensions of the thin-walled beams.

3. Experimental Validation of the Tri-Axle Unmanned Vehicle Frame

3.1. Experimental Validation Method

To verify the accuracy of the finite element model and the precision of the finite element analysis method, resistance strain measurement technology was used in conjunction with field test conditions to measure the stress and strain values at specified points on the tri-axle unmanned vehicle frame under bending and torsion conditions.
Using resistance strain measurement technology, this study effectively captured key data on the frame when subjected to tensile and compressive stress, torque, and bending moments. These data provide reliable experimental evidence for structural design optimization, stress calibration, and failure prediction of the frame. The principle of this technology involves attaching strain gauges to specific locations on the frame where significant strain is expected. When the frame deforms under load, the resistance of the strain gauges changes accordingly. As illustrated in the strain gauge schematic diagram in Figure 11, the strain gauges used in this experiment have a sensitivity coefficient of 2.0 and a strain limit of 20,000 µm/m. The resistance changes measured by the strain gauge are converted into electrical signals proportional to the strain values. By recording these electrical signals and using the conversion relationship between stress, strain, and the electrical signals, the actual stress and strain values of the frame can be calculated.
The formula for calculating the von Mises stress σ [44] is as follows:
σ = E ε 0 ° ε 90 ° 2 1 μ + ε 0 ° ε 45 ° 2 + 2 ε 45 ° ε 90 ° 2 2 1 + μ
where ε 0 ° is the strain value of 0 ° , ε 45 ° is the strain value of 45 ° , ε 90 ° is the strain value of 90 ° , E is the elastic modulus, and μ is Poisson’s ratio.

3.2. Bending and Torsion Tests of the Tri-Axle Unmanned Vehicle Frame

This study conducted experimental validation using bending and torsion as typical loading conditions. In the bending condition, downward forces of 500 N, 1000 N, 1500 N, 2000 N, and 2500 N were applied at the center of the bottom of the frame. In the torsion condition, torsional loads of 500 N·mm, 1000 N·mm, 1500 N·mm, 2000 N·mm, and 2500 N·mm were applied to both sides of the front of the vehicle. The loading application methods, constraint settings, and positions of the strain gauges during the bending and torsion tests of the tri-axle unmanned vehicle frame are detailed in Figure 12.
To ensure the accuracy of the experimental results, this study performed data collection five times for each loading method and calculated the average values to determine the von Mises stress at the locations where the strain gauges were attached. As shown in Table 4 and Table 5, a comparison of the simulated stress values and experimental values at the measurement points revealed that the maximum relative error of the stress simulation for the three-axle unmanned vehicle frame was 5.4%, which is within a controllable range. This result verifies the accuracy of the finite element model, indicating that the model is suitable for subsequent modal validation and optimization work.

3.3. Modal Test of the Tri-Axle Unmanned Vehicle Frame

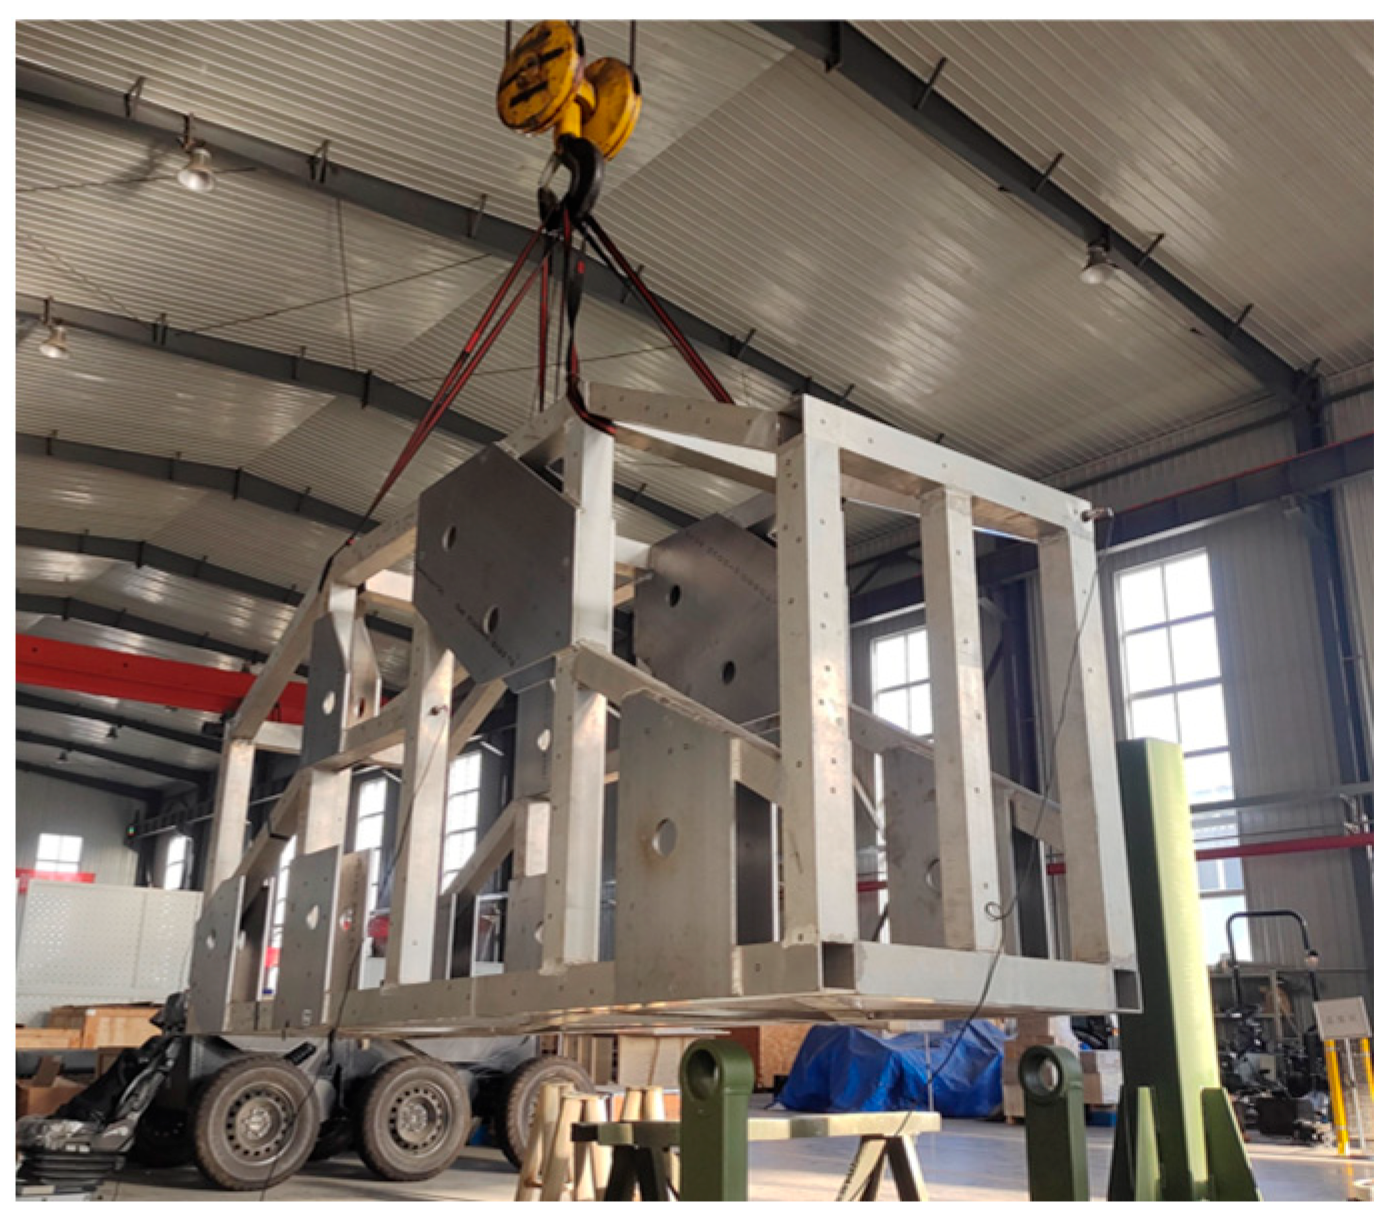
To further verify the accuracy of the finite element model of the tri-axle unmanned vehicle frame, a modal test was conducted on the frame. This modal testing accurately determines the dynamic characteristics of the frame while also guiding and correcting the finite element model, thereby validating its reliability and enhancing research and development efficiency. The frame was freely suspended from a hoist hook using elastic ropes, as shown in Figure 13. Based on the mode shapes obtained from the modal analysis, acceleration sensors were attached to positions with significant amplitude. The hammer impact method was used to perform modal testing on the three-axle unmanned vehicle frame, applying impact excitation to the frame and recording the vibration response using the Donghua Dynamic Signal Acquisition Instrument (DH5922N, Jiangsu Donghua Test Technology Co., LTD, Jingjiang, China).
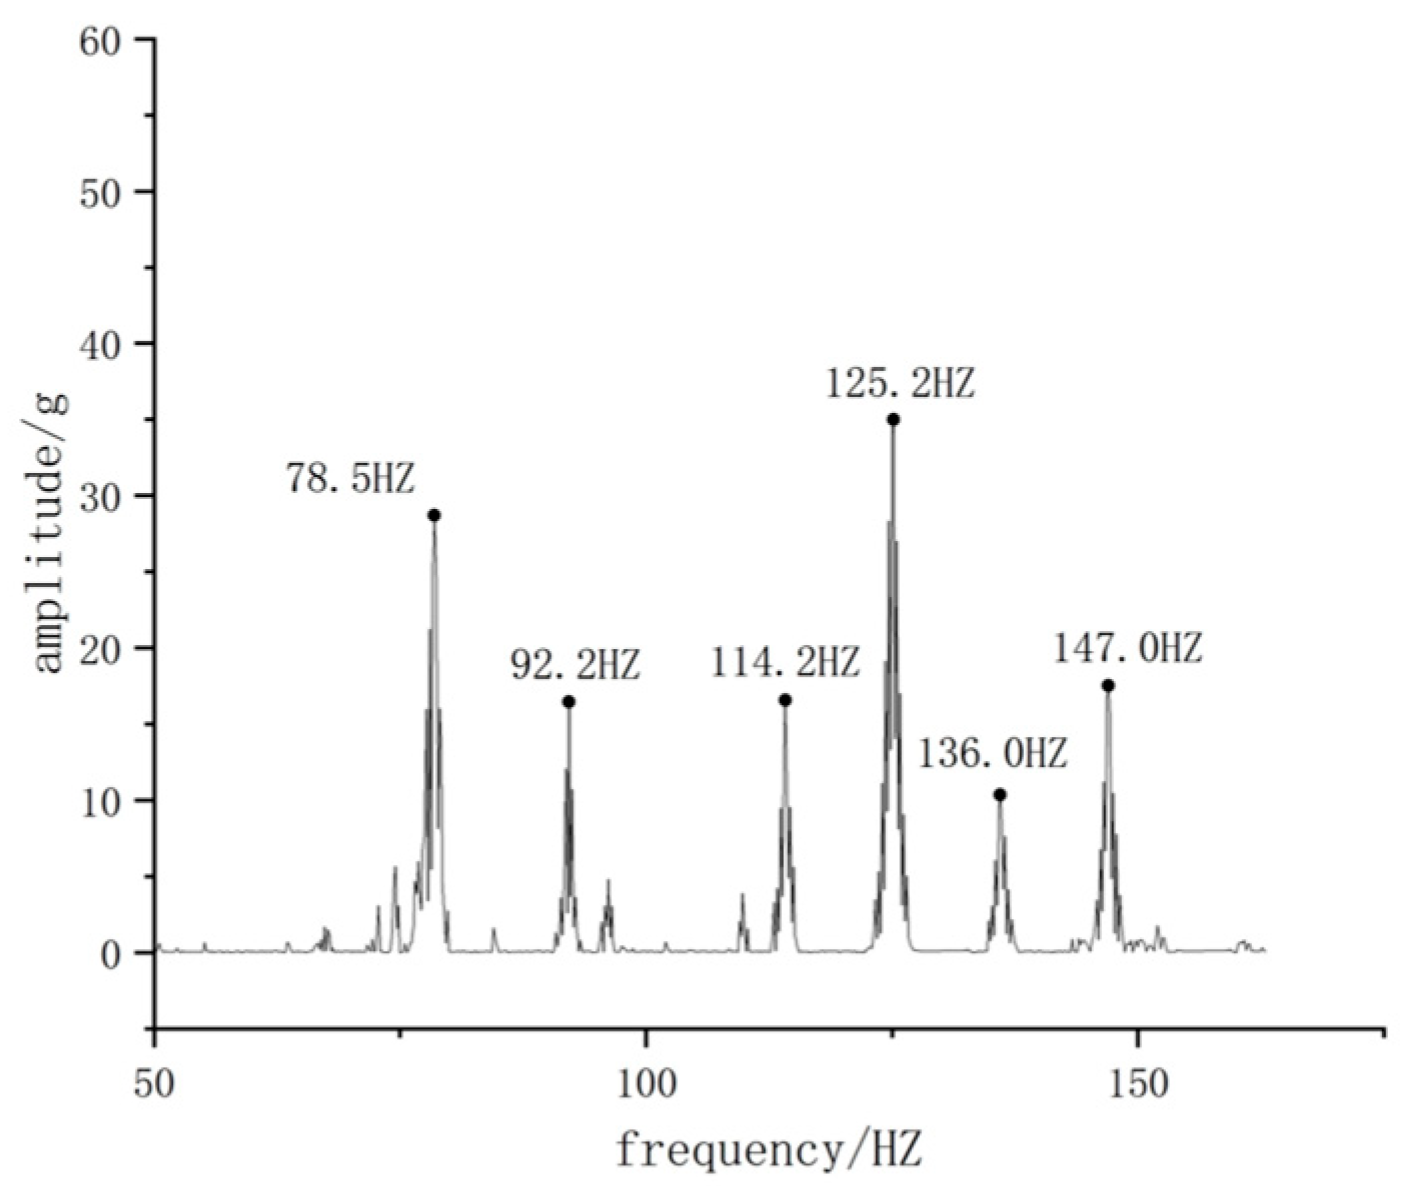
The fast Fourier transform (FFT) was employed for frequency domain analysis to obtain the natural frequencies of the frame. The frequency response curve of the tri-axle unmanned vehicle frame is shown in Figure 14, with the first six natural frequencies of the frame being 78.5 Hz, 92.2 Hz, 114.2 Hz, 125.2 Hz, 136.0 Hz, and 147.0 Hz, respectively.
By comparing the results of the modal test and modal simulation, the maximum relative error was found to be 3.3%, as shown in Table 6. This indicates that the finite element model and modal analysis method for the tri-axle unmanned vehicle frame possess high accuracy, ensuring the reliability of subsequent optimization efforts.

4. Sensitivity Analysis of Thin-Walled Beam Cross-Sections in the Frame

4.1. Sensitivity Analysis

Sensitivity analysis can quickly identify the design variables that significantly affect the frame structure. The sensitivity values reflect the degree and trend of influence that these design variables have on the frame structure, thereby clarifying their impact. Therefore, by using sensitivity analysis, design variables with high correlation can be directly screened out, reducing the number of design variables in the computational process. This approach enhances design efficiency while lowering design time and economic costs.
Sensitivity analysis involves calculating the partial derivatives of the design response with respect to the optimization variables. For the finite element equation [45], the following is obtained:
K U = P
where K is the stiffness matrix of the frame, U is the displacement vector, and P is the load vector.
Taking partial derivatives of both sides of the equation with respect to the design variable M , the following is obtained:
K M U + K U M = P M
The design variable M is the thickness m i i = 1,2 , n of the thin-walled beam in the tri-axial unmanned vehicle frame.
The partial derivative with respect to the displacement vector U is as follows:
U M = K 1 P M K M U
For sensitivity analysis, the design response is a function of the displacement vector U , written as follows:
g = Q T U
where Q T represents the function of the design response in terms of the displacement vector U .
The partial derivative of the design response with respect to the design variable is written as follows:
g M = Q T M U + Q T U M
The positive and negative correlations between design variables and responses can be indicated by the signs of the sensitivity values, while the extent of influence of the cross-sectional thickness dimensions on the thin-walled beams under each loading condition can be represented by the absolute values of the sensitivities. By conducting sensitivity analysis on the modal and torsional-bending stiffness of the three-axle unmanned vehicle frame, the sensitivities of the thin-walled beams in the frame under different operating conditions can be determined.

4.2. Sensitivity Analysis Results

Using sensitivity analysis, the mass, full-load bending, full-load torsion, and first-order natural frequency of each thin-walled beam in the tri-axle unmanned vehicle frame were analyzed. By selecting the thin-walled beam members with the greatest influence as design variables for subsequent multi-objective optimization analysis, optimization efficiency was improved.
The tri-axle unmanned vehicle frame is composed of 46 thin-walled beams. Using the Optistruct solver in the Hypermesh finite element analysis software, the mass, full-load bending, full-load torsion, and first-order natural frequency sensitivity analyses were performed on the cross-sectional thickness of the 46 thin-walled beams. The range of values for the design variables was set between 60% and 140% of the original data. The analysis results are shown in Table 7.

4.3. Selection of Design Variables

To eliminate the influence of the mass of the thin-walled beams on sensitivity under different operating conditions, relative sensitivity was used to filter the beams [46].
S S w = S w S m
S S n = S n S m
S S q = S q S m
where S S w , S S n , S S q , and S m represent the respective relative sensitivities for bending stiffness, torsional stiffness, first-order frequency, and mass; and S w , S n , and S q denote the sensitivity values for bending stiffness, torsional stiffness, and first-order frequency.
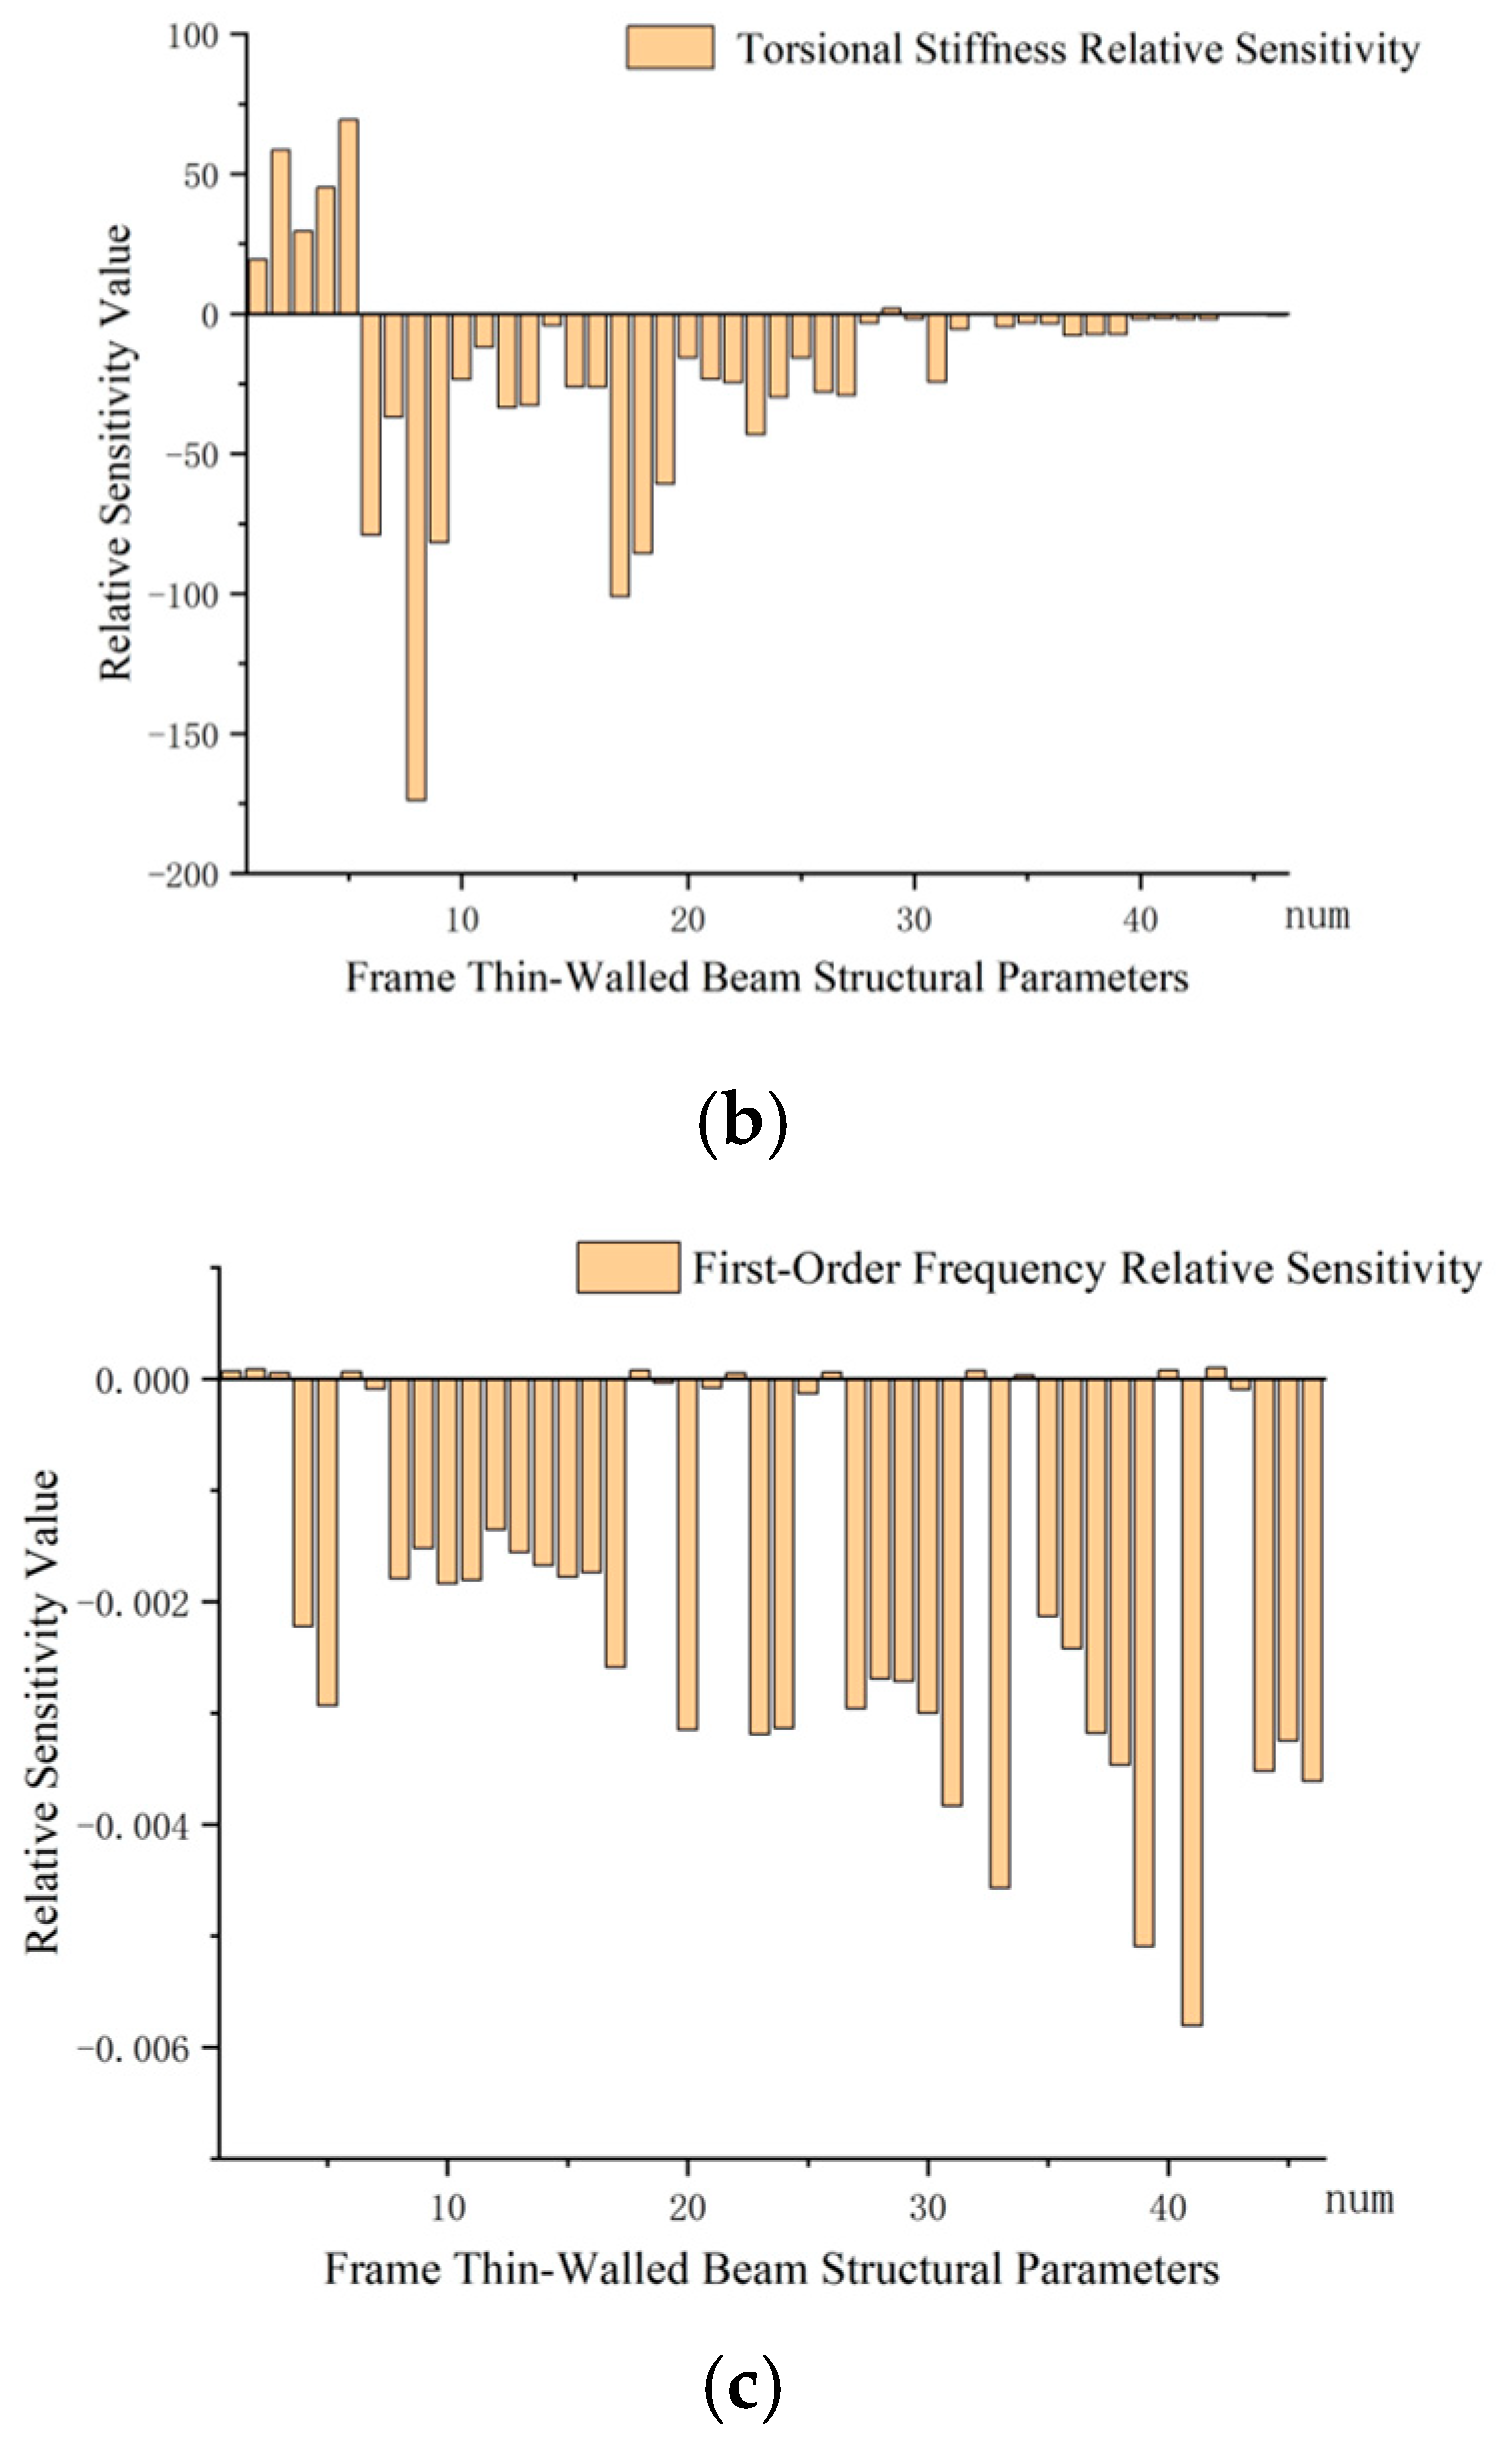
As shown in Figure 15a, the relative sensitivity of the bending stiffness for beams num28, num29, and num30 is relatively high, while Figure 15b shows that the relative sensitivity of the torsional stiffness for beams num8 and num9 is also significant. Figure 15c indicates that beam num41 has a greater impact on the first-order frequency of the frame, whereas beams num1, num2, num3, num6, num7, num10, num11, num14, num21, num22, num25, num26, num32, num34, num40, num42, and num43 have lower relative sensitivity to the bending-torsion first-order frequency, suggesting that the wall thickness of these beams could be reduced. Based on the above results, a total of 23 horizontal and longitudinal thin-walled beams—num1, num2, num3, num6, num7, num8, num9, num10, num11, num14, num21, num22, num25, num26, num28, num29, num30, num32, num34, num40, num41, num42, and num43—were selected as design variables for the multi-objective optimization of the frame.

5. Multi-Objective Optimization Design of the Frame

5.1. DOE (Design of Experiment)

Design of experiments (DOE) is an efficient data analysis method that is widely used in engineering and scientific research. It selects a limited number of sample points from the design space based on specific rules to reflect the characteristics of the entire design space. Therefore, DOE is often used as a sampling method for response surface models, aiming to improve computational efficiency, reduce testing costs, and enhance the efficiency of the optimization process.
In this study, the structural parameters of the 23 thin-walled beams selected from the tri-axle unmanned vehicle frame were used as the targets for multi-objective optimization. The design variables were defined as the thickness of the square tube beams, with their value ranges provided in Table 8.
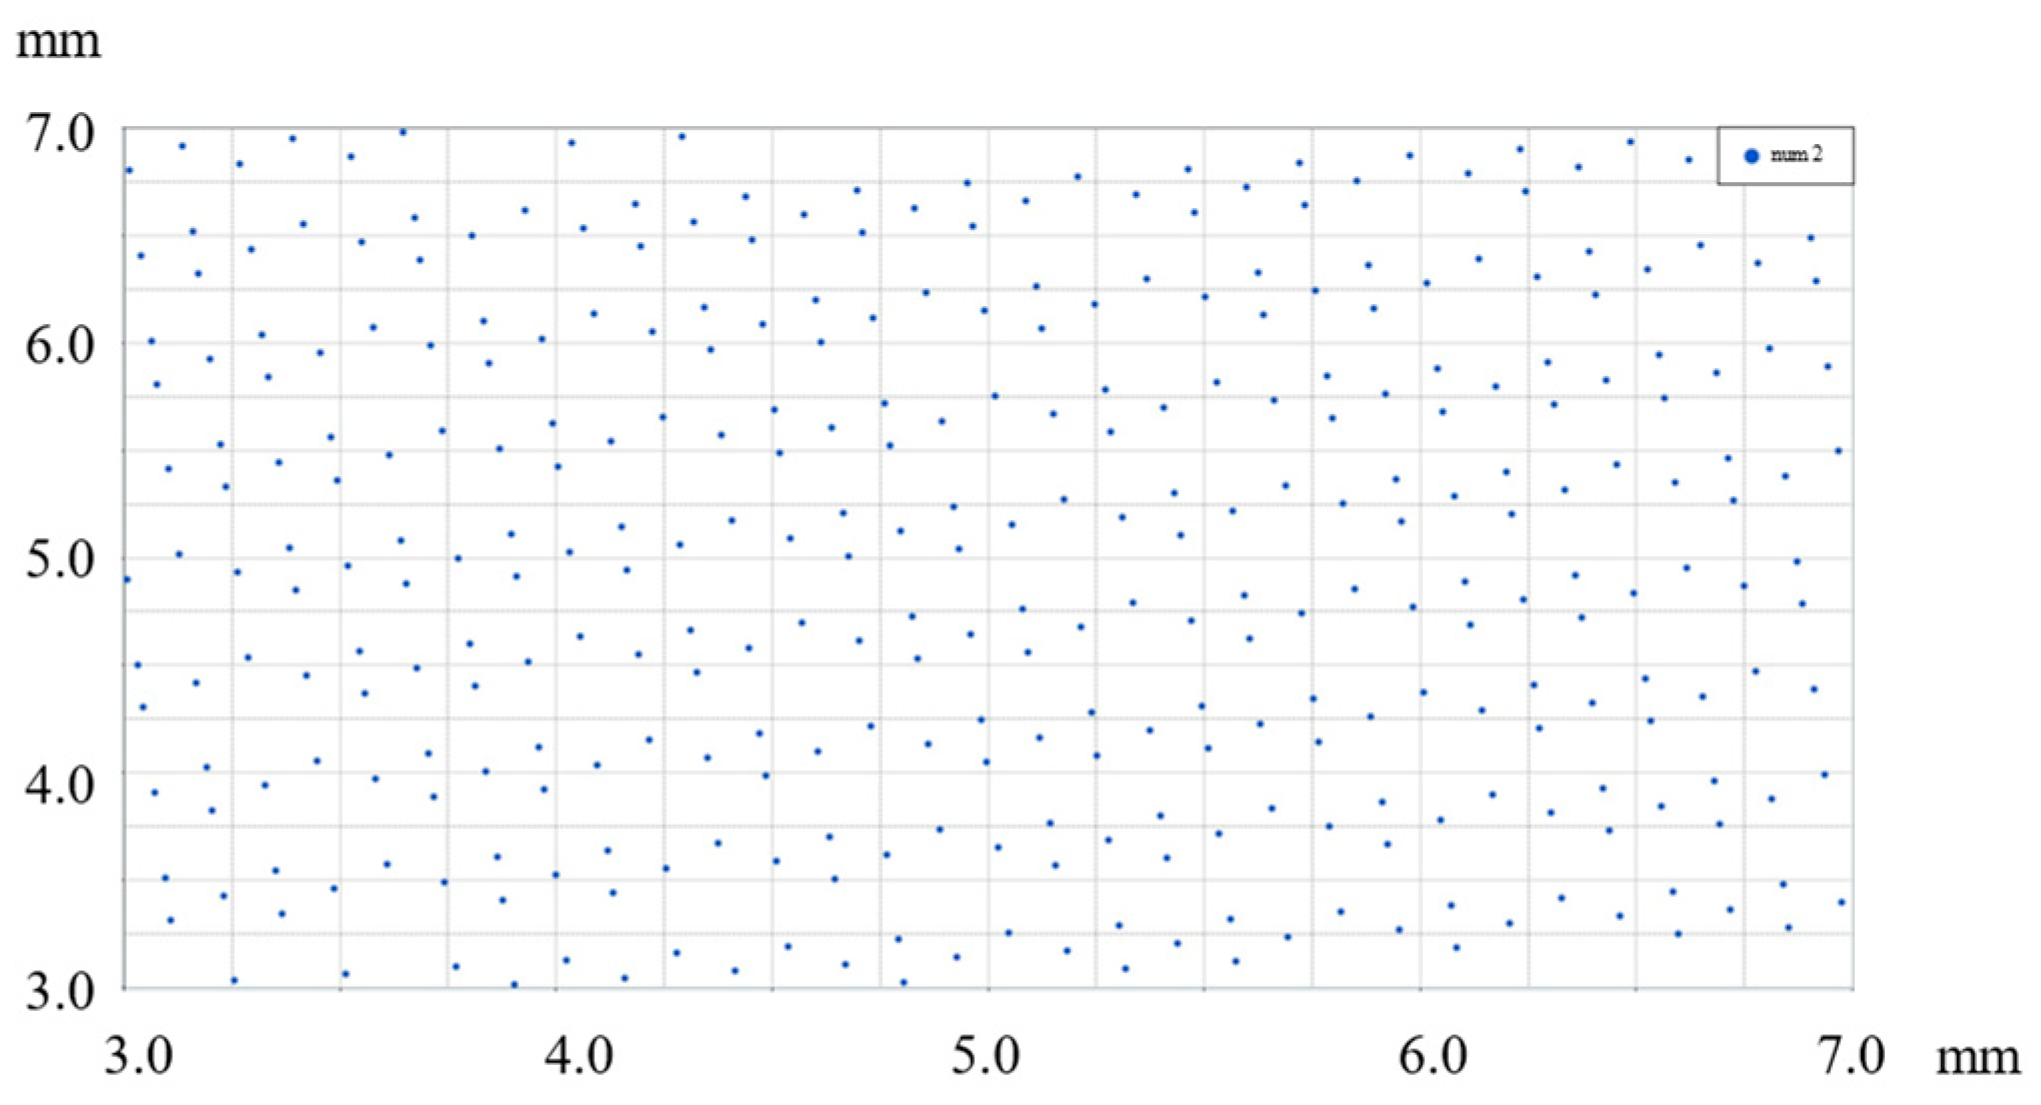
The modified expandable lattice sequence method is a quasi-random, discrepancy-free sequence generation method that ensures uniform distribution of points in space, minimizing clumping and void regions. As shown in Figure 16, its expandability allows for the addition of more points into the space while maintaining uniform distribution across all points.
The minimum number of experiments using the expandable lattice sequence method is denoted as 1.1 × N + 1 N + 2 2 , where N represents the number of design variable factors.

5.2. Response Surface Fitting

To reduce the computational workload in multi-objective optimization, an approximate surrogate model is introduced to minimize the time required for optimization calculations. The least squares regression (LSR) and radial basis function network (RBF) methods are employed to fit the response surfaces for the frame mass, first-order modal frequency f , maximum bending stress σ m a x , and maximum torsional stress σ m a x .
Least squares regression (LSR) can be understood as a method of minimizing the squared differences between the fitted function values and the original data. The basic principle is that, for a given set of data a = a 1 , a 2 , , a n T , it satisfies the follwoing [47]:
b = f a , c
The coefficient c = c 1 , c 2 , , c n T in the equation is associated with the function of a .
From this, we can derive the sample fitting formula for the least squares method, written as follows:
m i n E b , f a , c = i = 1 n b i f a i , c i 2
By solving the above equation, we obtain the coefficients c , where the set of c values corresponding to the minimum value of E represents the parameters that meet the least squares method criteria.
The expression for the radial basis function (RBF) neural network [48] is given as follows:
f x = i = 1 n λ i φ i x + θ
where x is the design variable, λ i and φ i x are the weighting coefficients of the radial basis functions, i is the number of radial basis functions, and θ is the unknown threshold. Compared with other response surface fitting methods, the radial basis function network (RBF) method has the advantages of lower computational cost and higher efficiency. However, the RBF method is characterized by implicit expressions and cannot provide a detailed explicit expression.
To ensure the reliability of the response surface approximation model, the coefficient of determination (R-square) is introduced to evaluate the fitting accuracy of the response surface. The closer the coefficient of determination is to 1, the higher the fitting accuracy of the response surface approximation model. Its calculation formula is as follows: [49]
R 2 = 1 S S E S S T
S S E = i = 1 n y i y ^ i
S S T = i = 1 n y i y ¯ i
In the formula, y i represents the true value of the selected sample, y ^ i is the fitted value from the approximate model, y ¯ i is the average value of the sample data, and n is the number of samples. The response types and determination coefficients for the frame mass m , first-order modal frequency f , maximum bending stress σ m a x , and maximum torsional stress σ m a x were calculated, as shown in Table 9.
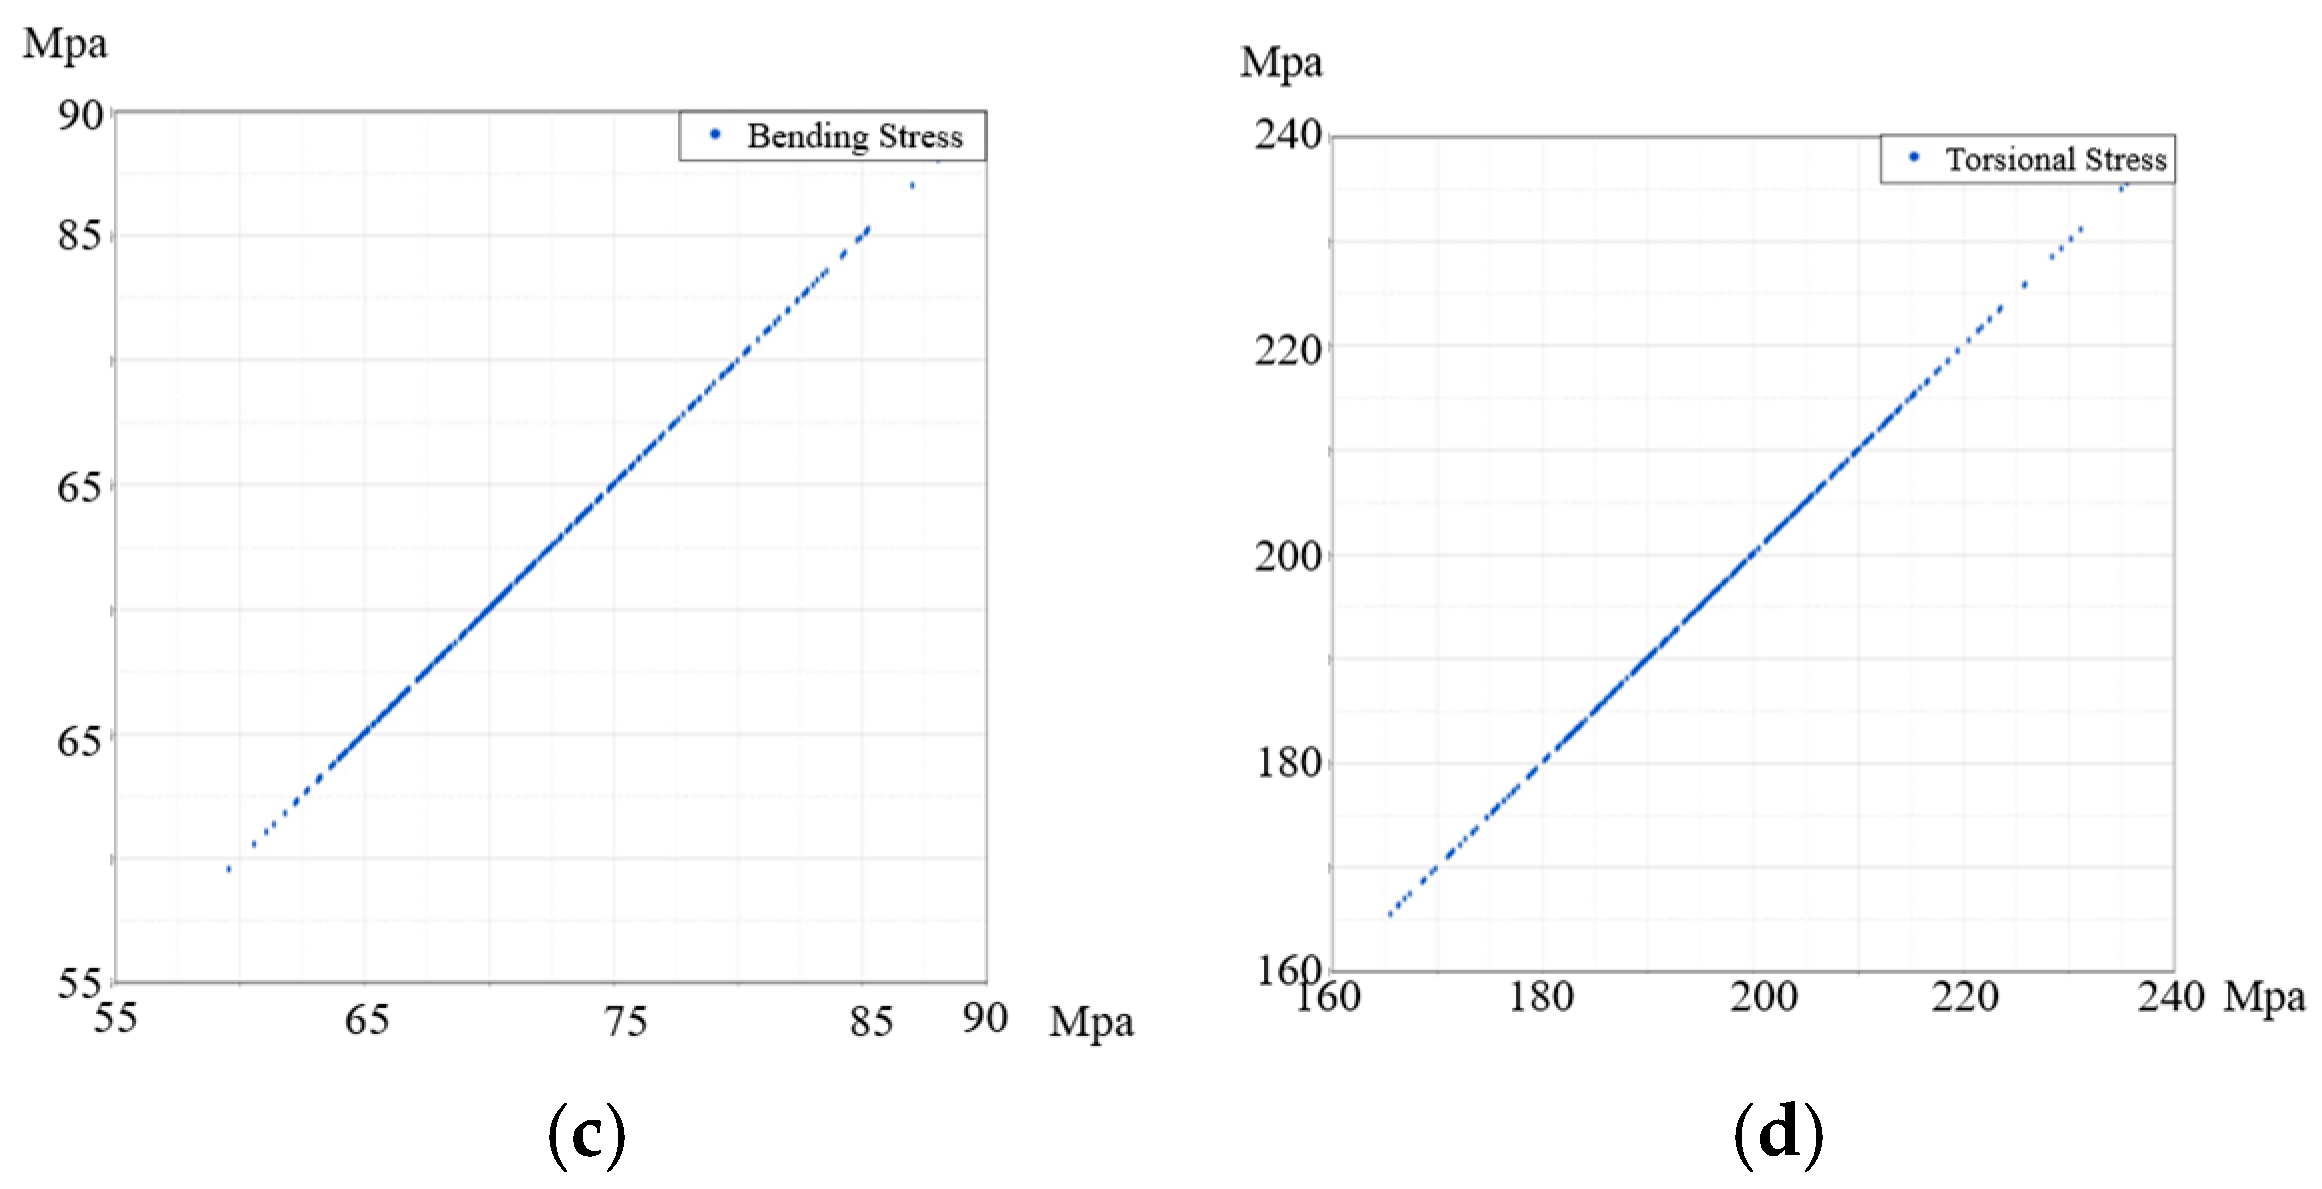
The experimental results of the approximate models for the frame mass m , first-order modal frequency f , maximum bending stress σ m a x , and maximum torsional stress σ m a x are presented in Figure 17. It can be observed that each response surface approximation model exhibits high fitting accuracy and can be used as a surrogate model for multi-objective optimization.
The minimum number of experiments using the expandable lattice sequence method is 1.1 × N + 1 N + 2 2 , and therefore, 330 experiments were conducted to create the response surface. The response surface [50,51,52,53,54] was constructed to establish the relationship between design variables and responses, replacing the lengthy computational time of the finite element model. The frame mass and first-order modal frequency were modeled using the radial basis function network (RBF), while the maximum bending stress and torsional stress were modeled using the least squares regression (LSR). The resulting response surface models are shown in Figure 18.

5.3. Optimization Design of the Frame Based on the MOGA Multi-Objective Genetic Algorithm

Considering performance metrics such as frame mass, first-order modal frequency, maximum bending stress, and torsional stress, the objective functions often involve conflicting mathematical descriptions. Multi-objective optimization aims to optimize multiple sub-objectives to find a solution set where all objective function values are optimized. The mathematical model for multi-objective optimization is described as follows: [55,56]:
The design variable x in the multi-objective optimization process is defined as follows:
x = x 1 , x 2 , , x n
where n is the number of design variables.
M i n f x = f 1 x , f 2 x , , f m x T
The optimization objective function f x is defined as follows:
s . t . g i x 0
h i x 0
where g i x and h i x are the constraint functions for the multi-objective optimization.
The range of values for the design variables is specified as follows:
x N x x M
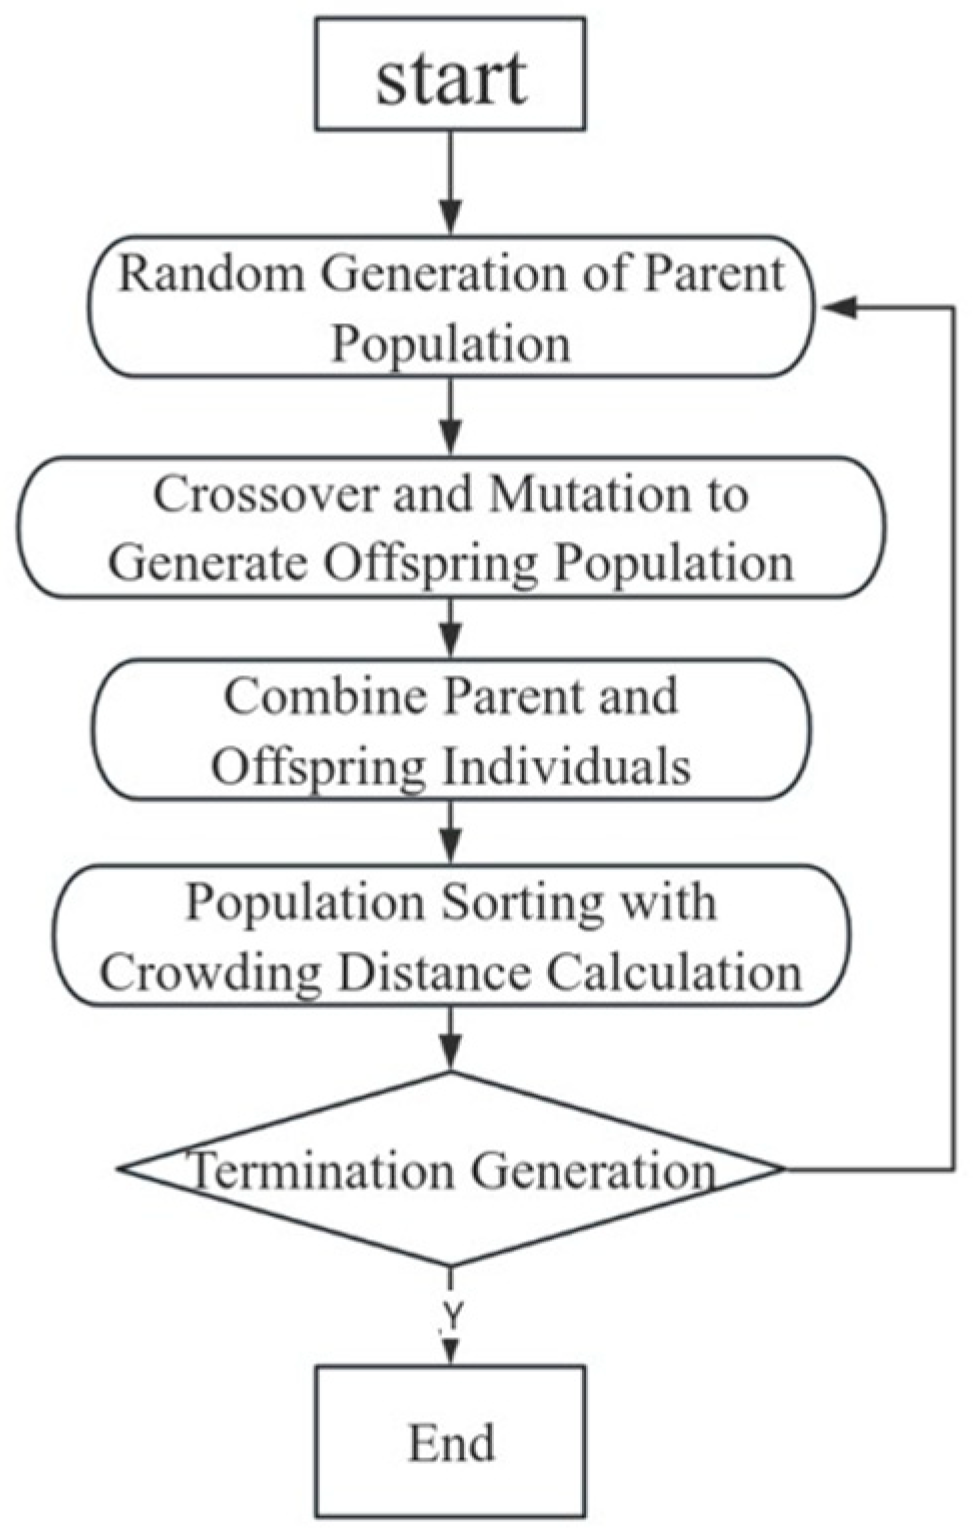
Traditionally, multi-objective problems are addressed by employing a certain strategy to balance the trade-offs between objectives, thereby transforming a multi-objective problem into multiple single-objective optimization problems, also known as scalar optimization problems. Common multi-objective optimization algorithms include the global response surface method (GRSM) and the multi-objective genetic algorithm (MOGA). GRSM is widely applicable, capable of approximating the complex relationships between experimental variables and response variables while gradually searching for the global optimum. However, GRSM requires substantial time and experimental data for model construction and optimization. In contrast, the multi-objective genetic algorithm (MOGA) exhibits rapid convergence and robust global search capabilities. Instead of solving objectives independently, MOGA generates the Pareto front in a single iteration, making it an effective method for addressing multi-objective optimization problems. The MOGA computational process is illustrated in Figure 19.

5.4. Comparison of Optimization Results

Using the MOGA genetic algorithm, after 8522 optimization iterations, the Pareto front for the design variables of the tri-axial unmanned vehicle frame beams was obtained, as shown in Figure 20 and Figure 21. From the Pareto chart, it was found that the achievable range for the frame mass is between 205.4 kg and 215.1 kg, which includes 78.4 kg for the connecting side plates. The optimized first-order modal frequency range is 75.6 Hz to 80.8 Hz, effectively avoiding the 1 Hz to 20 Hz uneven road excitation and the 60 Hz drive motor vibration frequency. The maximum full-load bending stress range is 68.9 MPa to 75.1 MPa, and the maximum full-load torsional stress range is 179.9 MPa to 195.2 MPa, both below the yield strength of the frame material, meeting the strength requirements.
Considering all performance indicators of the frame comprehensively, the 23 optimized design variables for the tri-axial unmanned vehicle frame beam cross-sections were rounded, and the final optimal design variables are listed in Table 10.
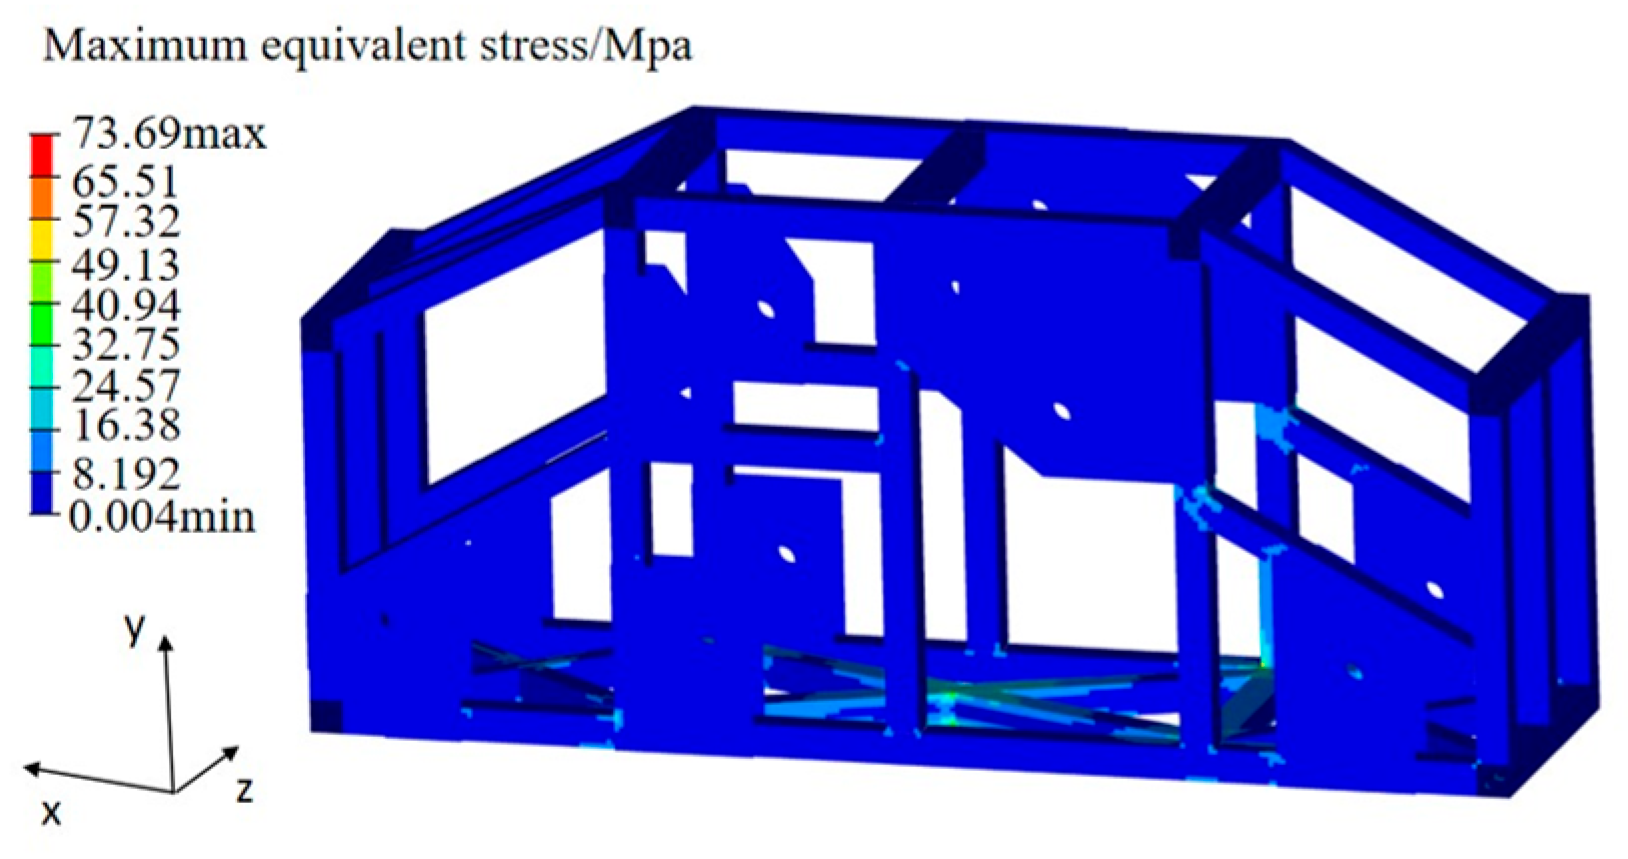
Based on the optimization results, the finite element model of the frame was modified, and the stress, strain, and other indicators under various working conditions were calculated through finite element analysis. The results are shown in Table 11. The static stress cloud diagrams of the optimized frame are shown in Figure 22 and Figure 23. By comparison, it was found that the modal frequency, torsion, and maximum bending stress of the frame before and after optimization only changed slightly, meeting the design requirements. The optimized frame mass was reduced by 10.1 kg, achieving a weight reduction rate of 7.44%. Compared with the optimization method based on the Kriging surrogate model used by Qiu Xuyun and others, as well as the optimization method combining multibody dynamics, finite element analysis, and orthogonal experiments employed by Zheng Mingjun and others, this comprehensive structural optimization method, integrating sensitivity analysis and MOGA, demonstrated a substantial improvement in weight reduction. The first-order modal frequency was reduced by 4.5 Hz, still above the excitation frequency from the road surface and motor vibration. The maximum full-load bending and torsional stresses increased by 4.39 MPa and 4.8 MPa, respectively, with only slight increases of 6.3% and 2.5%, still well below the yield strength of 7A58AL material, thus meeting the strength requirements.

6. Conclusions

In this study, finite element analysis software Hypermesh and multidisciplinary optimization software Hyperstudy (2022) were used to carry out the lightweight design of the tri-axial unmanned forestry vehicle frame’s thin-walled beams. First, a finite element model of the frame was established, and the accuracy of the model and analysis method was validated through experiments. Then, sensitivity analysis was used to filter the design variables to determine those that significantly impact the frame’s performance. The response surface model was established using least squares regression (LSR) and a radial basis function network (RBF) to describe the relationship between design variables and responses. Based on performance indicators such as frame mass, modal frequency, and maximum bending and torsional stresses, this study applied a multi-objective genetic algorithm (MOGA) for multi-objective lightweight design. The design results indicate that, while meeting all design requirements, the vehicle frame achieved a weight reduction of 10.1 kg, corresponding to a weight reduction rate of 7.44%, thereby realizing significant lightweighting. Furthermore, the original mechanical performance of the forest-use triaxial unmanned vehicle frame was preserved. It improves the energy utilization efficiency, operational efficiency, and mobility of the forestry triaxial unmanned vehicle, providing a feasible solution for the innovative, environmentally friendly, and efficient development of forestry machinery.
The optimization strategy proposed in this study aims to achieve significant weight reduction of the vehicle frame without substantially impacting its static and dynamic performance. This method offers a reliable and efficient solution for lightweight frame design, which not only enhances the operational stability of the forestry tri-axle unmanned vehicle but also effectively extends its range. These improvements hold great significance for increasing efficiency in forestry transportation and unmanned monitoring tasks, demonstrating the vital role of technological innovation in boosting the effectiveness of forestry operations.

Author Contributions

Conceptualization, Q.C. and Y.Z.; methodology, Q.C. and X.Y.; software, Q.C.; validation, Q.C., Y.Z. and D.W.; formal analysis, Q.C.; resources, Z.C. and Q.W.; data curation, Q.C.; writing—original draft preparation, Q.C.; writing—review and editing, Q.C. and X.Y.; visualization, Q.C.; supervision, X.Y.; project administration, Z.C. and Q.W.; funding acquisition, X.Y, Z.C. and Q.W. All authors have read and agreed to the published version of the manuscript.

Funding

This research was funded by the National Natural Science Foundation of China (grant number 51475255).

Data Availability Statement

The Data presented in this study are included in the article.

Conflicts of Interest

The authors declare no conflicts of interest.

References

  1. Kalyashov, V.; Mikheev, A.; Kunickaya, O.; Grigorev, I.; Tikhonov, E.; Grigorev, G.; Storodubtseva, T.; Lavrov, M. Design and analysis of electric power-assisted steering in vehicles for mountain forests. Proc. Inst. Mech. Eng. Part D J. Automob. Eng. 2023, 237, 3494–3504. [Google Scholar] [CrossRef]
  2. Sun, Z.; Zhang, D.; Li, Z.; Shi, Y.; Wang, N. Optimum design and trafficability analysis for an articulated wheel-legged forestry chassis. J. Mech. Des. 2022, 144, 013301. [Google Scholar] [CrossRef]
  3. Rybansky, M. Determination the ability of military vehicles to override vegetation. J. Terramechanics 2020, 91, 129–138. [Google Scholar] [CrossRef]
  4. Anandan, N.; Arronde Pérez, D.; Mitterer, T.; Zangl, H. Design and evaluation of capacitive smart transducer for a forestry crane gripper. Sensors 2023, 23, 2747. [Google Scholar] [CrossRef] [PubMed]
  5. Scolaro, E.; Beligoj, M.; Estevez, M.P.; Alberti, L.; Renzi, M.; Mattetti, M. Electrification of agricultural machinery: A review. IEEE Access 2021, 9, 164520–164541. [Google Scholar] [CrossRef]
  6. Zhang, J.; Deng, Y.; Zheng, B.; Qi, X. Lightweight design of low-load electric vehicle frame. J. Comput. Methods Sci. Eng. 2021, 21, 423–433. [Google Scholar] [CrossRef]
  7. Ju, Y.J.; Jeon, E.S. Topology optimization of seat cushion frame with dissimilar materials for lightweight strength optimization. Int. J. Manuf. Mater. Mech. Eng. (IJMMME) 2019, 9, 1–12. [Google Scholar] [CrossRef]
  8. Wang, D.; Xie, C.; Liu, Y.; Xu, W.; Chen, Q. Multi-objective collaborative optimization for the lightweight design of an electric bus body frame. Automot. Innov. 2020, 3, 250–259. [Google Scholar] [CrossRef]
  9. Liu, J.; Dai, R.; Wu, T.; Zhou, P.; Yang, X. Reliability optimisation of an electric bus frame orienting side impact safety and lightweight. Int. J. Veh. Perform. 2023, 9, 225–249. [Google Scholar] [CrossRef]
  10. Zheng, B. Analysis of Static and Dynamic Characteristics and Lightweight Design of Titanium Alloy Frame. Manuf. Technol. 2024, 24, 507–519. [Google Scholar] [CrossRef]
  11. Longye, P.; Zhu, X.; Yang, L.; Guan, T. Lightweight Design of an Electric Tricycle Frame Considering Dynamic Stress in Driving Conditions. Int. J. Automot. Technol. 2021, 22, 1075–1085. [Google Scholar]
  12. Cheng, L.; Lin, H.B.; Zhang, Y.L. Optimization design and analysis of mobile pump truck frame using response surface methodology. PLoS ONE 2023, 18, e0290348. [Google Scholar] [CrossRef]
  13. Shangguan, Y.; Wang, W.; He, A.; Ma, W.; Tian, H. Lightweight design for the aluminum alloy-carbon fiber hybrid structure of the EMU car body. J. Mech. Sci. Technol. 2023, 37, 6441–6452. [Google Scholar] [CrossRef]
  14. Wang, F.C.; Gao, H.L.; Song, X.G.; Lei, Y.X. Designand Manufacture of an All-Terrain Six Wheel Mobile Robot. Mach. Des. Manuf. 2020, 253–256. [Google Scholar]
  15. Spinelli, R.; Magagnotti, N.; Pari, L.; De Francesco, F. A comparison of tractor-trailer units and high-speed forwarders used in Alpine forestry. Scand. J. For. Res. 2015, 30, 470–477. [Google Scholar] [CrossRef]
  16. Sun, S.; Wu, J.; Ren, C.; Tang, H.; Chen, J.; Ma, W.; Chu, J. Chassis trafficability simulation and experiment of a LY1352JP forest tracked vehicle. J. For. Res. 2021, 32, 1315–1325. [Google Scholar] [CrossRef]
  17. Fang, Z.L.; Song, Y.L.; Kang, J.; Zhang, X.H.; Zhang, D. Lightweight Design and Optimization of Integrated Die Casting Aluminum Alloy Front Cabin. Automot. Eng. 2019, 46, 1314–1322+1333. [Google Scholar]
  18. Qiu, X.Y.; Liu, J.Q.; Gao, Q.; Song, Y.M.; Feng, X.J. Optimization design of frame structure parameters of orchard operating machine based on Kriging approximate model. Chin. J. Agric. Mech. 2023, 44, 93–101. [Google Scholar]
  19. Zheng, M.J.; Zhao, C.L.; Wu, W.J.; Yang, S. Analysis and Optimization of All-terrain Mobile Robot Body Structure. Chin. J. Eng. Des. 2021, 28, 195–202. [Google Scholar]
  20. Tang, P.; Yang, R.; Ni, X.; Zhao, H.; Xu, F. Research on a lightweight unmanned sightseeing vehicle frame based on multi-condition and multi-objective optimization. Adv. Mech. Eng. 2022, 14, 16878132221131748. [Google Scholar] [CrossRef]
  21. Wang, C.; Li, M.; Cheng, A.G.; He, Z.C.; Yu, W.Y. Lightweight Design of Material-Structure for Steel-Aluminum Hybrid Cab. Automot. Eng. 2019, 46, 735–744. [Google Scholar]
  22. Zhao, X.; Liu, Y.; Hua, L.; Mao, H. Structural Analysis and Size Optimization of a Fine-Blanking Press Frame Based on Sensitivity Analysis. J. Mech. Eng. Stroj. Vestn. 2020, 66, 408. [Google Scholar] [CrossRef]
  23. Ma, Y.; Wang, X.; Zuo, W. Analytical sensitivity analysis method of cross-sectional shape for thin-walled automobile frame considering global performances. Int. J. Automot. Technol. 2020, 21, 1207–1216. [Google Scholar] [CrossRef]
  24. Wu, J.; Yang, Y.; Hu, J. Optimization of Pile Driver Frame Based on Sensitivity Analysis. Appl. Sci. 2023, 13, 4774. [Google Scholar] [CrossRef]
  25. Ma, W.; Lu, Y.; Wang, P.; Wang, Y.; Wang, J. Double optimization design of the formula racing car frame based on the variable density method and the joint variable method. Appl. Sci. 2023, 13, 10155. [Google Scholar] [CrossRef]
  26. Medeiros, G.; Florindo, T.; Talamini, E.; Fett Neto, A.; Ruviaro, C. Optimising tree plantation land use in Brazil by analysing trade-offs between economic and environmental factors using multi-objective programming. Forests 2020, 11, 723. [Google Scholar] [CrossRef]
  27. Wu, B.; Zheng, H.; Xu, Z.; Wu, Z.; Zhao, Y. Forest burned area detection using a novel spectral index based on multi-objective optimization. Forests 2022, 13, 1787. [Google Scholar] [CrossRef]
  28. Ru, S.; Zhao, C.; Yang, S. Multi-objective optimization and analysis of mechanical properties of coir fiber from coconut forest waste. Forests 2022, 13, 2033. [Google Scholar] [CrossRef]
  29. Qiu, H.; Zhang, H.; Lei, K.; Hu, X.; Yang, T.; Jiang, X. A New Tree-Level Multi-Objective Forest Harvest Model (MO-PSO): Integrating Neighborhood Indices and PSO Algorithm to Improve the Optimization Effect of Spatial Structure. Forests 2023, 14, 441. [Google Scholar] [CrossRef]
  30. Jia, N.; Guo, L.; Wang, R.; Liu, J. Design of Vibration and Noise Reduction for Ultra-Thin Cemented Carbide Circular Saw Blades in Woodworking Based on Multi-Objective Optimization. Forests 2024, 15, 1554. [Google Scholar] [CrossRef]
  31. Tong, H. Distributed least squares prediction for functional linear regression. Inverse Probl. 2021, 38, 025002. [Google Scholar] [CrossRef]
  32. Esposito, R.; Cerrato, M.; Locatelli, M. Partitioned least squares. Mach. Learn. 2024, 113, 6839–6869. [Google Scholar] [CrossRef]
  33. Liu, Y.; Jiang, R.C.; Li, X.; Song, F.J.; Liu, D.W. Multi-objective optimization of the low-speed electric vehicle frame based on the surrogate model. J. Mach. Des. 2020, 37, 105–109. [Google Scholar]
  34. Wang, T.; Wang, L.; Wang, C.; Zou, X. Crashworthiness analysis and multi-objective optimization of a commercial vehicle frame: A mixed meta-modeling-based method. Adv. Mech. Eng. 2018, 10, 1687814018778480. [Google Scholar] [CrossRef]
  35. Bao, X.; Han, F.; Ling, Q.H.; Ren, Y.Q. A multi-instance multi-label learning algorithm based on radial basis functions and multi-objective particle swarm optimization. Intell. Data Anal. 2023, 27, 1681–1698. [Google Scholar] [CrossRef]
  36. Kien, D.N.; Zhuang, X. Radial basis function based finite element method: Formulation and applications. Eng. Anal. Bound. Elem. 2023, 152, 455–472. [Google Scholar] [CrossRef]
  37. Chen, C.H.; Zhu, Y.F.; Yao, Y.; Huang, Y. The finite element model research of the pre-twisted thin-walled beam. Struct. Eng. Mech. Int. J. 2016, 57, 389–402. [Google Scholar] [CrossRef]
  38. Lewiński, J.; Magnucki, K. Optimization of anti-symmetrical open cross-sections of cold-formed thin-walled beams. J. Theor. Appl. Mech. 2009, 47, 553–571. [Google Scholar]
  39. Griso, G. Decomposition of the displacements of thin-walled beams with rectangular cross-section. Math. Methods Appl. Sci. 2024, 47, 5975–5998. [Google Scholar] [CrossRef]
  40. Kim, S.W.; Song, J.W.; Hong, J.P.; Kim, H.J.; Kang, J.H. Finite Element Analysis and Validation of Wind Turbine Bearings. Energies 2024, 17, 692. [Google Scholar] [CrossRef]
  41. Fröhlich, B.; Gade, J.; Geiger, F.; Bischoff, M.; Eberhard, P. Geometric element parameterization and parametric model order reduction in finite element based shape optimization. Comput. Mech. 2019, 63, 853–868. [Google Scholar] [CrossRef]
  42. Wang, F.; Li, Y.; Han, K.; Feng, Y.T. A general finite element model for numerical simulation of structure dynamics. Sci. China Ser. G Phys. Mech. Astron. 2006, 49, 440–450. [Google Scholar] [CrossRef]
  43. He, R. Lightweight Design of Frame Structure Based on Multi-discipline and Multi-Objective. Noise Vib. Control 2022, 42, 173. [Google Scholar]
  44. Liu, W.W.; Liu, J. Mechanical Analysis and Experiment on Frame of Wide-body Dump Truck under the Conditions of Starting and Braking. J. Beihua Univ. (Nat. Sci. Ed.) 2022, 23, 403–407. [Google Scholar]
  45. Zhao, H.J. Research on Lightweight of Pure Electric Unmanned Collector Vehicle Frame Based on Sensitivity Analysis. Master’s Thesis, Yancheng Institute of Technology, Yancheng, China, 2023. [Google Scholar]
  46. Hou, J.J.; Wang, Y.; Zhong, Y.D.; Zhao, D.F.; He, W.B.; Zhou, F. Lightweight design of body in white structure based on adaptive response surface method. Sci. Technol. Eng. 2019, 24, 3416–3425. [Google Scholar]
  47. Shi, H.; Zhang, X.; Gao, Y.; Wang, S.; Ning, Y. Robust Total Least Squares Estimation Method for Uncertain Linear Regression Model. Mathematics 2023, 11, 4354. [Google Scholar] [CrossRef]
  48. Xiao, J.; Wang, Y.D.; Liu, X.M.; Zhang, Z.P. Multi-Condition Aerodynamic Optimization of the Air Compressor Impeller Used in Fuel-Cell Vehicles. J. Xi’an Jiaotong Univ. 2021, 55, 39–48. [Google Scholar]
  49. Sun, X.L.; Wang, D.F.; Rong, B.; Li, B. Applying Response Surface Method to Multi-objective Optimization of Automobile′s Side Structure. Mech. Sci. Technol. Aerosp. Eng. 2022, 41, 1039–1047. [Google Scholar]
  50. Ren, W.X.; Chen, H.B. Finite element model updating in structural dynamics by using the response surface method. Eng. Struct. 2010, 32, 2455–2465. [Google Scholar] [CrossRef]
  51. Mohan, S.C.; Maiti, D.K. Structural optimization of rotating disk using response surface equation and genetic algorithm. Int. J. Comput. Methods Eng. Sci. Mech. 2013, 14, 124–132. [Google Scholar] [CrossRef]
  52. Wang, S.; Wang, D. Crashworthiness-based multi-objective integrated optimization of electric vehicle chassis frame. Arch. Civ. Mech. Eng. 2021, 21, 103. [Google Scholar] [CrossRef]
  53. Nazerian, M.; Naderi, F.; Partovinia, A.; Papadopoulos, A.N.; Younesi-Kordkheili, H. Modeling the bending strength of MDF faced, polyurethane foam-cored sandwich panels using response surface methodology (RSM) and artificial neural network (ANN). Forests 2021, 12, 1514. [Google Scholar] [CrossRef]
  54. Xu, M.; Wang, Z.; Li, Z.; Sun, Z.; Shang, L.; Tian, G.; Ma, J.; Liu, X.E. The Optimization of the Steam-Heat-Treated Process of Rattan (Calamus simplicifolius) Based on the Response Surface Analysis and Its Chemical Changes. Forests 2024, 15, 615. [Google Scholar] [CrossRef]
  55. Li, Y.H.; Li, D.M.; Gong, Q.; Wu, Y.X. Multi-objective reliability optimization design of motor hanger for EMU. Mech. Sci. Technol. Mach. 2021, 40, 1100–1105. [Google Scholar]
  56. Ke, J.; Zu, H.F.; Shi, W.K. Multi-objective Optimization Method of thrust rod ball Joint Based on Finite Element Method and Genetic Algorithm. Automot. Eng. 2019, 42, 178–183. [Google Scholar]
Figure 1. Technical route.
Forests 16 00069 g001
Figure 2. Geometry model of the triaxial unmanned vehicle frame.
Forests 16 00069 g002
Figure 3. Finite element model of the triaxial unmanned vehicle frame.
Forests 16 00069 g003
Figure 4. Constraints under full-load bending condition.
Forests 16 00069 g004
Figure 5. Stress cloud diagram under full-load bending condition.
Forests 16 00069 g005
Figure 6. Displacement cloud diagram under full-load bending condition.
Forests 16 00069 g006
Figure 7. Constraints under full-load torsional condition.
Forests 16 00069 g007
Figure 8. Stress cloud diagram under full-load torsional condition.
Forests 16 00069 g008
Figure 9. Displacement cloud diagram under full-load torsional condition.
Forests 16 00069 g009
Figure 10. Mode shapes of the first six modes of the frame. (a) First-order mode shape; (b) second-order mode shape; (c) third-order mode shape; (d) fourth-order mode shape; (e) fifth-order mode shape; (f) sixth-order mode shape.
Forests 16 00069 g010
Figure 11. Diagram of the strain gauge structure.
Forests 16 00069 g011
Figure 12. Bending and torsional testing of the frame. (a) Bending test; (b) torsion test.
Forests 16 00069 g012
Figure 13. Frame modal testing setup.
Forests 16 00069 g013
Figure 14. Frequency response function curve of the frame modal analysis.
Forests 16 00069 g014
Figure 15. Relative sensitivity analysis results. (a) Relative sensitivity of frame bending stiffness; (b) relative sensitivity of frame torsional stiffness; (c) relative sensitivity of frame first-order frequency.
Forests 16 00069 g015aForests 16 00069 g015b
Figure 16. Sampling from the modified expandable lattice sequence method.
Forests 16 00069 g016
Figure 17. Precision verification of the surrogate model. (a) Frame mass; (b) frame first-order modal frequency; (c) maximum bending stress; (d) maximum torsional stress.
Forests 16 00069 g017aForests 16 00069 g017b
Figure 18. Response surfaces for frame mass, first mode frequency, maximum bending stress, and maximum torsional stress. (a) Mass response surface; (b) first-order frequency response surface; (c) maximum bending stress response surface; (d) maximum torsional stress response surface.
Forests 16 00069 g018
Figure 19. MOGA computation process.
Forests 16 00069 g019
Figure 20. Pareto front for mass, first mode frequency, and maximum bending stress.
Forests 16 00069 g020
Figure 21. Pareto front for mass, first mode frequency, and maximum torsional stress.
Forests 16 00069 g021
Figure 22. Optimized Stress Cloud Diagram for Full-Load Bending Condition.
Forests 16 00069 g022
Figure 23. Optimized stress cloud diagram for full-load torsional condition.
Forests 16 00069 g023
Table 1. Material parameters.
MaterialsDensity (g/cm3)Modulus of Elasticity (E/GPa)Poisson’s Ratio μYield Strength (MPa)
7A58AL2.7868.90.33345
Table 2. Finite element mesh quality check.
Inspection ItemInspection StandardWeighting Ratio (%)
Aspect Ratio<5100.0%
Jacobin>0.799.9%
Taper<0.599.9%
Warpage<5100.0%
Skew<60100.0%
Angle45–13599.9%
Table 3. First six mode frequencies of the frame.
Modal OrderFrequencyMode Shape
First-Order Mode80.9 HzTorsional Mode
Second-Order Mode89.5 HzCombined Bending and Local Swing Mode
Third-Order Mode112.5 HzLocal Swing Mode
Fourth-Order Mode121.1 HzBending Mode
Fifth-Order Mode137.9 HzCombined Torsional and Local Swing Mode
Sixth-Order Mode145.7 HzCombined Bending and Torsional Mode
Table 4. Comparison of simulation and experimental values for bending condition.
Bending ConditionMeasurement
Point 1
Measurement
Point 2
Measurement
Point 3
Simulated ValueTrue ValueError
Rate
Simulated ValueTrue
Value
Error
Rate
Simulated ValueTrue
Value
Error
Rate
500 N1.090.993.8%1.061.015.0%0.980.935.4%
1000 N2.172.084.3%2.122.053.4%1.961.93.2%
1500 N3.263.172.8%3.193.151.3%2.952.882.4%
2000 N4.354.223.1%4.254.171.9%3.933.813.1%
2500 N5.435.282.8%5.315.182.5%4.914.821.9%
Table 5. Comparison of Simulation and Experimental Values for Torsional Condition.
Torsion ConditionMeasurement
Point 1
Measurement
Point 2
Measurement
Point 3
Simulated ValueTrue ValueError
Rate
Simulated ValueTrue ValueError
Rate
Simulated ValueTrue ValueError
Rate
500 N mm2.962.834.6%3.313.155.1%2.612.494.8%
1000 N mm5.915.713.5%6.636.492.2%5.224.965.2%
1500 N mm8.878.573.5%9.949.682.7%7.837.632.6%
2000 N mm11.8211.374.0%13.2512.932.5%10.4410.271.7%
2500 N mm14.7814.293.4%16.5716.182.4%13.0612.762.4%
Table 6. Comparison of simulation and experimental values for modal frequencies.
Modal OrderSimulated Frequency/HzExperimental Frequency/HzRelative Error
First-Order Mode80.978.53.1%
Second-Order Mode89.592.22.9%
Third-Order Mode112.5114.21.5%
Fourth-Order Mode121.1125.23.3%
Fifth-Order Mode137.9136.01.4%
Sixth-Order Mode145.7147.00.9%
Table 7. Sensitivity analysis results.
Serial NumberQualityBending StiffnessTorsional StiffnessFirst-Order FrequencySerial NumberQualityBending StiffnessTorsional StiffnessFirst-Order Frequency
num15.67 × 10−4−1.58 × 10−41.09 × 10−23.79 × 10⁻⁸num243.89 × 10−4−5.98 × 10⁻⁴−1.16 × 10⁻²−1.22 × 10⁻⁶
num25.67 × 10−4−5.47 × 10−73.32 × 10−24.85 × 10⁻⁸num257.94 × 10−4−1.69 × 10⁻³−1.25 × 10⁻²−1.02 × 10⁻⁷
num35.67 × 10−4−8.34 × 10−51.67 × 10−23.24 × 10⁻⁸num267.94 × 10−4−1.58 × 10⁻³−2.22 × 10−24.89 × 10−8
num45.22 × 10−4−1.63 × 10−52.35 × 10−2−1.16 × 10⁻⁶num274.16 × 10−4−1.24 × 10⁻⁵−1.21 × 10⁻²−1.23 × 10⁻⁶
num55.22 × 10−4−1.58 × 10−63.62 × 10−2−1.53 × 10⁻⁶num289.06 × 10−4−9.35 × 10⁻²−3.00 × 10⁻³−2.44 × 10⁻⁶
num61.85 × 10−3−1.89 × 10⁻²−1.46 × 10−11.18 × 10−7num294.20 × 10−4−3.05 × 10−28.24 × 10−4−1.14 × 10⁻⁶
num71.85 × 10−3−1.88 × 10⁻²−6.84 × 10⁻²−1.68 × 10⁻⁷num304.20 × 10−4−3.51 × 10⁻²−8.05 × 10⁻⁴−1.26 × 10⁻⁶
num84.79 × 10−4−4.93 × 10⁻⁴−8.33 × 10⁻²−8.58 × 10⁻⁷num315.22 × 10−4−3.20 × 10⁻⁴−1.27 × 10⁻²−2.00 × 10⁻⁶
num94.79 × 10−4−3.93 × 10⁻⁴−3.91 × 10⁻²−7.27 × 10⁻⁷num327.94 × 10−4−3.89 × 10⁻³−4.32 × 10−35.83 × 10−8
num104.73 × 10−4−7.37 × 10⁻⁶−1.11 × 10⁻²−8.68 × 10⁻⁷num334.16 × 10−4−1.79 × 10⁻²−6.36 × 10⁻⁵−1.90 × 10⁻⁶
num114.73 × 10−4−6.25 × 10⁻⁶−5.65 × 10⁻³−8.54 × 10⁻⁷num347.94 × 10−4−4.09 × 10⁻³−3.68 × 10−32.47 × 10−8
num124.86 × 10−4−6.86 × 10⁻⁶−1.63 × 10⁻²−6.57 × 10⁻⁷num354.59 × 10−4−3.83 × 10⁻⁴−1.54 × 10⁻³−9.78 × 10⁻⁷
num134.86 × 10−4−6.29 × 10⁻⁶−1.59 × 10⁻²−7.56 × 10⁻⁷num364.59 × 10−4−3.84 × 10⁻⁴−1.59 × 10⁻³−1.11 × 10⁻⁶
num142.37 × 10−42.08 × 10⁻⁴−9.79 × 10⁻⁴−3.97 × 10⁻⁷num374.59 × 10−4−1.83 × 10⁻³−3.51 × 10⁻³−1.46 × 10⁻⁶
num155.11 × 10−4−2.29 × 10⁻³−1.33 × 10⁻²−9.09 × 10⁻⁷num384.59 × 10−4−1.86 × 10⁻³−3.40 × 10⁻³−1.59 × 10⁻⁶
num162.37 × 10−4−2.39 × 10⁻³−6.22 × 10⁻³−4.12 × 10⁻⁷num395.22 × 10−4−5.87 × 10⁻⁴−3.86 × 10⁻³−2.66 × 10⁻⁶
num175.22 × 10−4−7.13 × 10⁻⁵−5.27 × 10⁻²−1.35 × 10⁻⁶num405.67 × 10−4−5.90 × 10⁻⁴−1.11 × 10−34.47 × 10−8
num187.94 × 10−4−1.88 × 10⁻³−6.79 × 10−26.26 × 10−8num415.22 × 10−4−1.82 × 10⁻⁴−9.62 × 10⁻⁴−3.03 × 10⁻⁶
num197.94 × 10−4−1.54 × 10⁻³−4.83 × 10⁻²−2.94 × 10⁻⁸num425.67 × 10−4−5.75 × 10⁻⁴−1.07 × 10−35.64 × 10−8
num204.16 × 10−4−2.33 × 10⁻²−6.54 × 10⁻³−1.31 × 10⁻⁶num435.67 × 10−4−4.16 × 10⁻⁵−1.11 × 10⁻³−5.30 × 10⁻⁸
num218.69 × 10−4−1.51 × 10⁻⁴−2.03 × 10⁻²−6.87 × 10⁻⁸num444.97 × 10−4−1.70 × 10⁻³−7.46 × 10⁻⁵−1.75 × 10⁻⁶
num228.69 × 10−4−1.56 × 10⁻⁴−2.13 × 10−24.59 × 10−8num452.30 × 10−4−1.86 × 10⁻³−9.58 × 10⁻⁵−7.47 × 10⁻⁷
num233.89 × 10−4−5.29 × 10⁻⁴−1.68 × 10⁻²−1.24 × 10⁻⁶num462.30 × 10−41.81 × 10⁻⁴−1.14 × 10⁻⁴−8.30 × 10⁻⁷
Table 8. Range of design variables for thin-walled beams.
Unit: mm
Design VariableInitial ValueLower LimitUpper LimitDesign VariableInitial ValueLower LimitUpper Limit
num1537num25537
num2537num26537
num3537num28537
num6537num29537
num7537num30537
num8537num32537
num9537num34537
num10537num40537
num11537num41537
num14537num42537
num21537num43537
num22537
Table 9. Coefficient of determination R2.
Design VariableResponse TypeR2
Frame   Mass   m RBF0.9962576
1 st   Mode   Frequency   f RBF0.9795060
Maximum   Bending   Stress   σ m a x LSR0.9936960
Maximum   Torsional   Stress   σ m a x LSR0.9600508
Table 10. Optimized structural parameters.
Unit: mm
Design VariableInitial
Value
Optimized ValueDesign VariableInitial
Value
Optimized Value
num154.7num2553.7
num254.4num2653.2
num354.2num2855.0
num654.1num2954.7
num754.0num3053.9
num855.6num3253.3
num956.2num3453.4
num1053.6num4053.0
num1156.2num4154.9
num1453.1num4255.6
num2153.0num4354.5
num2253.2
Table 11. Comparison of frame performance before and after optimization.
Design VariableBefore
Optimization
After Optimization
Frame   Mass   m /kg135.8 kg125.7 kg
1st Mode Frequency f /Hz80.8 Hz76.3 Hz
Bending σ m a x /MPa69.30 MPa73.69 MPa
Torsion σ m a x /MPa189.2 MPa194.0 MPa
Disclaimer/Publisher’s Note: The statements, opinions and data contained in all publications are solely those of the individual author(s) and contributor(s) and not of MDPI and/or the editor(s). MDPI and/or the editor(s) disclaim responsibility for any injury to people or property resulting from any ideas, methods, instructions or products referred to in the content.