Abstract
Wildfires are a recurrent and intensifying natural hazard in Mediterranean regions like Greece, driven by prolonged heatwaves, evolving climatic conditions, and human activities. This study leverages Sentinel-2 satellite imagery and Copernicus geospatial data to assess four early-season wildfire events during May and June 2024, which collectively affected 43.44 km2. Burn severity, land cover, and tree cover density were analyzed to evaluate the spatial and environmental impacts of these fires. Validation against Copernicus Emergency Management Service (CEMS) data yielded an overall accuracy of 95.79%, confirming the reliability of the methodology. The Achaia-Ilia wildfire, spanning 40.55 km2, exhibited the highest severity, with 26.93% classified as moderate to high severity. Smaller fires, such as Katsimidi (0.66 km2) and Stamata (1.41 km2), revealed the influence of vegetation type and density on fire dynamics, with Stamata’s sparse tree cover mitigating fire spread. The findings highlight the utility of remote sensing technologies for wildfire monitoring, and underscore the need for tailored management strategies, from vegetation control to urban planning, to enhance ecosystem resilience and mitigate wildfire risks in Mediterranean landscapes.
1. Introduction
Wildfires are a catastrophic phenomenon with profound impacts on environmental structure, atmospheric composition, human livelihoods, and public health. These events are responsible for burning vast areas each year. Between 2001 and 2018, the annual global wildfire burned area estimates ranged between 394 and 519 million ha, averaging approximately 463 million ha per year. Some of the most affected regions include Mediterranean Europe, North America, and Australia, with the latter’s northern tropical savanna contributing significantly to global burned area, as approximately 0.48 million square kilometers are affected by fires annually [1]. In the European Union alone, wildfires destroyed over 500,000 ha in 2023 [2]. The economic consequences of these events can be severe, as seen in the case of the 2017 wildfire in Vesuvius National Park, which burned for nearly 50 days and resulted in an estimated financial loss of EUR 14.363 million. Of this total, 56.9% was attributed to losses in ecological services, 34.7% to maintenance and regulation services, and 8.5% to cultural services, underscoring the multifaceted economic impact of wildfires beyond direct property damage [3].
Beyond economic losses, wildfires significantly contribute to atmospheric pollution, releasing vast amounts of greenhouse gases and harmful aerosols. In Greece, wildfire-related CO2 emissions have experienced a dramatic increase, rising from 755,824 t in 2004 to 5,179,920 t in 2024, marking a relative change of +585% [4]. This surge in emissions exacerbates climate change and air quality deterioration. Additionally, wildfire smoke contains hazardous pollutants such as fine particulate matter (PM2.5), carbon monoxide (CO), and volatile organic compounds (VOCs), which pose severe health risks. Exposure to wildfire smoke has been associated with increased all-cause mortality, long-term lung function impairment, and the onset of asthma, highlighting the urgent need for effective mitigation strategies [5].
The interplay between climate change and wildfires is further accelerating these impacts. The frequency and severity of wildfires have intensified in recent decades due to rising global temperatures, increased drought conditions, and shifts in precipitation patterns [6]. As Mediterranean countries remain particularly vulnerable to climate-driven wildfires, improving fire prediction and management remains an essential research priority.
The forests play a critical role in maintaining ecosystem health; they absorb carbon dioxide and release oxygen, regulating atmospheric composition and supporting global climate balance. These ecosystems provide essential services such as maintaining hydrological cycles, reducing soil erosion, and sustaining biodiversity by offering habitats for countless species [7].
Forests and other natural ecosystems play a crucial role in enhancing environmental resilience against extreme climatic events. In addition to regulating atmospheric composition and sustaining biodiversity, healthy ecosystems act as natural buffers against disasters, mitigating the intensity and frequency of wildfires, floods, and droughts. Dense forest cover helps retain moisture in the soil, reducing the likelihood of severe drought conditions that exacerbate fire risk. Furthermore, intact ecosystems facilitate faster post-disturbance recovery by promoting natural regeneration processes, stabilizing landscapes, and preventing further land degradation [8,9].
The frequency and intensity of wildfires are on the rise, resulting in severe socioeconomic repercussions [10,11]. In Greece, very high temperatures during the summer, combined with human activities and changes in land use, contribute significantly to this growing problem. Recent trends indicate that heatwaves have become more frequent and intense, exacerbating drought conditions and increasing wildfires susceptibility. For instance, during the summer of 2023, Greece experienced multiple extreme heat events, with temperatures exceeding 45 °C in several regions. These prolonged heatwaves, coupled with dry conditions, led to devastating wildfires, including the Evros fire, which became the largest recorded in Europe since 2000, burning thousands of ha of forest land and threatening biodiversity hotspots such as the Dadia National Park [6]. According to Copernicus Climate Change data, the summer of 2024 was one of the warmest on record in Europe, with Greece experiencing numerous wildfires [10,12,13]. These fires pose a substantial threat to ecosystems, with the potential to devastate landscapes, biodiversity, wetlands, vegetation and air quality [6]. Between 2000 and 2018, approximately 44% of Europe’s land cover consisted of forests, while 32% was dominated by shrubs and herbaceous vegetation. These fire-prone ecosystems are highly susceptible to wildfire damage, particularly under the influence of prolonged droughts and rising temperatures, which increase fuel availability and raise a dire spread risk [8].
The vulnerability of the planet is evidenced by the challenge to restore vegetation, rebuild after the destruction of buildings, and restructure the composition of air quality. These efforts are often hindered by persistent drought conditions or subsequent heatwaves, which increase the likelihood of recurring fires [14,15]. During the summer months, the climatic conditions in fire-prone regions are particularly unfavorable for plant growth, characterized by drought, low humidity and dry herbaceous vegetation, which massively raise the risk of fire. The combination of hot, dry and windy conditions is a critical driver of the rapid expansion and intensity of wildfires [16].
Despite the absence of a unified forest policy within the European Union [17], individual member states have developed distinct legislative frameworks to mitigate fire risks and manage forested areas. In Greece, the Constitution of 1975, along with Laws 86/1969, 998/1979, and 1650/1986, forms the cornerstone of forest protection and management. For instance, Article 24 of the Constitution explicitly safeguards forested areas, while Law 998/1979 prohibits agricultural burning near forests between May and October, a period of heightened fire risk. Similar measures are observed in other Mediterranean countries. In Spain, fire management responsibilities are decentralized across autonomous regions, with fire seasons typically lasting from June to October [18,19]. Italy’s Forest Fire Framework Law (No. 353/2000) assigns fire prevention to regional authorities while the State supports fire suppression with aerial resources [20]. Such variability underscores the localized nature of wildfire management, highlighting the importance of integrating advanced monitoring tools to complement these legislative efforts.
Nearly half if the land cover of Greece (49.5%) consists of forests and woodlands; there is an estimated amount of 6.532 million ha of this land type in the whole region [21]. One of the most destructive wildfires in recent history occurred in August 2023, burning approximately 90,000 ha. This event was particularly devastating, affecting up to 58% of the protected Natura 2000 area within the Dadia Forest in Evros. Wildfire smoke poses significant risks to both human health and the environment, as it can travel long distances, dispersing hazardous pollutants. The burned area resulting from this fire was approximately three times the annual average burnt area recorded between 2000 and 2008 [6]. The fires are associated with significant social and economic challenges, particularly for financially vulnerable populations.
Remote Sensing is critically important for analyzing natural disasters and monitoring environmental changes on the planet. Satellites play an important role in the detection and monitoring of these events, providing essential data for assessing their extent and impact [22,23]. This information enables authorities to manage natural disasters such as floods, wildfires, seismic activity, volcanoes or glacier dynamics more effectively [24,25,26]. In the context of wildfires, spectral data from satellite pixels representing burn scars are processed and combined to differentiate BA (burned area) from vegetation effectively [27].
BA detection has been effectively conducted using Sentinel-2 satellites, which offers high spatial resolution and is particularly efficient for capturing detailed topographical features, even in small burned areas with sizes less than 100 ha [28,29]. During fire-prone summer seasons, pre- and post-fire satellite data are essential for evaluating burn severity, often employing the United States Geological Survey (USGS) classification system [22]. The mapping of BA relies on a variety of methodologies and geospatial technologies, with the most widely used indices including the Normalized Burn Ratio (NBR) and the Normalized Difference Water Index (NDWI), which enhance the accuracy of analyses [30].
Recent advances in remote sensing have significantly improved wildfire detection and monitoring, particularly with the advent of Sentinel-2 data from the Copernicus program. Previous studies have demonstrated the effectiveness of using Sentinel-2 in wildfire mapping, burn severity assessment, and post-fire vegetation recovery analysis, relying on spectral indices such as the Normalized Burn Ratio (NBR) and its derivatives, including the differenced Normalized Burn Ratio (dNBR) and the Relativized Burn Ratio (RBR) [31,32]. However, most existing research has primarily focused on large-scale or long-duration wildfires, with limited attention given to early-season events. Additionally, while many studies validate burn severity using field surveys or auxiliary datasets, fewer have evaluated the accuracy of Sentinel-2 data used for wildfire monitoring by directly comparing results with those of operational emergency response systems, such as the Copernicus Emergency Management Service (CEMS).
This study seeks to address these gaps by focusing on the early-season wildfires of May and June 2024 in Greece, a period wherein the fire risk increases but remains underexplored in existing research. By integrating Sentinel-2 imagery with CEMS validation data, this work provides an in-depth analysis of burn severity, land cover impacts, and tree cover density. Unlike in previous research, this study specifically examines the relationship between burn severity and pre-fire land cover characteristics using high-resolution satellite data, offering insights that can contribute to improved fire risk assessment and management strategies in Mediterranean environments.
Given the increasing frequency and severity of wildfires in Greece, particularly in early summer, this study aims to provide a detailed assessment of four wildfire events that occurred in May and June 2024. The research employs Sentinel-2 satellite imagery, processed using the Sentinel Application Platform v. 9 (SNAP) and ArcGIS v. 10.8, to analyze burn severity, land cover changes, and tree cover density. The integration of CEMS data further enhances the validation process, ensuring a robust evaluation of fire-affected areas. By addressing these aspects, this study contributes to the growing body of knowledge on wildfire monitoring, and offers practical insights for improving fire management strategies in Mediterranean landscapes.
2. Materials and Methods
2.1. Study Area
During the 2024 summer season in Greece, numerous wildfires sparked across diverse regions. This study focuses on four significant early-season wildfires reported within the first two months (May and June) of this period (Figure 1). Although the research centers on these specific events, it is critical to acknowledge broader wildfire trends observed throughout the season up to the present date. Notably, data from the European Forest Fire Information System (EFFIS) of the European Space Agency’s (ESA) Copernicus program indicate that 74 forest fires had been recorded in Greece by 3 November 2024, marking an increase of 18 fire cases compared to the previous year, 2023 [33]. The cumulative burned area had by this point reached 40,997 ha (409.97 km2). EFFIS service tracks both intentional fires, often linked to agricultural and vegetation management, and unintentional ignitions [34].

Figure 1.
Study area and wildfire locations in Greece. (a) Overview map of Greece showing the locations of the four analyzed wildfires: Achaia-Ilia, Parnitha, Stamata, and Avenue Varis-Koropiou (red squares). (b) Zoomed-in regional map focusing on the concentration of wildfire events around Athens (red circles). (c) Contextual map of Europe highlighting the location of Greece within the broader geographical region.
On 19 June 2024, a wildfire ignited near Avenue Varis-Koropiou in Kitsi, South Attica, Greece, around midday. The flames spread rapidly towards nearby settlements, damaging multiple properties. The main causes of the fire’s spread were the local dry vegetation, the strong winds of the active period and the high summer temperatures of the Greek climate [34]. In order to protect the local population, authorities closed several sections of Varis-Koropiou to restrict access to high-risk zone. Additionally, the residential areas of Kitsi and Lamprika were evacuated as the fire approached these locations.
Despite its relatively small area of impact, the fire near Avenue Varis-Koropiou occurred in a critical location, adjacent to a main avenue connecting the areas of Vari and Koropi. This resulted in significant disruptions to regional traffic. Furthermore, several residences and local businesses in the vicinity of Koropi were either damaged or destroyed by the flames, adversely affecting the local community and economy. These factors highlight the importance of this wildfire, making it a pertinent case for analysis in the present study.
The second wildfire analyzed in this study occurred in the region of Achaia-Ilia in northwest Peloponnese, Greece. The fire started on Friday, 21 June 2024, in the afternoon, in the Mastrantonis village. The flames formed an active front 15 km wide, impacting multiple residential areas, including Agia Varvara, Kalfas and Apidoula, among others. The extreme rate of spread was primarily driven by strong winds, which reached between 12 and 28 km/h (3–4 Beaufort scale), with gusts reportedly reaching up to 120 km/h [35].
The wildfire caused extensive damage, destroying numerous buildings as it advanced through residential areas such as Stavrodromi, Skoura, Galaro, Rachi, Masoureika, Agia Varvara, Pantazeika, Panoutseika and Kalfa. Additionally, the fire had severe impacts on local wildlife populations and critical infrastructure. Due to the scale of this wildfire, the Copernicus Emergency Management Service Rapid Mapping (EMSR730) was activated to map out the affected area [36]. In an effort to prevent any human casualties, the local authorities proceeded with the systematic evacuation of multiple residential areas as the fire progressed.
On 29 June, a wildfire ignited in Parnitha, around 3 p.m. (local time), spreading rapidly across the area of Katsimidi. The high summer temperatures combined with strong winds significantly contributed to the fire’s rapid spread. According to the Fire Service, gusts exceeded 100 km/h, and were coupled with sustained winds of up to 50 km/h. As a result, the flames quickly spread through the forest of the National Park, threatening a catastrophic natural disaster. Although the wildfire in Parnitha was relatively limited in extent, its significance cannot be understated. The flames entered the National Park of Parnitha, threatening its unique flora and fauna, and its proximity to the residential areas of Katsimidi and neighboring regions posed a risk of human casualties. For these reasons, the wildfire was deemed of notable importance and included in this study.
The last wildfire analyzed in this study ignited on Sunday, 30 June 2024, around 4 p.m. (local time) in the Stamata region of eastern Attica. Due to powerful winds, reaching from 5–6 Bf to 7–8 Bf, paired with high summer temperatures, the fire was challenging to control, resulting in its rapid spread through the surrounding forested area. The wildfire caused significant damage as it moved into residential zones, destroying eight houses. Tragically, the fire also proved fatal, claiming the life of a 45-year-old man who suffered cardiac arrest, while another individual was hospitalized due to smoke inhalation. Evacuation alerts were issued for the residential areas of Amygdaleza, Rodopoli, and Galini to ensure the safety of the local population.
2.2. Weather Conditions
To better understand the conditions surrounding the four wildfire events, it was essential to access weather report records from the affected locations and compare them with the weather conditions on the respective events’ dates. For the area near Kitsi, close to the Avenue Varis-Koropiou fire, the average weather in June includes an average temperature of 26 °C and a maximum of 31 °C, with average wind speeds of 15 km/h. In contrast, June 2024 recorded an elevated monthly average temperature of 29 °C, reaching a maximum of 31 °C. On the day of the fire, temperatures ranged between 29 °C and 36 °C, significantly higher than average, with wind speeds fluctuating between 11 and 28 km/h [37].
Similarly, in the case of the Achaia-Ilia fire near Mastrantonis, historical data show an average temperature of 23 °C, with a maximum of 29 °C. However, in June 2024, the regional monthly average was 28 °C, with maximum temperature of 38 °C. On 21 June 2024, the day of the fire, temperatures in Mastrantonis ranged from 24 °C to 38 °C, markedly above average. Additionally, historical averages indicate wind speeds around 12 km/h in June for these areas, whereas on 21 June, winds reached up to 24 km/h, doubling the usual wind speed for that month [38]. These average climate estimates are based on data from 2012–2021 for the Kitsi region and from 1992–2021 for the area surrounding Mastrantonis.
Based on historical data from 2012 to 2021, the Parnitha region typically experiences an average mean temperature of 26 °C in June, with values ranging between 21 °C and 31 °C. Additionally, the average wind speed for June is approximately 15 km/h. In comparison, June 2024 recorded a higher average temperature of 29 °C, reaching a maximum of 37 °C. On the day and time of the fire, the temperature peaked at 32 °C, while wind speeds reached 24 km/h, both significantly exceeding the historical averages for the region [39].
For the Stamata region, historical data from 2012 to 2021 indicate an average mean temperature of 26 °C in June, with an average high of 31 °C, and wind speeds averaging around 15 km/h. However, in June 2024, the mean temperature rose to 29 °C, with values ranging between 19 °C and 37 °C, significantly exceeding the historical averages. On 30 June 2024, at the time the wildfire in Stamata ignited, the temperature was recorded at 32 °C, while wind speeds reached 24 km/h [40]. As evidenced by these values, in all cases, the fires occurred on days with significantly higher temperatures and stronger winds compared to the historical averages for June in their respective regions. These unusually warm and windy conditions greatly increased the difficulty for fire brigades to control and contain the rapidly spreading flames.
2.3. Data Used
This study utilizes openly accessible, open-source data to achieve its research objectives. Specifically, Copernicus Sentinel-2 optical satellite data and geospatial information on land use were employed. These datasets were collected and processed using advanced techniques to evaluate the burn severity and characterize the affected zones in the study areas. Notably, the data utilized in this research, presented in Table 1, are freely available to the public through the Copernicus platforms.

Table 1.
Exploited data.
For each wildfire under study, two satellite images were collected; one captured before the fire (pre-fire) and another after the event (post-fire). These images were selected to be as temporally close to the fire events as possible, ensuring minimal cloud cover for optimal accuracy during processing. Specifically, the fire of the Avenue Varis-Koropiou was studied using a pre-fire image captured on 18 June 2024 and a post-fire image on 28 June 2024. Similarly, the Achaia-Ilia fire was studied using a pre-fire image dated from 16 June 2024 and a post-fire image from 26 June 2024. The Katsimidi wildfire in Parnitha was analyzed using a pre-fire image captured on 23 June 2024 and a post-fire image from 8 July 2024. Similarly, the Stamata wildfire was studied with a pre-fire image dated 26 June 2024 and a post-fire image from 8 July 2024. The details of the wildfire events and the Sentinel-2 images used for processing can be seen in Table 2.
Table 2.
Sentinel-2 images for each area.
The optical multispectral satellite images of the Sentinel-2 mission, part of the European Space Agency’s (ESA) Copernicus program, were utilized to estimate and map the overall burned areas and assess the burn severity of the wildfires. The atmospherically corrected Level-2, Bottom-of-Atmosphere (BOA) data were acquired from the Dataspace Copernicus platform [41] (previously accessible from the Copernicus Open Access Hub). The Sentinel-2 data are particularly well-suited for the study of natural hazards like wildfires due to their short revisit period, providing new images of areas of interest every five days, and their high spatial resolution, reaching up to 10 m in select bands [42].
The land use and land cover information of the studied areas were obtained from CORINE Land Cover 2018 (CLC 2018) dataset, provided in vector polygon form (Table 1). This dataset was acquired from the Copernicus Land Monitoring Service platform of ESA [43]. The CLC 2018 data is publicly available and categorized into 44 primary land types. The dataset was utilized to identify the spatial distribution of land use within the burned areas, providing a high level of accuracy (≥85%) and cover a minimum area of 0.25 km2 (25 ha).
In this study, the Tree Cover Density (TCD) of the burnt areas was analysed using relevant data provided by the Copernicus program (Table 1). The TCD 2018 dataset quantifies tree cover density on a scale ranging from 0% (non-tree covered areas) to 100% (areas fully covered by trees). Similar to other dataset utilized in this research, the TCD 2018 data is openly accessible and provided by the ESA in raster format with a resolution of 10 m. cell size [44]. The accuracy of the TCD 2018 product has been internally validated before public release, ensuring its reliability. According to the TCD 2018 product user manual [45], the validation process is based on omission (user’s accuracy) and commission (producer’s accuracy) errors, with a target accuracy threshold above 90%. The metadata documentation for the 10 m dataset used in this study [46] reports an overall accuracy of 96.43% with a 95% confidence level, further reinforcing the robustness of this dataset for wildfire impact assessments.
The optical satellite data was processed using the SNAP v.9 software, a free tool licensed by ESA, to estimate the burn severity of the fires. After processing, the satellite-derived burn severity results, along with the CLC 2018 and TCD 2018 datasets, were visualized and analysed within a Geographic Information System (GIS) environment using the commercial software ArcGIS Desktop v. 10.8 provided by ESRI.
2.4. Methodology
The mapping of the wildfires was carried out using two atmospherically corrected Sentinel-2 L2A satellite images for each fire, one captured before and another after the event. These images were processed using the SNAP v. 9 and ArcGIS v. 10.8 Desktop software. The methodology employed is divided into two distinct phases. The first phase, preprocessing, involves preparing the satellite images for analysis, ensuring they are suitable for subsequent steps. The second phase, main processing, encompasses the calculation of relevant indices and the application of necessary corrections, culminating in the extraction of data required for generating the final maps [47]. The flowchart in Figure 2 provides a detailed overview of the methodological steps.
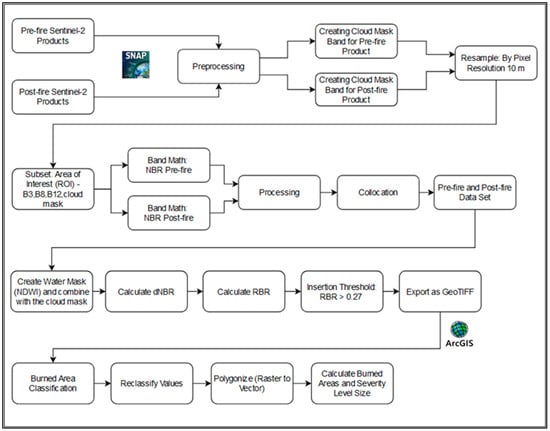
Figure 2.
Flowchart of the methodology applied for burned area classification and severity assessment. The process begins with the acquisition of pre-fire and post-fire Sentinel-2 products, followed by preprocessing in SNAP v. 9, leading to the creation of a pre- and post-fire dataset. The next stage involves defining the area of interest (ROI) and computing the Normalized Burn Ratio (NBR) for both pre-fire and post-fire images. The dataset is then processed and collocated to ensure spatial consistency. Subsequent steps include generating a water mask (NDWI) to refine burned area detection, computing the differenced Normalized Burn Ratio (dNBR) and Relativized Burn Ratio (RBR), and applying an RBR insertion threshold (>0.27) to classify burned areas. The results are exported as GeoTIFF files and analyzed in ArcGIS, v. 10.8 where burned areas are classified, severity values are reclassified, raster data is converted to vector polygons, and the final calculation of burned area extent and severity levels is performed.
The initial step, which is the preprocessing of the images, involves creating cloud masks using the Band Math tool in the SNAP v. 9 software. This is followed by resampling the images to a uniform spatial resolution of 10 m using the nearest neighbor method. Resampling is necessary because the spectral bands of Sentinel-2 images have different native resolutions, and standardizing them ensures consistency in subsequent analysis. Specifically, Bands 5 (vegetation red edge, 705 nm), 6 (vegetation red edge, 740 nm), 7 (vegetation red edge, 783 nm), 8A (narrow near-infrared, 865 nm), 11 (shortwave infrared, 1610 nm) and 12 (shortwave infrared, 2190 nm), which have native resolutions of 20 m, as well as Bands 1 (coastal aerosol, violet, 443 nm), 9 (water vapor, 945 nm), and 10 (shortwave infrared—cirrus, 1375 nm), which have native resolutions of 60 m, were resampled to 10 m resolution to match the higher-resolutions bands. After resampling, the images are clipped to the Region of Interest (ROI) using the Subset tool to improve processing efficiency. The preprocessing of the images is completed with the calculation of the Normalized Burn Ratio (NBR) index [48]. From the collocation step onward, the image processing phase begins, where both pre-fire and post-fire data are aligned and prepared for further analysis.
The SNAP-ESA v. 9 software, an open-source tool developed by the European Space Agency, is specifically designed for the processing of Sentinel satellite data [49]. This software was selected due to its accessibility, ease of use, and robust analytical capabilities. It was used for cloud masking, resampling, subsetting, and initial spectral index calculations. ArcGIS v. 10.8 was subsequently employed for spatial visualization and vector data manipulation. As a comprehensive Geographic Information System (GIS) environment, ArcGIS v. 10.8 facilitates precise geospatial mapping, classification, and the integration of multiple datasets [50]. The combined use of SNAP v. 9 and ArcGIS v. 10.8 ensured a streamlined workflow that optimized both data preprocessing and analysis.
The NBR index is used to identify and highlight burned areas across extensive zones. For its calculation, the near-infrared (NIR) and shortwave-infrared (SWIR) bands are used, according to the Equation (1) [51]:
The NBR index has a range of values from −1 to 1, with higher values indicating healthy vegetation, while lower values correspond to bare soil or recently burned areas [47,51,52,53,54]. The next step involves collocating the pre-fire and post-fire images to merge them into a single product for further analysis.
In certain cases, water bodies can show NBR differences similar to those of burned areas, making it essential to mask them out. Similarly, clouds present in any of the input images must also be removed to ensure accurate analysis. For this purpose, a single composite mask is created, combining both water and cloud masks. The Normalized Difference Water Index (NDWI) is applied and isolate water bodies [47,55].
By calculating the NBR values of pre-fire and post-fire images, the difference in NBR can then be determined. The dNBR index is instrumental is in identifying recently burned areas, as it differentiates them from areas with healthy vegetation. This index enables the assessment of fire intensity and its impact on the functionality of the affected ecosystem. The dNBR is calculated using Equation (2) [47]:
After calculating the dNBR index, the Relative Burn Ratio (RBR) is calculated using the Equation (3). The RBR enhances the accuracy of burn severity assessments and helps to identify post-fire changes in areas with low vegetation cover. The RBR results are masked using the previously generated composite mask for clouds and water bodies, ensuring that the data is free from potential cloud interference and that spectral characteristics of water surfaces, which might otherwise be misinterpreted as burned areas [47,56,57].
The selection of NBR, dNBR, and RBR for this study is based on their extensive application in wildfire mapping and assessment. The NBR index was initially evaluated in fire-prone environments, where it demonstrated limitations in differentiating post-fire conditions near the time of ignition [58]. To address these challenges, it was introduced dNBR, which enhances burn severity assessments by comparing pre-fire and post-fire spectral differences [59]. Further refinements led to the introduction of relativized dNBR, improving fire impact evaluations by normalizing pre-fire vegetation variability [60]. More recently, the RBR index was proposed, demonstrating superior performance in sparsely vegetated landscapes [61]. These indices have since been widely adopted for remote sensing-based fire assessments [31,62]. Their application in this study ensures consistency with established wildfire severity classification methodologies while allowing for a comprehensive analysis of fire impact across varied land cover types.
The final step involved importing the processed images into the ArcMap v. 10.8 software for reclassification of the results (Table 1). Based on the dNBR values, the United States Geological Survey (USGS) defines various burn severity categories. These thresholds are established through a combination of remote sensing data—specifically the Normalized Burn Ratio (NBR) from satellite imagery. The classification thresholds are refined through statistical analysis and may be adjusted depending on vegetation type and ecosystem characteristics.
Multispectral satellite data, particularly the NIR and SWIR bands, enhance the interpretation of burn severity by detecting variations in vegetation structure and soil exposure. Unburned areas typically exhibit very low or negative dNBR values (−0.1 to +0.1), indicating no fire impact. Low-severity areas (dNBR 0.1–0.27) correspond to minimal vegetation loss, where most plants remain alive. Moderate severity (dNBR 0.27–0.66) signifies substantial vegetation damage, often with exposed soil. High-severity areas (dNBR > 0.66) indicate extensive combustion, where vegetation is almost entirely consumed, leaving bare soil. Additionally, areas experiencing post-fire regrowth or originally sparse vegetation may display negative dNBR values, reflecting vegetation recovery or pre-existing low biomass [32].
Once the classification was completed, the raster data was converted into vector format to calculate the burned areas and delineate the final burned extent. Using the vectorized burned area data, the CORINE Land Cover (CLC) 2018 dataset and Tree Cover Density were isolated for the affected regions to assess the total damage.
It is important to note that the five burn severity classes were standardized across all study areas based on specific dNBR value ranges. As presented in Table 3, these classifications follow the United States Geological Survey (USGS) guidelines [63]. However, not all severity classes were present in every wildfire case, as the observed dNBR values did not always fall within the full range of classification thresholds. This was particularly evident for the highest burn severity categories, which were not detected in certain fire events. Additionally, unburned areas were not displayed in Figure 3, Figure 4, Figure 5 and Figure 6 to enhance the visibility of affected regions and better highlight variations in burn severity across the fire-impacted zones.
Table 3.
Burn Severity classification according to dNBR values [51].

Figure 3.
Achaia-Ilia wildfire burned areas and burn severity.
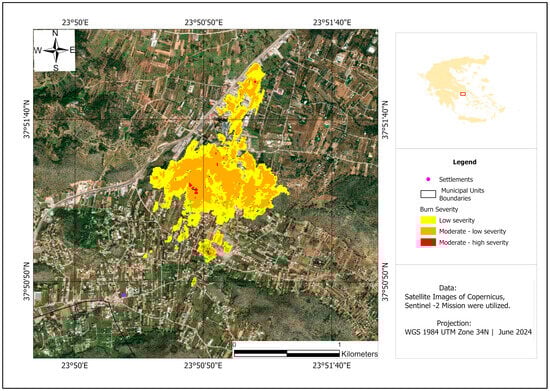
Figure 4.
Av. Varis-Koropiou wildfire burned areas and burn severity.

Figure 5.
Katsimidi–Parnitha wildfire burned areas and burn severity.
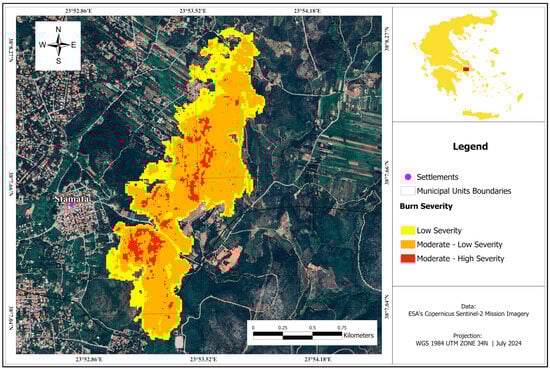
Figure 6.
Stamata wildfire burned areas and burn severity.
The validation of burn area estimations was performed by comparing the results to Copernicus Emergency Management Service (CEMS) datasets. The CEMS burned area products provide rapid mapping of fire-affected regions and have been widely used as reference datasets in remote sensing-based fire assessments [64,65,66]. Previous studies have employed an unsupervised classification approach with Sentinel-2 data and achieved high agreement with CEMS burn extent estimates [64]. Similar studies evaluated the applicability of CEMS products across different geographic regions, confirming their reliability and demonstrated that CEMS-derived estimates closely matched independent field observations, though the accuracy depended on the quality of input imagery used in rapid mapping [65,66]. Based on these findings, CEMS was chosen for validation due to its accessibility, operational significance, and consistency with Sentinel-2-based fire mapping.
The validation accuracy was determined as the percentage of overlap between our estimated burned area and the CEMS reported area, irrespective of whether the estimation overestimated or underestimated the true extent. If the study’s burn area estimates exceeded CEMS values, the validation accuracy was calculated as the CEMS reported area divided by the estimated area. Conversely, in cases of underestimation, accuracy was computed as the estimated area divided by the CEMS reported area. This method ensures an objective comparison and aligns with previous research that has adopted CEMS datasets for post-fire assessment [66].
3. Results
3.1. Burned Areas and Burn Severity
During the four wildfire events analysed in this research, the total burnt area of both fires was estimated to have reached 43.44 km2, as can be observed in Table 4. A comparison of the wildfires reveals that the event of 21 June in Mastrantonis (Achaia-Ilia) (Figure 3) caused vastly more extensive damage than the fire of 19 June near Avenue Varis-Koropiou near Kitsi (Figure 4). A similar pattern is observed when comparing the Achaia-Ilia fire with the fires in Katsimidi (Figure 5) and Stamata (Figure 6). Quantitatively, this can be observed in Table 4, where the Achaia-Ilia fire is shown to have affected an area of 40.55 km2, whereas the Kitsi fire burned 0.82 km2. Additionally, the fire in Katsimidi had the smallest total burned area, affecting 0.66 km2. In contrast, the Stamata fire was more extensive than both the Katsimidi and Koropi fires, with a total burned area of 1.41 km2, although it remained significantly smaller compared to the Achaia-Ilia wildfire. As described in the study area section, the Achaia-Ilia fire was far more challenging to control due to strong winds, which facilitated its rapid spread across multiple resident areas, thereby the fire of Achaia-Ilia proved far more difficult to contain compared to the one near Kitsi, as the powerful winds caused it to spread rapidly through multiple residential areas. Similarly, although strong winds hindered firefighting efforts during the Katsimidi and Stamata wildfires, the coordinated response of the fire brigade successfully contained the flames, preventing them from spreading to the extent observed in the Mastrantonis fire.
Table 4.
Main attributes of the analysed wildfires.
Comparing the total burned area of each case provides only a partial understanding of the events. A more detailed examination of the burn severity distribution within the affected areas (Table 5) offers valuable insights that may inform future wildfire prevention strategies and support the preservation of both natural and urban environments. Particularly, in the case of the Vari-Koropi fire, approximately 0.43 km2 (~52.18% of the affected area) exhibited low burn severity. An additional 0.39 km2 (47.33%) showed moderate to low burn severity, while only 0.004 km2 (~0.49%) was classified as having moderate to high severity. These results indicate that the burn severity of the Varis-Koropi fire was relatively low, with the affected area nearly evenly divided between low- and moderate- to-low-severity categories.
Table 5.
Avenue Varis-Koropiou and Achaia-Ilia burn severity statistics.
An analysis of the burn severity distribution under the Achaia-Ilia fire (Table 5) reveals that the majority of the affected area (40.39%) fits into the moderate-to-low-severity category, covering approximately 16.38 km2. This is followed by 13.25 km2 (32.68%) classifies as being of low burn severity. Lastly, although the smallest portion of the burned area corresponds to moderate to high burn severity, it is considerably more extensive compared to the Vari-Koropi fire. Specifically, 10.92 km2, or 26.93% of the affected area, is characterized by a moderate to high burn severity.
In the case of the Katsimidi fire on 29 June (Table 6), 0.10 km2 (15.51% of the affected area) exhibited low burn severity. The moderate to high burn severity category accounted for 0.24 km2, representing 36.36% of the burned area. However, the majority of the affected zone was classified as having moderate to low burn severity, covering 0.32 km2 or 48.48% of the total area. Unlike the fires in Kitsi and Achaia-Ilia, the Katsimidi wildfire showed a general trend towards higher burn severity, despite its relatively small burned area.
Table 6.
Katsimidi-Parnitha and Stamata burn severity statistics.
Similarly, the Stamata fire (Table 6) predominantly exhibited moderate to low burn severity, affecting 0.89 km2 or 63.12% of the burned area. Approximately 28.37% (0.40 km2) of the affected zone was classified as having low burn severity, while the remaining 8.51% (0.12 km2) fell into the moderate-to-high-severity category.
Based on these analyses, it becomes clear that the fire in Achaia-Ilia was not only more extensive, but also more severe than the Avenue Varis-Koropiou fire. Specifically, the Achaia-Ilia fire exhibited a burn severity trend favoring higher values, with the moderate to high category being the most prevalent. Additionally, it covered a significantly larger area of high burn severity compared to the Varus-Koropi fire. Similarly, in both the Katsimidi and Stamata fires, the moderate-to-low-burn-severity category was the most prevalent. However, the Katsimidi fire exhibited the highest average burn severity among these cases, primarily due to the moderate-to-high-severity category accounting for a larger proportion of the affected area compared to the other fires.
3.2. Land Cover of the Burned Area
The affected areas were classified into categories based on their land use, as identified through the CORINE Land Cover 2018 (CLC 2018) dataset obtained from Copernicus. This dataset provided detailed information on the types of land cover within the burned zones, enabling a comprehensive analysis of the impacted areas. The CLC categories assigned to each burned area, along with their corresponding CLC 2018 codes, are presented in Table 7 and Table 8.
Table 7.
Avenue Varis-Koropiou and Achaia-Ilia land cover statistics.
Table 8.
Katsimidi-Parnitha and Stamata land cover statistics.
By reviewing Table 7, the extent of the affected land cover and its percentage in relation to the total burned area for each wildfire can be assessed. Specifically, for the Avenue Varis-Koropiou wildfire (Figure 7), the most affected land cover category was Sclerophylous vegetation, which accounted for an area of 0.42 km2, slightly over half (51.22%) of the total burned area. Complex cultivation patterns were the second most prevalent land use type, representing 23.17% or 0.19 km2 of the affected zone. The remaining burned area was nearly evenly distributed between discontinuous urban fabric (0.11 km2, 13.41%) and industrial or commercial units and public facilities (0.10 km2, 12.20%).
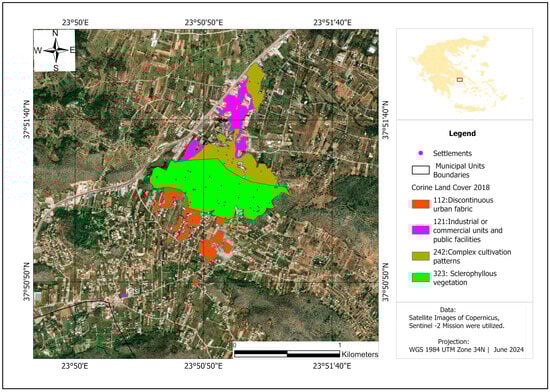
Figure 7.
Avenue Varis-Koropiou wildfire burned land cover.
The land cover affected by the Achaia-Ilia wildfire (Figure 8) exhibited a larger variety compared to the Varis-Koropiou fire. Specifically, 35.65% of the burned area, equivalent to 14.46 km2, consisted of land principally occupied by agriculture, with significant areas of natural vegetation, making it the most extensive category. Sclerophyllous vegetation was the second most impacted, covering 11.57 km2 or 28.53% of the burned area. Burned transitional woodland and shrubs covered an area of 6.23 km2, representing 15.36% of the affected zone. Additionally, complex cultivation patterns were affected at a proportion of 11.98% (4.86 km2) of the total burned area, while non-irrigated arable land represented 8.28% (3.36 km2). The remaining burned area consisted of coniferous forest (0.05 km2, 0.12%) and olive groves (0.03 km2, 0.07%).
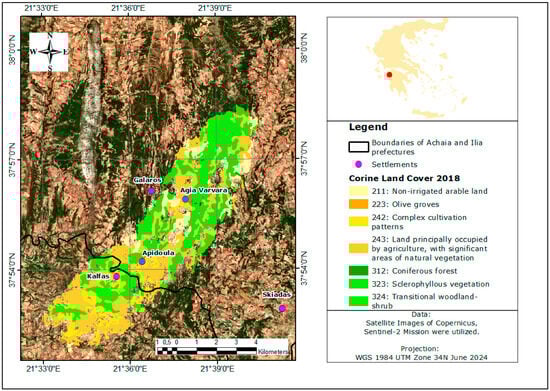
Figure 8.
Achaia-Ilia wildfire burned land cover.
The analysis of Table 8 highlights the CORINE Land Cover (CLC) categories affected by the fires in Katsimidi and Stamata. In the Katsimidi fire (Figure 9), only two land cover categories were identified within the burned area. Mixed forest accounted for slightly more than half of the affected zone, representing 56.06% (0.37 km2) of the total area. The remaining 43.94% (0.29 km2) corresponded to transitional woodland and shrubs. These results align with expectations, as part of the affected area lies within the National Park of Parnitha, which is characterized by its extensive forested landscape.
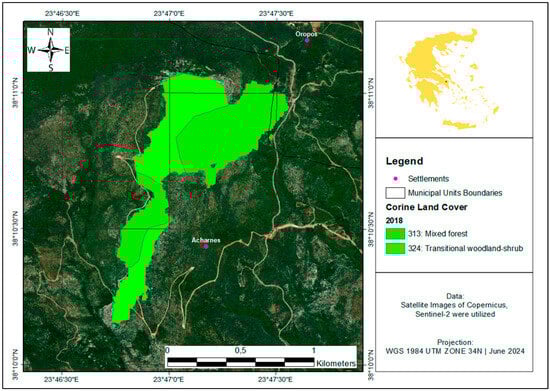
Figure 9.
Katsimidi-Parnitha wildfire burned land cover.
The wildfire in Stamata (Figure 10) affected a greater number of land cover categories compared to Katsimidi, resulting in higher diversity in land use within the burned area. The most prevalent CLC category was transitional woodland and shrubs, accounting for 62.41% (0.88 km2) of the affected zone. This was followed by sclerophyllous vegetation and land principally occupied by agriculture with significant areas of natural vegetation, which constituted 16.31% (0.23 km2) and 10.64% (0.15 km2) of the burned area, respectively. Additionally, complex cultivation patterns made up 9.22% (0.13 km2) of the affected area, while 1.42% (0.02 km2) was classified as discontinuous urban fabric.
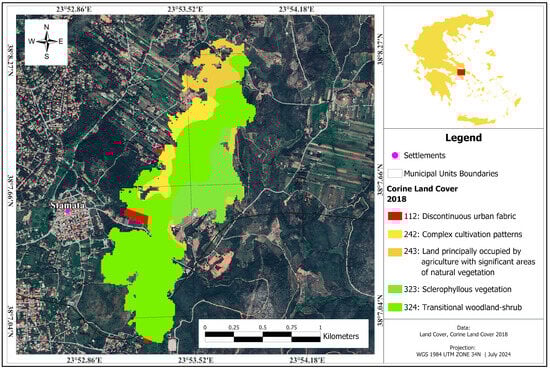
Figure 10.
Stamata wildfire burned land cover.
3.3. Tree Cover Density of the Burned Area
Using data from the CORINE Tree Cover Density 2018 (TCD 2018), an analysis was conducted to evaluate the tree cover density within the burned areas of each wildfire. Tree cover density is categorized into 10 classes based on the percentage of tree coverage, ranging from 1%–10% (indicating minimal tree presence) to 90%–100% (indicating full tree coverage). The TCD categories identified within the burned areas, along with the corresponding percentages of the total affected zones, are presented in Table 9 and Table 10.
Table 9.
Avenue Varis-Koropiou and Achaia-Ilia tree cover density statistics.
Table 10.
Katsimidi-Parnitha and Stamata tree cover density statistics.
Based on Table 9, most of the burned area for both the 19 June and 21 June wildfires was predominantly barren of trees, with a TCD of 1%–10%. Specifically, in the case of the Avenue Varis-Koropiou fire (Figure 11), nearly the entire burned area (99.49% or 0.82 km2) fell within this category. The remaining area was mostly covered by trees at a density of 20%–30%, accounting for just 0.49% or 0.004 km2. Additionally, a negligible 0.02% (0.0002 km2) of the affected area exhibited a TCD of the 10%–20% category.
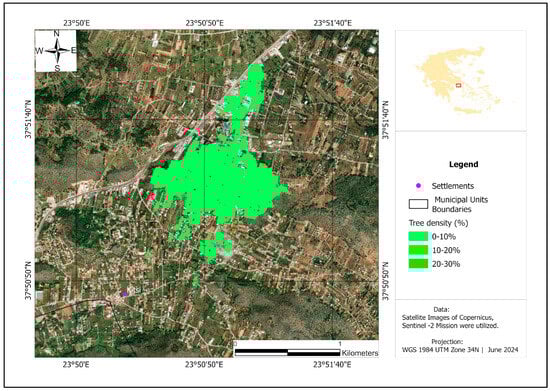
Figure 11.
Av. Varis-Koropiou wildfire tree cover density of burned area.
The Achaia-Ilia wildfire presented a broader variety of TCD categories within the burned area (Figure 12). Most of the affected area (42.15% or ~17.12 km2) was characterized by a TCD of 1%–10%, indicating minimal tree presence. The next most prevalent categories were 60%–70% and 50%–60% TCD, covering 17.84% (~7.25 km2) and 16.16% (6.57 km2) of the burned area, respectively. Approximately 9.10% (~3.70 km2) of the affected zone presented a TCD category of 40%–50%, while category the 70%–80% accounted for 8.57% (~3.48 km2). Additionally, 3.12% (~1.27 km2) of the burned area exhibited a TCD of 30%–40%. Higher-density categories were less prevalent; 1.93% (~0.79 km2) was classified in the 80%–90% TCD category. The remaining area was categorized among the 20%–30%, 10%–20% and 90%–100% categories. Specifically, the 20%–30% TCD category covered about 0.64% (~0.26 km2), the 10%–20% category represented 0.24% (~0.10 km2), and a similarly small area (0.24% or ~0.10 km2) was fully covered by trees in the 90%–100% TCD category.
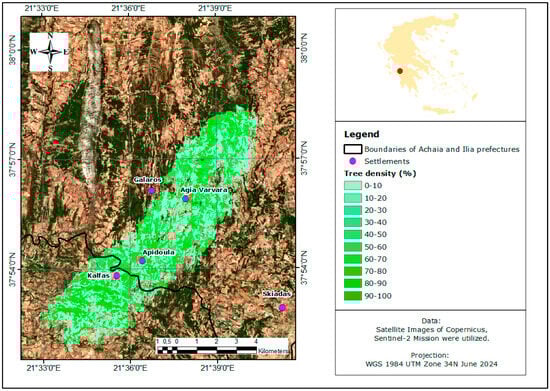
Figure 12.
Achaia-Ilia wildfire tree cover density of burned area.
According to Table 10, the majority of the burned area in Katsimidi (Figure 13) was classified within the 90%–100% Tree Cover Density (TCD) category, accounting for approximately 0.27 km2 or 41.58% of the total affected zone. This aligns with the land cover data, which identify most of the area as mixed forest. The 60%–70% TCD category represented 14.78% (~0.10 km2) of the burned area. Similarly, the 80%–90% and 50%–60% categories each covered approximately 12.54% (~0.08 km2) and 12.00% (~0.08 km2) of the burned area, respectively. The 20%–30% TCD category was the next most prevalent, comprising 4.55% (~0.03 km2), followed closely by the 30%–40% category at 4.41% (~0.03 km2). The 70%–80% TCD category accounted for 3.39% (~0.02 km2) of the burned area, while the 10%–20% and 1%–10% categories represented 2.95% (~0.02 km2) and 2.11% (~0.01 km2) of the affected zone, respectively. Finally, the least represented category, 40%–50% TCD, accounted for only 1.68% (~0.01 km2) of the burned area.

Figure 13.
Katsimidi-Parnitha wildfire tree cover density of burned area.
In contrast, the wildfire in Stamata (Figure 14) displayed an almost inverse trend in tree cover density compared to Katsimidi. The majority of the burned area was barren, with the 1%–10% TCD category being the most dominant, covering 66.23% (~0.93 km2) of the affected zone. Notably, the 90%–100% TCD category was entirely absent. Similarly, the 80%–90%, 20%–30%, and 10%–20% categories were minimally represented, accounting for just 0.07%, 0.01%, and 0.01% of the burned area, respectively. The 50%–60% TCD category was the second most represented, covering 14.63% (~0.20 km2) of the affected area, followed by the 60%–70% category, which made up 12.85% (~0.18 km2). The 40%–50% and 70%–80% categories covered smaller portions of the burned zone, at 3.35% (~0.05 km2) and 2.57% (~0.04 km2), respectively. Finally, 0.29% of the burned area in Stamata was characterized by a TCD of 30%–40%.
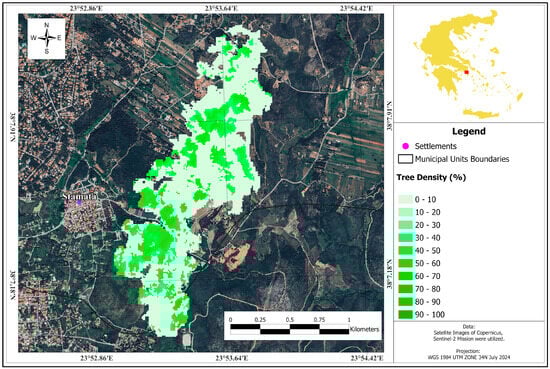
Figure 14.
Stamata wildfire tree cover density of burned area.
3.4. Validation of the Burned Area
To validate the results of this research, the estimated extent of the burned area for each wildfire was compared with open access post-fire measurements. Specifically, data and maps were acquired from the Copernicus Emergency Management Service–Mapping (CEMS–Mapping) platform, provided by the Copernicus program. This service provides two types of mapping products. The first, “Rapid Mapping”, is produced within hours or days following the activation of the CEMS service to support emergency response activities after disasters, such as wildfires. The second type, “Risk and Recovery Mapping”, focuses on long-term disaster management, including risk reduction, recovery, preparedness, and prevention. For the purposes of this study, rapid mapping products were used, as they provide detailed information on the extent of the burned area, affected land use types (natural and urban), and impacted area [67].
As mentioned above, the validation process involved comparing the burned area statistics derived from this study with those provided by the CEMS–Mapping service of Copernicus, as shown in Table 10. For the Avenue Varis-Koropiou wildfire on 19 June, the burned area was estimated at 0.824 km2, while the corresponding CEMS activation (EMSR729) reported a burned area of 0.804 km2, resulting in an estimation accuracy of 97.57%. Similarly, for the Achaia-Ilia wildfire on 21 June, the CEMS activation (EMSR730) reported a burned area of 38.86 km2, compared to this study’s estimate of 40.55 km2, suggesting a 95.83% estimation accuracy was accomplished. For the Katsimidi and Stamata fires, the same CEMS activation (EMSR733) was utilized. Specifically, the CEMS data for the Katsimidi fire (EMSR733-AOI01) reported a total burned area of 0.65 km2, while this study estimated 0.66 km2, resulting in an accuracy rate of 98.48%. Similarly, for the Stamata fire, the total burned area was estimated at 1.41 km2 in this study, compared to 1.30 km2 reported in the CEMS data (EMSR733-AOI02), yielding an accuracy rate of 92.20%. When considering the combined burned area for all events, this study estimates a total of 43.444 km2, while the CEMS–Mapping activations reported 41.614 km2, resulting in an overall percentage of 95.79%.
4. Discussion
This study demonstrates the utility of Sentinel-2 satellite imagery and geospatial data from Copernicus in assessing early-season wildfires in Greece during May and June 2024. By analyzing burn severity, land cover, and tree cover density across multiple wildfire events, we provide valuable insights into the spatial and environmental impacts of these fires. These findings contribute to a growing body of research that underscores the importance of Earth observation tools in wildfire monitoring and management.
Our findings align with previous studies that have highlighted the effectiveness of Sentinel-2 data in wildfire assessment, particularly in capturing small-scale variations in burn severity and land use changes [68,69]. However, this study extends the understanding of these tools by focusing on early-season wildfires—a critical period during which effective fire management strategies can mitigate substantial ecological and socio-economic impacts.
The validation process using the Copernicus Emergency Management Service (CEMS) data further underscores the reliability of the applied methodology. For example, the Avenue Varis-Koropiou wildfire affected 0.82 km2, closely matching the CEMS-derived area of 0.804 km2 with an accuracy of 97.57%. Similarly, the Achaia-Ilia wildfire, spanning 40.55 km2, demonstrated an accuracy of 95.83% compared to the CEMS estimate of 38.86 km2. Smaller fires, such as Katsimidi and Stamata, exhibited accuracies of 98.48% and 92.20%, respectively, emphasizing the robustness of the approach. Overall, the total burned area across all fires was estimated at 43.444 km2, which is closely aligned with the CEMS total of 41.614 km2, yielding an overall accuracy of 95.79%. These results are consistent with the validation rates reported in other remote sensing wildfire studies [70,71].
Similarly, Dosiou et al. [12] assessed extreme wildfire events in Greece using Sentinel-2 data and Copernicus Land Monitoring Service datasets. Their analysis confirmed that areas with higher pre-fire tree density exhibited greater burn severity, reinforcing our findings that vegetation structure significantly influences fire behavior. Their study also highlighted the role of climate and terrain complexity in shaping fire spread, which aligns with our observations in the Achaia-Ilia and Katsimidi fires, where strong winds and rugged topography contributed to severe burning patterns. A similar methodological approach was employed by Pinto et al. [66] to assess burned areas using Sentinel-2 and VIIRS data in Mediterranean Europe. Their study demonstrated that high-resolution burned area maps could be generated efficiently with minimal computational cost using cloud-based platforms like Google Earth Engine (GEE) and deep learning models. This aligns with our findings, wherein Sentinel-2 data successfully captured the spatial distribution of burned areas with high accuracy compared to CEMS data. However, our study differs in its emphasis on early-season wildfires, which have distinct characteristics and management implications compared to peak-season fires.
The applicability of Sentinel-2 data for burn severity mapping in Mediterranean-type ecosystems has also been demonstrated in other fire-prone regions. Zennir and Khallef [32] assessed post-fire severity in the Beni Salah National Forest (Algeria) using dNBR, NDVI, and RBR indices. Their approach reinforced the utility of these spectral indices in differentiating burn severity levels and evaluating post-fire vegetation response. Our study similarly employs dNBR and RBR to assess wildfire impacts, further validating their effectiveness in Mediterranean environments. Additionally, the integration of burn severity data with land-use planning in Beni Salah highlights a key consideration relevant to Greek landscapes, where fire risk mitigation efforts should incorporate satellite-based severity assessments into sustainable forest and land management strategies.
The study by Kovács [54] further supports the effectiveness of using Sentinel-2 data for burn severity mapping in Mediterranean environments. Their analysis of the Kineta and Mati wildfires in Greece demonstrated that Sentinel-2-derived Relativized Burn Ratio (RBR) values provided accurate estimations of burned area and severity compared to Copernicus Emergency Management Service (EMS) maps. Kovács also introduced the Burned Vegetation Index (BVI), which showed a strong correlation (R2 = 0.92) with RBR and could offer an additional metric for assessing vegetation loss. These findings highlight the potential utility of multi-index approaches to improve burn severity classification, an aspect that could be integrated into future wildfire assessments in Greece.
The use of Sentinel-2 data for fire severity classification has also been explored in southeastern Australia, where Gibson et al. [31] applied a Random Forest (RF) supervised classification approach. Their study achieved a mean accuracy of 88% across different fire severity levels, with particularly high accuracy (>85%) for extreme severity classes and unburned areas. This study highlighted that terrain complexity and dense canopy cover can lead to the underestimation of burn severity, a limitation that is also relevant in our study, particularly in regions with rugged landscapes and high vegetation density. Future studies in Greece could benefit from exploring RF-based classification approaches to further refine severity mapping.
The wildfires analyzed exhibited distinct burn severity and land cover characteristics, effectively captured through Sentinel-2 and CLC data. The Achaia-Ilia wildfire, the most extensive and severe event, demonstrated high variability in burn severity, with 26.93% of the burned area classified as moderate to high severity and 32.68% as low severity. This reflects the region’s rugged terrain and limited accessibility, exacerbated by strong wind speeds that challenge firefighting efforts. Land cover analysis revealed that 35.65% of the area was agricultural land, 28.53% was sclerophyllous vegetation, and 15.36% was transitional woodland, with tree cover density distributed between 42.15% low density (1%–10%) and 57.85% medium to high density.
In contrast, the Katsimidi and Stamata fires, although less extensive, provided valuable insights into smaller-scale wildfire dynamics. The Katsimidi fire affected 0.66 km2, with moderate to high severity accounting for 36.36% of the burned area, reflecting its dense tree cover (mixed forests, 56.06%; transitional woodland, 43.94%). Conversely, the Stamata wildfire, spanning 1.41 km2, was dominated by moderate to low severity (63.12%) and sparse tree cover, with 66.23% of the area classified in the 1%–10% tree cover density category. The primary land cover in Stamata was transitional woodland and shrubs (62.41%), highlighting the role of vegetation in shaping fire dynamics.
4.1. Implications for Fire Management and Land Use Planning
The observed variations in burn severity and land cover characteristics across the studied wildfires highlight the importance of developing region-specific fire management strategies. Our findings suggest a potential correlation between tree cover density and burn severity. In Katsimidi, where mixed forests (56.06%) and transitional woodland (43.94%) dominate, 36.36% of the burned area exhibited moderate-high severity, whereas in Stamata, characterized by low-density tree cover (66.23% of the area within the 1%–10% tree cover category), burn severity was predominantly moderate to low (63.12%). This pattern indicates that vegetation density and structure influence fire behavior, an aspect that warrants further investigation to refine fire risk assessment models.
Understanding the relationship between land cover and fire severity is crucial for refining predictive models and enhancing mitigation strategies. The findings suggest that areas dominated by dense forest cover may require increased attention in wildfire management plans, particularly through targeted fuel management practices such as controlled burns and mechanical thinning. Conversely, landscapes with lower tree density, like Stamata, may exhibit slower fire spread, but remain vulnerable due to their proximity to residential zones. This highlights the necessity of adapting fire management approaches based on specific vegetation structures to optimize suppression efforts and reduce ecological and economic losses.
The influence of topography and vegetation structure on fire severity was also highlighted in the study by Gibson et al. [31], where high terrain roughness and dense canopy cover were associated with the under-prediction of fire severity in remote sensing-based classifications. Their research found that Sentinel-2-based severity assessments were most effective in areas with moderate canopy density and relatively low topographic variation. Our results similarly suggest that regions with complex terrain and dense vegetation, such as Achaia-Ilia, require refined classification approaches to ensure accurate severity assessments.
Given the widespread presence of transitional woodlands in affected areas, implementing strategic firebreaks and enhancing land-use regulations may help mitigate the spread of wildfires. These insights support the integration of land cover data into fire management frameworks, allowing for more precise risk assessments and resource allocation.
Moreover, integrating satellite-derived burn severity data into local and regional land-use planning can provide authorities with a dynamic risk assessment tool. By mapping high-risk zones based on vegetation characteristics and historical fire occurrence, policymakers can allocate resources more effectively to prevent fire ignition and minimize spread. This could be particularly beneficial in fire-prone Mediterranean regions where rapid urban expansion encroaches upon wildland areas, increasing exposure to fire hazards.
Furthermore, our findings suggest that urban and peri-urban environments, such as Stamata, require adaptive fire prevention strategies. While the sparse vegetation in Stamata may have limited fire spread, its proximity to residential areas resulted in significant structural damage. Integrating remote sensing data with urban planning initiatives could help identify high-risk zones and inform preventive measures, such as fuel management around critical infrastructure. These applications align with broader efforts to enhance wildfire resilience in Mediterranean landscapes through the integration of geospatial data into decision-making processes.
4.2. Methodological Considerations and Future Research
While this study demonstrates the effectiveness of Sentinel-2 data in wildfire monitoring, certain methodological limitations must be acknowledged. The classification of burn severity relies on the dNBR and RBR indices, which, although widely used, are sensitive to atmospheric conditions, sensor calibration, and spectral mixing in heterogeneous landscapes. The validation against Copernicus Emergency Management Service (CEMS) data confirms a high overall accuracy (95.79%); however, discrepancies observed in specific wildfire events, such as the Stamata fire (92.20% accuracy), suggest that the further refinement of burn severity classification thresholds may be necessary. Although previous studies have established dNBR thresholds for Mediterranean environments, regional variations in vegetation structure and fire dynamics may require locally calibrated parameters [72,73]. Future research could integrate additional spectral indices, such as the Soil Adjusted Vegetation Index (SAVI) or the Normalized Difference Water Index (NDWI), to enhance the differentiation between burned and unburned areas and improve post-fire vegetation recovery assessments.
Another important consideration is the temporal resolution of Sentinel-2 imagery. The 5-day revisit period allows for efficient post-fire assessment, but does not capture rapid fire progression in real time. While this limitation does not affect the accuracy of the burned area assessment performed in this study, higher-temporal-resolution sensors, such as MODIS or VIIRS, could complement Sentinel-2 imagery for use in near-real-time fire detection and monitoring. Additionally, SNAP v. 9 and ArcGIS v. 10.8 were employed for image processing, which provided effective results; however, incorporating machine learning-based classification methods could further improve the accuracy of burned area delineation and severity assessment.
Furthermore, the classification process could benefit from integrating deep learning algorithms to refine fire severity mapping. Machine learning techniques have shown promise in wildfire monitoring, particularly in enhancing automated classification processes and reducing misclassification errors due to spectral mixing. Exploring these advanced computational methods could improve the robustness of future wildfire assessments.
Lastly, this study does not include field validation data, which could provide an additional layer of accuracy assessment beyond satellite-derived indices. While the CEMS dataset offers a reliable benchmark for validation, integrating ground data from field surveys or drone-based observations could refine the calibration of burn severity indices and improve the interpretation of fire’s effects on vegetation.
4.3. Policy and Conservation Implications
The insights gained from this study have direct implications for wildfire management policies and conservation strategies. The demonstrated effectiveness of Sentinel-2 data in mapping early-season wildfires reinforces the need for its integration into operational fire management frameworks. National agencies responsible for wildfire response could utilize these findings to enhance real-time monitoring capabilities and improve resource allocation.
Given the increasing frequency of early-season wildfires, policymakers should prioritize the incorporation of satellite-derived burn severity assessments into regional fire risk models. The findings of this study suggest that remote sensing can complement traditional fire risk assessment techniques, enabling more adaptive and data-driven decision-making. In particular, the integration of real-time fire severity mapping into emergency response protocols could facilitate more efficient resource distribution during active fire events.
Furthermore, targeted reforestation efforts in areas like Achaia-Ilia, characterized by high burn severity and low tree cover, could enhance ecosystem resilience. Similarly, repeated burns in Katsimidi highlight the importance of prioritizing soil erosion control and habitat restoration efforts. Investing in post-fire land rehabilitation measures, such as soil stabilization techniques and the restoration of fire-adapted vegetation, can help mitigate long-term ecological degradation in frequently burned areas. Strengthening fire prevention policies, increasing investment in remote sensing technologies, and fostering international collaboration on wildfire management in Mediterranean ecosystems will be critical steps in mitigating future wildfire risks.
Wildfires remain a recurrent phenomenon during the summer season in Greece, driven by prolonged heatwaves that extend from mid-spring to mid-autumn. The elevated temperatures observed in June 2024 resulted in an earlier onset of fire activity compared to previous years, highlighting the increasing need for adaptive fire management strategies. This study highlights the critical role of remote sensing technologies, particularly Sentinel-2 data, in providing high-resolution insights into wildfire dynamics. While some limitations persist, the methodological framework and findings presented here offer valuable guidance for improving wildfire monitoring and management practices, ultimately contributing to the resilience of Mediterranean ecosystems.
5. Conclusions
This study underscores the critical role of remote sensing technologies, particularly Sentinel-2 imagery, in monitoring and managing wildfires. By focusing on early-season wildfires in Greece during May and June 2024, the research revealed significant spatial and environmental impacts across all studied cases. The total burned area across the four wildfires was estimated at 43.444 km2, with an overall validation accuracy of 95.79% when compared to Copernicus Emergency Management Service data. These results highlight the robustness of the applied methodologies and the reliability of satellite-derived data for wildfire analysis.
The distinct characteristics of each wildfire provide valuable insights into fire dynamics under varying environmental conditions. For instance, the Achaia-Ilia fire, the most extensive and severe, accounted for 40.55 km2, with a significant proportion of moderate to high burn severity. Conversely, smaller-scale fires, such as those in Katsimidi and Stamata, showcased how land cover and vegetation density influenced burn severity and spread. The combination of burn severity, land cover changes, and tree density analyses demonstrated that local environmental and topographic variability play crucial roles in shaping fire behavior.
As climate change intensifies wildfire activity, integrating advanced geospatial tools with predictive climate models will become increasingly vital. The study’s outcomes advocate for enhanced investment in remote sensing technologies, early warning systems, and community engagement initiatives. Furthermore, reforestation and soil restoration efforts in severely affected regions, combined with adaptive urban planning in peri-urban zones, are crucial for mitigating future risks and enhancing ecosystem resilience. This research serves as a foundation for advancing wildfire management practices in Mediterranean ecosystems and beyond.
Author Contributions
Conceptualization, I.C.-M. and I.P.; methodology, A.T., M.Z., E.B., I.A., E.-A.K. and I.-E.K.; software, I.C.-M., A.T., M.Z., E.B., I.A., E.-A.K. and I.-E.K.; validation, I.C.-M., A.T., M.Z., E.B., I.A., E.-A.K. and I.-E.K.; formal analysis, I.C.-M., A.T., M.Z., E.B., I.A., E.-A.K. and I.-E.K.; investigation, I.C.-M., A.T., M.Z., E.B., I.A., E.-A.K. and I.-E.K.; resources, I.C.-M., A.T., M.Z., E.B., I.A., E.-A.K. and I.-E.K.; data curation, A.T., M.Z., E.B., I.A., E.-A.K. and I.-E.K.; writing—original draft preparation, I.C.-M., A.T., M.Z., E.B., I.A., E.-A.K. and I.-E.K.; writing—review and editing, I.C.-M., E.B., I.-E.K. and I.P.; visualization, I.C.-M., A.T., M.Z., E.B., I.A., E.-A.K. and I.-E.K.; supervision, I.C.-M. and I.P.; project administration, I.C.-M. and I.P. All authors have read and agreed to the published version of the manuscript.
Funding
This research received no external funding.
Data Availability Statement
Copernicus Sentinel-2 data was acquired from the Dataspace Copernicus Platform https://dataspace.copernicus.eu/ (accessed on 31 October 2024).
Acknowledgments
The Department of Geography, Harokopio University of Athens, provided the required facilities for this study, which the authors gratefully acknowledge. The authors are grateful to the European Space Agency, who provided Sentinel-2 data.
Conflicts of Interest
The authors declare no conflicts of interest.
References
- Lizundia-Loiola, J.; Otón, G.; Ramo, R.; Chuvieco, E. A Spatio-Temporal Active-Fire Clustering Approach for Global Burned Area Mapping at 250 m from MODIS Data. Remote Sens. Environ. 2020, 36, 111493. [Google Scholar] [CrossRef]
- San-Miguel-Ayanz, J.; Durrant, T.; Boca, R.; Maianti, P.; Libertà, G.; Jacome Felix Oom, D.; Branco, A.; De Rigo, D.; Suarez-Moreno, M.; Ferrari, D.; et al. Forest Fires in Europe, Middle East and North Africa 2023; Publications Office of the European Union: Luxembourg, 2023; JRC139704. [Google Scholar] [CrossRef]
- Silvestro, R.; Saulino, L.; Cavallo, C.; Allevato, E.; Pindozzi, S.; Cervelli, E.; Conti, P.; Mazzoleni, S.; Saracino, A. The Footprint of Wildfires on Mediterranean Forest Ecosystem Services in Vesuvius National Park. Fire 2021, 4, 95. [Google Scholar] [CrossRef]
- Our World in Data. Available online: https://ourworldindata.org/grapher/annual-carbon-dioxide-emissions?tab=table (accessed on 19 January 2025).
- Wilgus, M.-L.; Merchant, M. Clearing the Air: Understanding the Impact of Wildfire Smoke on Asthma and COPD. Healthcare 2024, 12, 307. [Google Scholar] [CrossRef]
- Matzarakis, A.; Nastos, P. Greece 2023: Crazy Summer or New Normal—Lessons Not Learned. Atmosphere 2024, 15, 1241. [Google Scholar] [CrossRef]
- Wasserman, T.N.; Mueller, S.E. Climate influences on future fire severity: A synthesis of climate-fire interactions and impacts on fire regimes, high-severity fire, and forests in the western United States. Fire Ecol. 2023, 19, 43. [Google Scholar] [CrossRef]
- Parente, J.; Tonini, M.; Stamou, Z.; Koutsias, N.; Pereira, M. Quantitative Assessment of the Relationship between Land Use/Land Cover Changes and Wildfires in Southern Europe. Fire 2023, 6, 198. [Google Scholar] [CrossRef]
- Williams, A.P.; Abatzoglou, J.T. Recent Advances and Remaining Uncertainties in Resolving Past and Future Climate Effects on Global Fire Activity. Curr. Clim. Change Rep. 2016, 2, 1–14. [Google Scholar] [CrossRef]
- Intergovernmental Panel on Climate Change (IPCC). Climate Change 2021—The Physical; Cambridge University Press: Cambridge, UK, 2023; pp. 46–51. [Google Scholar] [CrossRef]
- Nwayor, I.-J.; Robeson, S.-M.; Ficklin, D.; Maxwell, J.-T. A Multiscalar Standardized Vapor Pressure Deficit Index for Drought Monitoring and Impacts. Int. J. Climatol. 2024, 44, 5825–5838. [Google Scholar] [CrossRef]
- Dosiou, A.; Athinelis, I.; Katris, E.; Vassalou, M.; Kyrkos, A.; Krassakis, P.; Parcharidis, I. Employing Copernicus Land Service and Sentinel-2 Satellite Mission Data to Assess the Spatial Dynamics and Distribution of the Extreme Forest Fires of 2023 in Greece. Fire 2024, 7, 20. [Google Scholar] [CrossRef]
- Koukouli, M.-E.; Pseftogkas, A.; Karagkiozidis, D.; Mermigkas, M.; Panou, T.; Bais, A. Extreme Wildfires Over Northern Greece During Summer 2023—Part B. Adverse Effects on Regional Air Quality. SSRN, 2024; preprint. [Google Scholar] [CrossRef]
- Williams, A.P.; Allen, C.D.; Millar, C.I.; Swetnam, T.W.; Michaelsen, J.; Still, C.J.; Leavitt, S.W. Forest responses to increasing aridity and warmth in the southwestern United States. Proc. Natl. Acad. Sci. USA 2010, 107, 21289–21294. [Google Scholar] [CrossRef] [PubMed]
- Williams, A.P.; Allen, D.A.; Macalady, A.K.; Griffin, D.; Woodhouse, C.A.; Meko, D.M.; Swetnam, T.W.; Rauscher, S.A.; Seager, R.; Grissino-Mayer, H.D.; et al. Temperature as a Potent Driver of Regional Forest Drought Stress and Tree Mortality. Nat. Clim. Change 2012, 3, 292–297. [Google Scholar] [CrossRef]
- Politi, N.; Vlachogiannis, D.; Sfetsos, A. A Statistical Analysis of Drought and Fire Weather Indicators in the Context of Climate Change: The Case of the Attica Region, Greece. Climate 2024, 12, 135. [Google Scholar] [CrossRef]
- Pülzl, H.; Hogl, K. Forest governance in Europe. In European Forest Governance: Issues at Stake and the Way Forward, What Science Can Tell Us; Pülzl, H., Hogl, K., Kleinschmit, D., Wydra, D., Arts, B., Mayer, P., Palahi, M., Winkel, G., Wolfslehner, B., Eds.; European Forest Institute: Joensuu, Finland, 2013. [Google Scholar]
- Costafreda-Aumedes, S.; Vega-Garcia, C.; Comas, C. Improving fire season definition by optimized temporal modelling of daily human-caused ignitions. J. Environ. Manag. 2018, 217, 90–99. [Google Scholar] [CrossRef] [PubMed]
- Xanthopoulos, G. Who Should Be Responsible for Forest Fires? Lessons From the Greek Experience. In Proceedings of the Second International Symposium on Fire Economics, Planning, and Policy: A Global View, Albany, CA, USA, 23–27 June 2008; Pacific Southwest Research Station, Forest Service, US Department of Agriculture: Albany, CA, USA, 2008. [Google Scholar]
- Civil Protection Department. Available online: https://rischi.protezionecivile.gov.it/en/fire/activities/ (accessed on 6 December 2024).
- Arianoutsou, M.; Zerefos, C.; Kalabokidis, K.; Poupkou, A.; Aravanopoulos, F. Climate change and resilience of forest ecosystems. In Resilience of Forest Ecosystems of Greece to Climate Change; Committee for the Resilience of the Greek Forest Ecosystems to Climate Change (EADO), Arianoutsou, M., Zerefos, C., Kalabokidis, K., Poupkou, A., Aravanopoulos, F., Eds.; Academy of Athens: Athens, Greece, 2023. [Google Scholar]
- Bolaño-Díaz, S.; Camargo-Caicedo, Y.; Soro, T.D.; N’Dri, A.B.; Bolaño-Ortiz, T.R. Spatio-Temporal Characterization of Fire Using MODIS Data (2000–2020) in Colombia. Fire 2022, 5, 134. [Google Scholar] [CrossRef]
- Basiou, E.; Castro-Melgar, I.; Kranis, H.; Karavias, A.; Lekkas, E.; Parcharidis, I. Assessment of the Ground Vulnerability in the Preveza Region (Greece) Using the European Ground Motion Service and Geospatial Data Concerning Critical Infrastructures. Remote Sens. 2025, 17, 327. [Google Scholar] [CrossRef]
- Kalavrezou, I.E.; Castro-Melgar, I.; Nika, D.; Gatsios, T.; Lalechos, S.; Parcharidis, I. Application of Time Series INSAR (SBAS) Method Using Sentinel-1 for Monitoring Ground Deformation of the Aegina Island (Western Edge of Hellenic Volcanic Arc). Land 2024, 13, 485. [Google Scholar] [CrossRef]
- Lam, C.N.; Niculescu, S.; Bengoufa, S. Monitoring and mapping floods and floodable areas in the Mekong Delta (Vietnam) using time-series sentinel-1 images, convolutional neural Network, multi-layer perceptron, and random forest. Remote Sens. 2023, 15, 2001. [Google Scholar] [CrossRef]
- Lekkas, E.; Meletlidis, S.; Kyriakopoulos, K.; Manousaki, M.; Mavroulis, S.; Kostaki, E.; Michailidis, A.; Gogou, M.; Mavrouli, M.; Castro-Melgar, I.; et al. The 2021 Cumbre Vieja volcano eruption in La Palma (Canary Islands). Newsl. Environ. Disaster Cris. Manag. Strateg. 2021, 26, 167. [Google Scholar] [CrossRef]
- Gibson, L.; Engelbrecht, J.; Rush, D. Detecting historic informal settlement fires with sentinel 1 and 2 satellite data-Two case studies in Cape Town. Fire Saf. J. 2019, 108, 102828. [Google Scholar] [CrossRef]
- Roy, D.P.; Huang, H.; Boschetti, L.; Giglio, L.; Yan, L.; Zhang, H.H.; Li, Z. Landsat-8 and Sentinel-2 burned area mapping—A combined sensor multi-temporal change detection approach. Remote Sens. Environ. 2019, 231, 111254. [Google Scholar] [CrossRef]
- Chuvieco, E.; Mouillot, F.; Van der Werf, G.R.; San Miguel, J.; Tanase, M.; Koutsias, N.; García, M.; Yebra, M.; Padilla, M.; Gitas, I.; et al. Historical Background and Current Developments for Mapping Burned Area from Satellite Earth Observation. Remote Sens. Environ. 2019, 225, 45–64. [Google Scholar] [CrossRef]
- Barboza, E.; Turpo, E.Y.; Tariq, A.; Salas López, R.; Pizarro, S.; Zabaleta-Santisteban, J.A.; Medina-Medina, A.J.; Tuesta-Trauco, K.M.; Oliva-Cruz, M.; Vásquez, H.V. Spatial Distribution of Burned Areas from 1986 to 2023 Using Cloud Computing: A Case Study in Amazonas (Peru). Fire 2024, 7, 413. [Google Scholar] [CrossRef]
- Gibson, R.; Danaher, T.; Hehir, W.; Collins, L. A Remote Sensing Approach to Mapping Fire Severity in South-Eastern Australia Using Sentinel-2 and Random Forest. Remote Sens. Environ. 2020, 240, 111702. [Google Scholar] [CrossRef]
- Zennir, R.; Khallef, B. Forest fire area detection using Sentinel-2 data: Case of the Beni Salah national forest—Algeria. J. For. Sci. 2023, 69, 33–40. [Google Scholar] [CrossRef]
- A European Forest Fire Information System (EFFIS). Available online: https://forest-fire.emergency.copernicus.eu/apps/effis.statistics/estimates/GRC (accessed on 3 November 2024).
- Μεγάλη Φωτιά στη Βάρης—Κορωπίου: Ζημιές σε Σπίτια και Επιχειρήσεις, Έκλεισαν Δρόμοι—Εκκένωση σε Λαμπρικά—Κίτσι. The TOC. 2024. Available online: https://www.thetoc.gr/koinwnia/article/megali-fotia-sti-baris---koropiou-kaigontai-spitia-ekleise-i-exodos-tis-attikis-odou---ekkenosi-se-lamprika-kai-kitsi/ (accessed on 4 November 2024).
- Time and Date. Available online: https://www.timeanddate.com/weather/@257605/historic?month=6&year=2024 (accessed on 5 November 2024).
- Copernicus Emergency Management Service (CMS). EMSR730: Copernicus Emergency Mapping Service Rapid Mapping Activation. Copernicus EMS. 2024. Available online: https://rapidmapping.emergency.copernicus.eu/EMSR730 (accessed on 5 November 2024).
- Time and Date. Available online: https://www.timeanddate.com/weather/@9036675/climate (accessed on 5 November 2024).
- Time and Date. Available online: https://www.timeanddate.com/weather/@257605/climate (accessed on 5 November 2024).
- Time and Date. Available online: https://www.timeanddate.com/weather/@11026795/climate (accessed on 26 November 2024).
- Time and Date. Available online: https://www.timeanddate.com/weather/@253302/climate (accessed on 26 November 2024).
- Dataspace Copernicus EU. Available online: https://dataspace.copernicus.eu/ (accessed on 31 October 2024).
- European Space Agency; European Commission. Sentinel-2 User Handbook; European Space Agency: Paris, France, 2015. [Google Scholar]
- Corine Land Cover (CLC 2018). Copernicus Land Monitoring Service. Available online: https://land.copernicus.eu/en/products/corine-land-cover/clc2018 (accessed on 31 October 2024).
- Tree Cover Density 2018 (TCD). Copernicus Land Monitoring Service. Available online: https://land.copernicus.eu/en/products/high-resolution-layer-tree-cover-density/tree-cover-density-2018 (accessed on 31 October 2024).
- Copernicus Land Monitoring Service; European Environment Agency. Copernicus Land Monitoring Service—High Resolution Land Cover Characteristics—Tree-Cover/Forest and Change 2015–2018; User Manual; European Environment Agency: Copenhagen, Denmark, 2018. [Google Scholar]
- Copernicus Land Monitoring Service; European Environment Agency. Tree Cover Density 2018 (Raster 10 m), Europe, 3-Yearly, Sep. 2020; European Environment Agency: Copenhagen, Denmark, 2020. [Google Scholar]
- Falaras, T.; Tselka, I.; Papadopoulos, I.; Nikolidaki, M.; Karavias, A.; Bafi, D.; Petani, A.; Krassakis, P.; Parcharidis, I. Operational Mapping and Post-Disaster Hazard Assessment by the Development of a Multiparametric Web App Using Geospatial Technologies and Data: Attica Region 2021 Wildfires (Greece). Appl. Sci. 2022, 12, 7256. [Google Scholar] [CrossRef]
- Alcaras, E.; Costantino, D.; Guastaferro, F.; Parente, C.; Pepe, M. Normalized Burn Ratio Plus (NBR+): A New Index for Sen-tinel-2 Imagery. Remote Sens. 2022, 14, 1727. [Google Scholar] [CrossRef]
- European Space Agency. SNAP Tool. Earth Observation Portal. Available online: https://earth.esa.int/eogateway/tools/snap (accessed on 17 January 2025).
- Esri. ArcGIS Desktop: Overview. Available online: https://www.esri.com/en-us/arcgis/products/arcgis-desktop/overview (accessed on 17 January 2025).
- Normalized Burn Ratio (Nbr)|Un-Spider Knowledge Portal. Available online: https://un-spider.org/advisory-support/recommended-practices/recommended-practice-burn-severity/in-detail/normalized-burn-ratio (accessed on 30 October 2024).
- Heidari, F.B.; Arfania, R. Wildfire Susceptibility Mapping using NBR Index and Frequency Ratio Model. Geoconservation Res. 2022, 5, 240–260. [Google Scholar] [CrossRef]
- Key, C.; Benson, N. The Normalized Burned Ratio, a Landsat TM Radiometric Index of Burn Severity Incorporating Multi-Temporal Differencing; Geological Surney: Reston, VA, USA, 1999. [Google Scholar]
- Kovács, K.D. Evaluation of Burned Areas with Sentinel-2 Using SNAP: The Case of Kineta and Mati, Greece, July 2018. Geogr. Tech. 2019, 14, 20–38. [Google Scholar] [CrossRef]
- McFeeters, S.K. The use of the Normalized Difference Water Index (NDWI) in the delineation of open water features. Int. J. Remote Sens. 1996, 17, 1425–1432. [Google Scholar] [CrossRef]
- Parks, S.A.; Dillon, G.K.; Miller, C. A new metric for quantifying burn severity: The relativized burn ratio. Remote Sens. 2014, 6, 1827–1844. [Google Scholar] [CrossRef]
- Arisanty, D.; Ramadhan, M.F.; Angriani, P.; Muhaimin, M.; Saputra, A.N.; Hastuti, K.P.; Rodadi, D. Utilizing Sentinel-2 Data for Mapping Burned Area in Banjarbaru Wetlands, South Kalimantan Province. Int. J. For. Res. 2022, 2022, 7936392. [Google Scholar] [CrossRef]
- Roy, D.P.; Boschetti, L.; Trigg, S.N. Remote sensing of fire severity: Assessing the performance of the normalized burn ratio. IEEE Geosci. Remote Sens. Lett. 2006, 3, 112–116. [Google Scholar] [CrossRef]
- Key, C.H.; Benson, N.C. Landscape Assessment (LA). FIREMON: Fire Effects Monitoring and Inventory System; General Technical Report RMRS-GTR-164-CD; U.S. Department of Agriculture Forest Service: Washington, DC, USA, 2006; pp. LA-1–LA-51. [Google Scholar]
- Miller, J.D.; Thode, A.E. Quantifying burn severity in a heterogeneous landscape with a relative version of the delta Normalized Burn Ratio (dNBR). Remote Sens. Environ. 2007, 109, 66–80. [Google Scholar] [CrossRef]
- Cocke, A.E.; Fulé, P.Z.; Crouse, J.E. Comparison of Burn Severity Assessments Using Differenced Normalized Burn Ratio and Ground Data. Int. J. Wildland Fire 2005, 14, 189–198. [Google Scholar] [CrossRef]
- Franco, M.G.; Mundo, I.A.; Veblen, T.T. Field-Validated Burn-Severity Mapping in North Patagonian Forests. Remote Sens. 2020, 12, 214. [Google Scholar] [CrossRef]
- Rozario, P.F.; Madurapperuma, B.D.; Wang, Y. Remote Sensing Approach to Detect Burn Severity Risk Zones in Palo Verde National Park, Costa Rica. Remote Sens. 2018, 10, 1427. [Google Scholar] [CrossRef]
- Sismanis, M.; Chadoulis, R.-T.; Manakos, I.; Drosou, A. An Unsupervised Burned Area Mapping Approach Using Sentinel-2 Images. Land 2023, 12, 379. [Google Scholar] [CrossRef]
- Lee, K.; Kim, B.; Park, S. Evaluating the Potential of Burn Severity Mapping and Transferability of Copernicus EMS Data Using Sentinel-2 Imagery and Machine Learning Approaches. GISci. Remote Sens. 2023, 60, 2192157. [Google Scholar] [CrossRef]
- Pinto, M.M.; Trigo, R.M.; Trigo, I.F.; DaCamara, C.C. A Practical Method for High-Resolution Burned Area Monitoring Using Sentinel-2 and VIIRS. Remote Sens. 2021, 13, 1608. [Google Scholar] [CrossRef]
- XXI The Emergency Management Service—Mapping. Copernicus EMS—Mapping. Available online: http://emergency.copernicus.eu/mapping/ems/emergency-management-service-mapping (accessed on 11 November 2024).
- Howe, A.A.; Parks, S.A.; Harvey, B.J.; Saberi, S.J.; Lutz, J.A.; Yocom, L.Y. Comparing Sentinel-2 and Landsat 8 for Burn Severity Mapping in Western North America. Remote Sens. 2022, 14, 5249. [Google Scholar] [CrossRef]
- Konkathi, P.; Shetty, A. Inter comparison of post-fire burn severity indices of Landsat-8 and Sentinel-2 imagery using Google Earth Engine. Earth. Sci. Inform. 2021, 14, 645–653. [Google Scholar] [CrossRef]
- Donezar-Hoyos, U.; Albizua-Huarte, L.; Amezketa-Lizarraga, E.; Barinagarrementeria-Arrese, I.; Ciriza, R.; de Blas-Corral, T.; Larrañaga-Urien, A.; Ros-Elso, F.; Tamés-Noriega, A.; Viñuales-Lasheras, M.; et al. The Copernicus EMS Validation Service as a vector for improving the emergency mapping based on Sentinel data. Rev. Teledetec. 2020, 56. [Google Scholar] [CrossRef]
- Franquesa, M.; Rodriguez-Montellano, A.M.; Chuvieco, E.; Aguado, I. Reference Data Accuracy Impacts Burned Area Product Validation: The Role of the Expert Analyst. Remote Sens. 2022, 14, 4354. [Google Scholar] [CrossRef]
- Saulino, L.; Rita, A.; Migliozzi, A.; Maffei, C.; Allevato, E.; Garonna, A.P.; Saracino, A. Detecting Burn Severity across Mediterranean Forest Types by Coupling Medium-Spatial Resolution Satellite Imagery and Field Data. Remote Sens. 2020, 12, 741. [Google Scholar] [CrossRef]
- Fernández-García, V.; Quintano, C.; Taboada, A.; Marcos, E.; Calvo, L.; Fernández-Manso, A. Remote Sensing Applied to the Study of Fire Regime Attributes and Their Influence on Post-Fire Greenness Recovery in Pine Ecosystems. Remote Sens. 2018, 10, 733. [Google Scholar] [CrossRef]
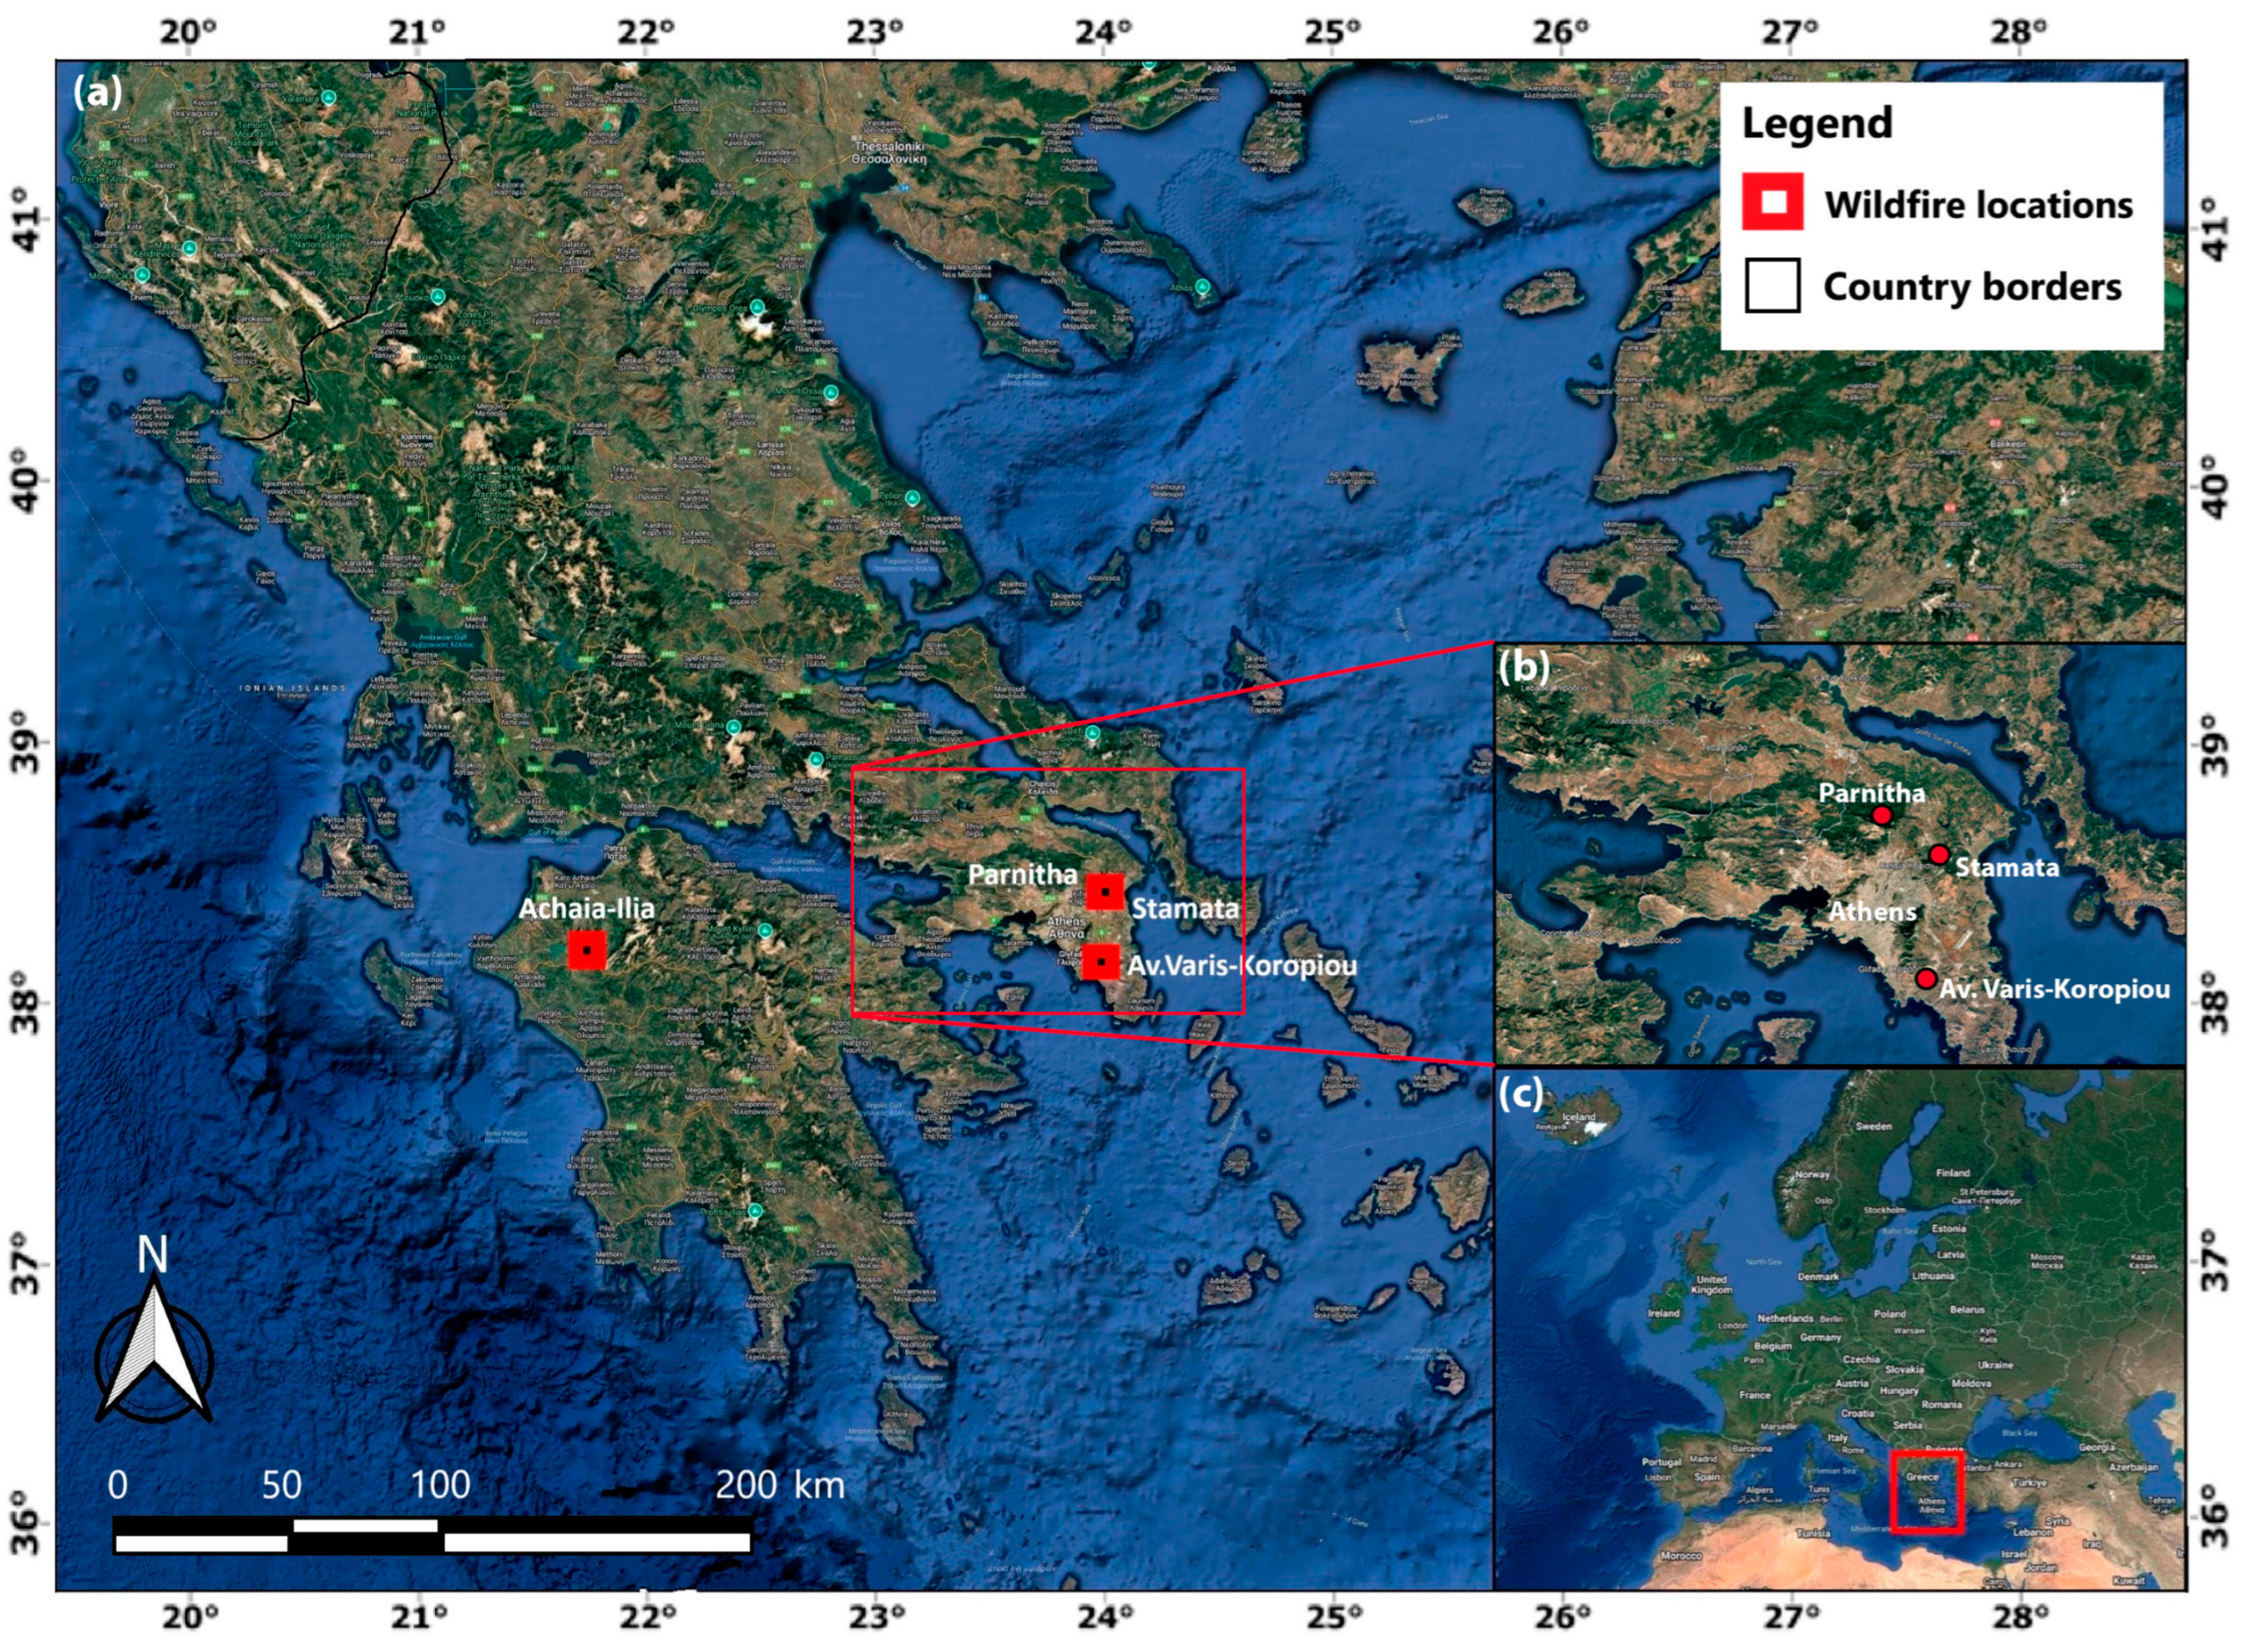
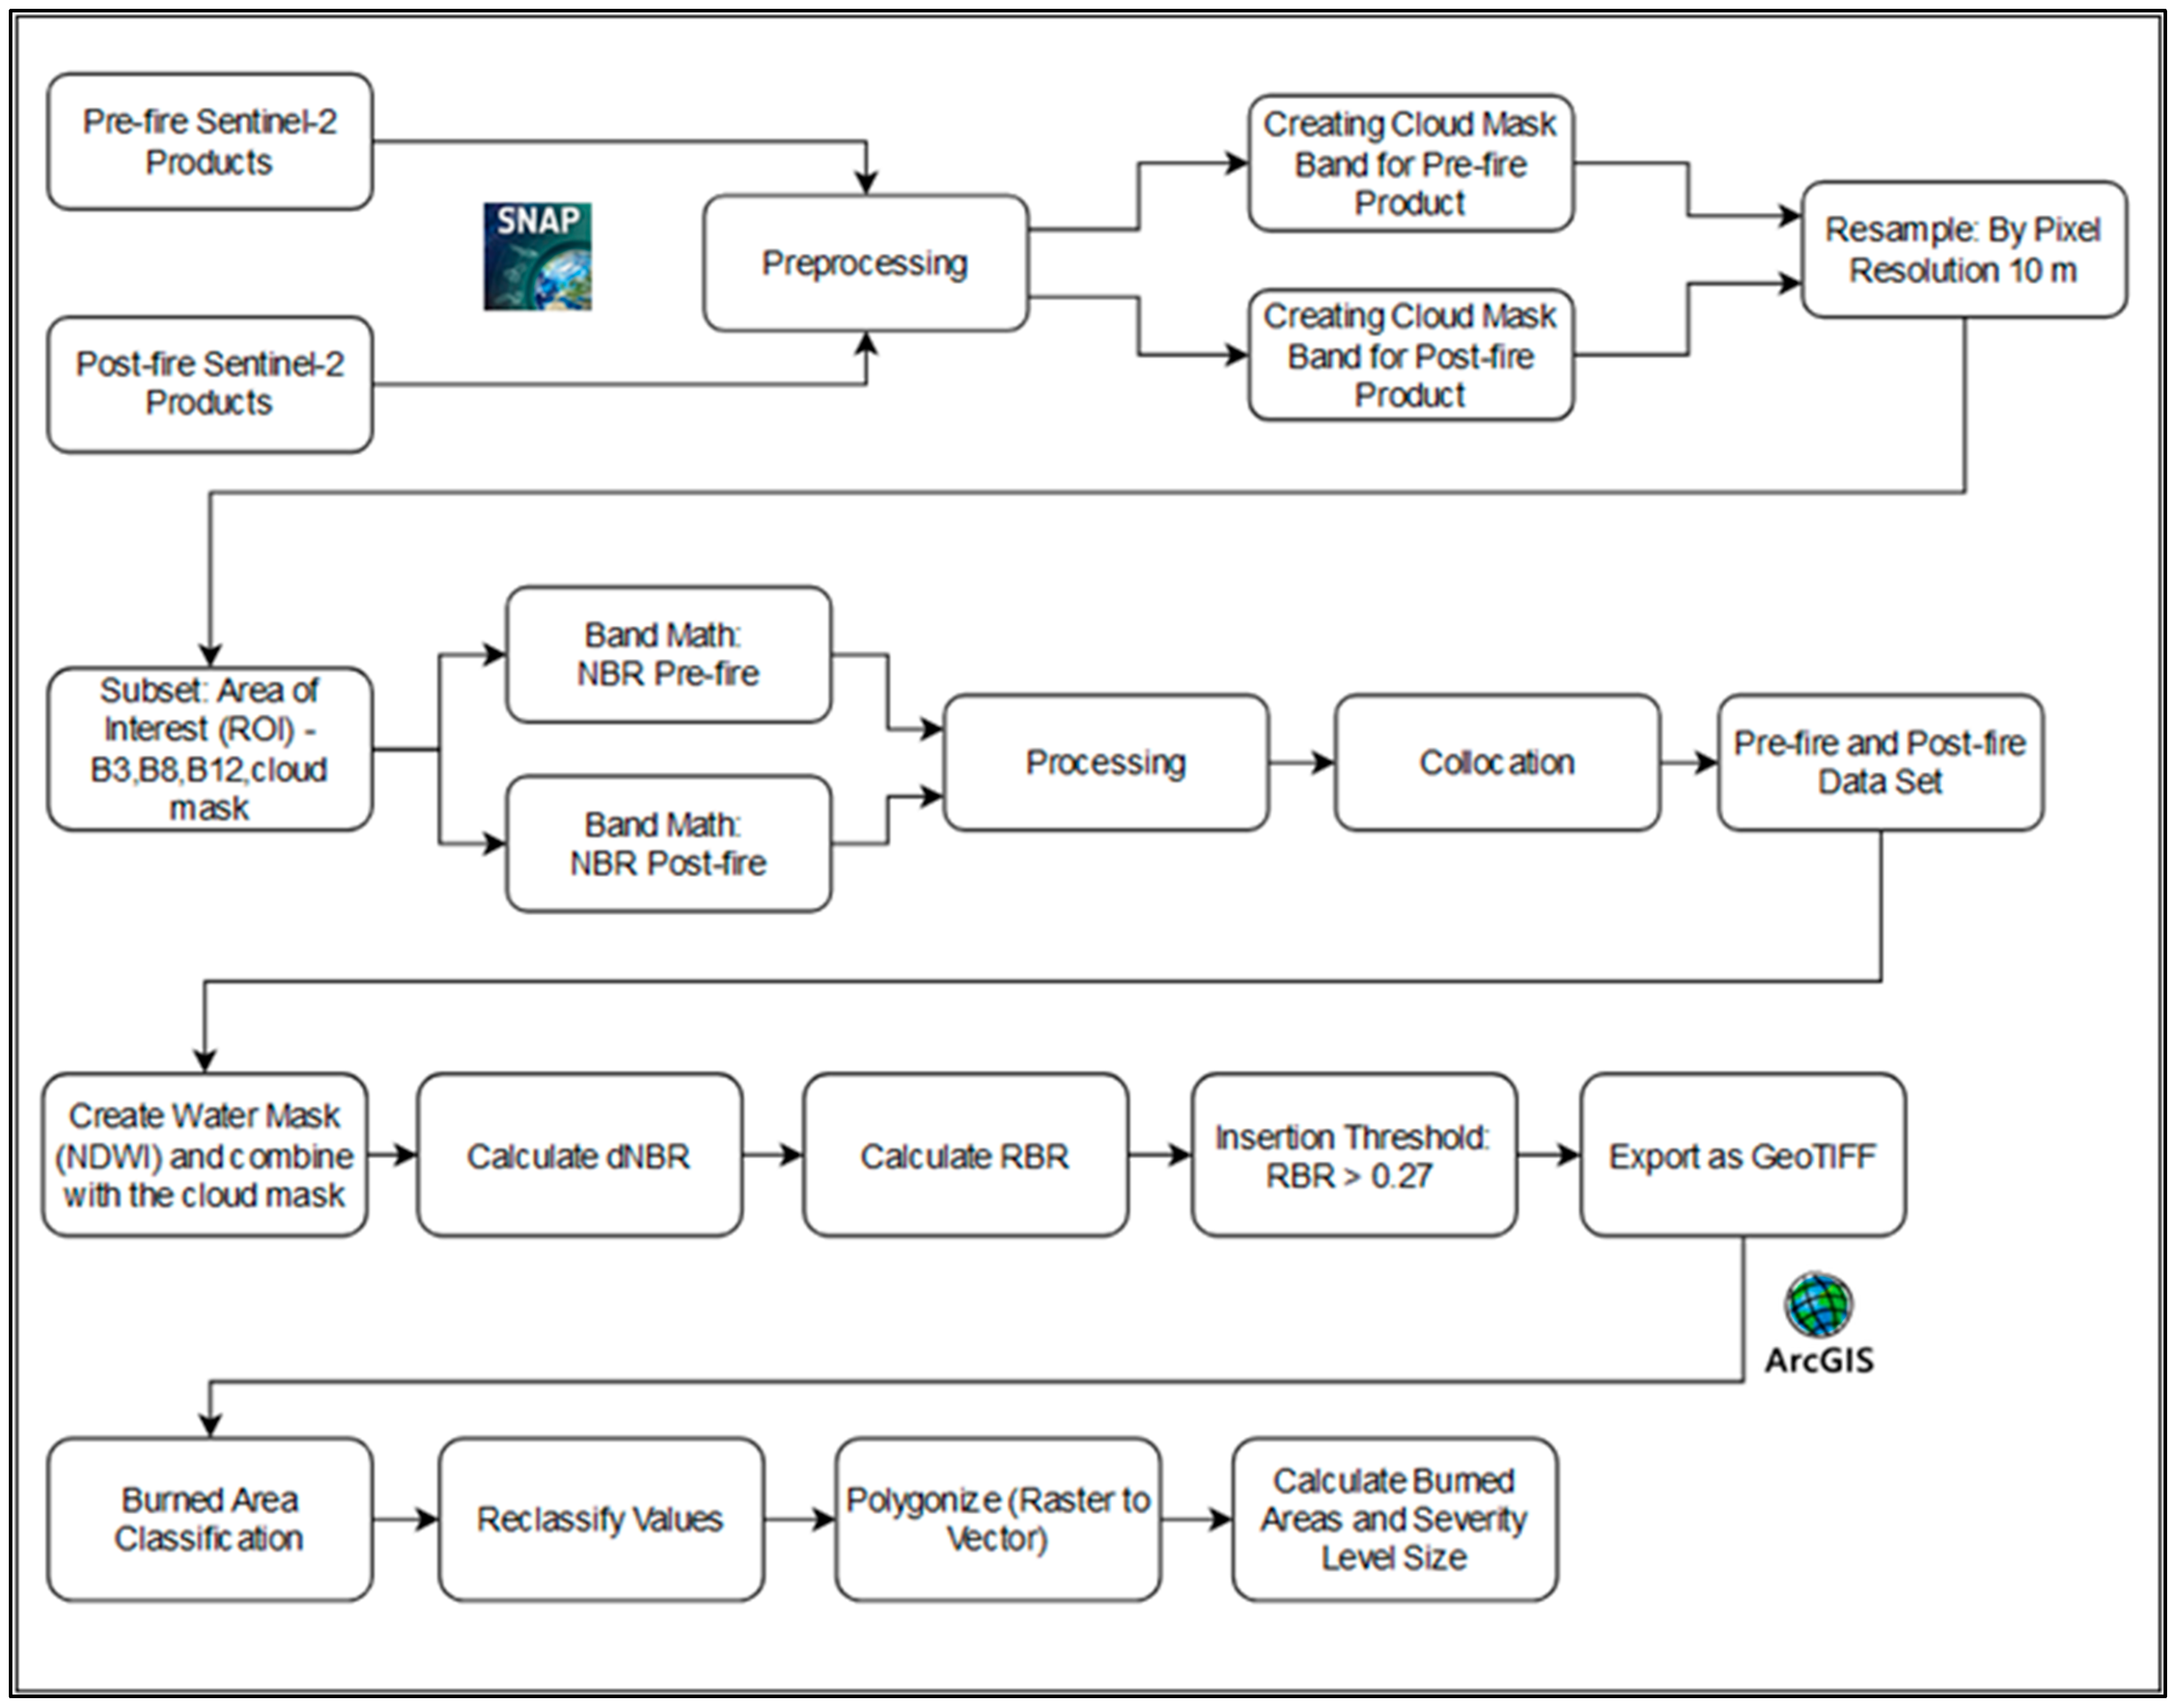
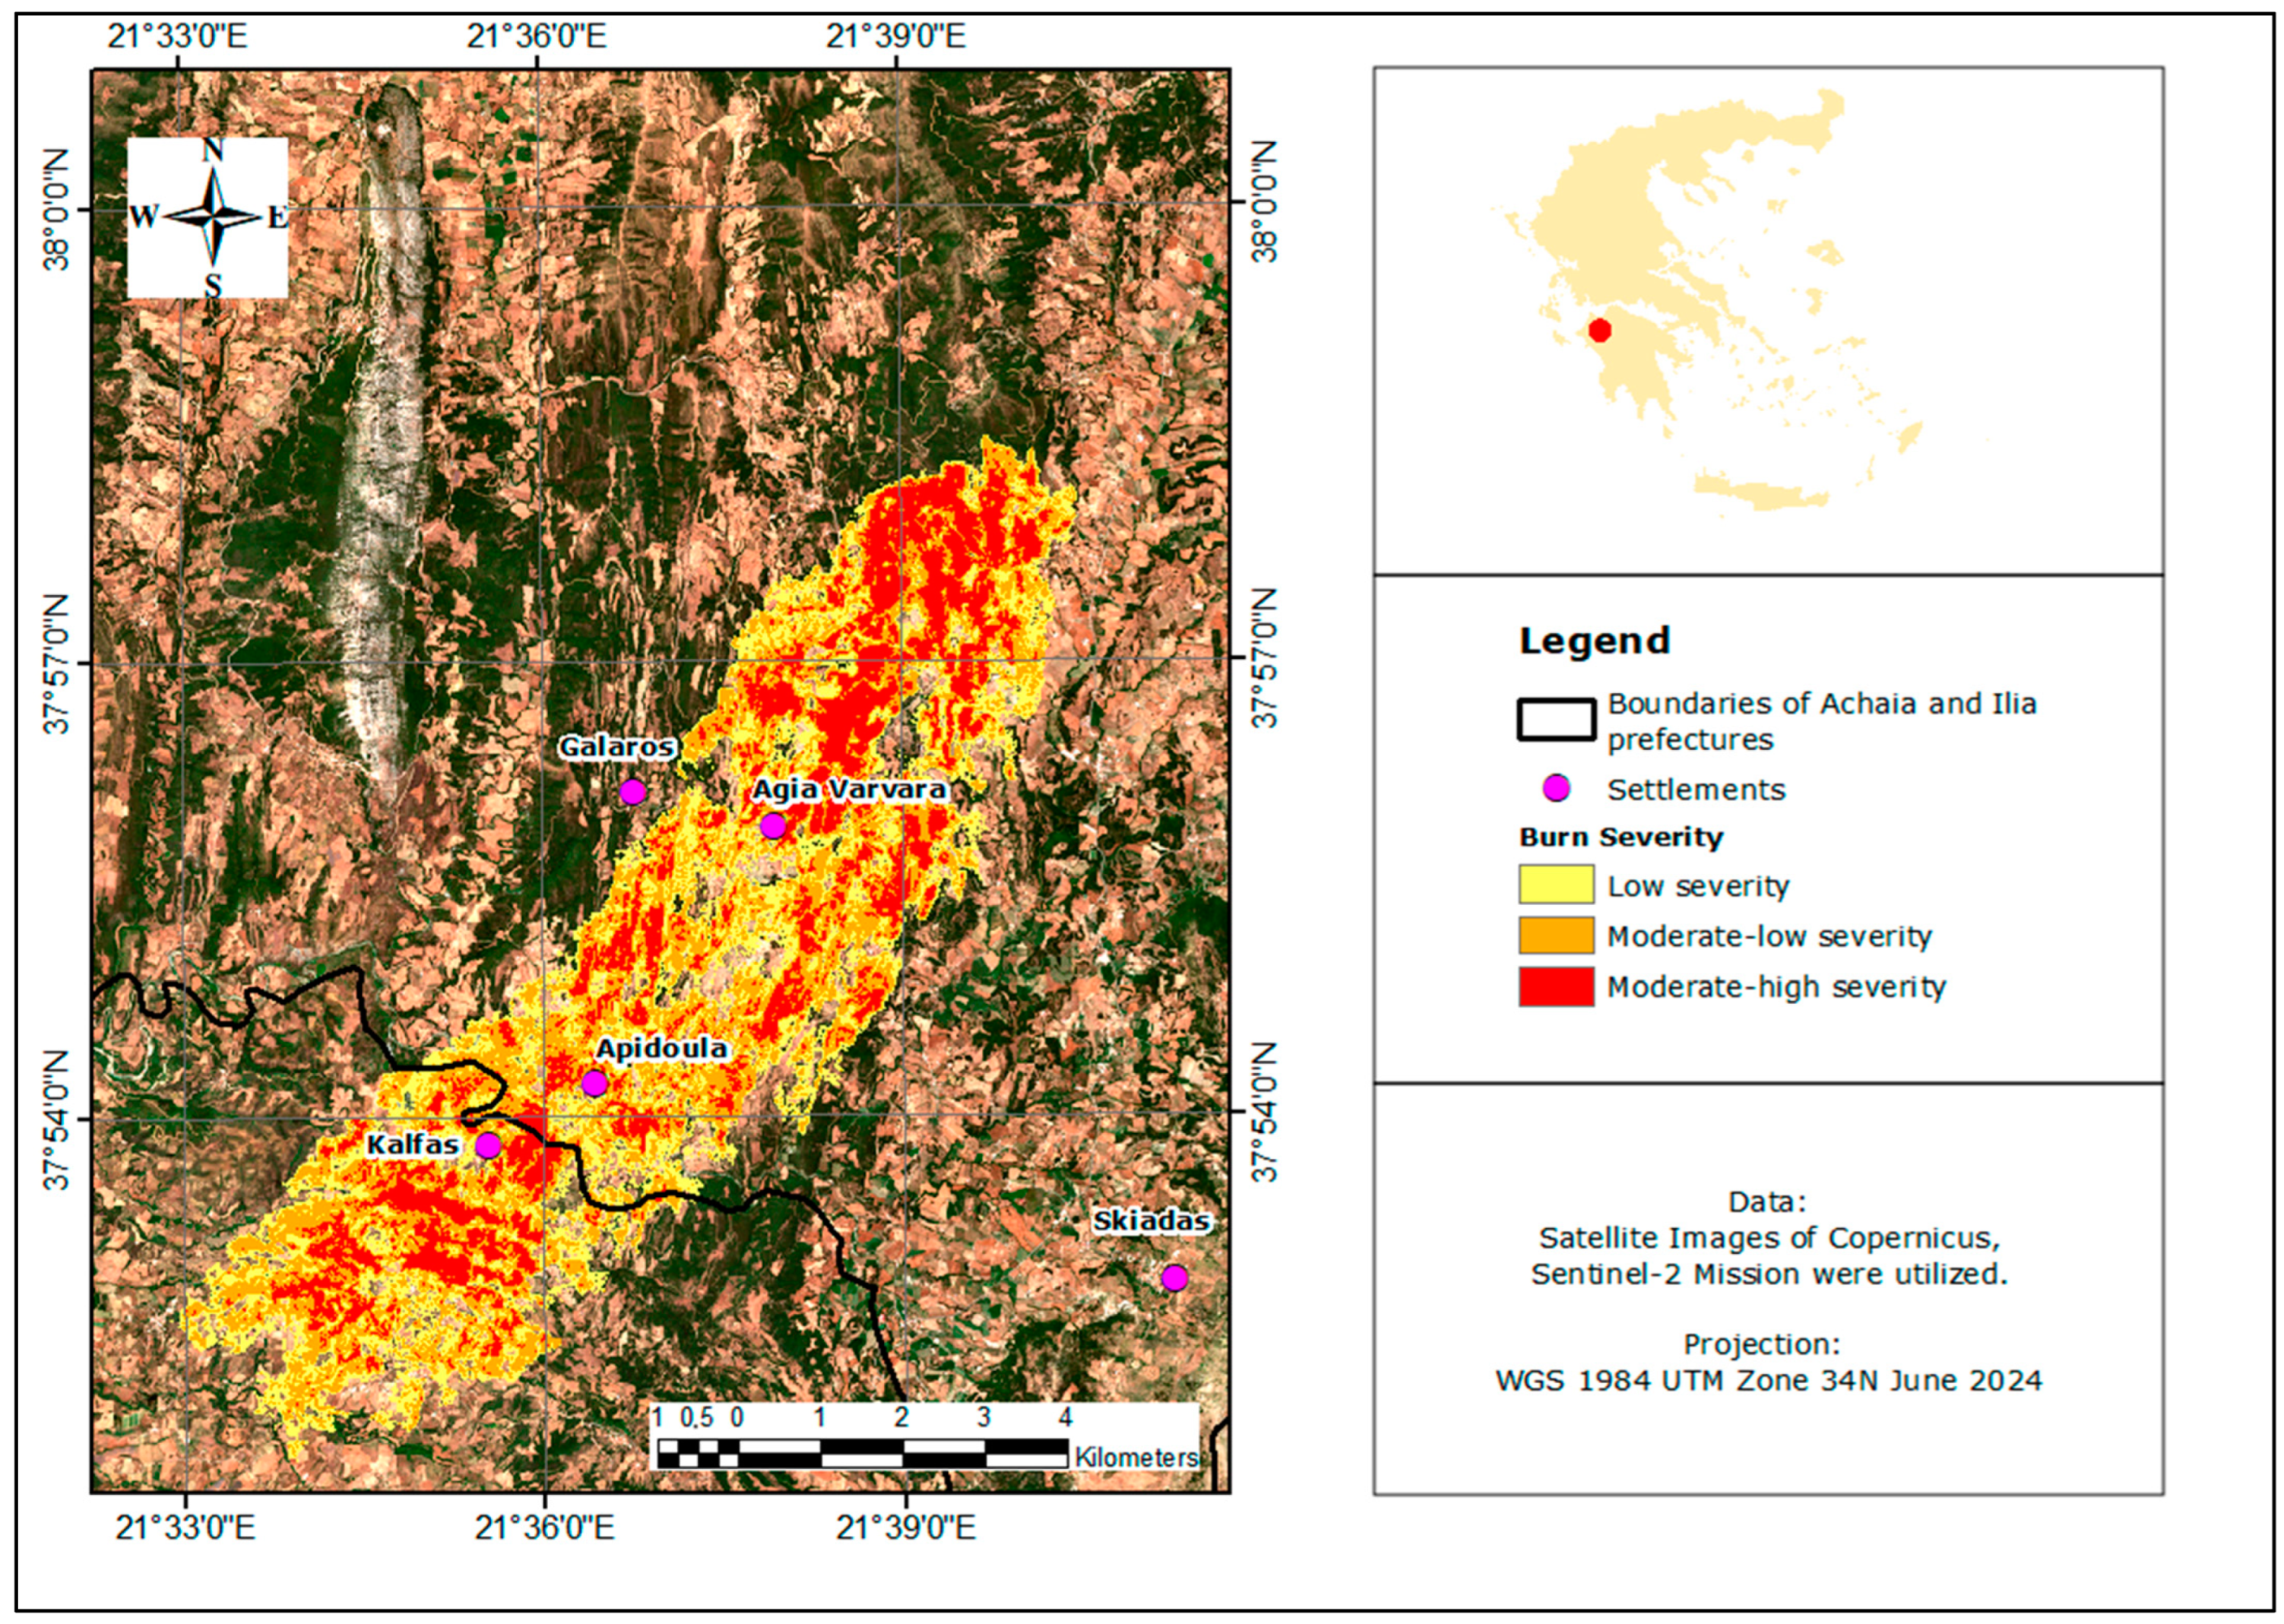
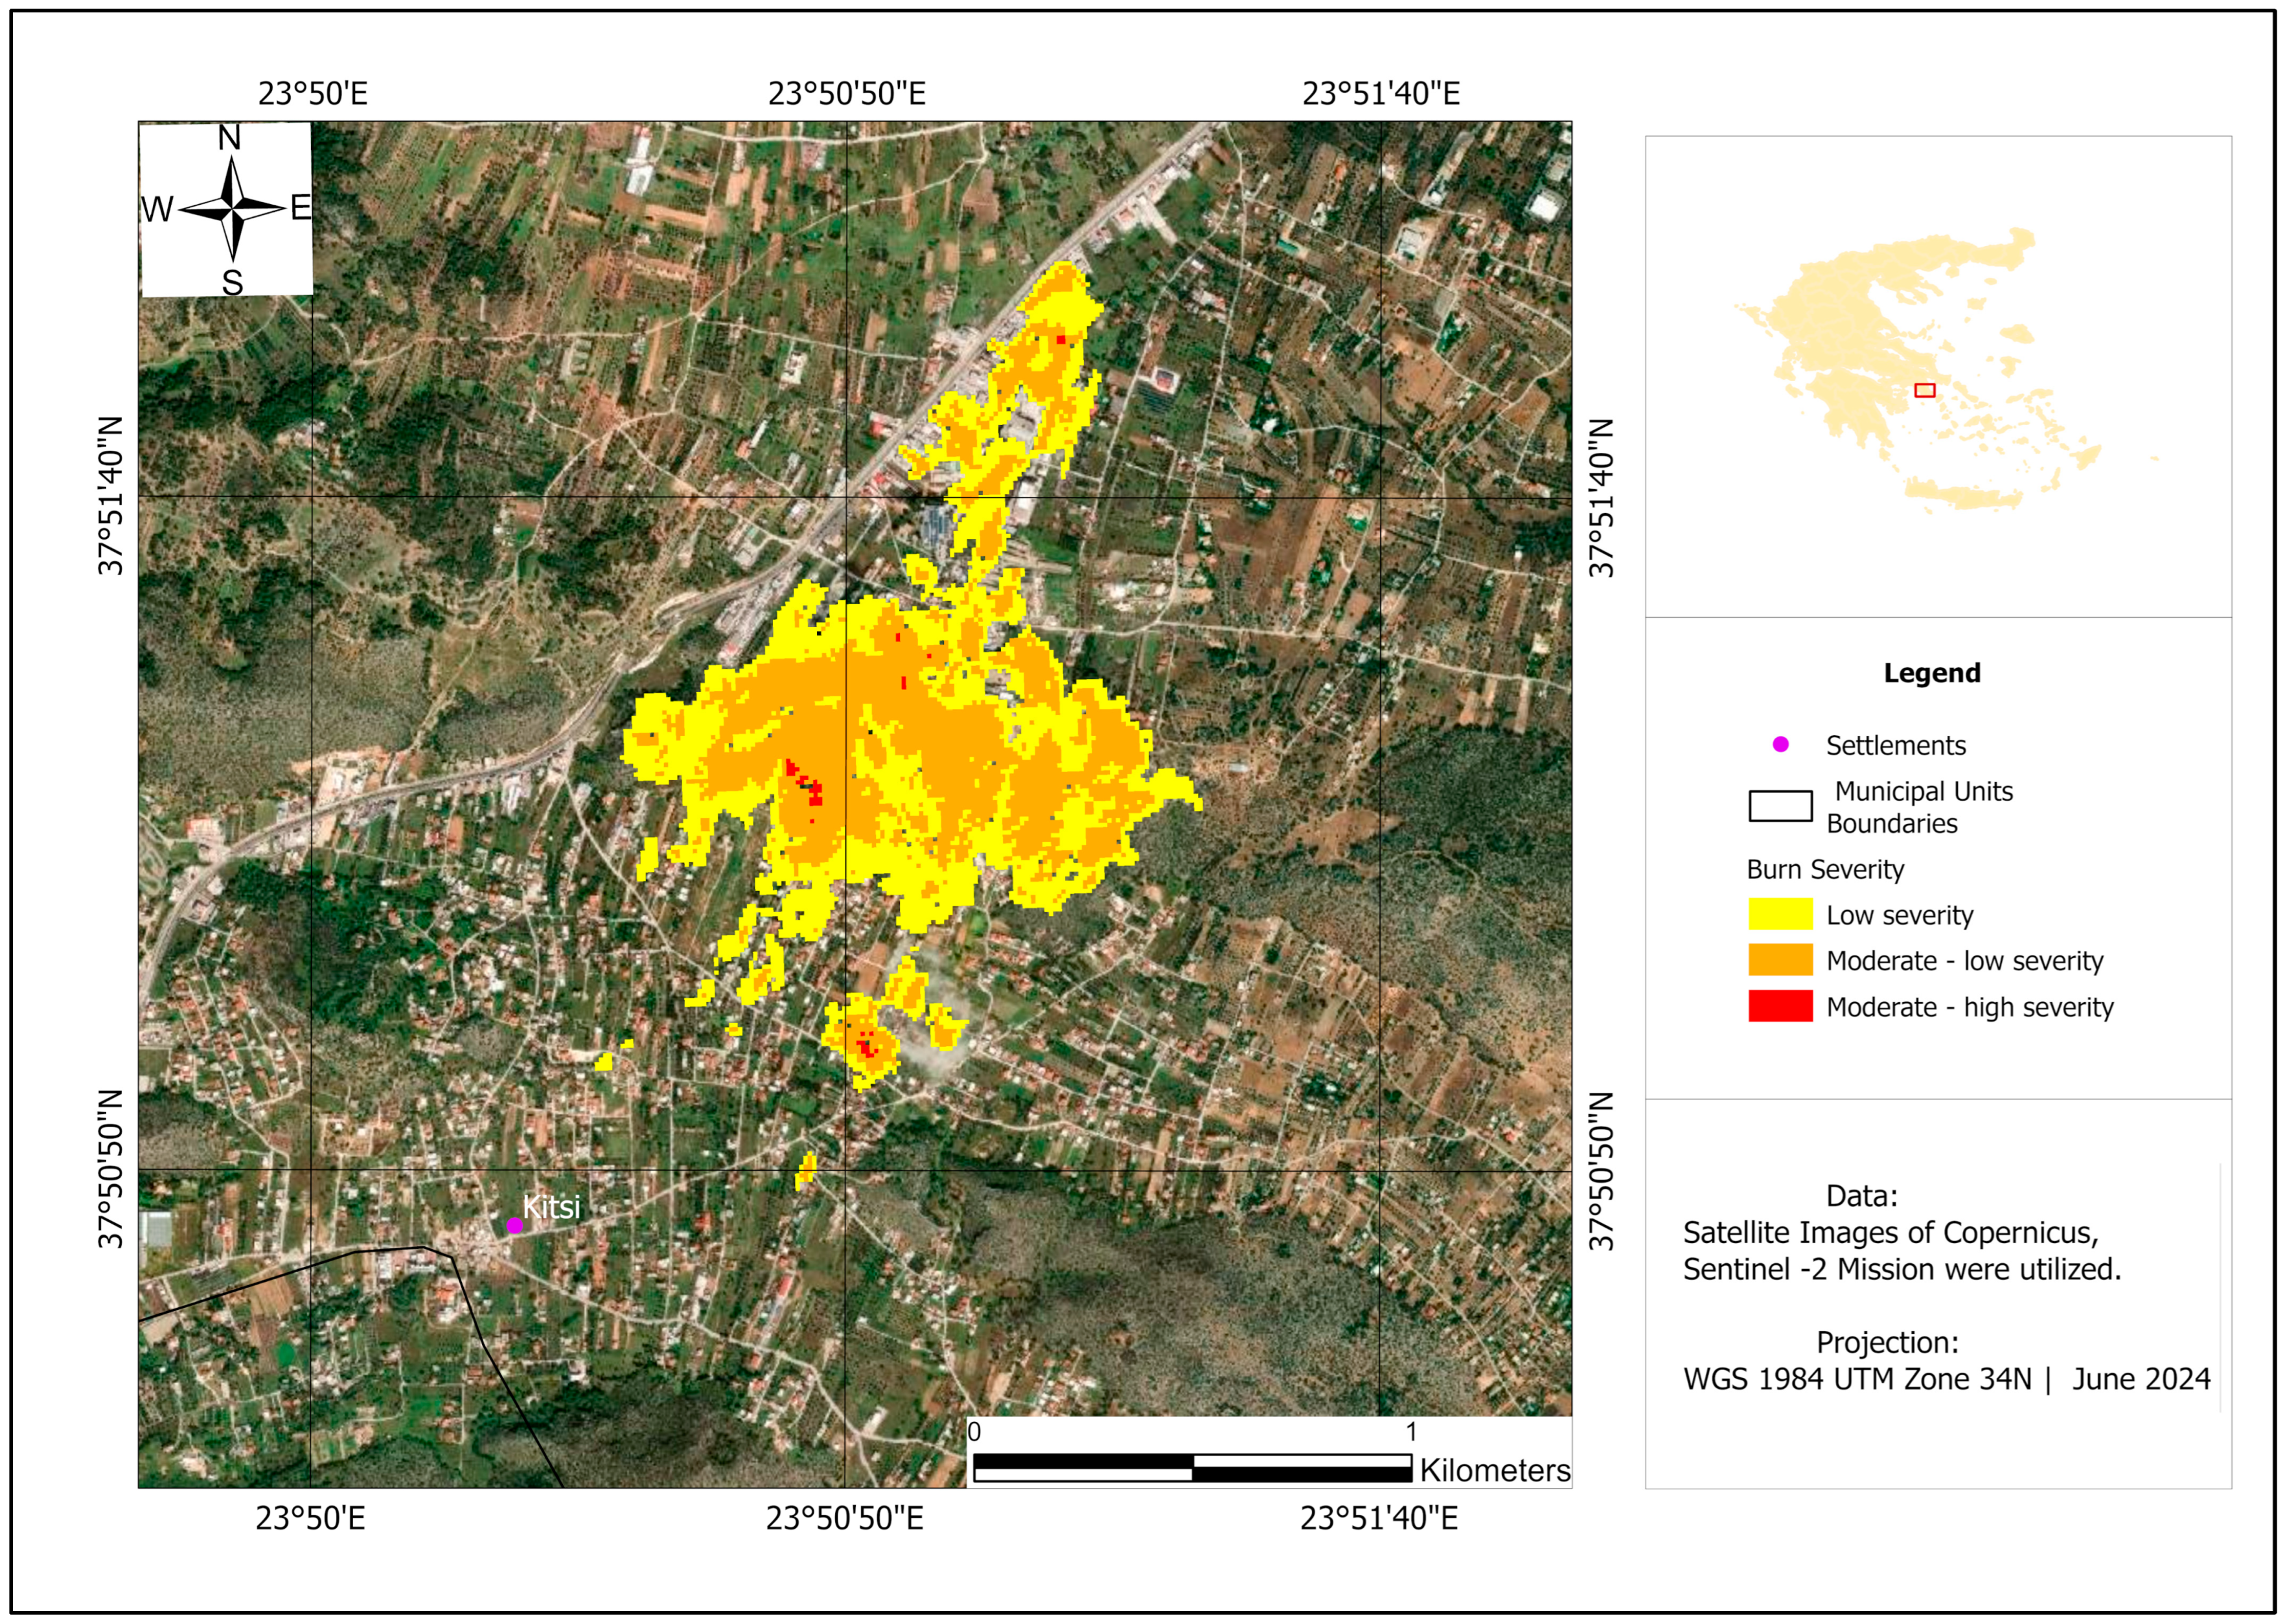
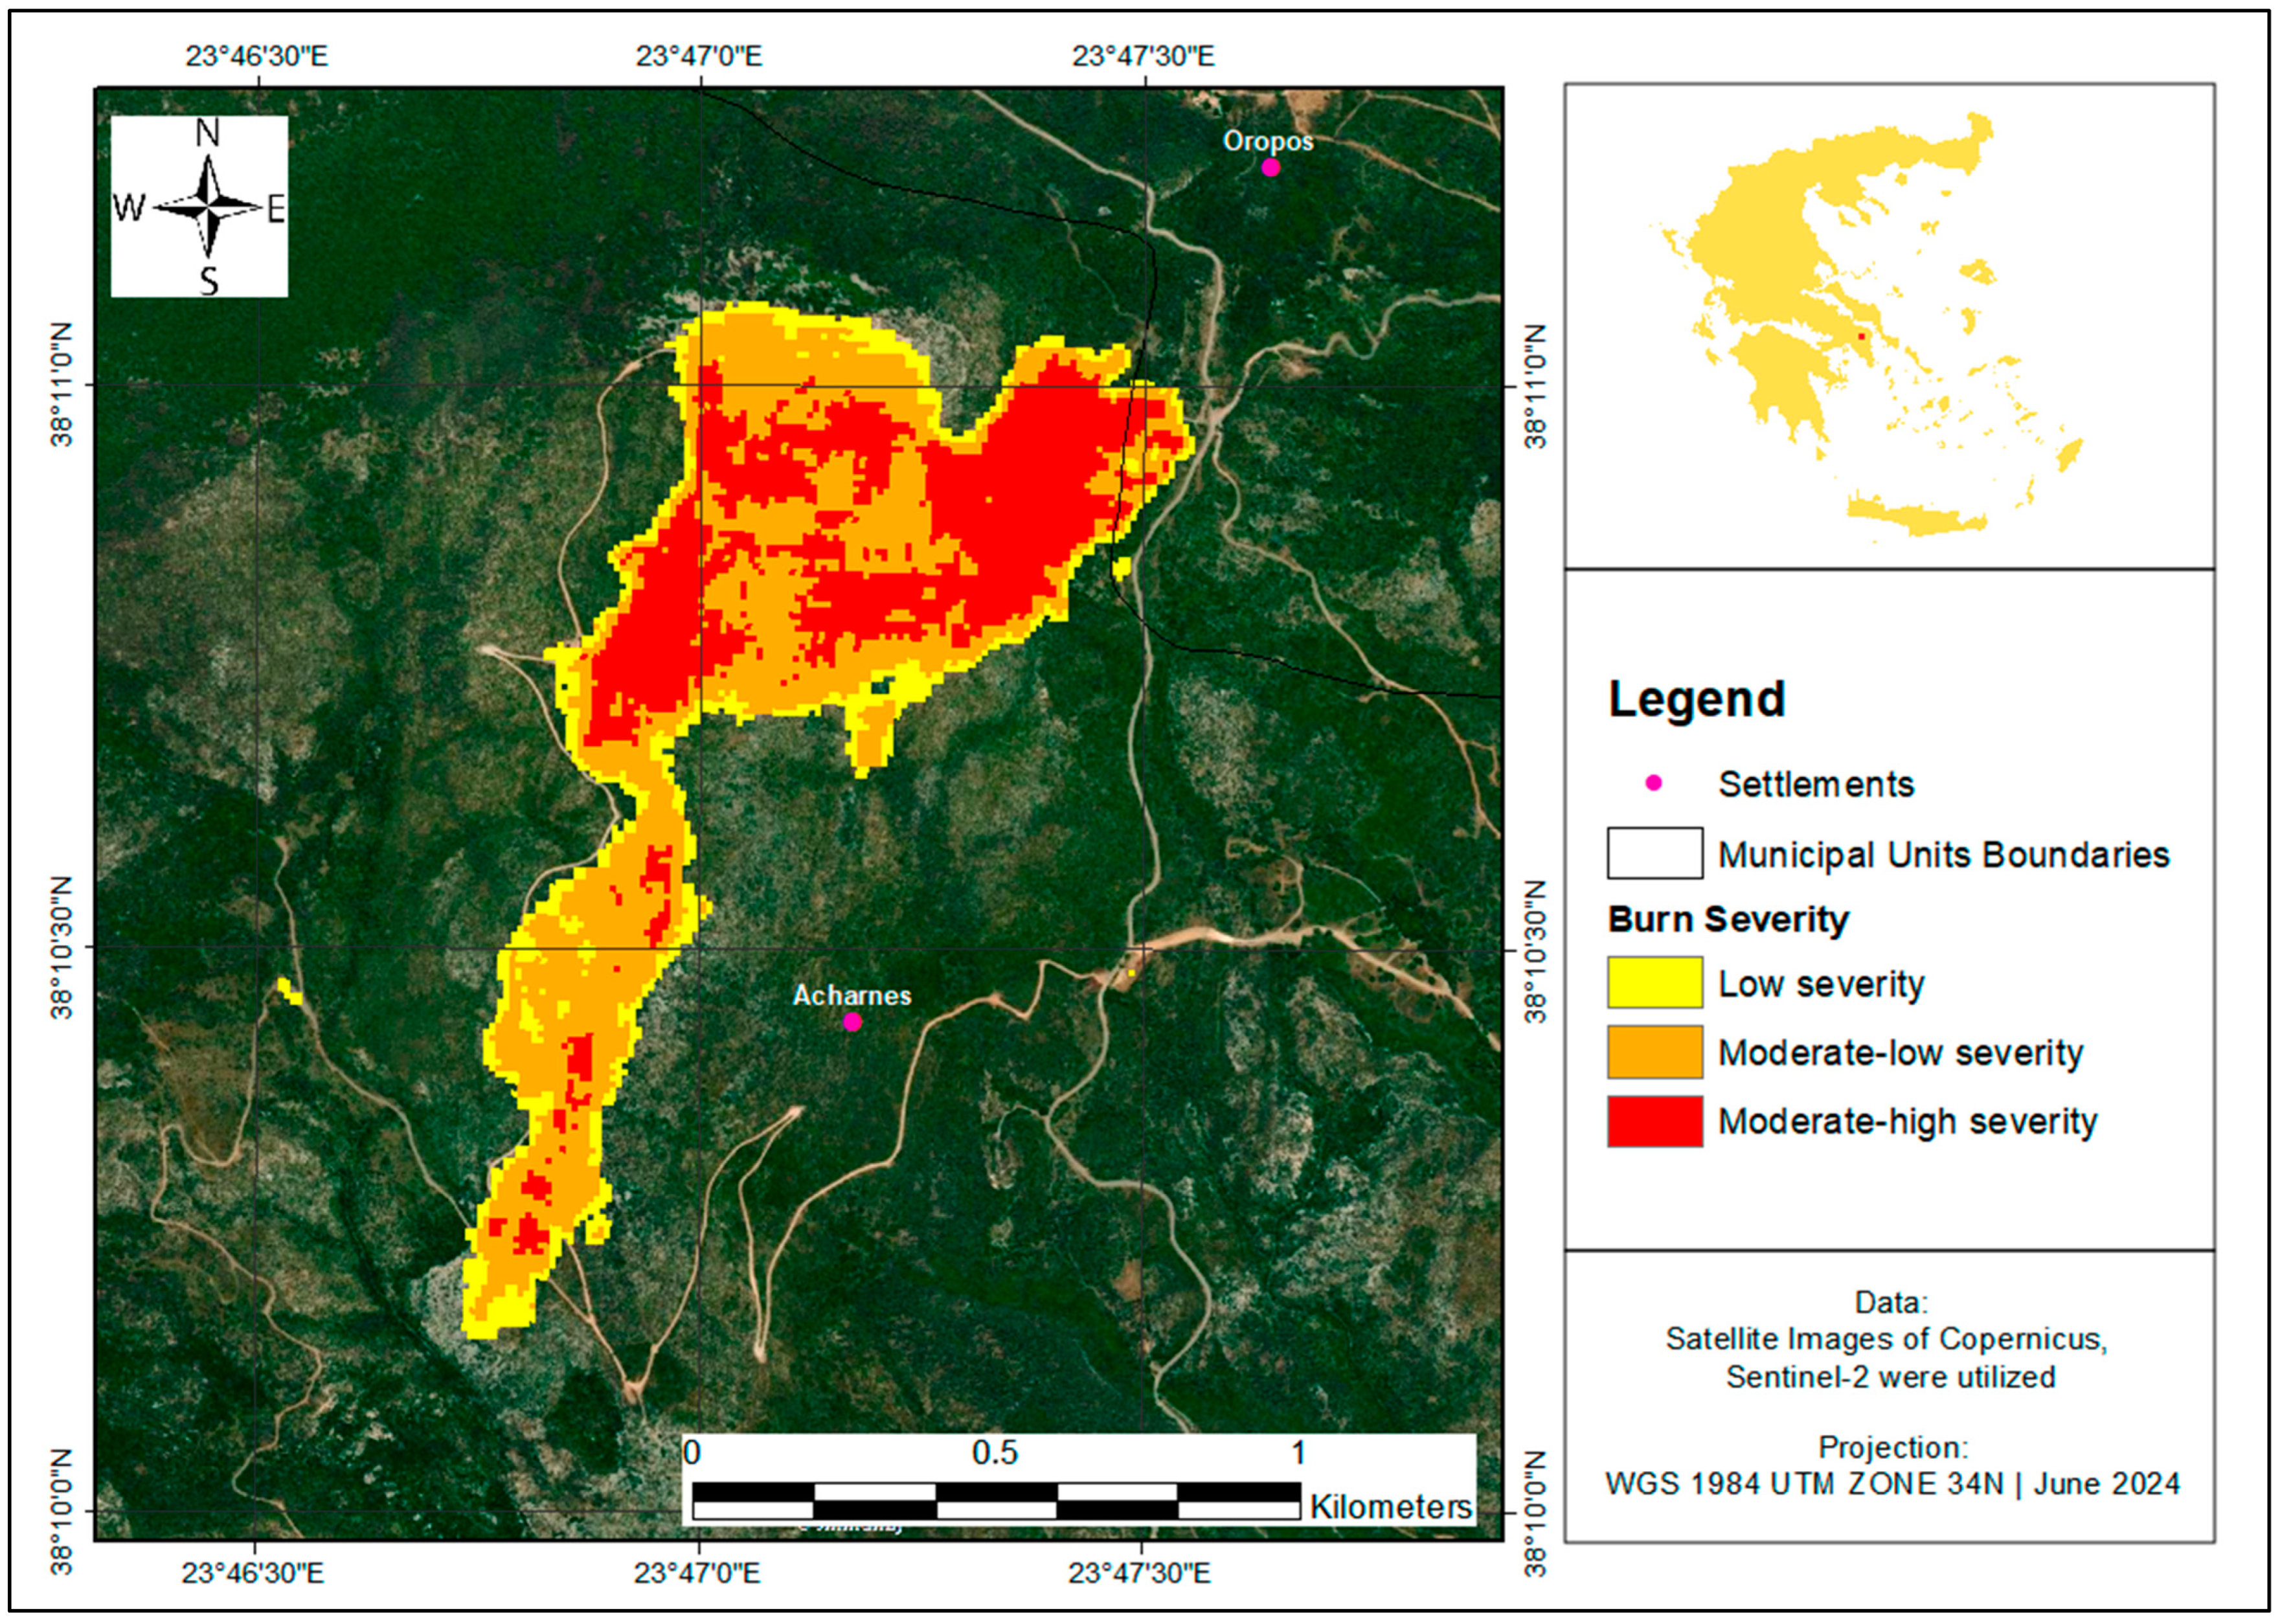
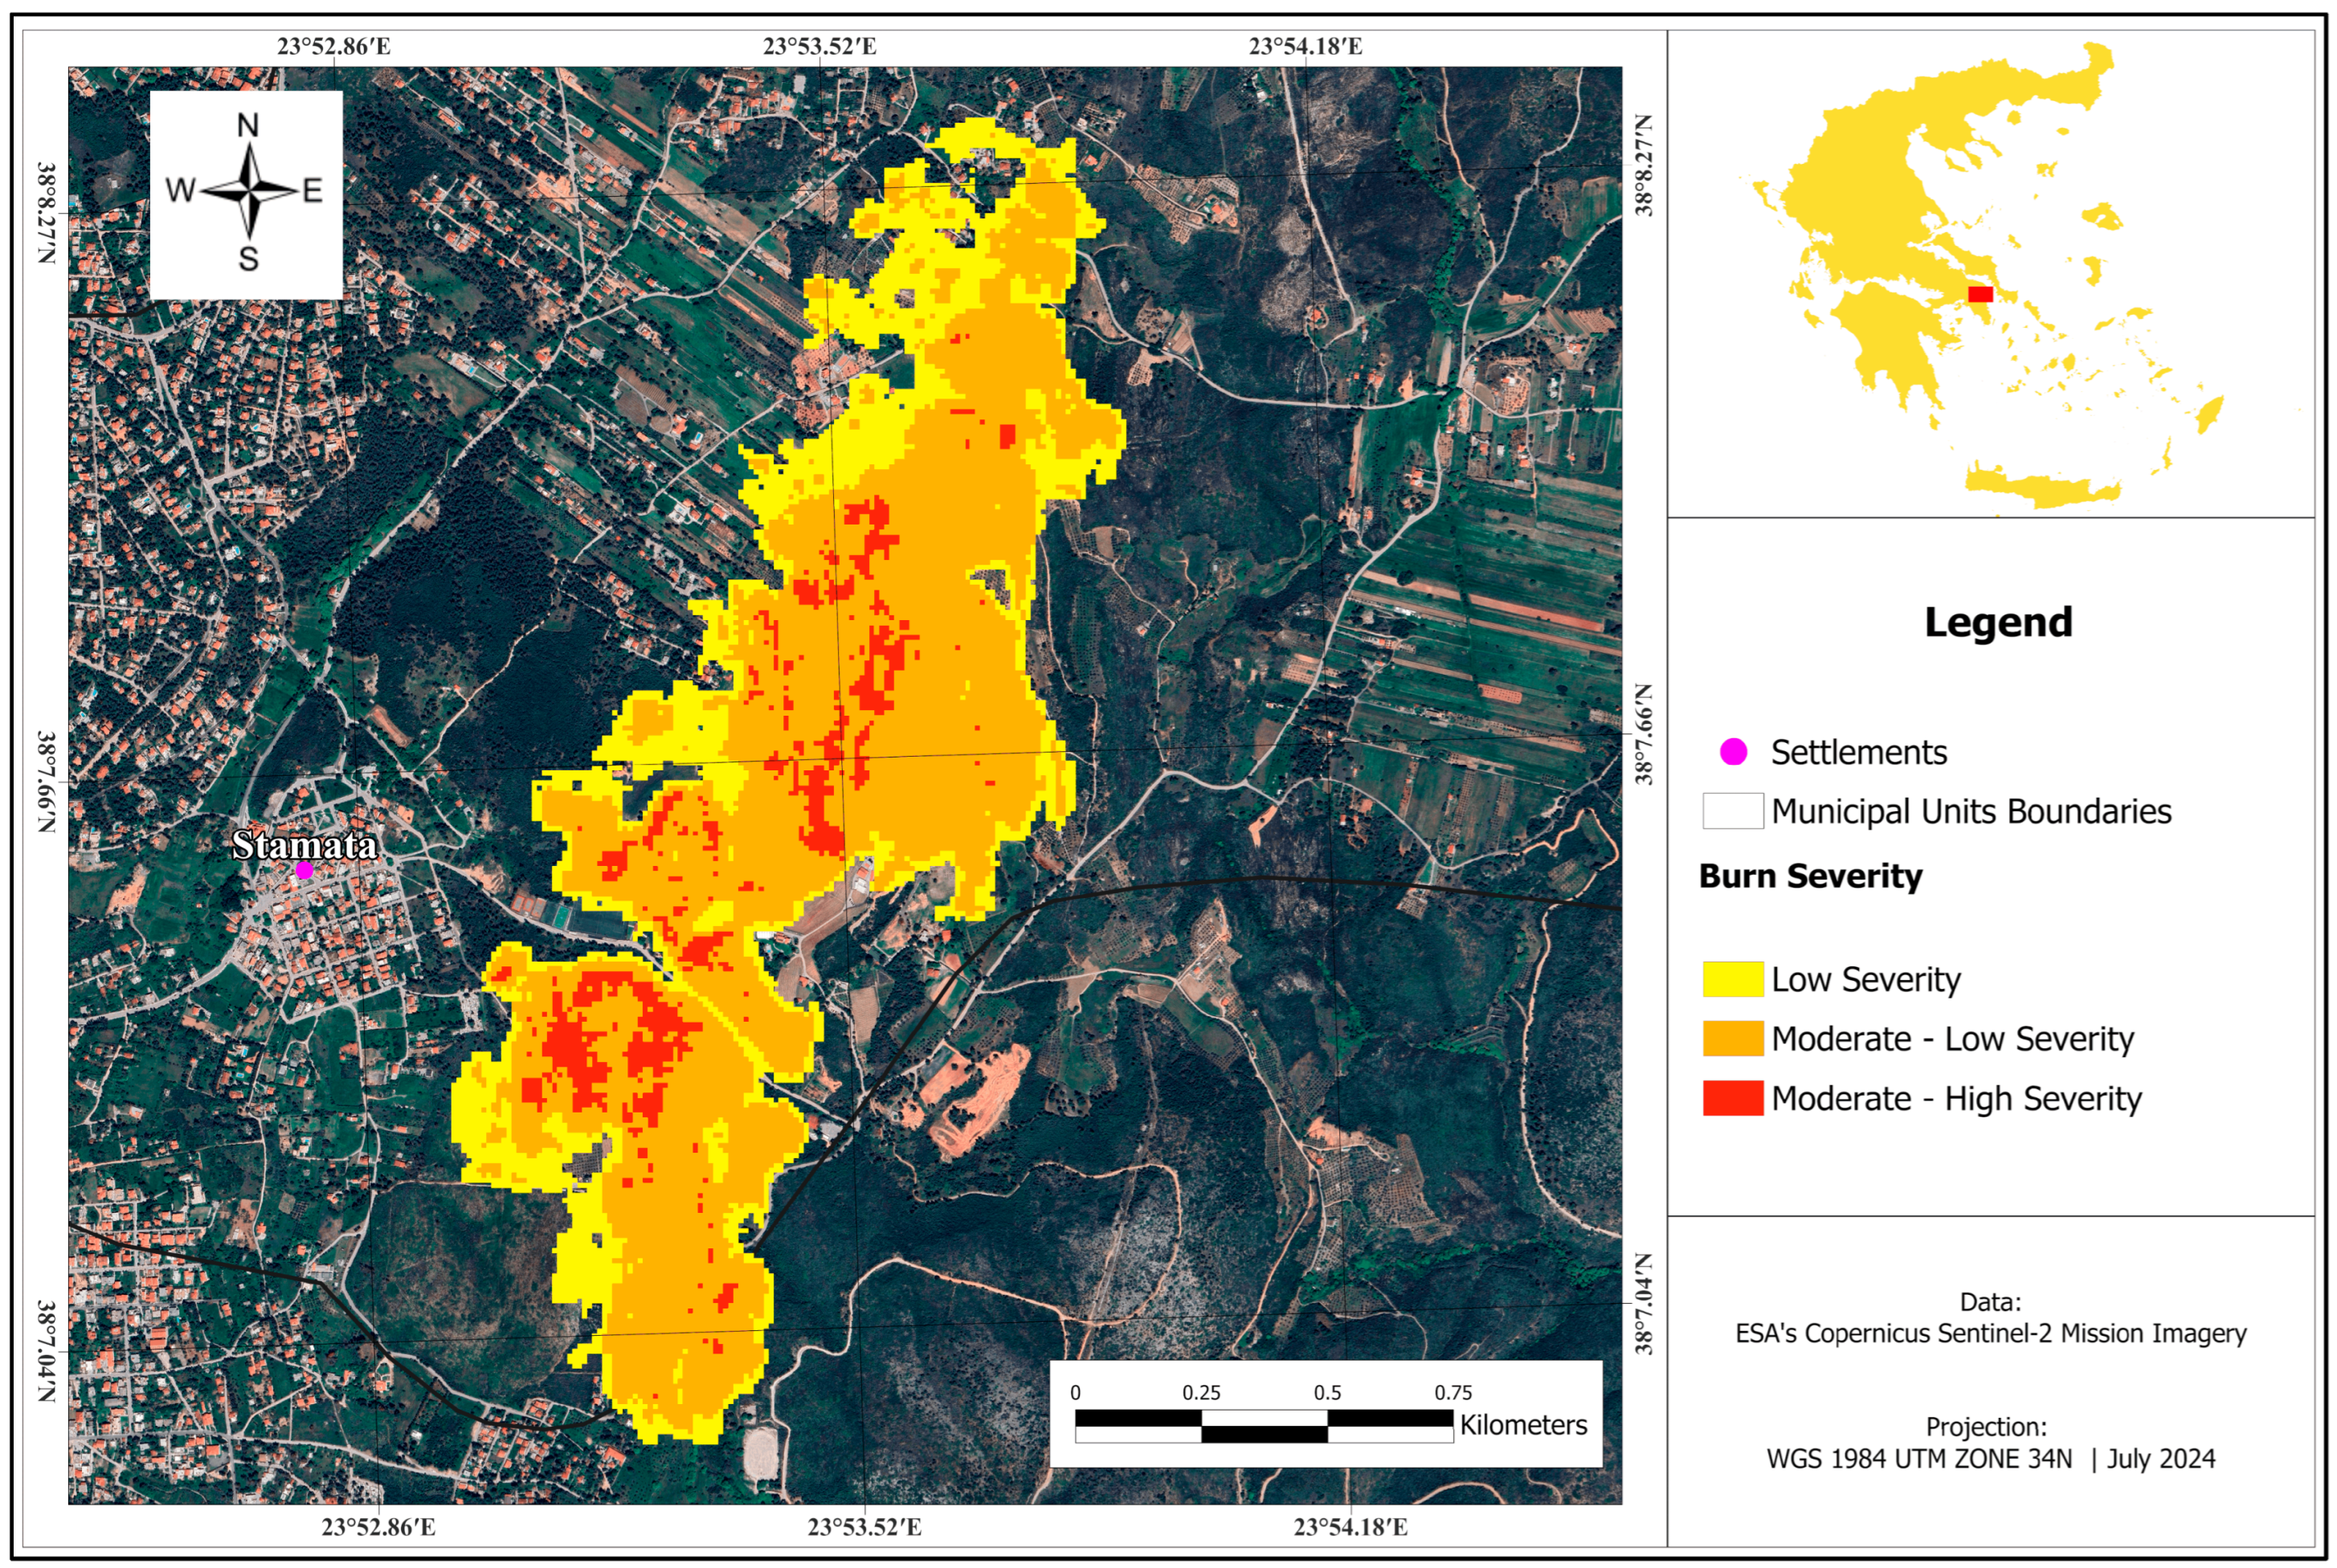
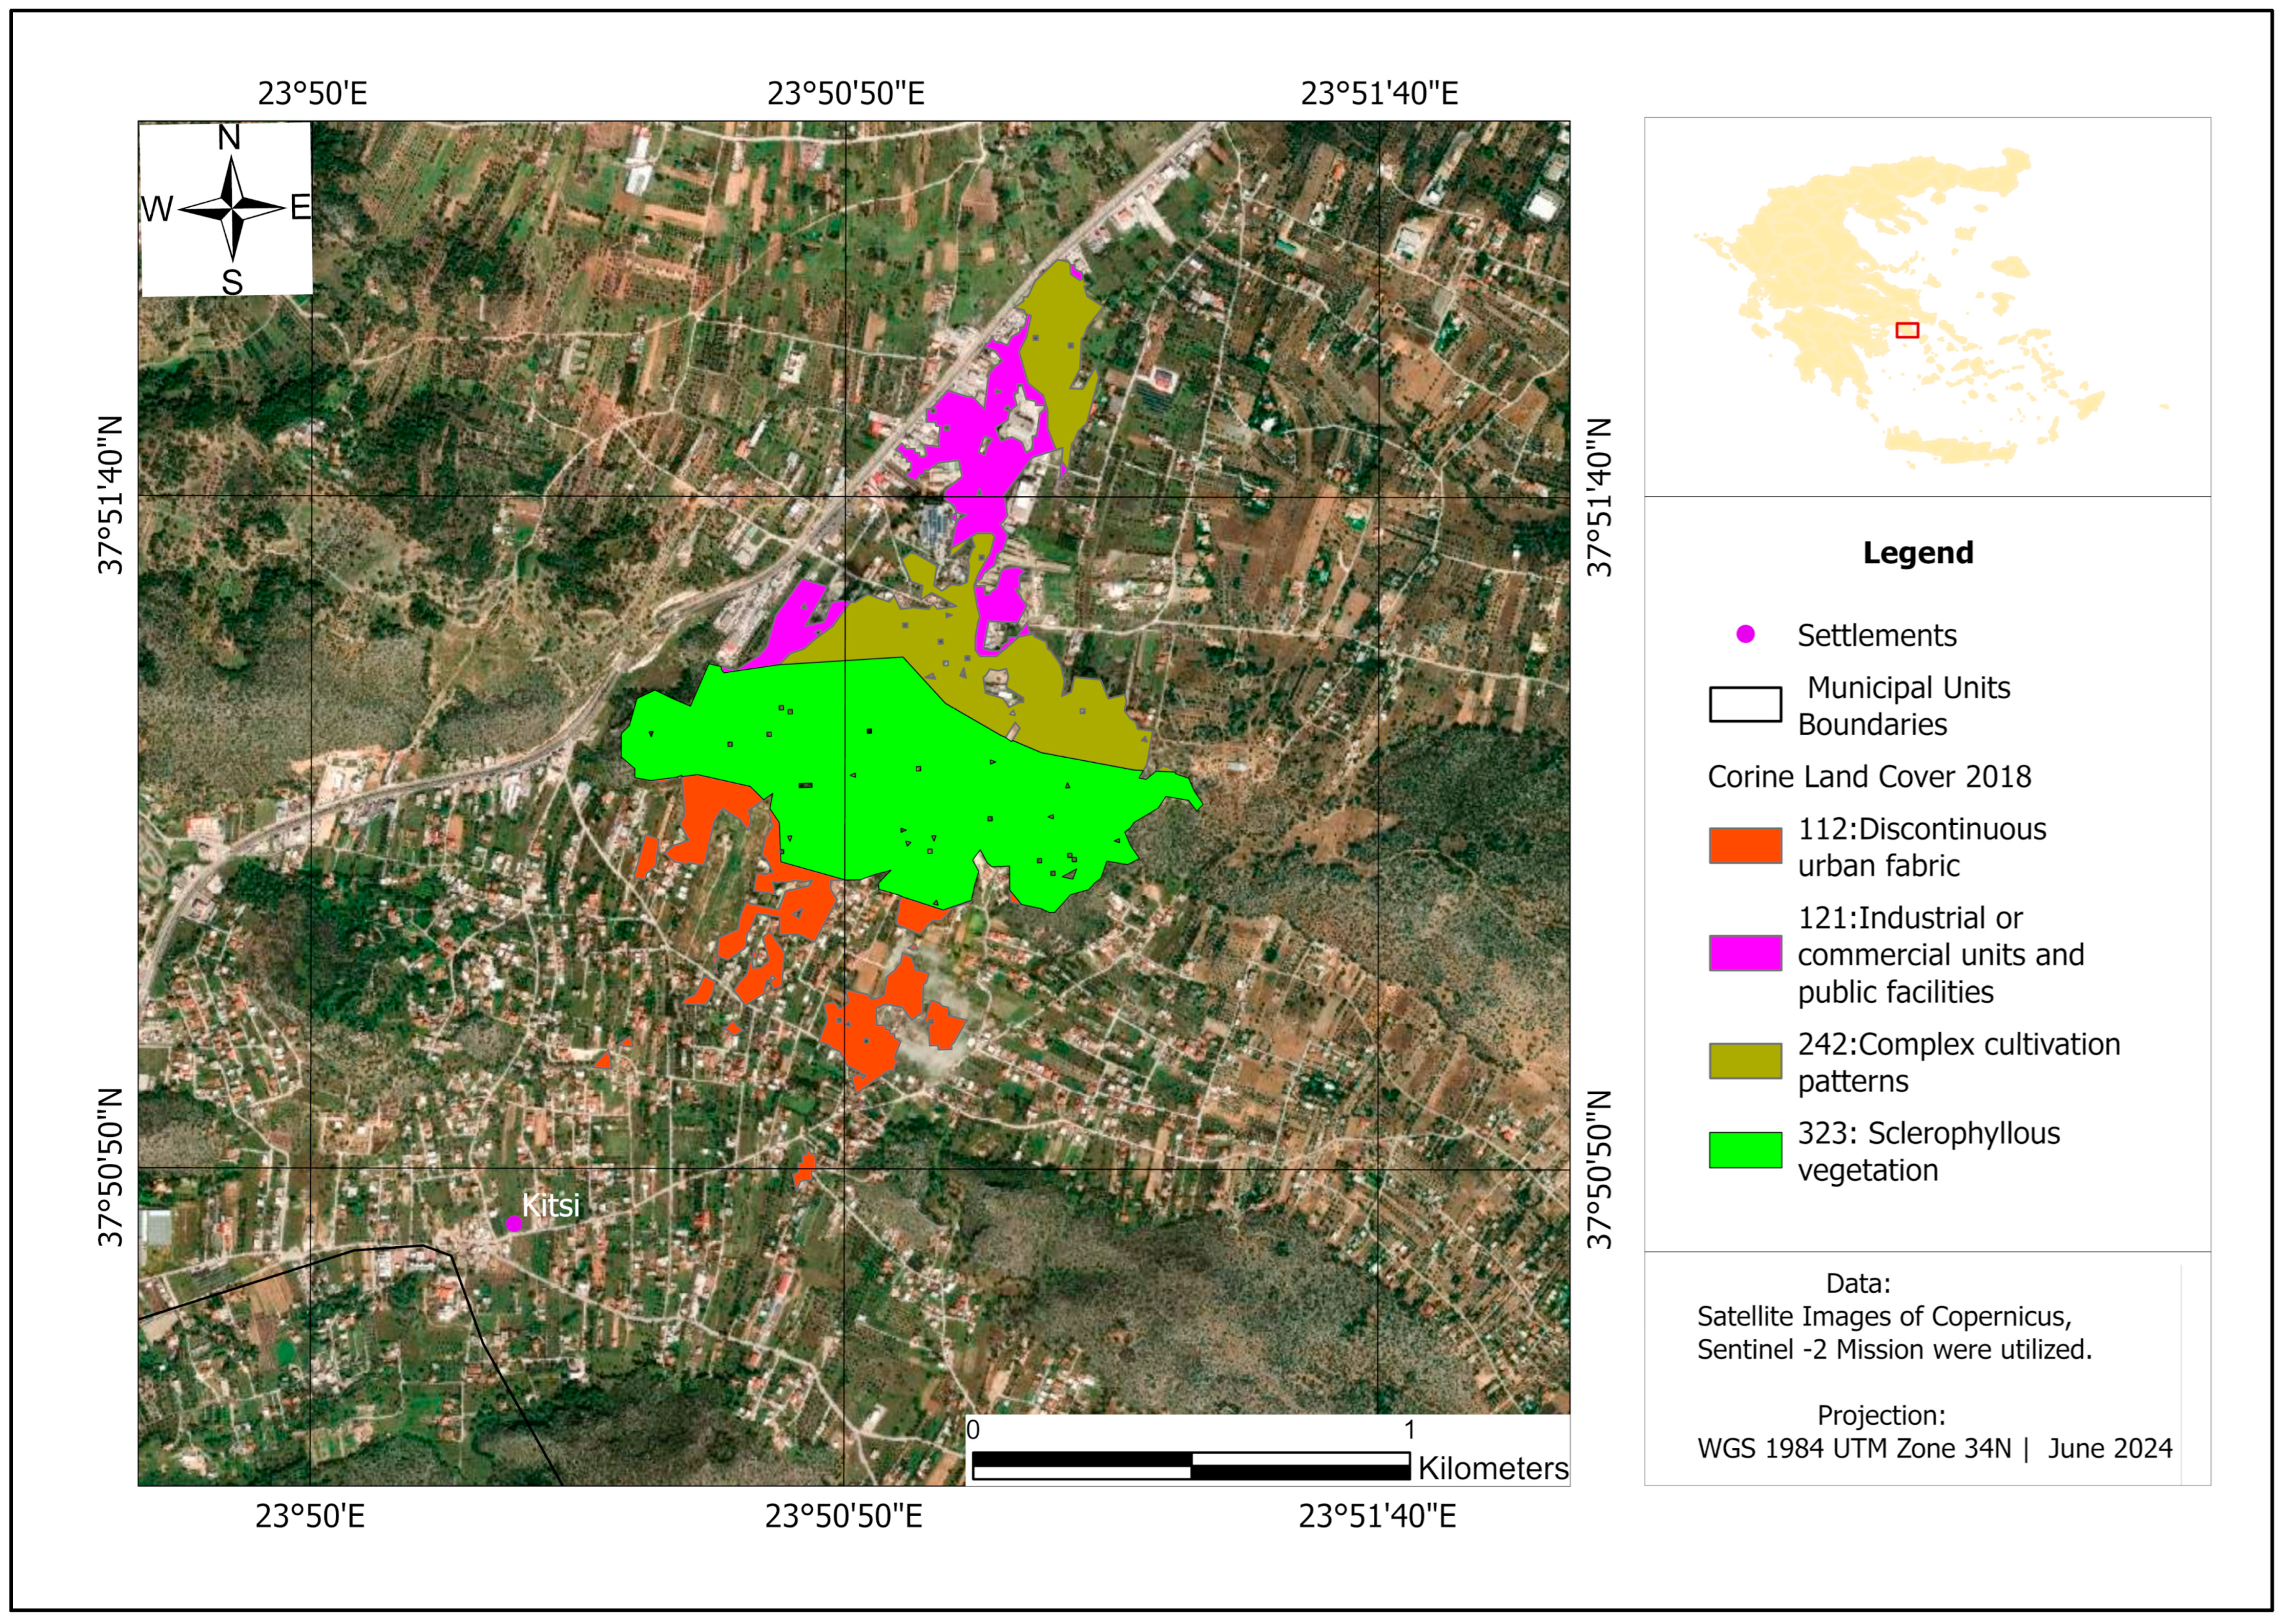
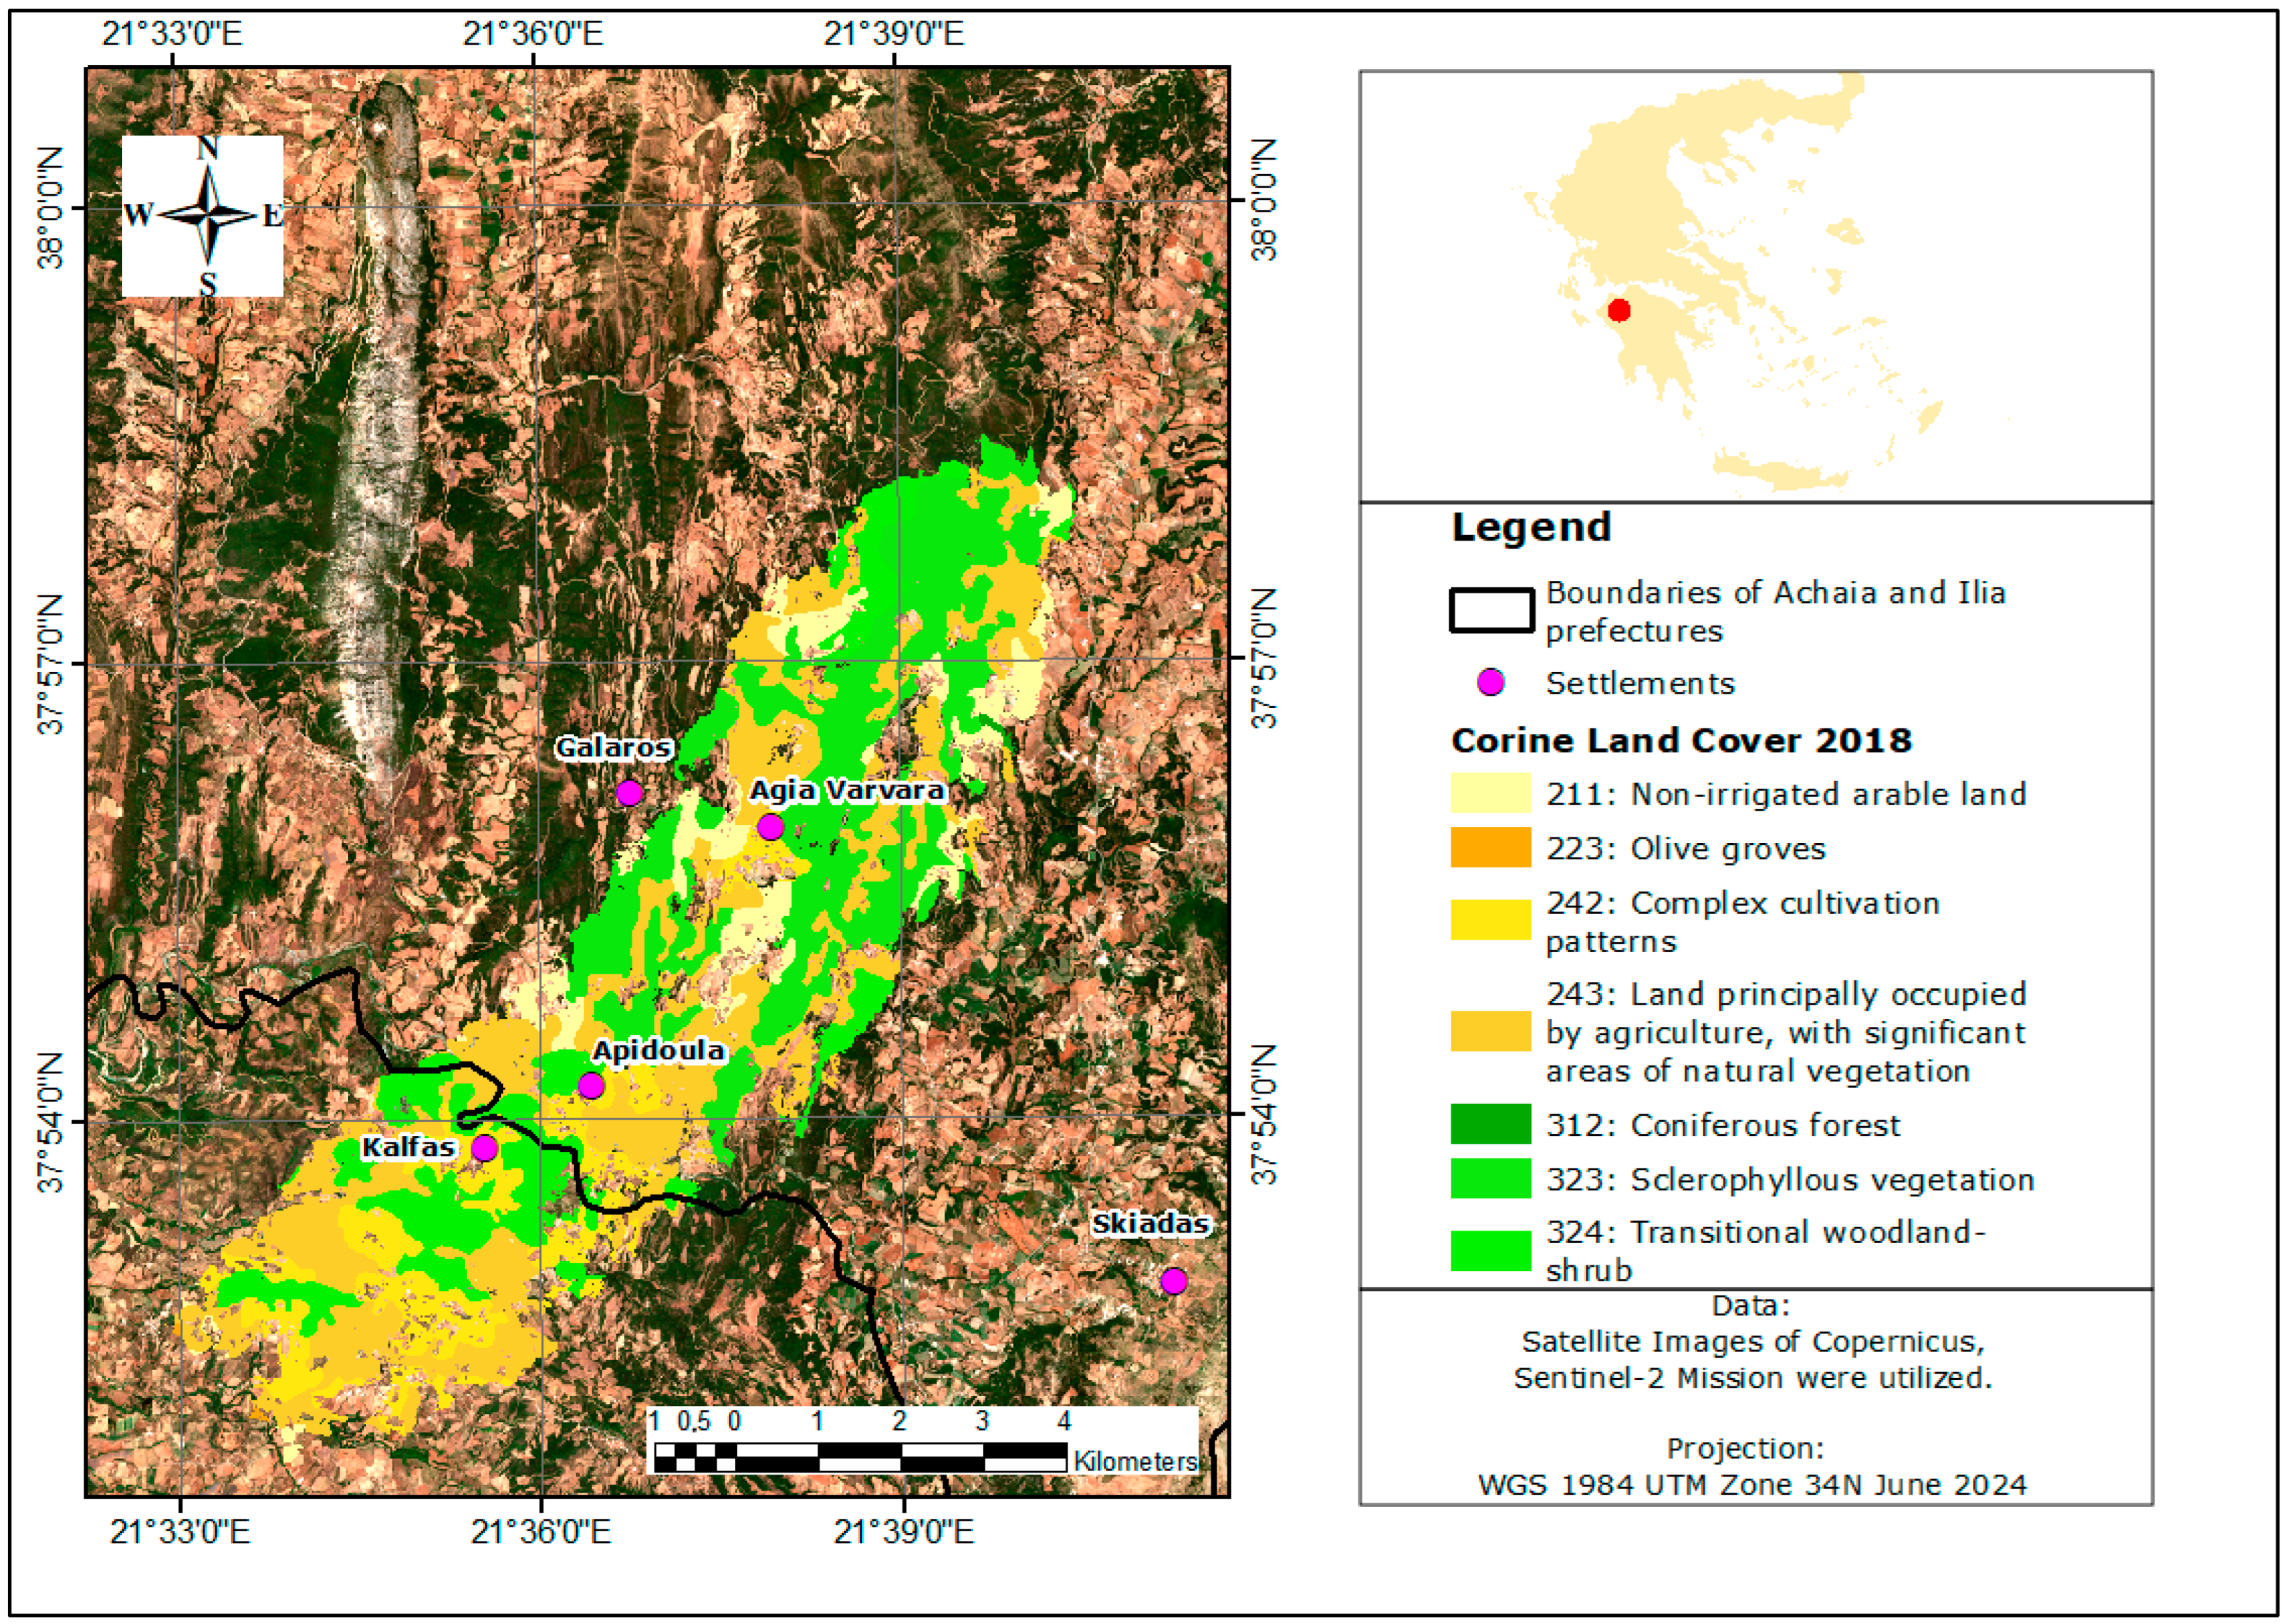

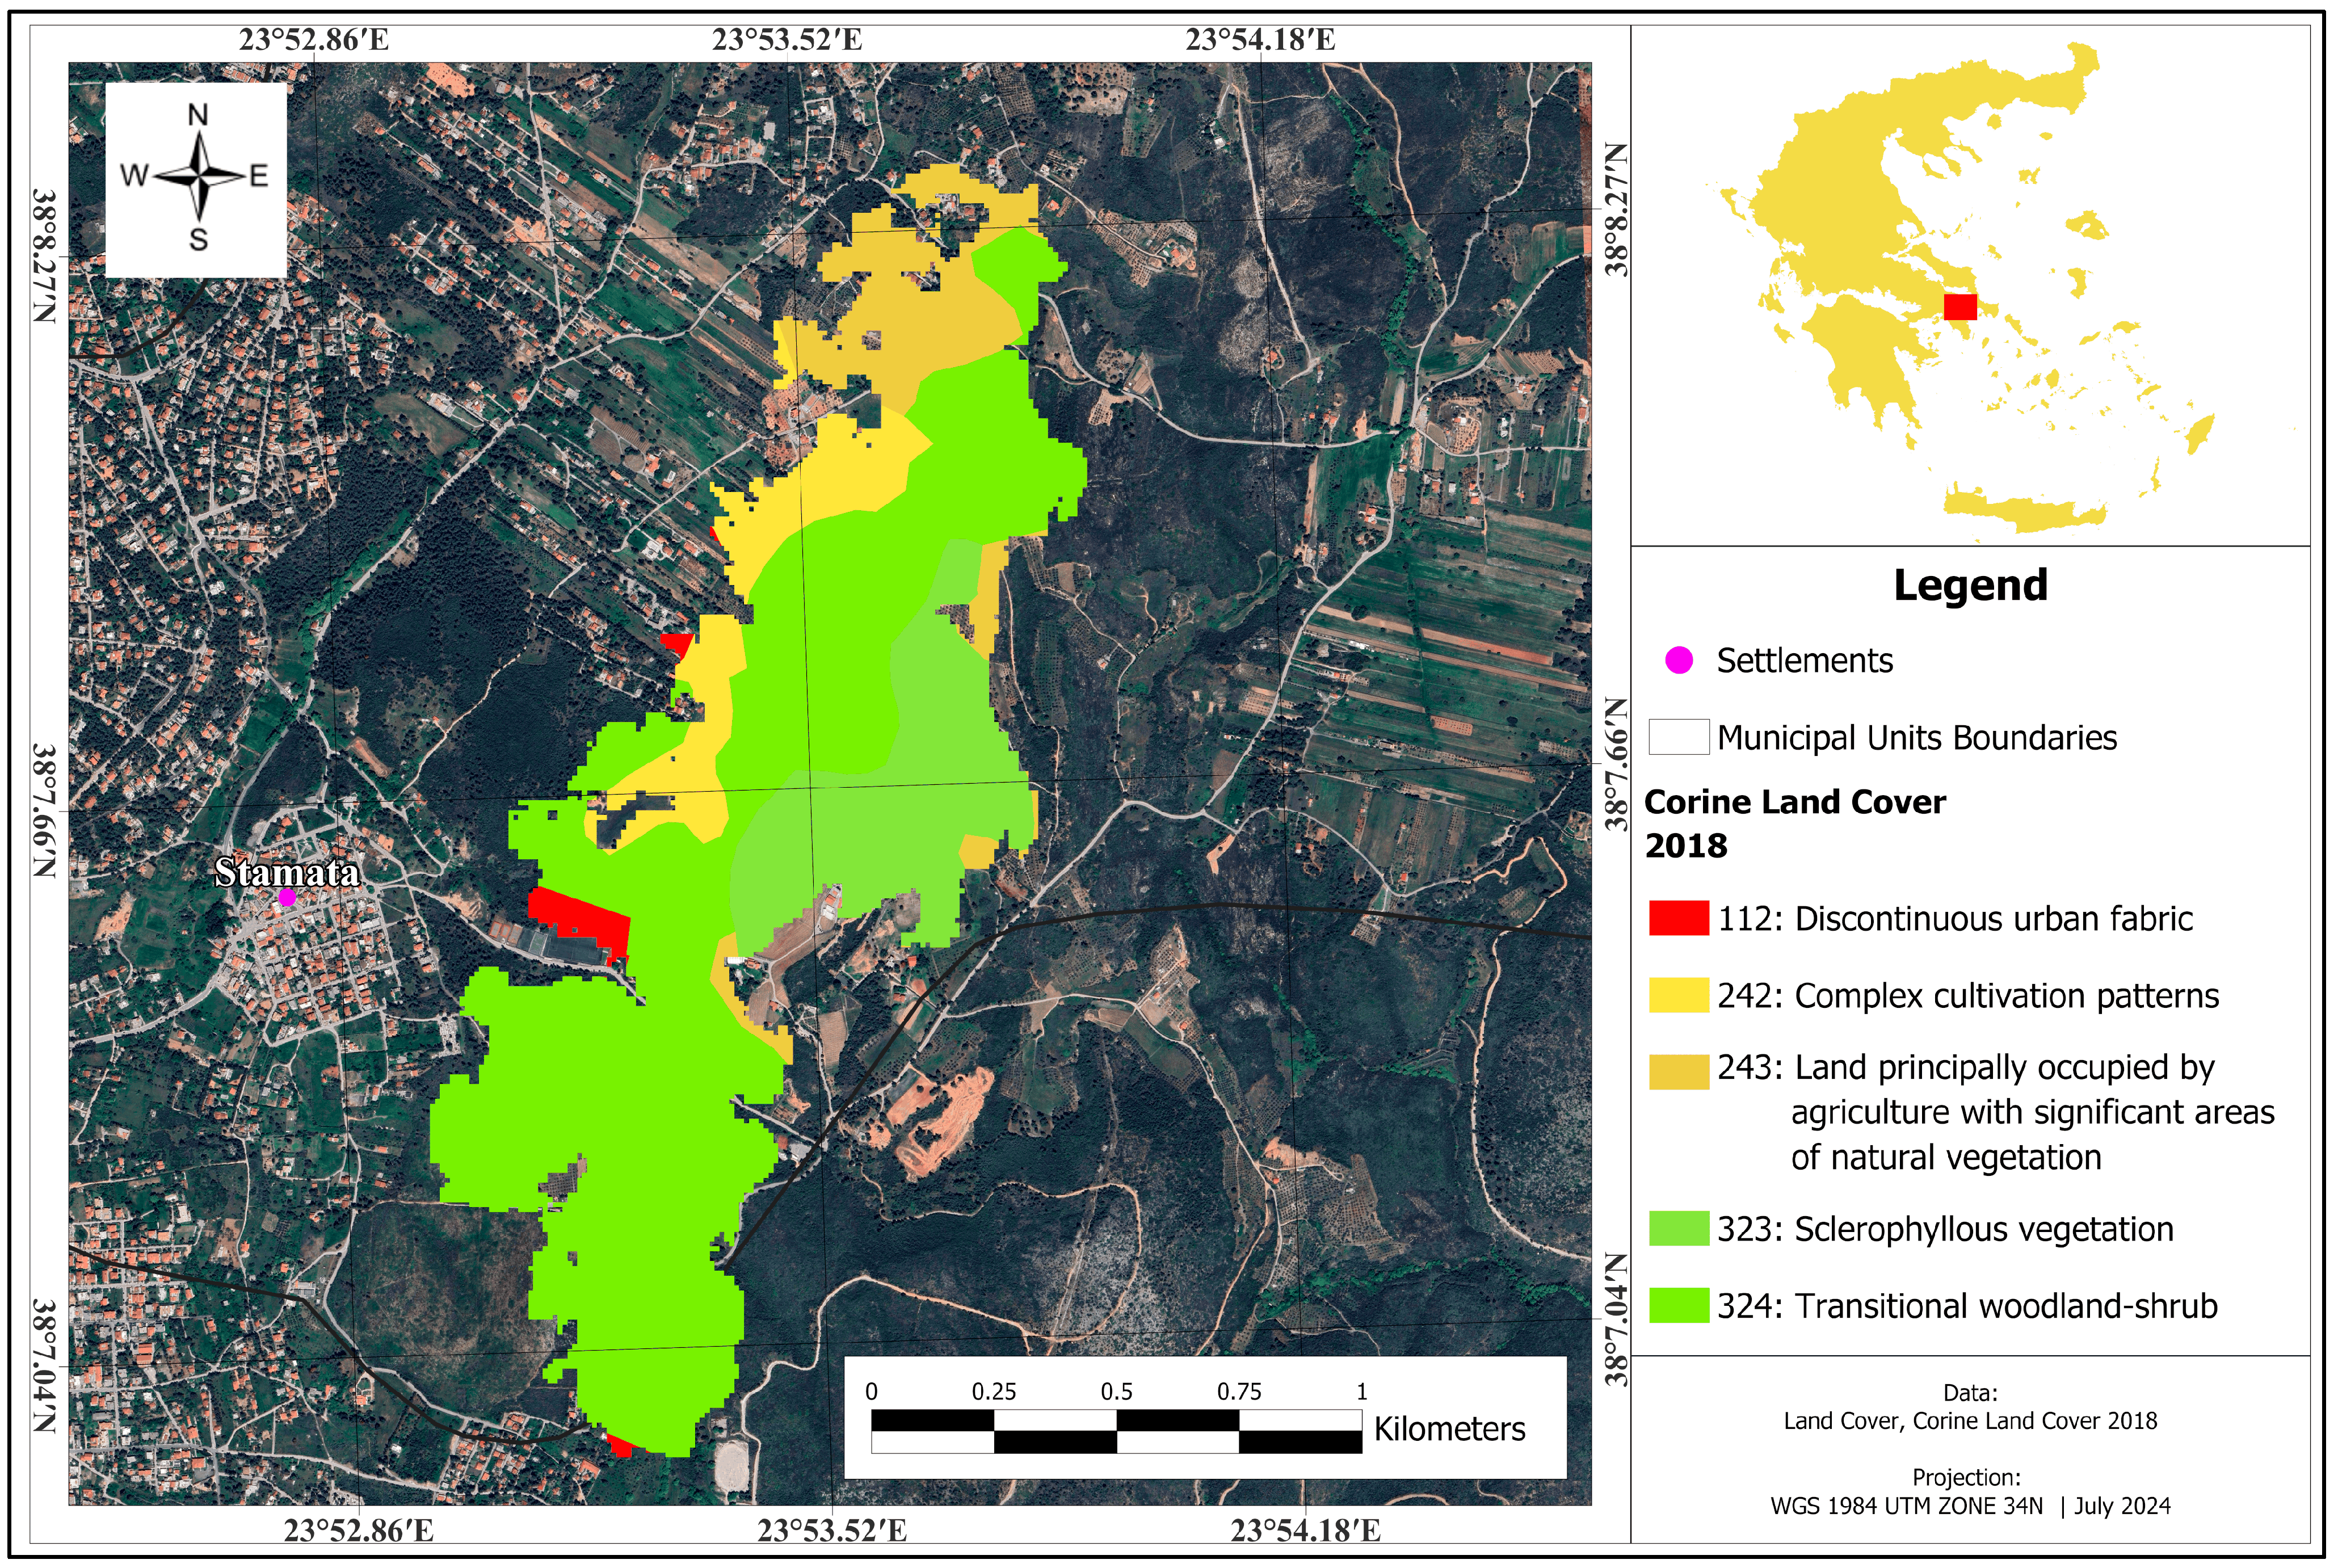
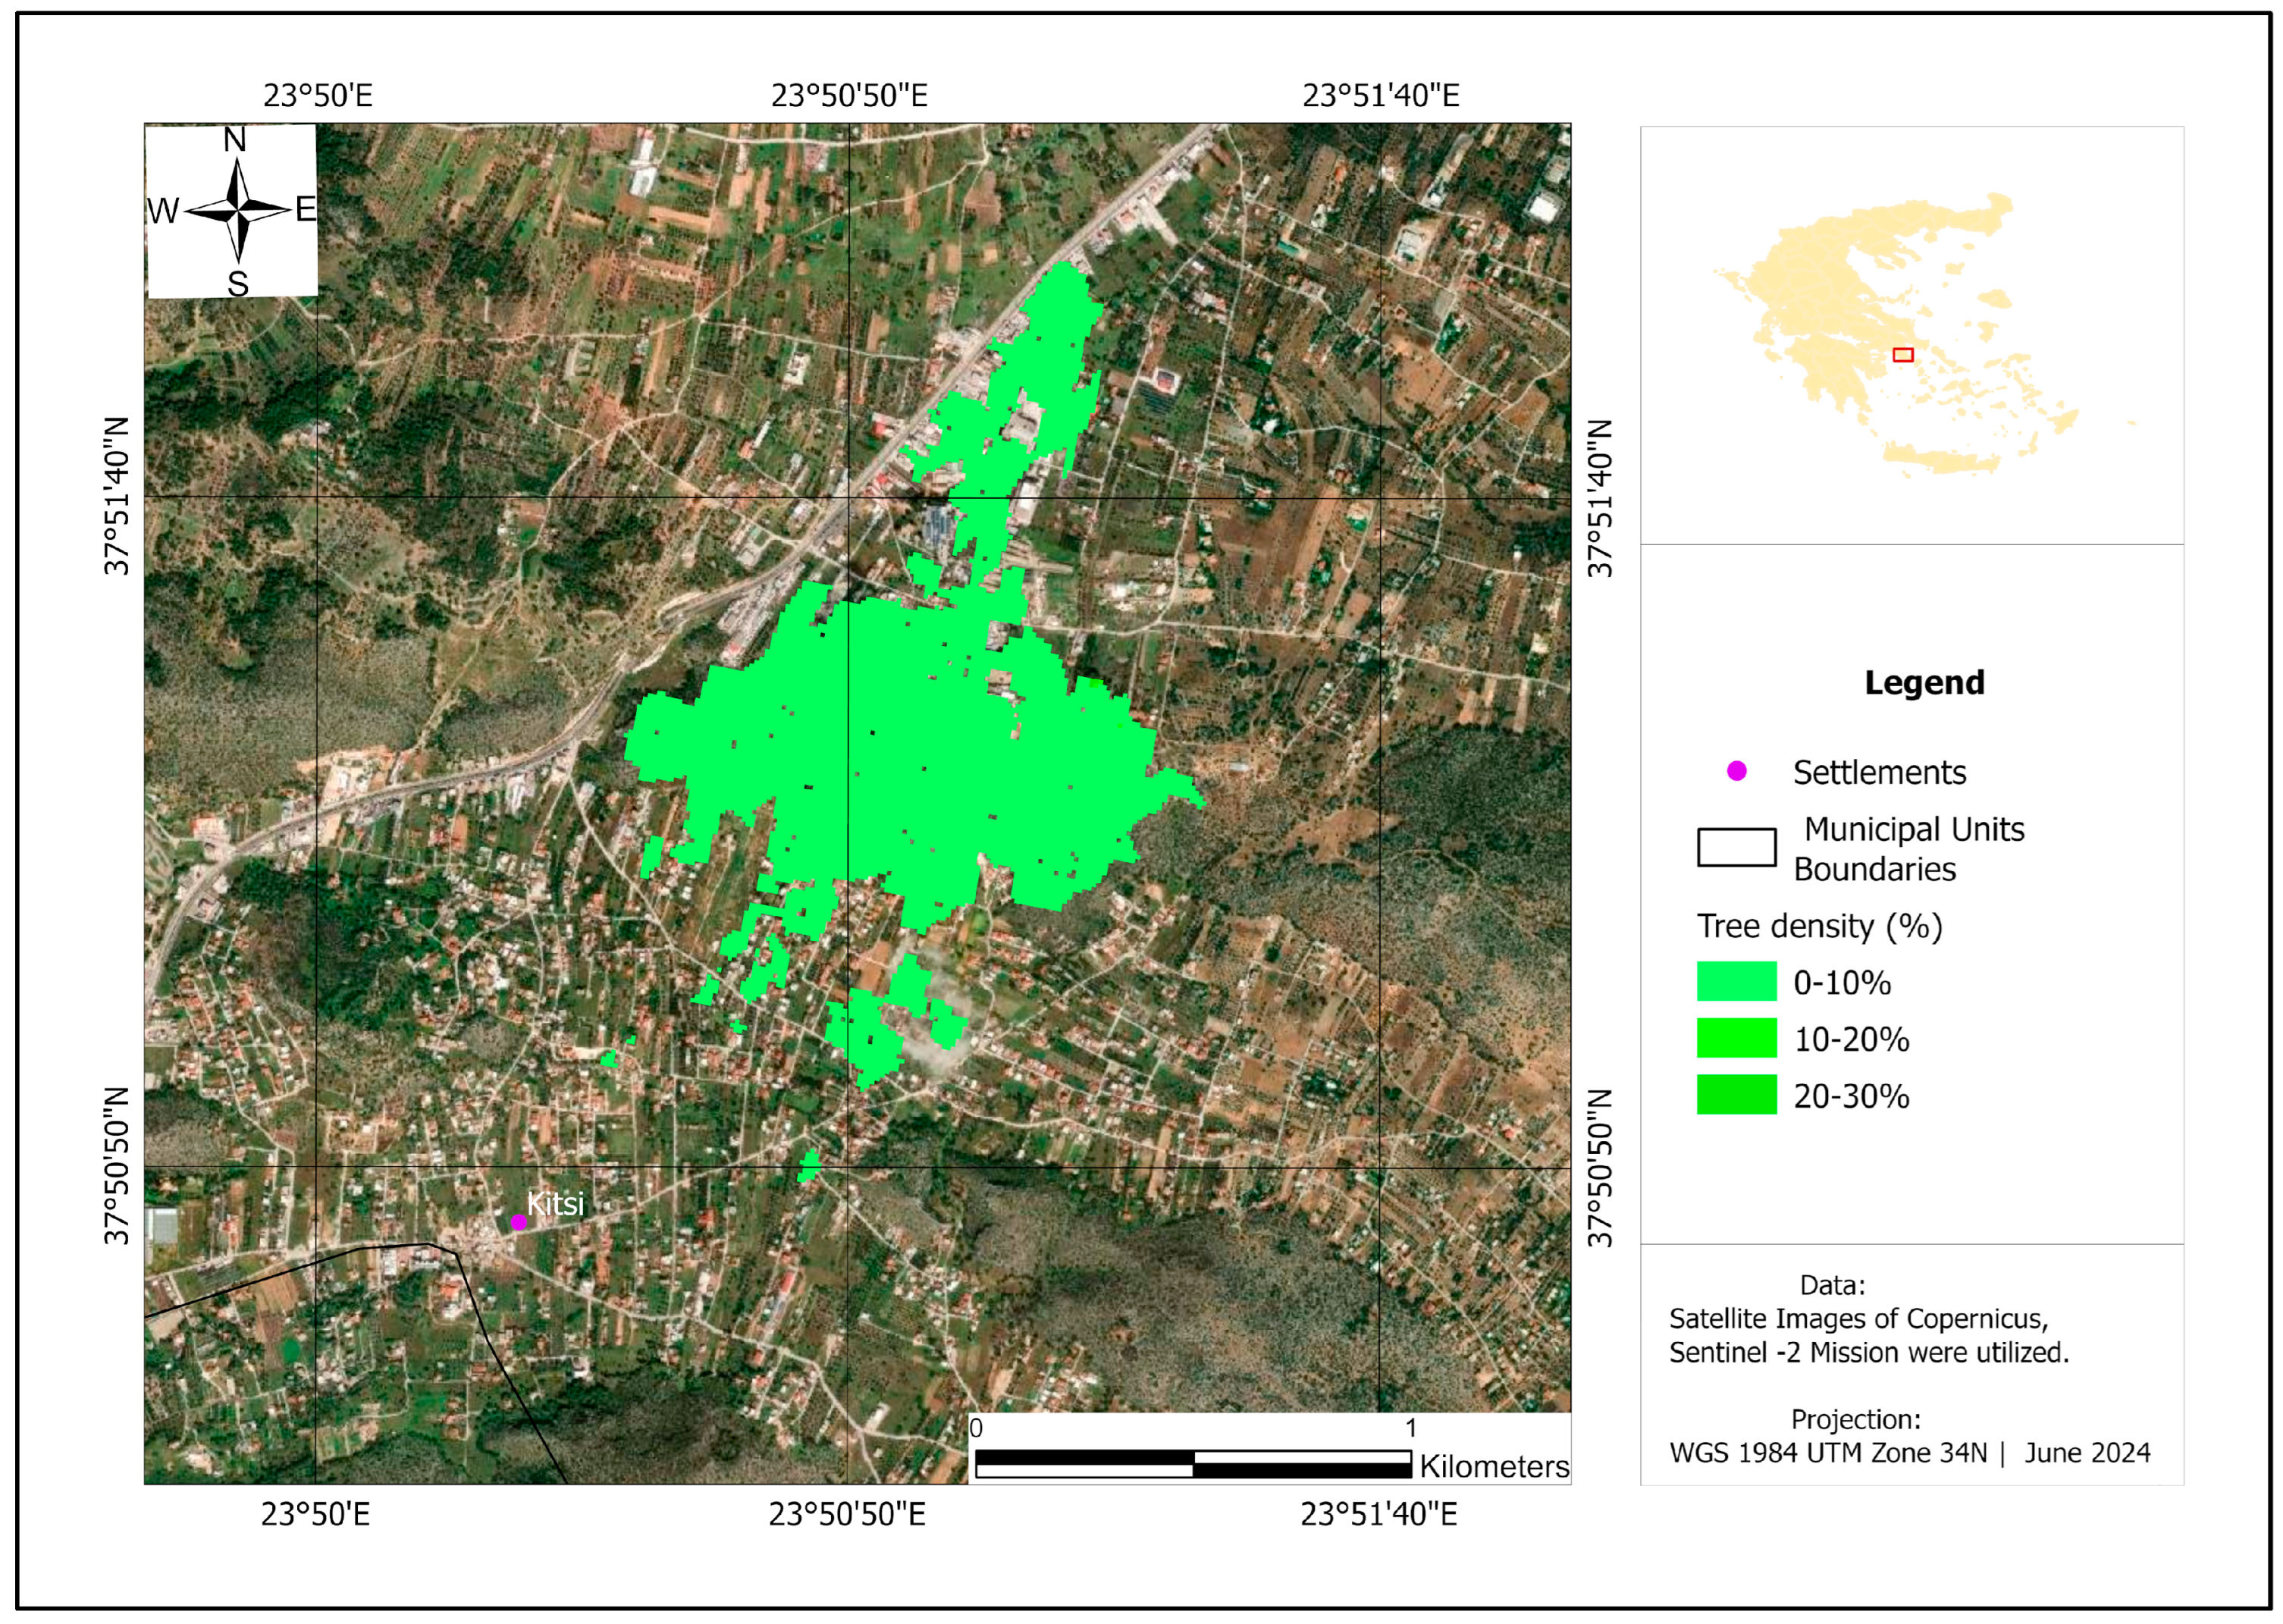
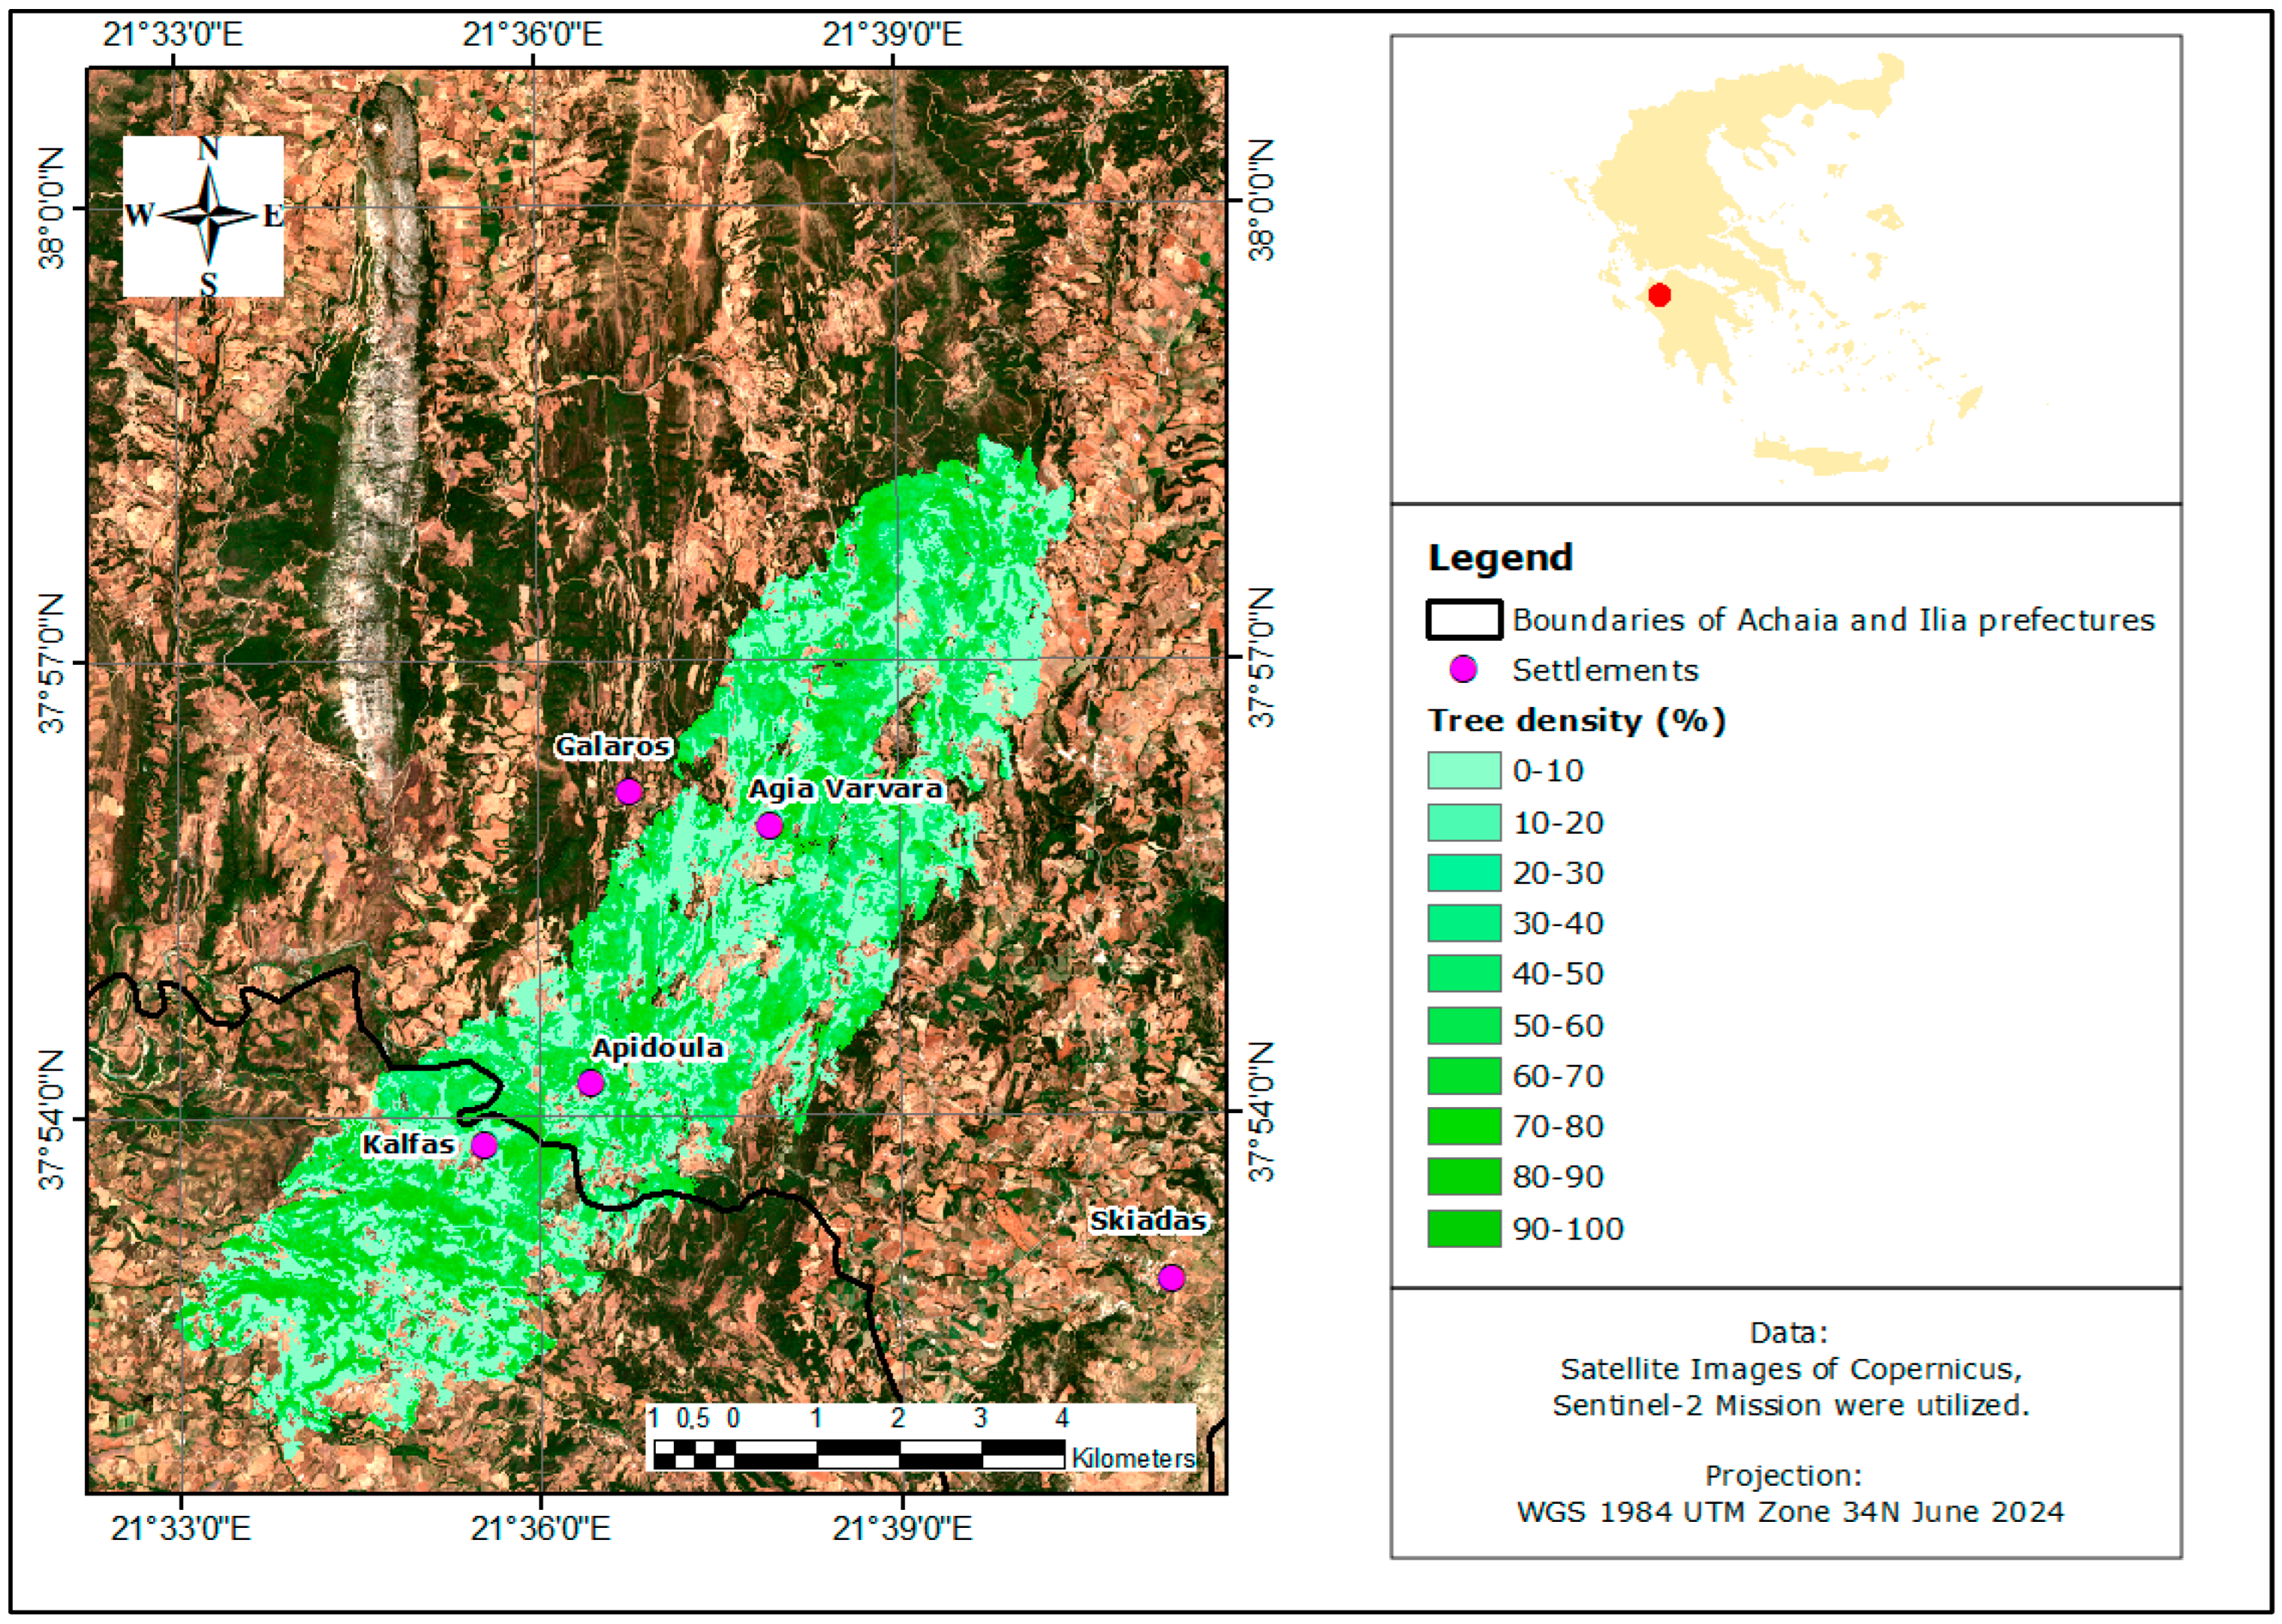
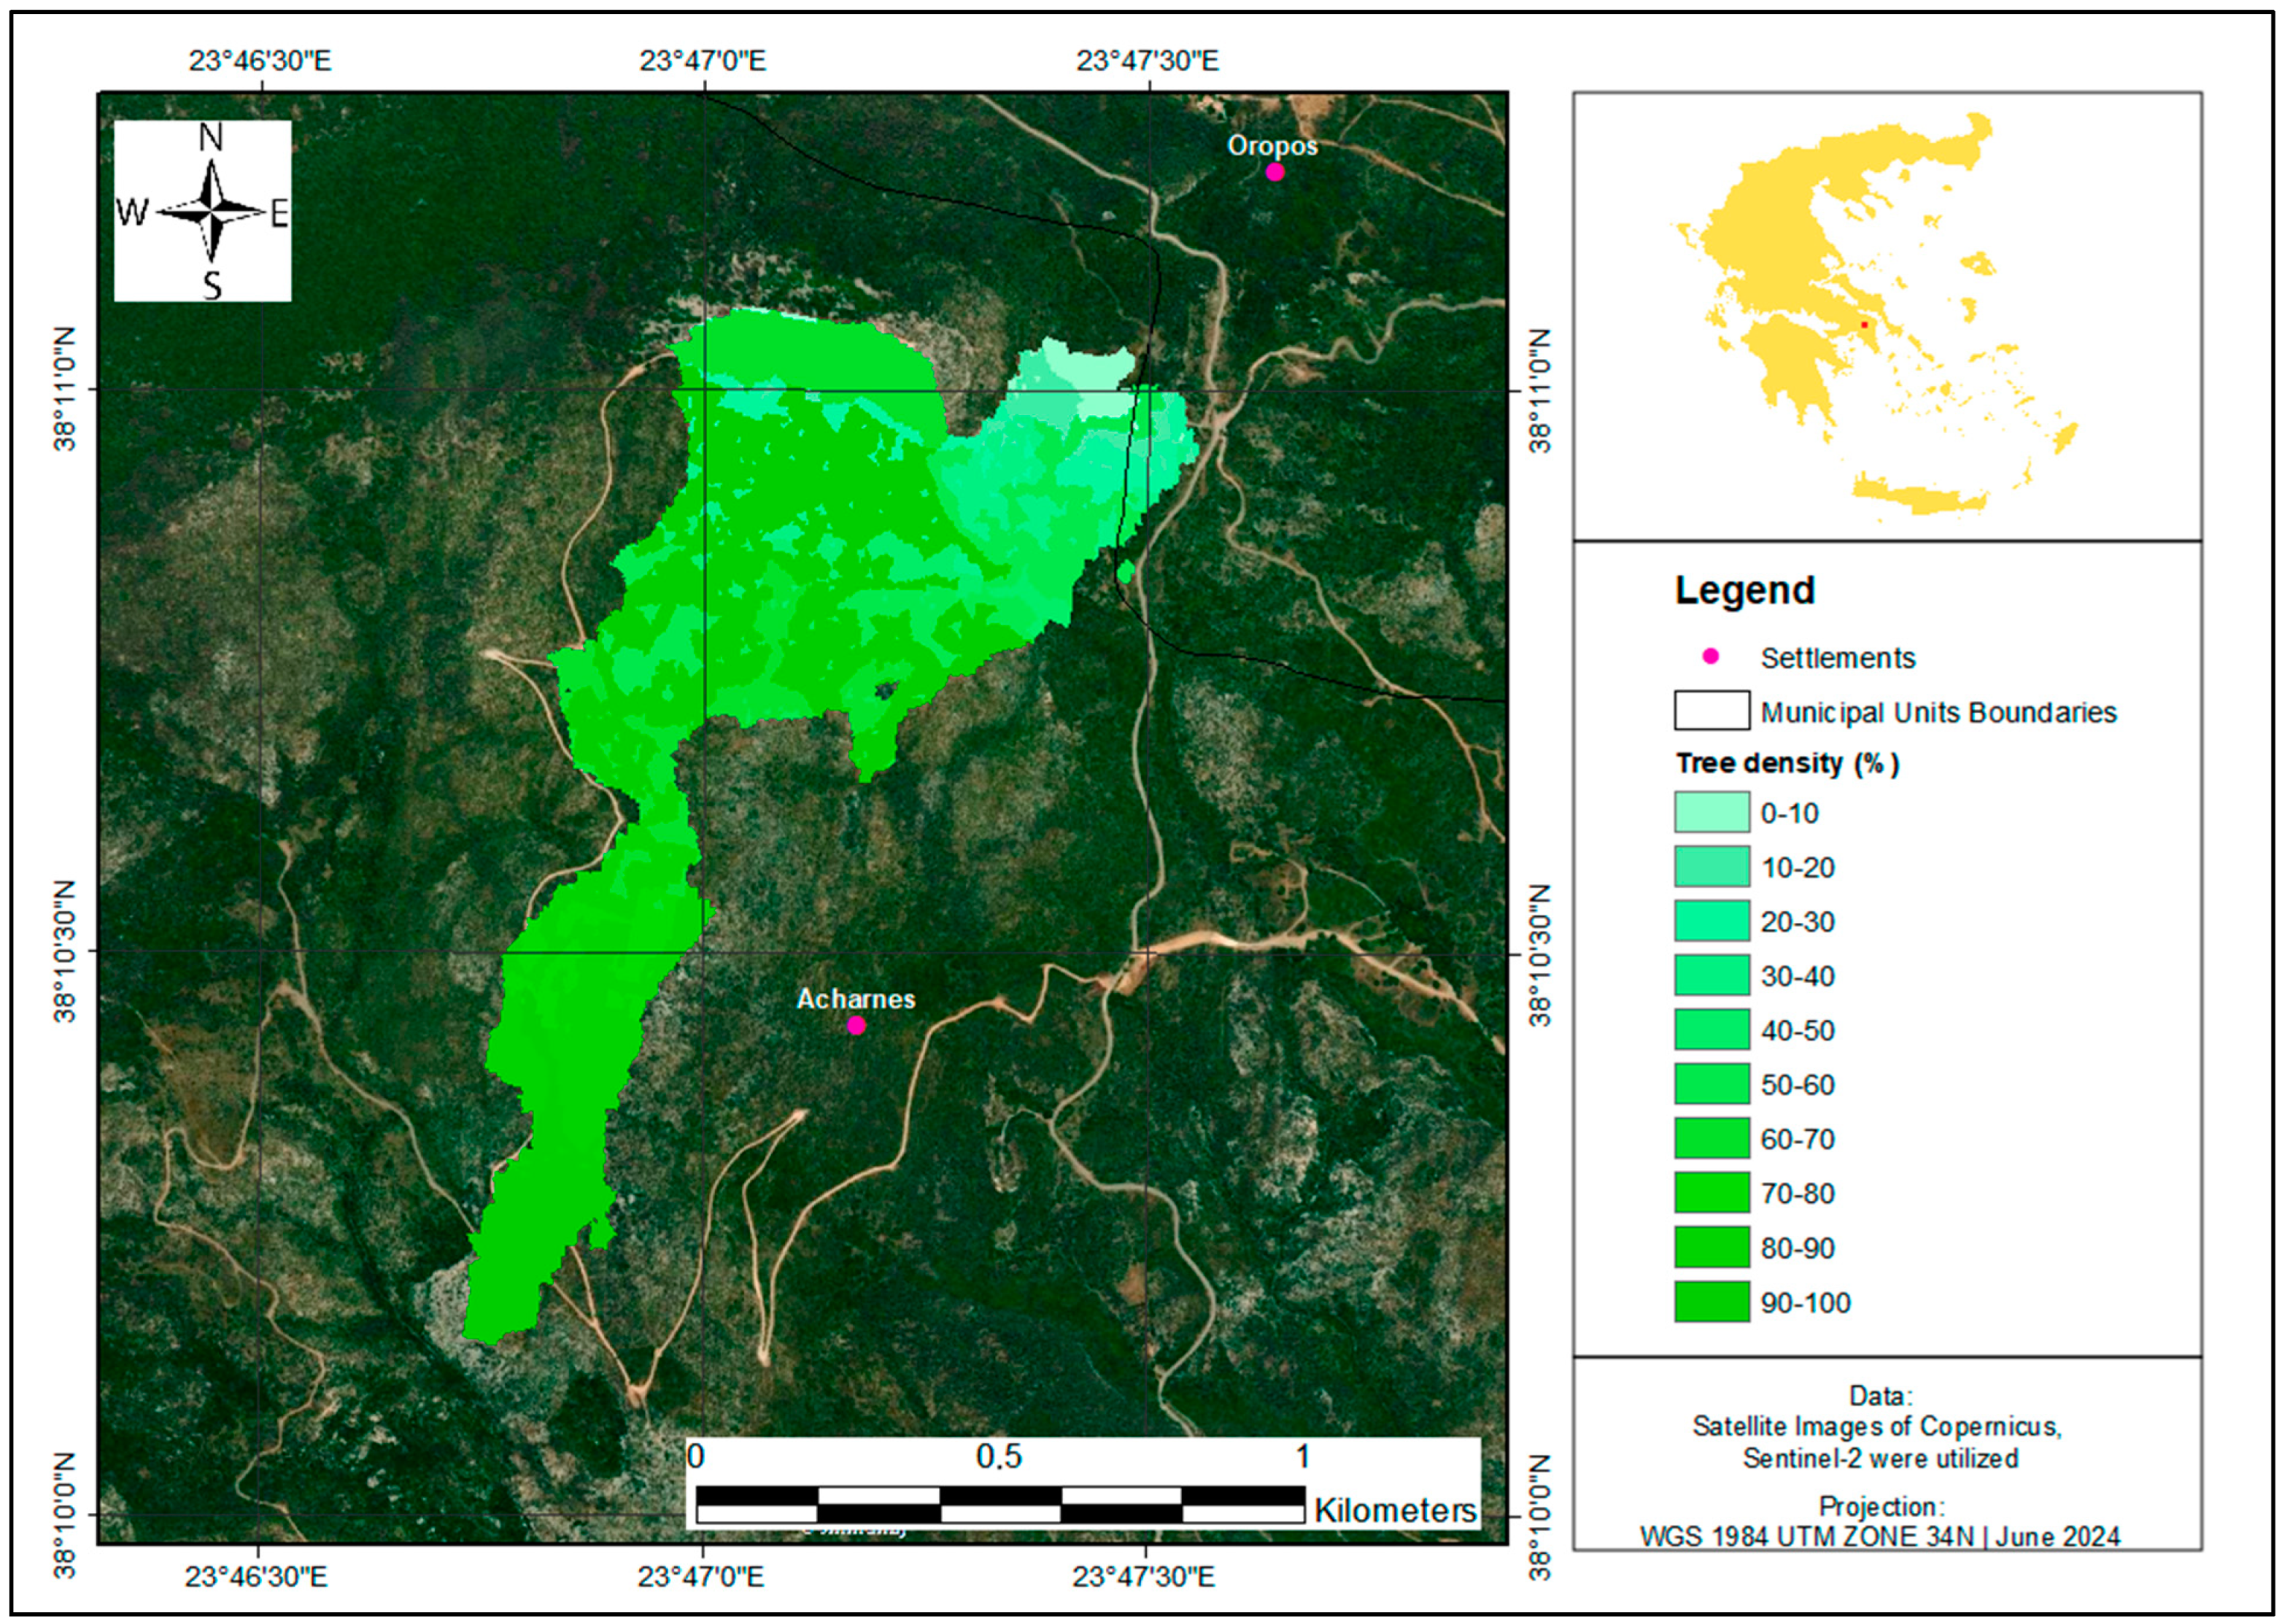
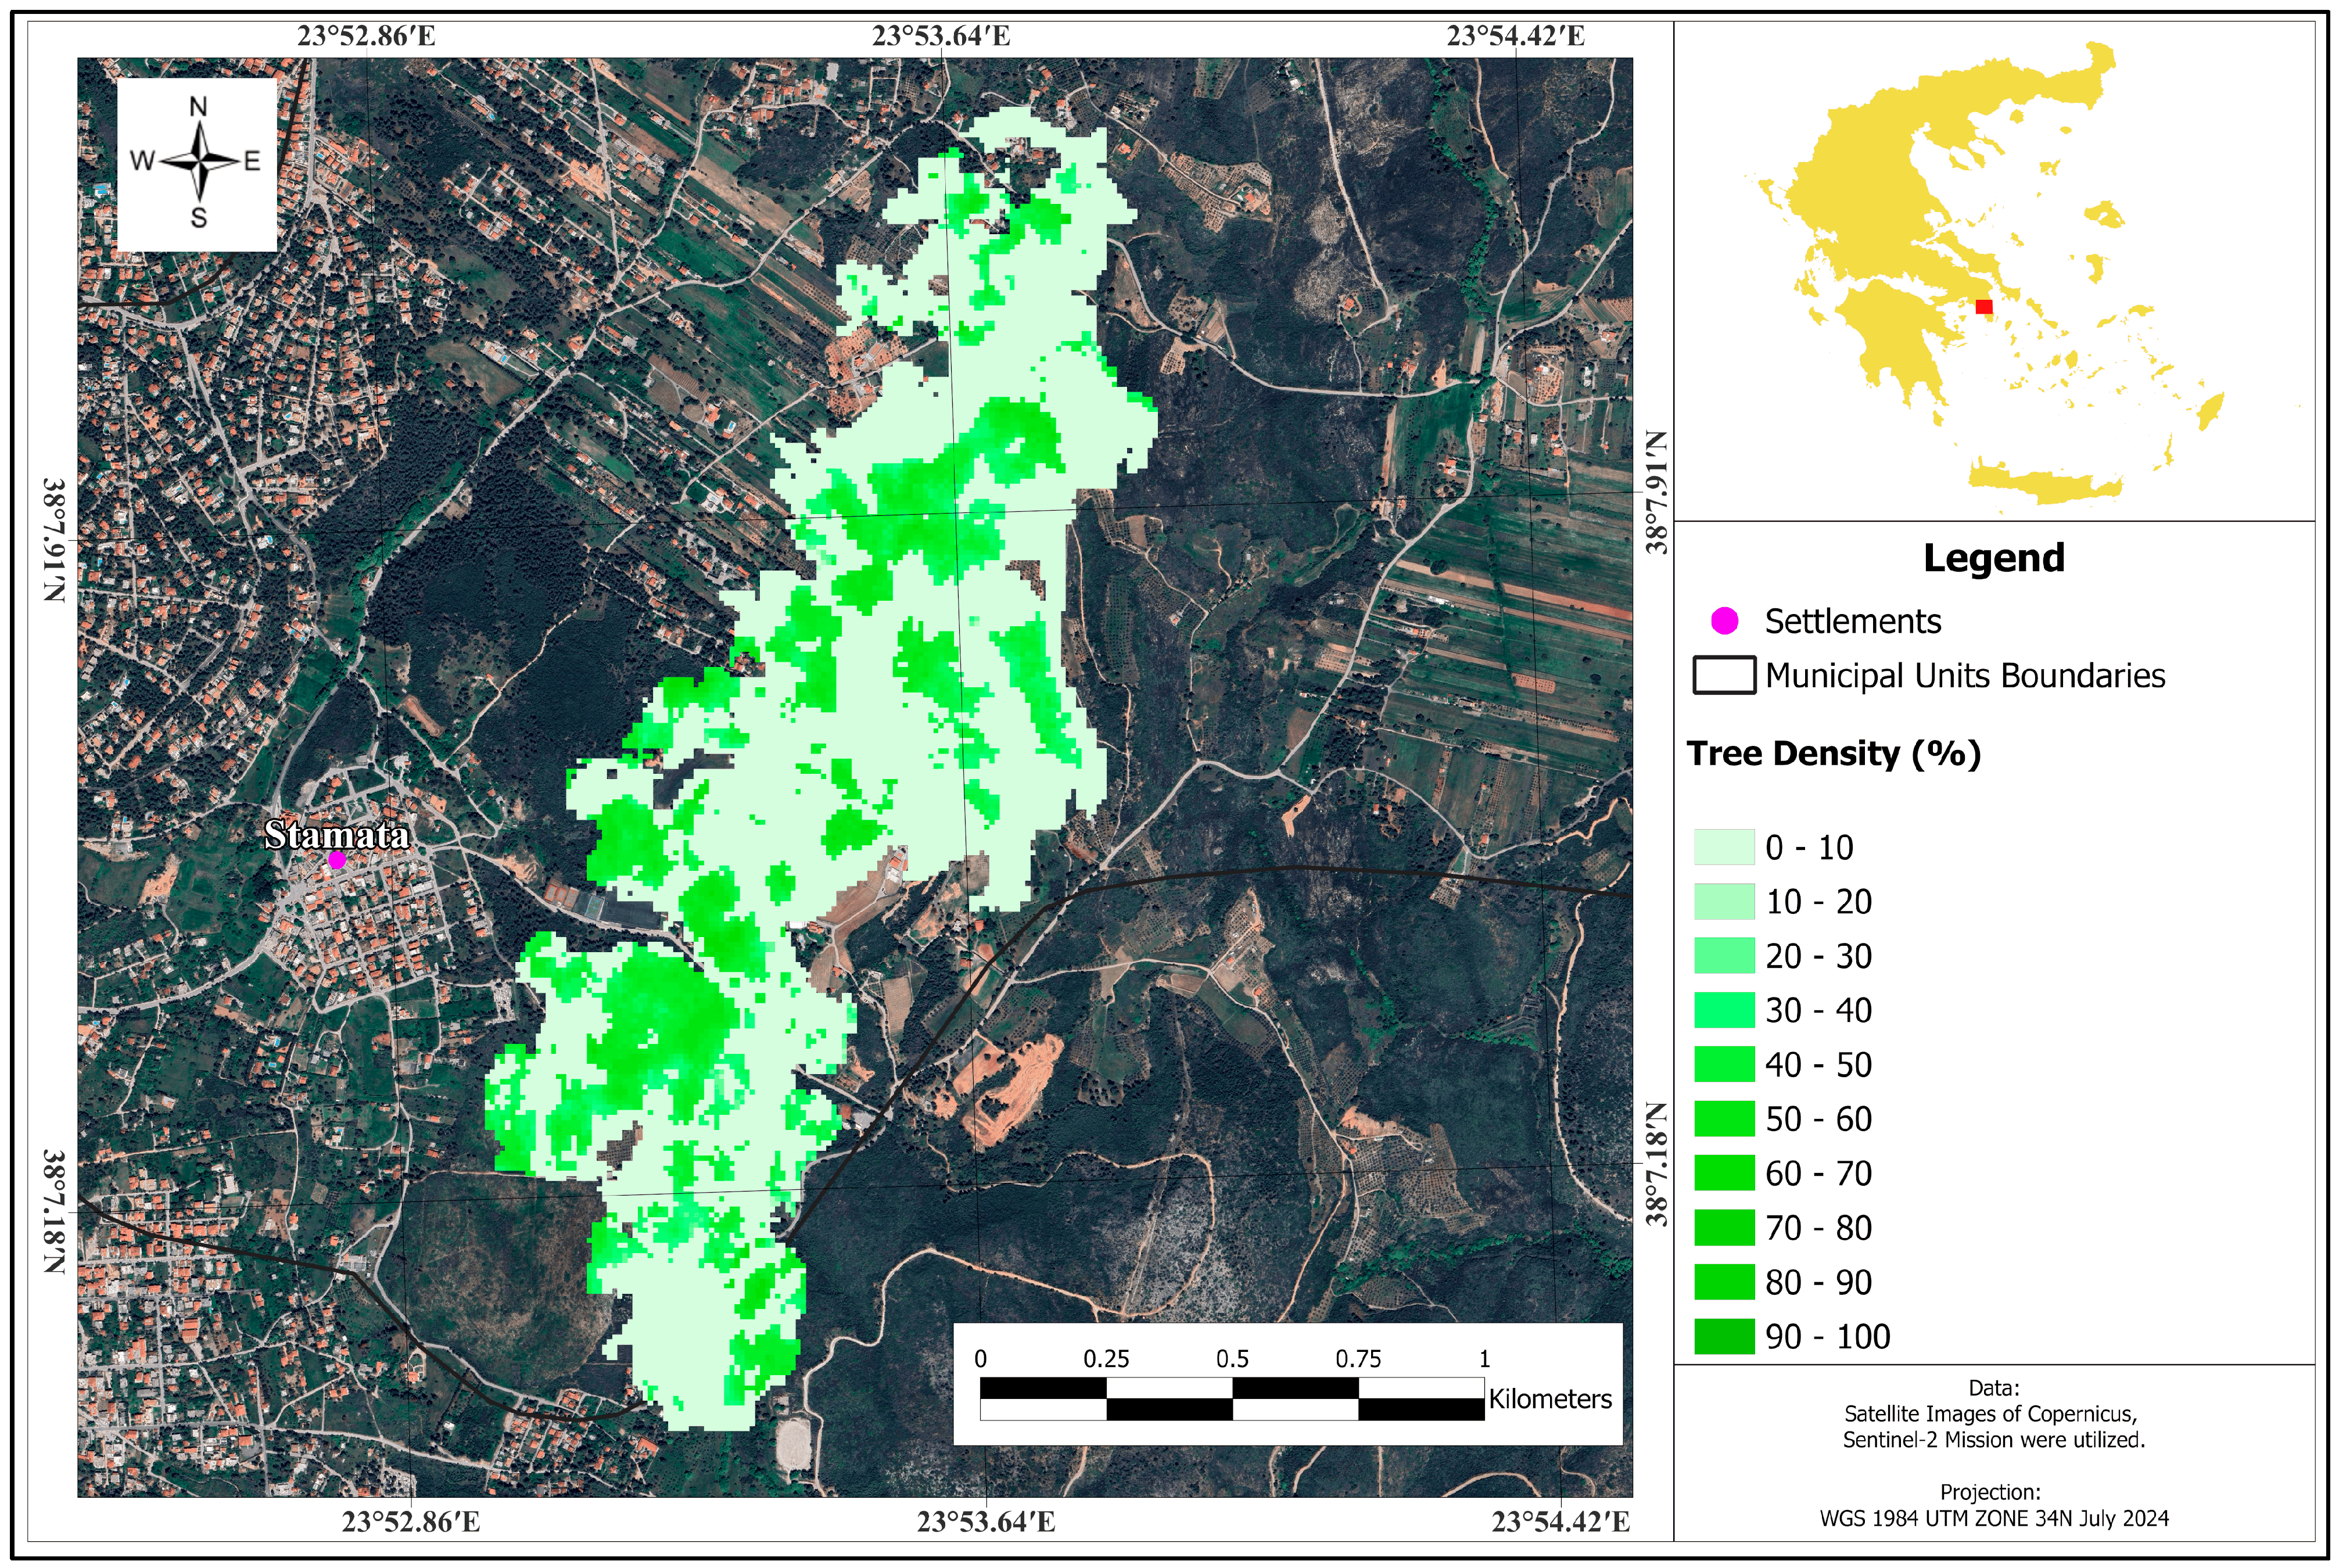
Disclaimer/Publisher’s Note: The statements, opinions and data contained in all publications are solely those of the individual author(s) and contributor(s) and not of MDPI and/or the editor(s). MDPI and/or the editor(s) disclaim responsibility for any injury to people or property resulting from any ideas, methods, instructions or products referred to in the content. |
© 2025 by the authors. Licensee MDPI, Basel, Switzerland. This article is an open access article distributed under the terms and conditions of the Creative Commons Attribution (CC BY) license (https://creativecommons.org/licenses/by/4.0/).