Article

Sodium Alginate as a Green Consolidant for Waterlogged Wood—A Preliminary Study †

1
Department of Earth Sciences, Sapienza University of Rome, P.le Aldo Moro 5, 00185 Rome, Italy
2
Petru Poni Institute of Macromolecular Chemistry of the Romanian Academy, 41A Grigore Ghica Voda Alley, 700487 Iasi, Romania
3
School of Computing, Engineering and the Built Environment, Edinburgh Napier University, Unit 1, Seven Hills Business Park, 37 Bankhead Crossway South, Edinburgh EH11 4EP, UK
4
NanoBioMedical Centre, Adam Mickiewicz University, Wszechnicy Piastowskiej 3, 61-614 Poznan, Poland
5
National Research Council Institute for Complex Systems (CNR-ISC) c/o Physics Department, Sapienza University of Rome, P.le Aldo Moro 5, 00185 Rome, Italy
6
Department of Wood Science and Thermal Techniques, Faculty of Forestry and Wood Technology, Poznan University of Life Sciences, Wojska Polskiego 38/42, 60-637 Poznan, Poland
*
Authors to whom correspondence should be addressed.
This article is part of Elisa Villani’s Ph.D. Thesis.
Forests 2025, 16(2), 325; https://doi.org/10.3390/f16020325
Submission received: 18 December 2024 / Revised: 21 January 2025 / Accepted: 11 February 2025 / Published: 12 February 2025

Abstract

:
Traditional consolidants commonly used for waterlogged wood conservation often present long-term drawbacks, prompting research into new and reliable alternatives. Reducing reliance on fossil-based chemicals that are harmful to people, the environment, and the climate is a growing trend, and sustainable materials are now being explored as alternative consolidants for conserving waterlogged archaeological wood. Among these bio-based products, sodium alginate, a natural polysaccharide, has shown promising potential. This study aimed to evaluate its effectiveness in stabilising dimensions of severely degraded archaeological elm wood during drying. Various treatments were tested, and dimensional stabilisation (ASE), weight percent gain (WPG), and volumetric shrinkage (Vs) were assessed. Fourier transform infrared spectroscopy (FT-IR) and scanning electron microscopy (SEM) were used to evaluate alginate penetration and interactions with residual wood components. Results indicated that the effectiveness of sodium alginate depends on the treatment method, with the soaking approach and slow drying providing the highest WPG and the best stabilisation without altering the natural wood colour. Although the best achieved anti-shrink efficiency of 40% is insufficient from the conservation perspective, sodium alginate has proven to be a promising consolidant for the conservation of waterlogged wood. Further studies will focus on enhancing its penetration and interactions with residual wood components.

Graphical Abstract

1. Introduction

Wooden artefacts are valuable records of past human activities and technologies. They can survive hundreds or thousands of years when buried in wet environments under anoxic conditions [1,2]. Although excavated waterlogged wood appears relatively well preserved, it is frequently heavily degraded [3,4,5,6]. The partially decomposed cell walls, thinned and weakened, retain just enough strength to maintain the wood’s shape and structure as long as it remains filled with water. When the drying process begins after excavation and exposition of the waterlogged wooden object to air, the capillary forces exerted by evaporating water are strong enough to cause the collapse of fragile cell walls. Consequently, the wood shrinks, cracks, and may even disintegrate [3,7].
To preserve the original shape and dimensions of historical wooden objects recovered from waterlogged conditions—and to prevent irreversible damage—an immediate conservation treatment is necessary to replace water molecules inside wood tissue and strengthen its structure. The most common consolidation agent for waterlogged wood (WAW) conservation is polyethylene glycol (PEG). It has been applied for the conservation of some of the biggest and most famous unique artefacts, such as the Vasa and Mary Rose warships [8,9,10,11], the Bremen Cog [12,13], and the Copper Ship [14]. While PEG is undeniably effective at stabilising the dimensions of waterlogged wood [15,16,17,18], it presents several drawbacks. The treatment is time-consuming, significantly increases the weight of the wood, and can darken its colour [8]. Water-soluble PEG can easily leach from wood due to temperature and humidity changes, leading to unaesthetic surface stains and irreversible deformations of wooden objects [19]. PEG decreases the mechanical properties of wood [20] and has a plasticising effect [21,22], jeopardising the integrity of the artefacts exposed on scaffoldings. High PEG hygroscopicity can increase moisture absorption by the treated wood, which leads to its significant swelling and, ultimately, even cracking [23]. Moreover, the vulnerability of polyethylene glycol to oxidative and iron-catalysed degradation into acidic by-products constitutes a risk of further chemical degradation of already decomposed wood [10,24,25,26].
Since PEG treatment has shown long-term effectiveness and safety limitations, a growing interest in developing new conservation agents for waterlogged wood has recently been observed. To date, several different agents have been tested for waterlogged wood consolidation, including waxes [27,28], carbohydrates [29,30,31,32,33,34,35], proteins [36,37,38,39], synthetic polymers [15,40,41,42,43], halloysite nanotubes [44,45,46], various bio-polymers compatible with wood (chitosan [29,47,48,49], bacterial cellulose [35,50], cellulose ethers [51], oligo- or polyamides [52], guar [47], or lignin-like oligomers [53,54]), and other chemicals [55,56,57,58,59]. However, none of these methods are entirely effective, and more research is needed to confirm their safety and suitability from a conservation perspective. Thus, there is a continuing need to find reliable alternatives to preserve priceless waterlogged wooden artefacts for posterity.
In recent years, the pivotal role of renewable resources in the modern chemical industry has increasingly influenced cultural heritage conservation and maintenance, where using these materials offers several advantages. Bio-based materials generally exhibit low toxicity and are safe for both the environment and workers. Additionally, some are water-soluble, enabling the creation of greener solutions that more effectively meet compatibility requirements with various artwork materials, such as wood, paper, or natural fibres [60,61,62,63,64,65,66].
The shift toward bio-based systems represents a promising approach to limit reliance on fossil-based chemicals, which may cause potentially harmful degradation by-products and negatively affect the environment. Consequently, research now focuses on using these sustainable materials as alternative consolidants for conserving waterlogged archaeological wood (WAW) [47,48,51,52,67]. Our study focuses on sodium alginate (SA), a linear polysaccharide mainly derived from brown seaweeds, composed of β-D-mannuronic acid (M) and α-L-glucuronic acid (G) linked by 1→4 glycosidic bonds [68,69,70].
Sodium alginate is widely known for its low toxicity, biocompatibility, and solubility in water under neutral and alkaline conditions, attributable to the presence of carboxyl groups in its structure [69,70,71]. In cultural heritage conservation, SA-based products have been mainly tested in cleaning procedures with promising results [72,73]. However, a few studies have also explored its potential for consolidation purposes. Research has shown the positive effects of SA both on the pH of aged paper and the increase in cellulose crystallinity [74]. Additionally, sodium alginate treatment has been reported to enhance stability to UV-filtered light in Maori-dyed textiles [75]. However, caution is advised when using SA for conserving archaeological bones, as concentrations exceeding 2% in solution may not be ideal [76]. A self-dissolving hydrogel based on alginate/polyacrylamide hydrogels loaded with silver nanoparticles was used for the conservation of waterlogged wood from Nanhai No. 1 Chinese shipwreck, showing effective antibacterial and deacidifying properties, thus confirming its potential for multipurpose preservation of wooden artefacts [77].
Walsh-Korb et al. [48] used sodium alginate as a consolidant for WAW and showed that it could improve the thermal stability of the wood lignin component. The study also revealed that sodium alginate forms a network structure after freeze-drying, which could increase the effectiveness of the polymer in stabilising wood dimensions.
Among the properties required for an effective consolidant, its ability to stabilise wood dimensions during drying is the most crucial feature. Therefore, this study evaluates sodium alginate’s effectiveness in stabilising waterlogged wood dimensions during drying. Several different alginate concentrations have been tested using various conservation methods to develop the best conservation protocol, allowing for the potential future application of this natural polymer on different wood species that differ in the degree of degradation.

2. Materials and Methods

2.1. Materials

This research used waterlogged archaeological elm wood (Ulmus spp.) excavated from the sediments of Lednica Lake in the Wielkopolska Region, Poland [42]. A wooden log was a supporting element of the medieval “Poznan” bridge, which connected the Slavic stronghold of Mieszko I on the Ostrow Lednicki island with the road leading to Poznan city. Wood was dated back to the turn of the 10th and 11th centuries. Although it seemed well preserved visually, it was soft and spongy to the touch, with a loss of wood substance calculated as 70%–80% based on a relative decrease in the density of archaeological wood compared to contemporary undegraded wood, which indicated its severe degradation and made it a suitable material for testing new consolidants [78].
Wood was cut into small, rectangular samples with dimensions of 25 mm × 25 mm × 10 mm (radial × tangential × longitudinal direction) to facilitate the impregnation process and the measurements of dimensional changes. The samples were sourced from the selected outer part of the log at a similar distance from the pit to eliminate the risk of high variability in the degree of wood degradation and guarantee the reproducibility of the results. Before treatment, samples were stored in a refrigerator immersed in distilled water to reduce their further microbial degradation and ensure their waterlogged state.
Sodium alginate, PEG 400, and PEG 1500 (Merck, Darmstadt, Germany) were used for waterlogged wood treatment.

2.2. Methods

2.2.1. Waterlogged Wood Treatment

Waterlogged wood samples were treated with aqueous solutions of sodium alginate. The selected alginate concentrations were 0.5%, 1%, 1.5%, and 2%. However, the 2% solution was more gel than a solution, so higher concentrations were not applied. Different techniques were used for the treatment, including soaking and the oscillating-pressure method, which has been successfully used for organosilicon treatment before [79,80], with stable or gradually increasing alginate concentration; it has also been used for waterlogged treatment with different polymers—polyethylene glycols or sugars [27,30,32,81]. Detailed information about all the treatments applied is presented in Table 1.
The soaking method was used as the simplest impregnation technique. It is slow but enables gradual penetration of the applied conservation agent into the wood tissue. The oscillating-pressure method was applied to facilitate the diffusion of the chemical into the wood by using vacuum and pressure alternately, thus shortening the conservation process. Between the cycles, the wood remains submerged in the conservation solution under atmospheric pressure to ensure continuous penetration of an agent into the wood. PEG was combined with alginate to improve the latter’s penetration into wood [82].
After the treatment, wood samples were removed from the conservation solution and air-dried at room temperature (21 ± 1 °C) for 4 weeks, except for the Asol variant, where samples were left in an alginate solution and subjected to slow drying under the same conditions (temperature 21 ± 1 °C) until all solvent evaporated and samples were dry. This approach was supposed to delay the drying process and potentially enable better alginate polymerisation inside wood tissue, thus letting it counteract the forces of evaporating water and prevent/reduce wood shrinkage.
Since the number of similar wood samples was limited, three replicates were used for each treatment. Three untreated waterlogged wood samples were air-dried as described above and served as controls. For the same reason, a 1% alginate solution was selected for further experiments based on the results obtained using an oscillating-pressure method.

2.2.2. Assessment of the Effectiveness of the Applied Wood Treatment

All samples were weighed in a waterlogged state before treatment and then when they had been air-dried after the treatment, and their dimensions were measured in the three anatomical directions using a digital calliper (±0.01 mm). The collected data served to calculate wood density and other parameters described below.
Evaluation of the effectiveness of the treatment was based on calculating the weight percent gain (WPG) for an applied conservation agent according to the standard Equation (1):
W P G = W 1 W 0 W 0 × 100
where W0 is the estimated oven-dry mass of the sample before treatment, and W1 stands for the oven-dry mass of the sample treated with a selected conservation agent [42].
Waterlogged wood samples cannot be oven-dried before treatment because it would cause irreversible deformations and make them useless for the experiment, which aimed to apply the appropriate treatment to waterlogged wood to prevent further shrinkage. Therefore, for the above calculations, the estimated oven-dry mass of untreated samples was calculated based on water content in a different set of similar samples (5 replicates were used for the measurement), which showed an average moisture content of 798 ± 20%.

2.2.3. Assessment of the Stabilising Effectiveness

The evaluation of the stabilising effectiveness of sodium alginate was based on volumetric shrinkage values (Sv) and the volumetric anti-shrink efficiency coefficient (ASEv), which were calculated according to the standard Equations (2) and (3) [42]:
S v = V 0 V 1 V 0 × 100
where V0 is the initial volume of the waterlogged sample, and V1 stands for the final volume of the sample (untreated or treated, respectively) after air-drying.
A S E v = S v u S v t S v u × 100
where Svu stands for the volumetric shrinkage of the untreated and Svt is the volumetric shrinkage of the treated sample.

2.2.4. Scanning Electron Microscopy Imaging

The untreated and treated wood structure was analysed using a scanning electron microscope (SEM JEOL JEM 7001 TTLS, Tokyo, Japan) equipped with an energy-dispersive X-ray (EDX) analyser using a 5 kV accelerating voltage. Before SEM imaging, the samples were cut in the middle to reveal their cross-sections. They were placed on carbon tape, and their cross-section surfaces were sputtered with an Au layer of about 8 nm thickness.

2.2.5. Infrared Spectroscopy

Fourier transform infrared spectroscopy (FT-IR) was used to confirm the presence of applied chemicals in the treated wood tissue and analyse the interactions between wood and the impregnation agents. The samples were powdered using a mini mill Pulverisette 23. Infrared spectra were recorded in the 4000–400 cm−1 region with a resolution of 4 cm−1, using a Bruker ALPHA FT-IR spectrometer (Bruker, Billerica, MA, USA) by incorporation of 3 mg of sample in 300 mg of KBr matrix. The sample homogenisation with KBr was performed using the same ball mill mentioned above. Five spectra were recorded for each studied sample, averaged, and processed using OPUS 7.5 software.

3. Results and Discussion

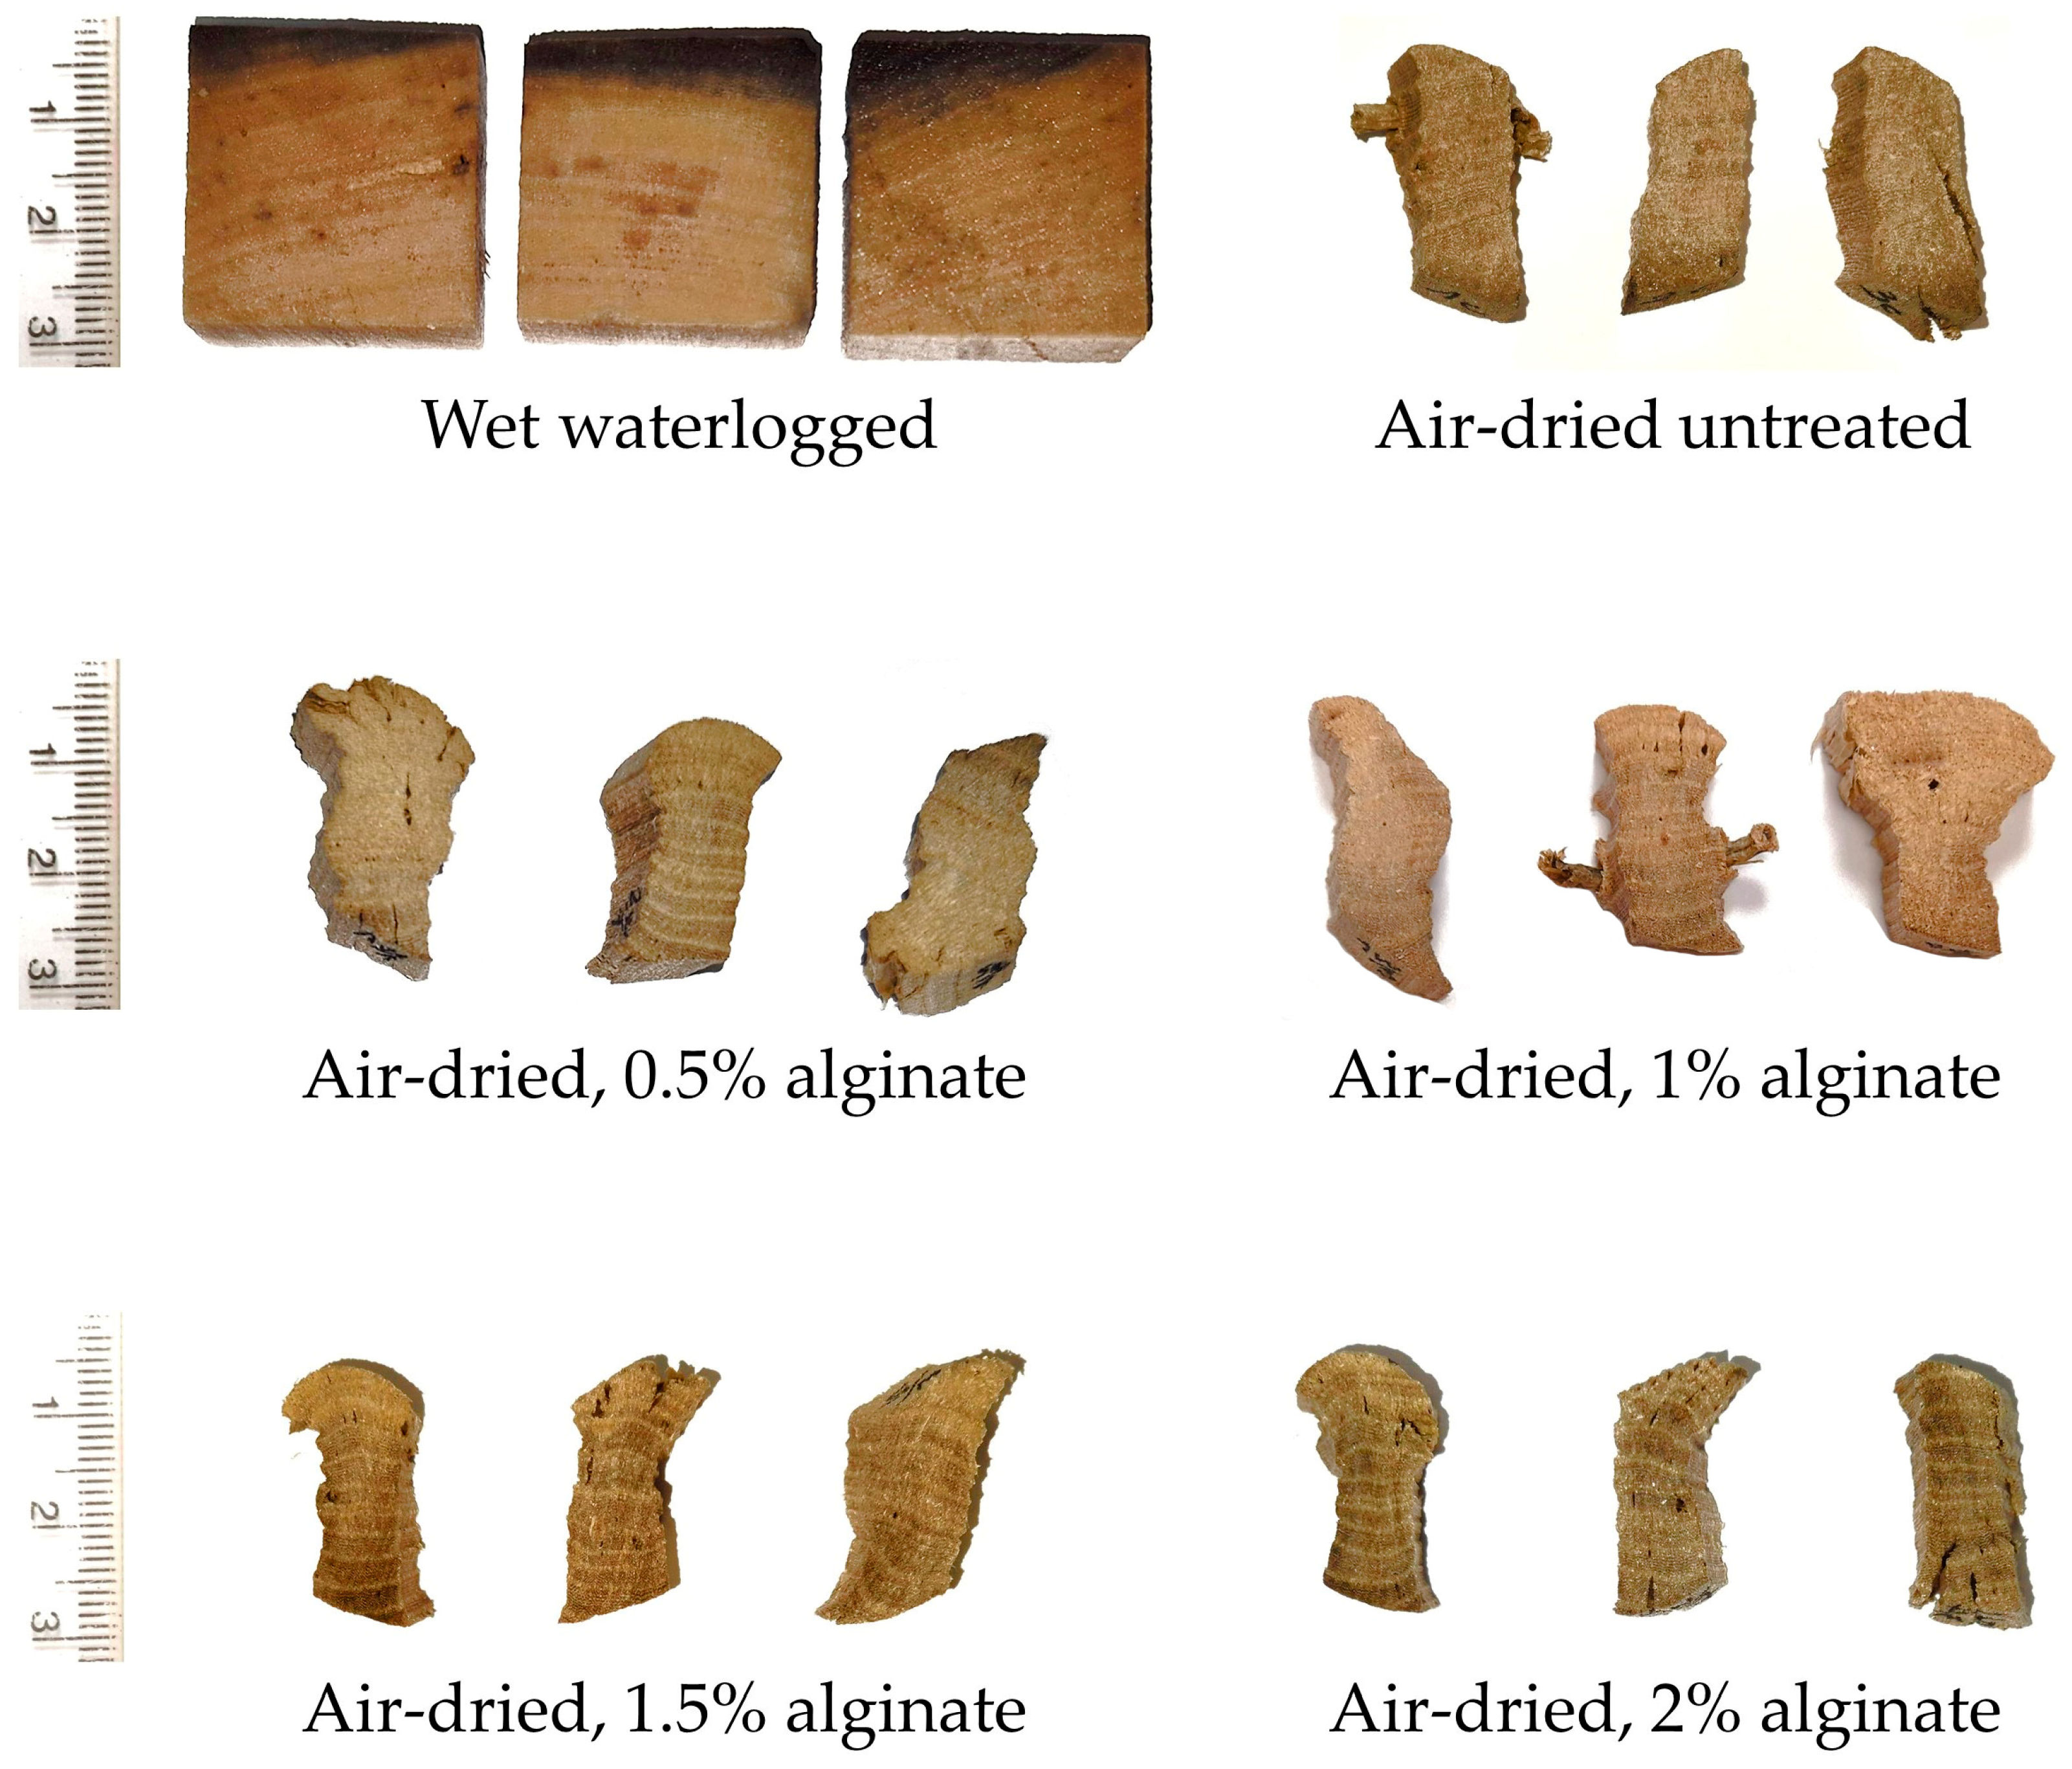
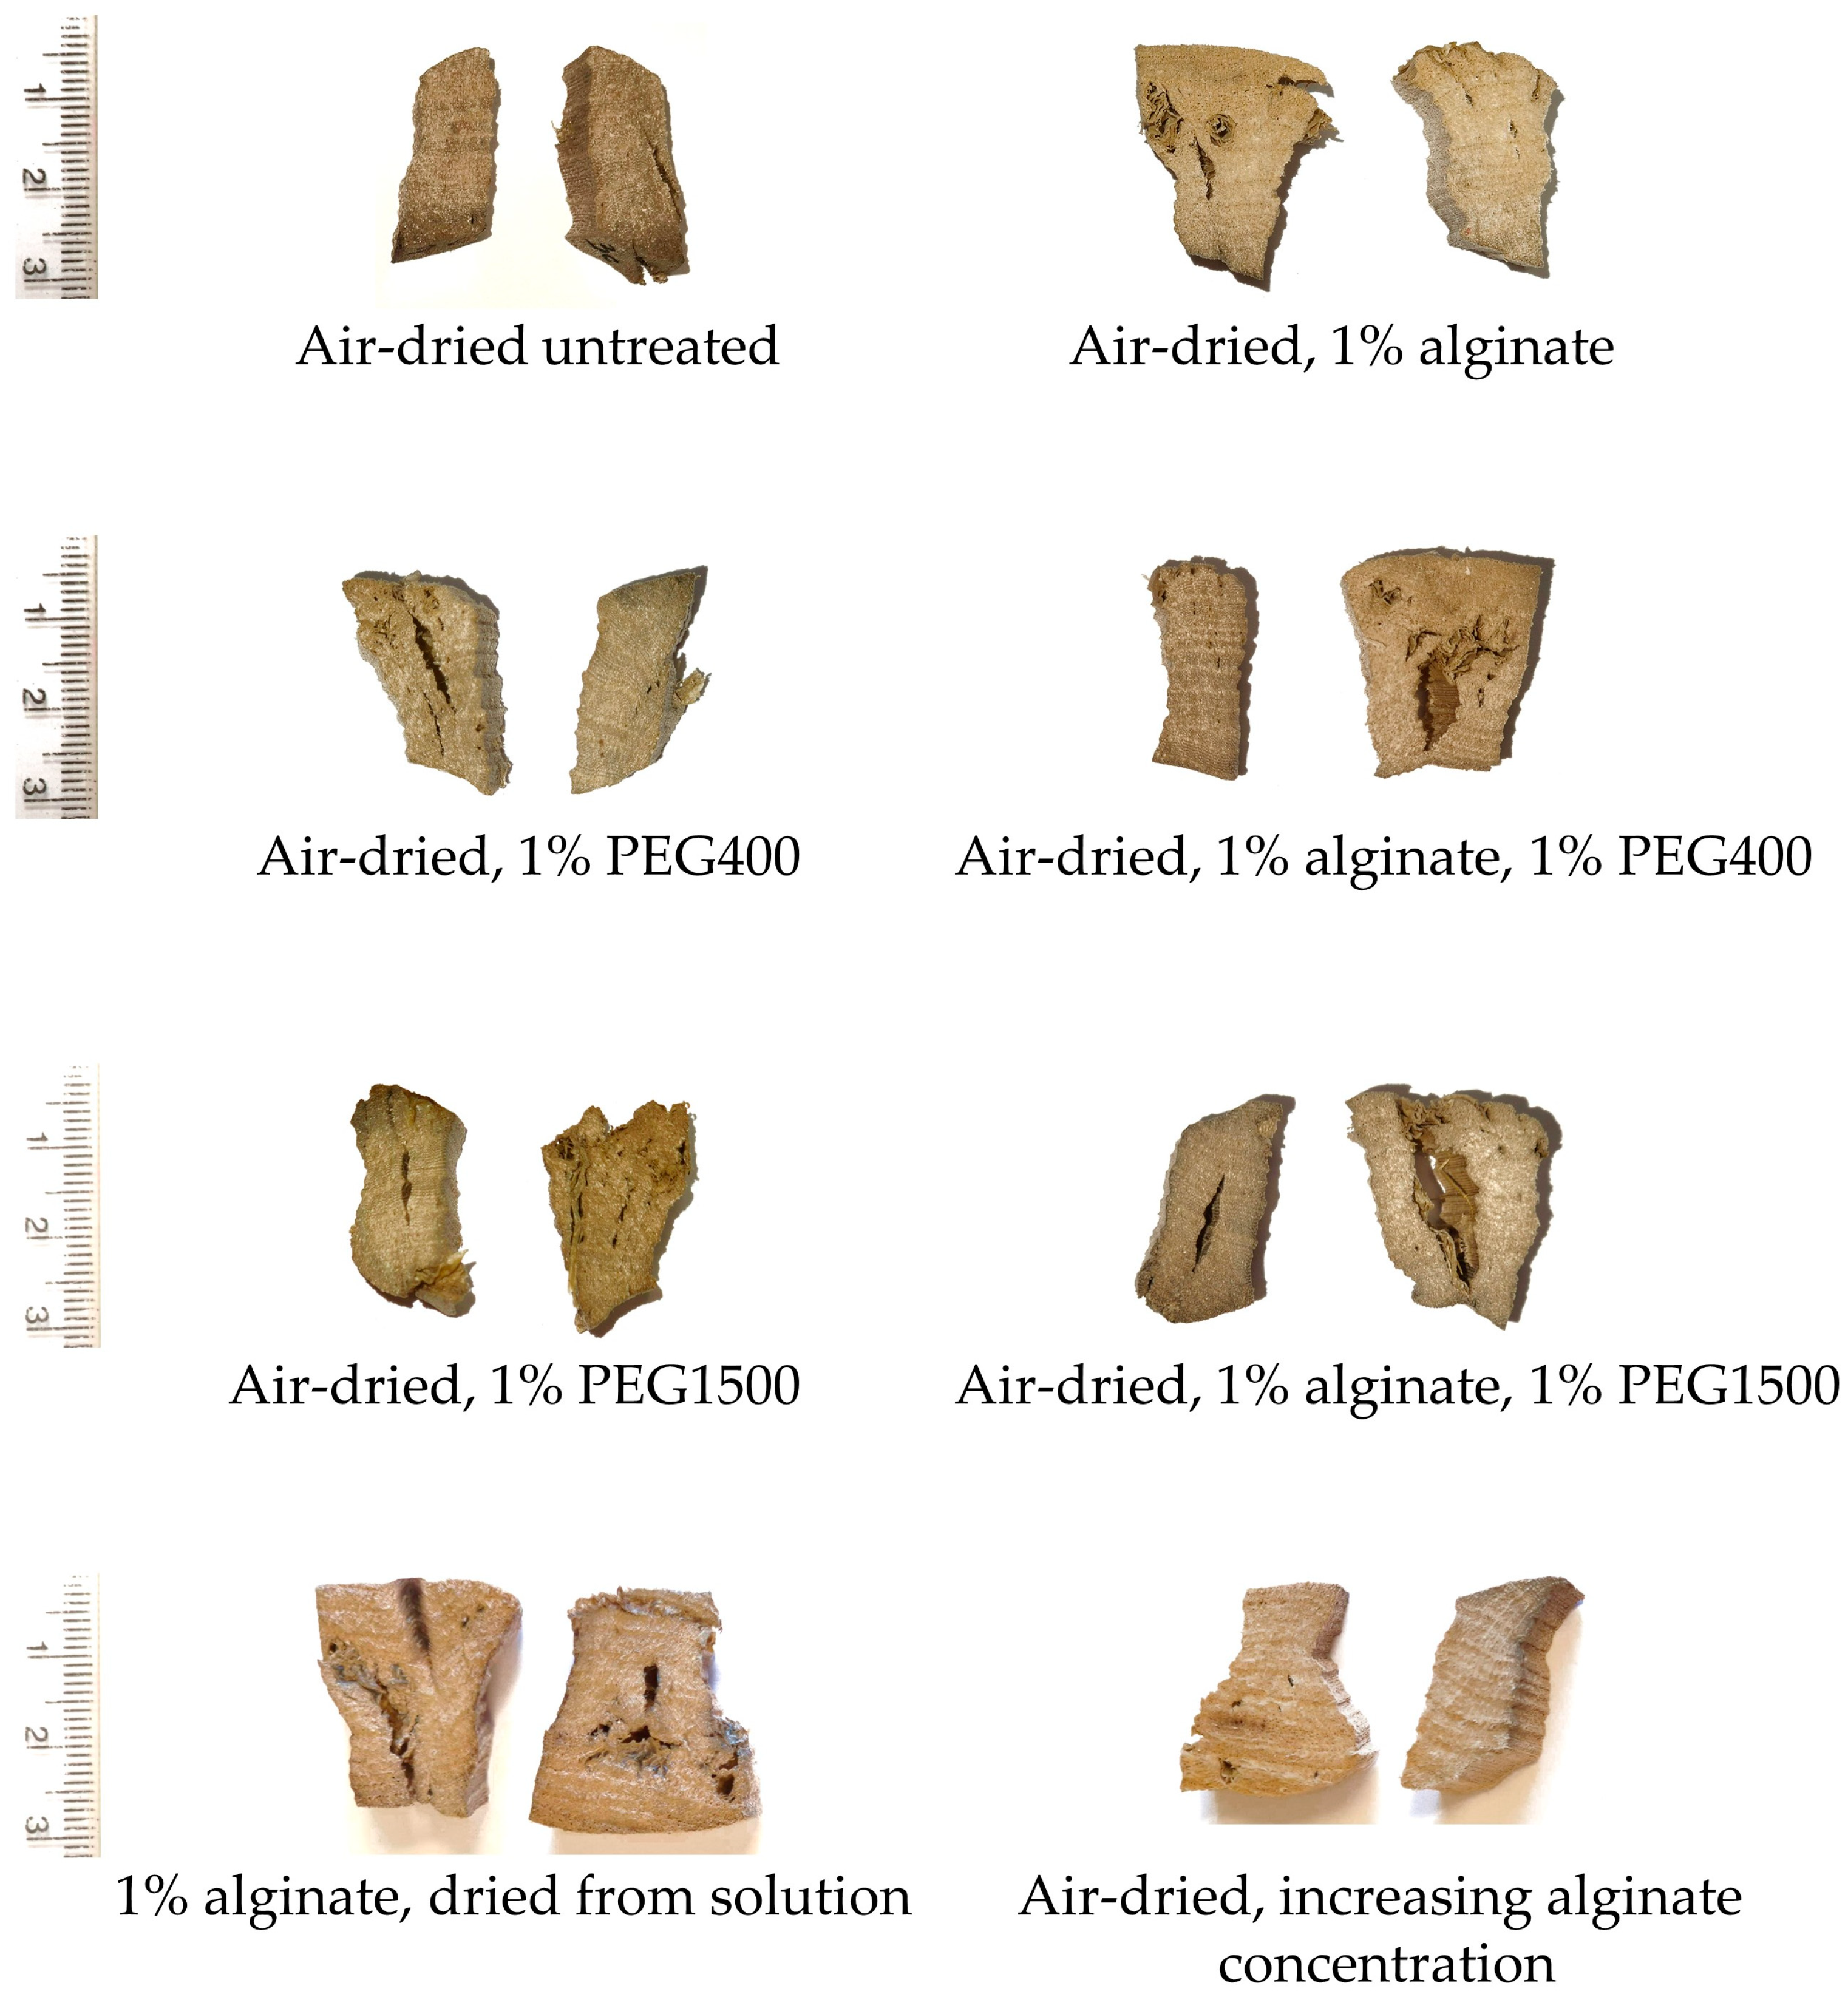
3.1. Effectiveness of the Applied Alginate Treatment

The effectiveness of the treatment expressed as WPG is presented in Table 2. Since the density of wood in the waterlogged state was similar for all samples, the results obtained can be compared between them. The WPG values for treated wood were not high, ranging between 0.8% and 6.7%. This indicates relatively low polymer retention, especially in comparison with the values obtained in previous research for organosilicon treatment or PEG treatment applied to waterlogged wood from the same excavation place, which ranged between 136% and 352% for similarly degraded elm wood treated with organosilicons [80,83] and 27% and 33% for much better-preserved oak treated with PEG and Methyltrimethoxysilane, respectively [84]. It should be noted, however, that for alginate treatment, significantly lower concentrations were used (0.5%–2%) compared with the treatment with organosilicons or PEG (50% and 40%, respectively).
In general, better impregnation effectiveness was achieved using a soaking method, where for 1% alginate solution, the WPG value reached 5.8% compared to 2.7% for the oscillating-pressure method. It suggests that natural, free diffusion works better for an alginate treatment than forced diffusion aided with pressure changes. The addition of PEGs did not enhance alginate retention. Comparing the result for the samples treated solely with PEG (samples PEG400 and PEG1500) with those treated with mixtures of alginate and PEG (1AL400PEG and 1AL1500PEG) using a soaking method, it can be concluded that the increase in WPG for the latter resulted only from the penetration of higher-molecular-weight PEG molecules into wood. Considering the molecular weight of PEGs used for the treatment and that the WPG value for the PEG1500 sample was about 4 times higher than that for the PEG400 sample, it seems that in both cases, a similar number of PEG molecules penetrated wood tissue. The soaking method, although time-consuming, is one of the most commonly used for waterlogged wood conservation with consolidants such as PEG, sugars, or proteins, providing effective wood stabilisation [21,30,33,34,36,37,85].
Wood treatment by soaking in a conservation solution with gradually increasing alginate concentrations from 0.5% through 1% to 1.5% was not as effective as immersion in 1% alginate solution. The WPG value for the former is about 16% lower than the latter, which may suggest that the last step of the treatment with 1.5% solution was not as effective as that with lower alginate concentrations, especially since it was evident during the preparation step that the viscosity of the alginate solution increased with its increasing concentration, providing it with more gel than liquid consistency starting from the 1.5% concentration. It is worth mentioning that the soaking treatment using an increasing concentration of a consolidant is a common and effective method when PEG is applied for waterlogged wood conservation [12,13,14,15,86].
The best impregnation effectiveness, reaching the WPG value of 6.7%, was achieved for the soaking treatment with 1% alginate solution when the sample was not removed from the conservation agent after impregnation but left in it for slow drying as water from the solution was naturally evaporating at room temperature (sample Asol). The result may be explained by the prolonged immersion time of the sample in the conservation solution compared to other samples treated with a soaking method, which enabled the penetration of a higher number of alginate molecules inside the wooden blocks.
For the oscillating-pressure method, the increase in alginate concentration between 0.5% and 1.5% increased WPG values. However, a lowered WPG value was recorded for a 2% alginate solution, suggesting that its consistency was too viscous to penetrate throughout wood samples effectively. In our previous studies, when organosilicon compounds with a concentration of 50% were used for waterlogged wood treatment, the oscillating-pressure method was faster and more effective than the soaking one, but the conservation solution was less dense and the chemistry of applied chemicals was different compared to alginate [79,80,83,84].
Summarising, from the perspective of the impregnation effectiveness, 1% seems to be an optimal concentration of alginate in the conservation solution, enabling the penetration of the chemical into wood. A soaking method using alginate solution is more effective for waterlogged wood treatment than an oscillating-pressure method, and allowing the treated samples to dry while left in the conservation solution slowly provides higher retention of a conservation agent compared to air-drying of treated samples removed from the solution after treatment.

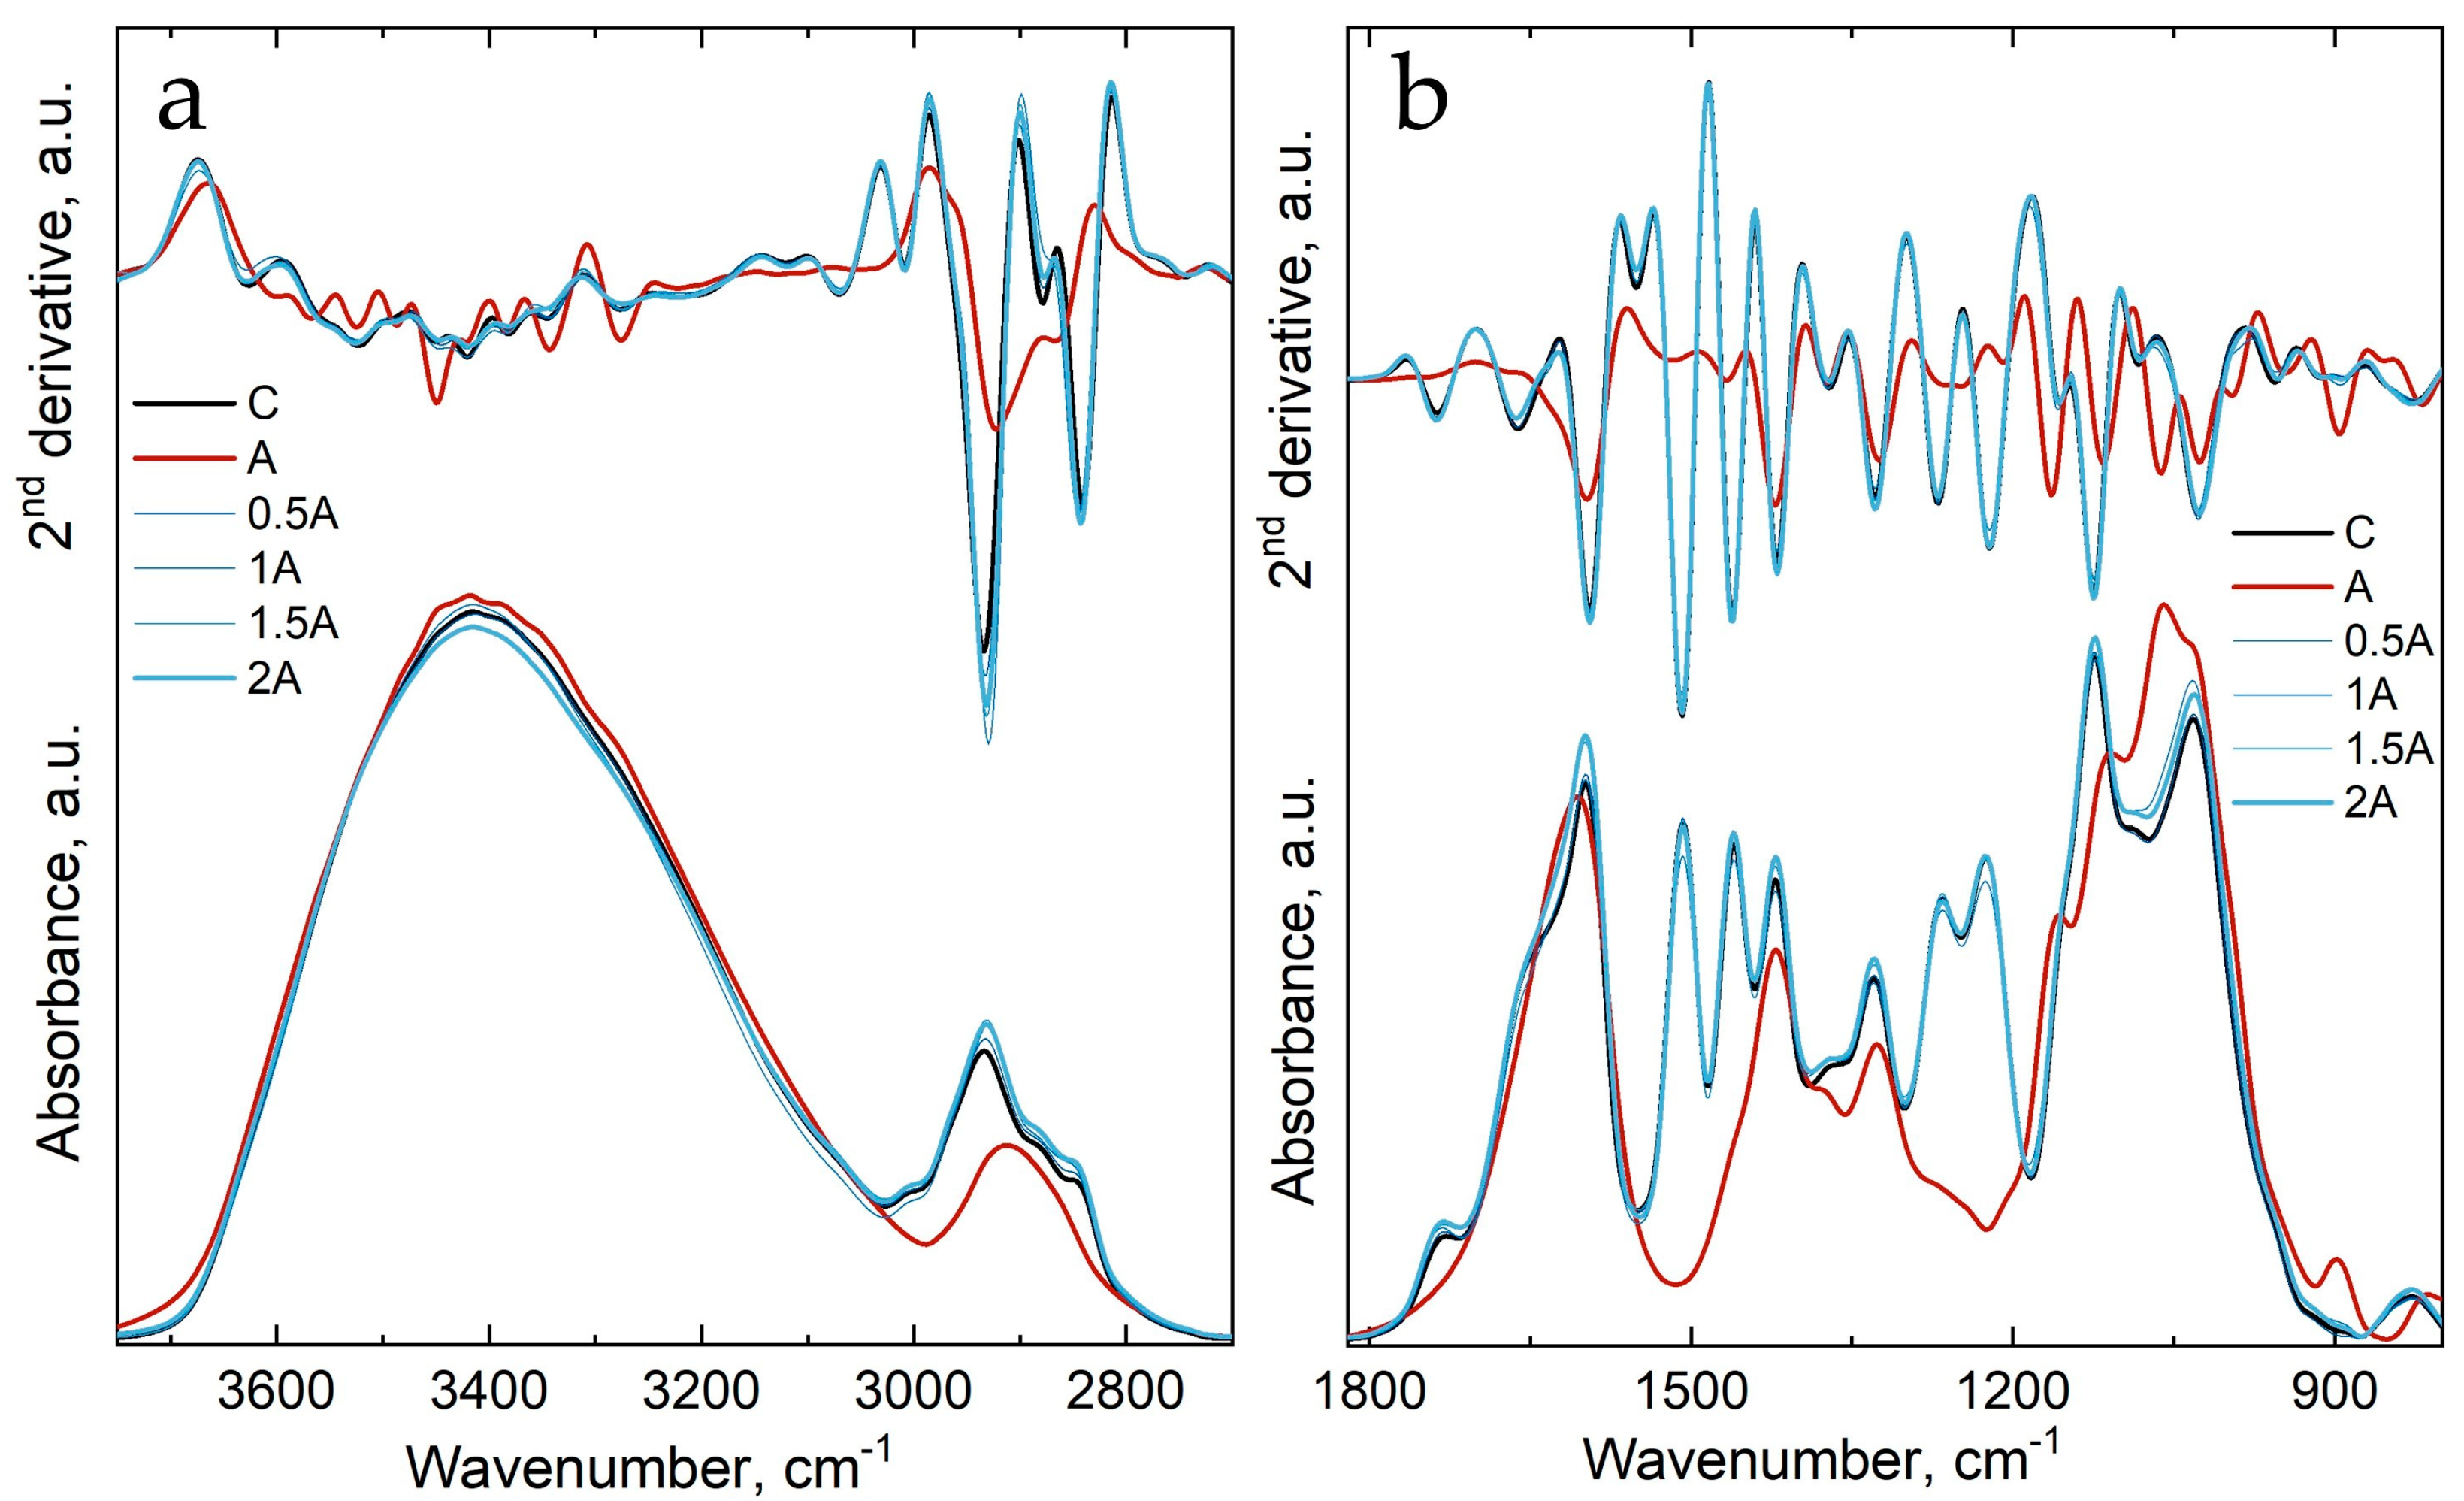
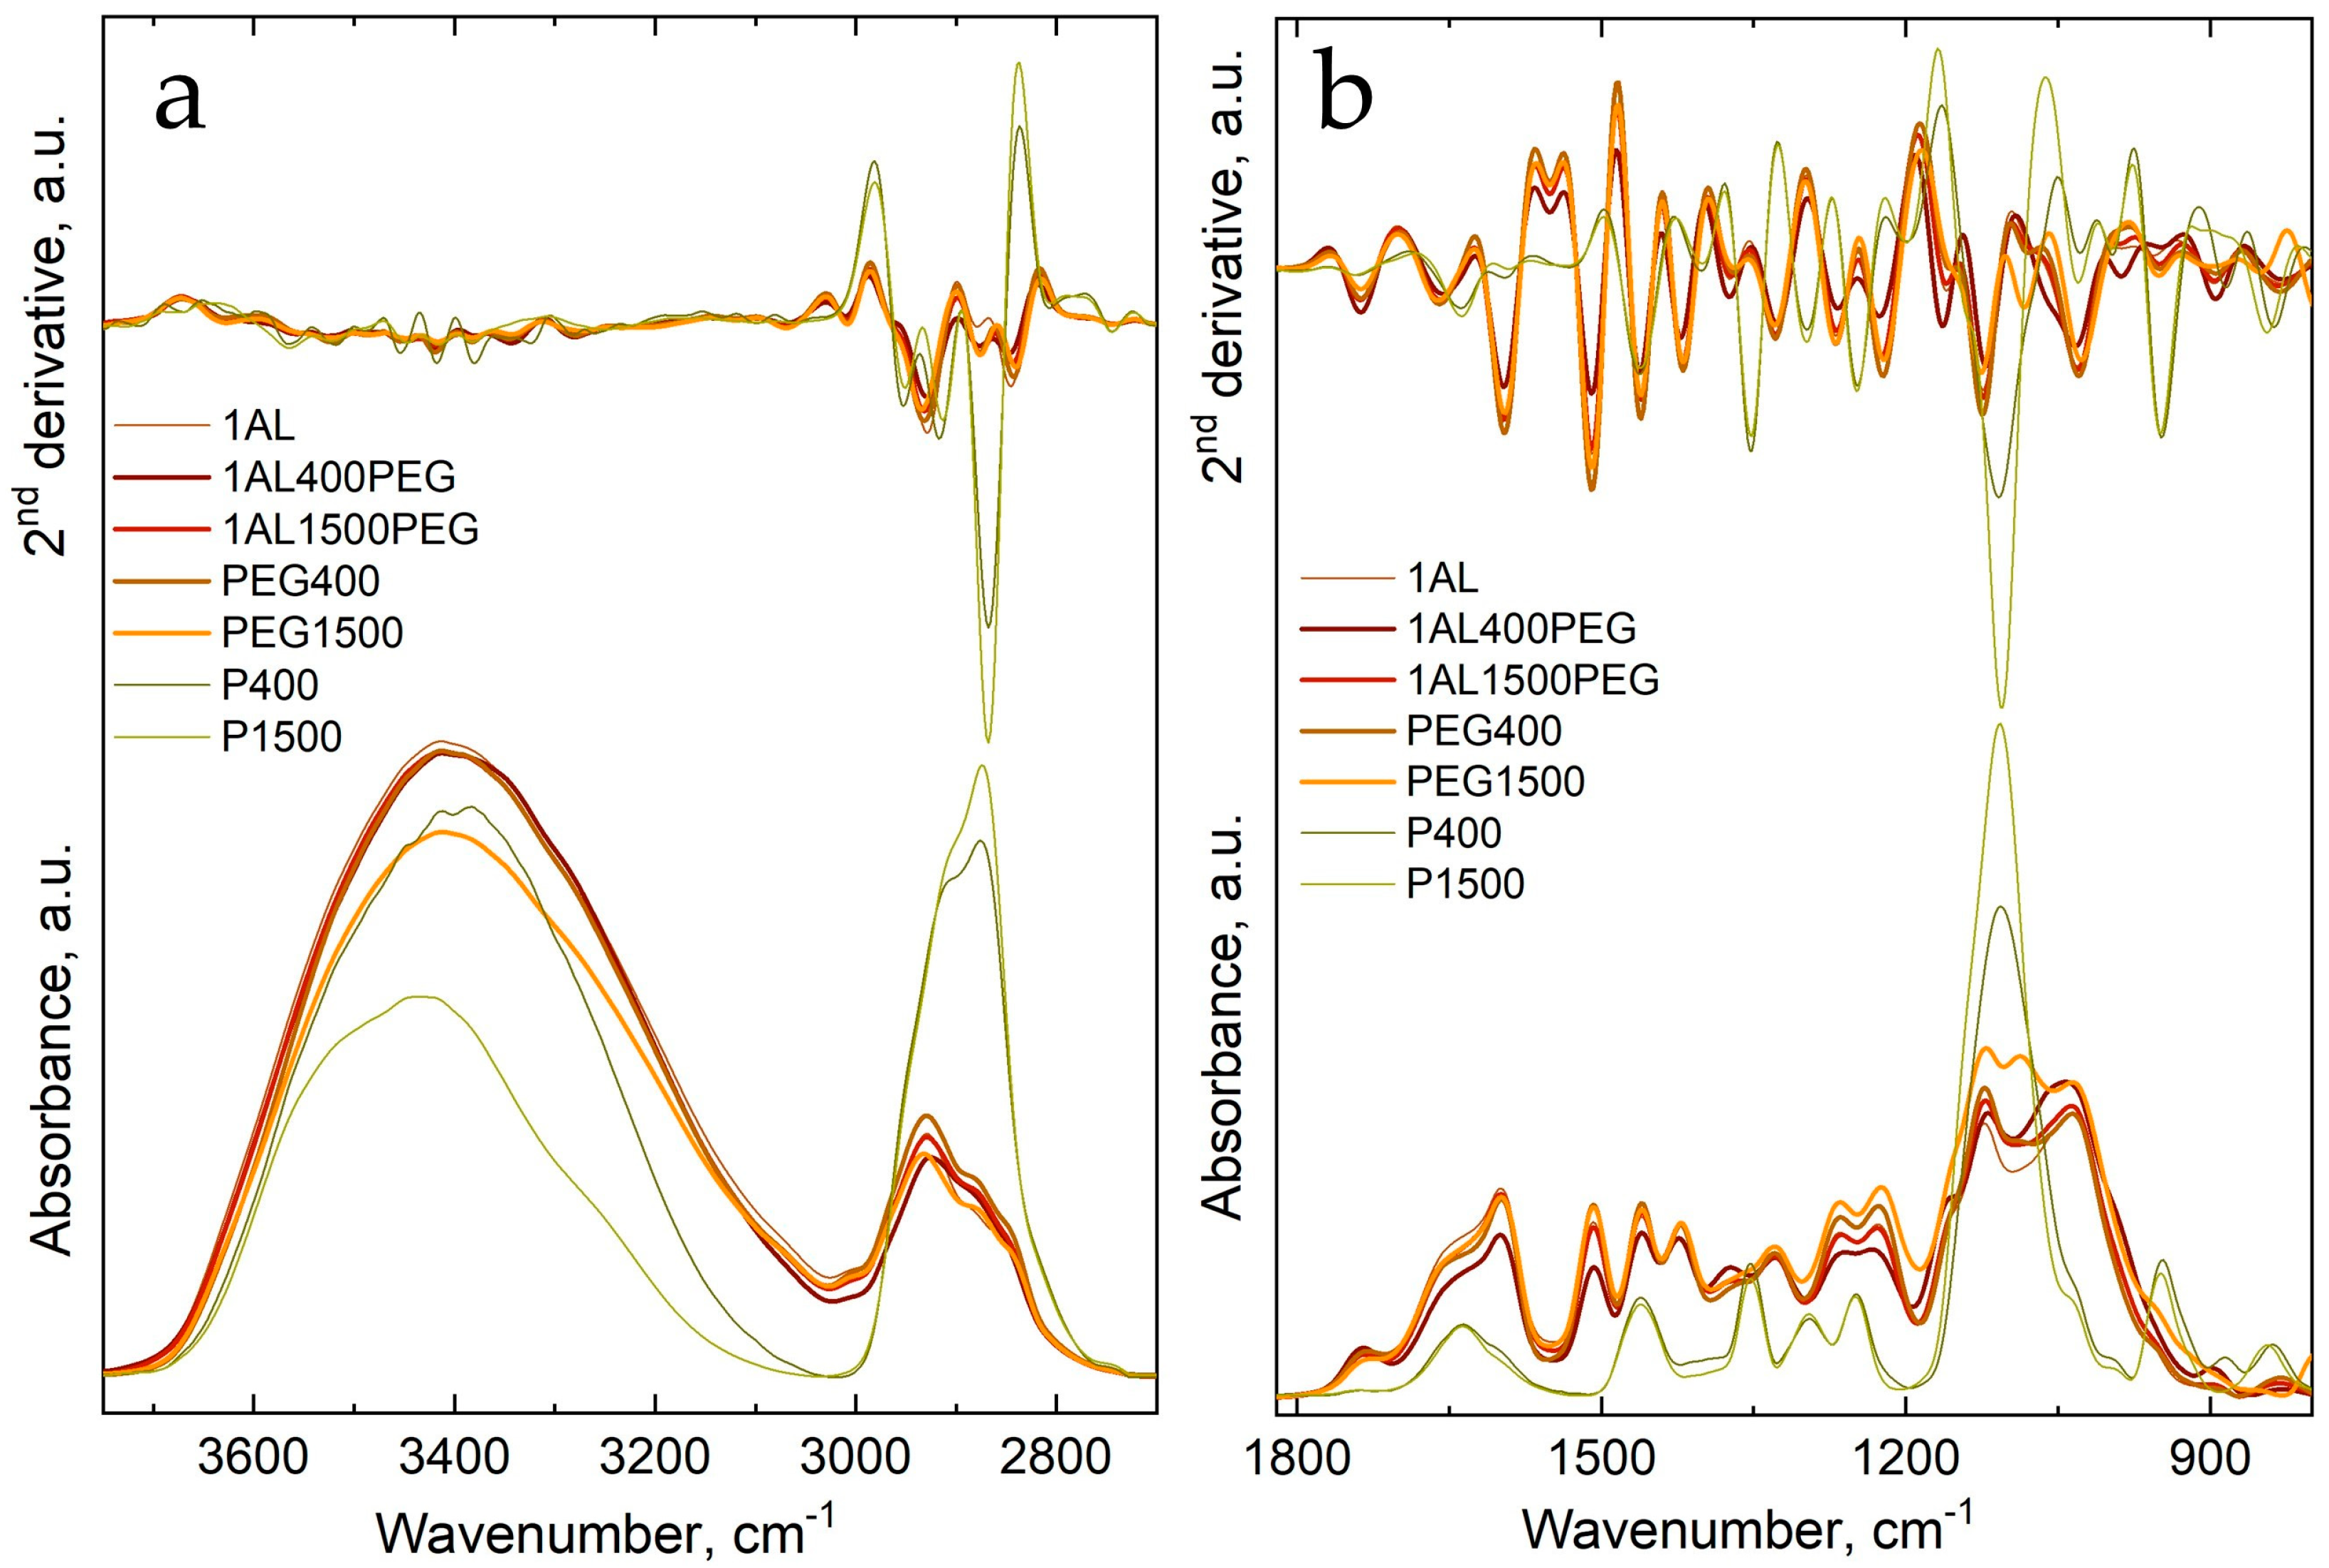
3.2. Fourier Transform Infrared Spectroscopy of Untreated and Treated Wood

Due to their complexity, the infrared spectra of all samples were separated into two important regions, namely the 3700–2700 cm−1 region, assigned mainly to different inter- and intramolecular hydrogen bonds as well as to methyl and methylene groups’ stretching vibrations, and the 1820–800 cm−1 region, assigned to specific stretching and bending vibrations in the structure of the wood and impregnation agents [87,88]. Further, their second-derivative spectra were obtained and used to evaluate the differences between the spectra.
Figure 1 represents the spectra and their second derivatives for untreated wood (C), sodium alginate (A), and wood samples treated with different concentrations of sodium alginate solutions (0.5A, 1A, 1.5A, and 2A) using the oscillating-pressure method. Because the concentration of the impregnation agent in the solution is very low, from 0.5 to 2%, and the sodium alginate bands mainly overlap with those specific for wood polymers, the spectra of the treated wood present only slight differences compared to the untreated wood sample.
In the first region (Figure 1a), the main differences are as follows: the band at 3420 cm−1 in C and treated wood shows a slight increase in intensity in treated wood compared to C; the band from 3345 to 3343 cm−1 in C and A is shifted to 3348 cm−1 in 2A and becomes more like a shoulder with the increase in concentration of alginate; the bands from 3120 to 3128 cm−1 in C/A and at 3107 cm−1 in A remain at 3120 cm−1 in treated wood but increase slightly in width towards lower wavenumber values; the band from 2934 to 2922 cm−1 in C/A is shifted to 2929 cm−1 in 2A and increases in intensity; the band from 2878 to 2867 cm−1 in C/A decreases in intensity and is shifted towards 2874 cm−1 with an increase in alginate concentrations in treated wood; and the band at 2841 cm−1 in C is shifted towards 2845 cm−1 with an increase in alginate concentration in treated wood and increases in width towards higher wavenumber values. The mentioned differences indicate an increasing amount of alginate in wood samples treated with increasing concentrations of this substance. The assignments of all mentioned bands are presented in Table 3.
In the second region (Figure 1b), the band at 1736 cm−1 in C is observed at 1738 cm−1 in treated wood and slightly increases in intensity with increasing alginate concentration. At the same time, the band at 1661 cm−1 in C shows a slight decrease in intensity in treated samples, and from 1A, we can observe a small shoulder that appears and increases towards 2A. Other modifications are observed for the band from 1371 to 1374 cm−1 in C/A, which shows a slight shift from C towards A in the spectra of treated wood, while the band from 1328 to 1325 cm−1 in C/A increases in intensity. The band at 1083 cm−1 is shifted to 1081 cm−1 in the 2A spectrum and increases in width towards lower wavenumber values. The band from 1027 to 1026 cm−1 in C/A shows a larger width in the spectra of 1.5A and 2A, while the band from 956 to 946 cm−1 in C/A is shifted to a lower wavenumber, 952 cm−1, in the 2A spectrum. The bands at 895 cm−1 and 850 cm−1 increase in intensity with the increase in alginate concentration. All these confirm the presence of alginate in treated wood. The assignments of all mentioned bands are presented in Table 4.
Sodium alginate is composed of α-L-glucuronic and β-D-mannuronic acid alternated units [91], which are similar to cellulose units (found in wood); thus, both compounds, sodium alginate and cellulose, present absorption bands in the same regions. Because of this, the differences observed in the spectra of treated wood compared to untreated are very small.
Figure 2 presents the spectra and their derivatives for the second series of studied samples treated with sodium alginate 1% and PEG using a soaking method. In the first region (Figure 2a), the main differences are observed for the bands assigned to methyl and methylene stretching vibrations. For the band at 2929 cm−1, a shoulder at higher wavenumber values (at about 2960 cm−1) can be observed for treated wood samples. This is shifted to lower wavenumber values in the samples treated with A and PEG. In the spectra of PEG400/PEG1500, the shoulder disappears, but the band with a maximum at 2032/2934 cm−1 increases in width towards higher wavenumbers compared to the band from the 1AL spectrum. Shifting of the maximum is also observed for the band at 2846 cm−1 in 1AL to 2849/2845 cm−1 in 1AL400PEG/1AL1500PEG and to 2843/2841 cm−1 in wood samples treated only with PEG solutions. This band (at 2841 cm−1) is observed only in the untreated wood spectrum, and the impregnation chemicals do not have any absorbance bands around this value. It is known that the shifting of a band maximum to a lower or higher wavenumber is due to modifications of a certain bond of the same group or to modifications taking place in the close vicinity of that bond, thus affecting its vibration wavenumber. Therefore, the modification of the maximum of this band might indicate modifications appearing in the vicinity of the C–H bonds from –CH2 groups from wood due to the presence of the chemicals in the wood structure.
In Figure 2b, from the spectra in the fingerprint region, it can be observed that the band at 1737 cm−1 in C and 1AL decreases in intensity. This band is observed at 1743 cm−1 as a shoulder in P400 and P1500. The band from 1661 to 1659 cm−1 in C/1AL is shifted to 1657/1660 cm−1 in 1AL400PEG/1AL1500PEG, while in PEG-treated wood samples, this band is found at 1660/1662 cm−1. PEG samples do not show a band at this wavenumber. In the treated wood samples, this band is observed to enlarge towards 1630 cm−1, indicating the presence of PEG (the spectra of pure chemicals show a band at 1636 cm−1). The band at 1591 cm−1 in C/1AL is shifted to 1595 cm−1 in treated wood and increases in intensity. The bands from 1461 to 1462 and 1420 to 1422 cm−1 in C/1AL increase in intensity in treated wood samples with both alginate and PEG, and the second band is also shifted slightly to lower wavenumber values (at 1419 cm−1). In pure PEG spectra, the second band is observed at 1401 cm−1. Shifting of the maximum position is observed for the band at 1374 cm−1 in 1AL towards 1370/1369 cm−1 in treated wood only with PEG solutions. In the spectra of pure PEG, this band is located at 1351 cm−1. The bands from 1156 to 1164 cm−1 in C/1AL are observed at 1160 cm−1 in 1AL400PEG and 1AL1500PEG, and the band at 1156 cm−1 looks more like a shoulder in the spectra of wood treated only with PEG solutions. The band from 1125 to 1124 cm−1 in C/1AL is shifted to 1121 cm−1 in the spectrum of 1AL400PEG, while the same band in the PEG spectra is observed at 1108/1106 cm−1. No shifting of this band is observed in the spectra of the other samples treated with PEG solution without and with sodium alginate. Other modifications are seen for the band at 1083 cm−1 in C, which can be seen as a shoulder in 1AL. This band is also observed as a shoulder in 1AL1500PEG and appears as a band in PEG400, which increases in intensity in PEG1500. This band is not identified in the spectra of PEG solutions. The band at 988 cm−1 in 1AL does not change in 1AL400PEG and 1AL1500PEG but changes to the maximum of 991 cm−1 in PEG400. This band is located at 996 cm−1 in A and 995 cm−1 in PEG. The band at 896 cm−1 in the 1AL spectrum is shifted to 895 cm−1 in 1AL400PEG and 1AL1500PEG and 893 cm−1 in the PEG400 and PEG1500 spectra, while the band at 830 cm−1 in the 1AL spectrum is shifted to 835 cm−1 in the 1AL400PEG and 1AL1500PEG spectra and 852 cm−1 in the PEG1500 spectrum.
All these modifications observed in the spectra of the treated wood indicate the presence of applied chemicals in the wood structure, as well as interactions between the wood components and the impregnation chemicals. They are presumably mainly hydrogen bonds as well as crosslinking reactions, similar to those we have previously observed in archaeological wood treated with organosilicon compounds [97].
The assignments of bands for wood and sodium alginate are given above, while the band assignments for PEG spectra are given in Table 5.
The last group of samples evaluated through infrared spectroscopy belongs to treatments of wood with sodium alginate solution but using different impregnation/drying methods: Astep was treated with an increasing concentration of sodium alginate (0.5%–1%–1.5%) using a soaking method, while Asol was immersed in 1% alginate but left to dry in the solution instead of being removed from it and air-dried, as with the rest of the samples. Similarly to other treatments, the spectra of Asol and Astep in the 3700–2700 cm−1 region (Figure 3a) show stronger differences in the bands’ position, mainly in the C–H stretching vibration region, but also the bands at 3343 cm−1 show a slight increase in intensity in the spectrum of Asol compared to the spectrum of C, while the band at 3275 cm−1 from the C spectrum is shifted to 3281 cm−1 in the spectrum of Astep. Further, the band at 2934 cm−1 in the C spectrum is shifted to 2931 cm−1 in the Asol spectrum, the band at 2878 cm−1 in the Asol spectrum increases in width compared to the same band from the C spectrum, and the band at 2841 cm−1 in the C spectrum is shifted to 2845 cm−1 in the Asol spectrum and increases in width towards higher wavenumber values. This shifting might be due to C–H stretching vibrations at 2867 cm−1 in the spectrum of A, indicating alginate’s presence in the treated samples.
In the fingerprint region (Figure 3b), the band at 1736 cm−1 increases in intensity in both the Asol and Astep spectra, and the band at 1661 cm−1 is shifted to 1658 cm−1 in the Asol spectrum and increases in width towards lower wavenumber values in both the Asol and Astep spectra. The band from 1371 to 1374 cm−1 in C/A increases in width towards higher wavenumber values in the Asol spectrum, while the band from 1156 to 1164 cm−1 (in C/A) appears at 1162 cm−1 in the Asol spectrum and at 1158 cm−1 in the Astep spectrum and increases in intensity in both spectra. The band at 1083 cm−1 in the C spectrum and 1062 cm−1 in the A spectrum cannot be observed in the spectrum of Asol but remains constant at 1081 cm−1 in the spectrum of Astep. The band from 1027 to 1026 cm−1 in the C and A spectra is observed at 1032 cm−1 in the Asol spectrum and increases in width towards higher wavenumber values. The band at 896 cm−1 in the A spectrum is also present in the Asol spectrum but is very weak in the Astep spectrum, indicating a higher concentration of alginate in Asol compared to Astep, which can also be seen in WPG values for these samples (Table 2).

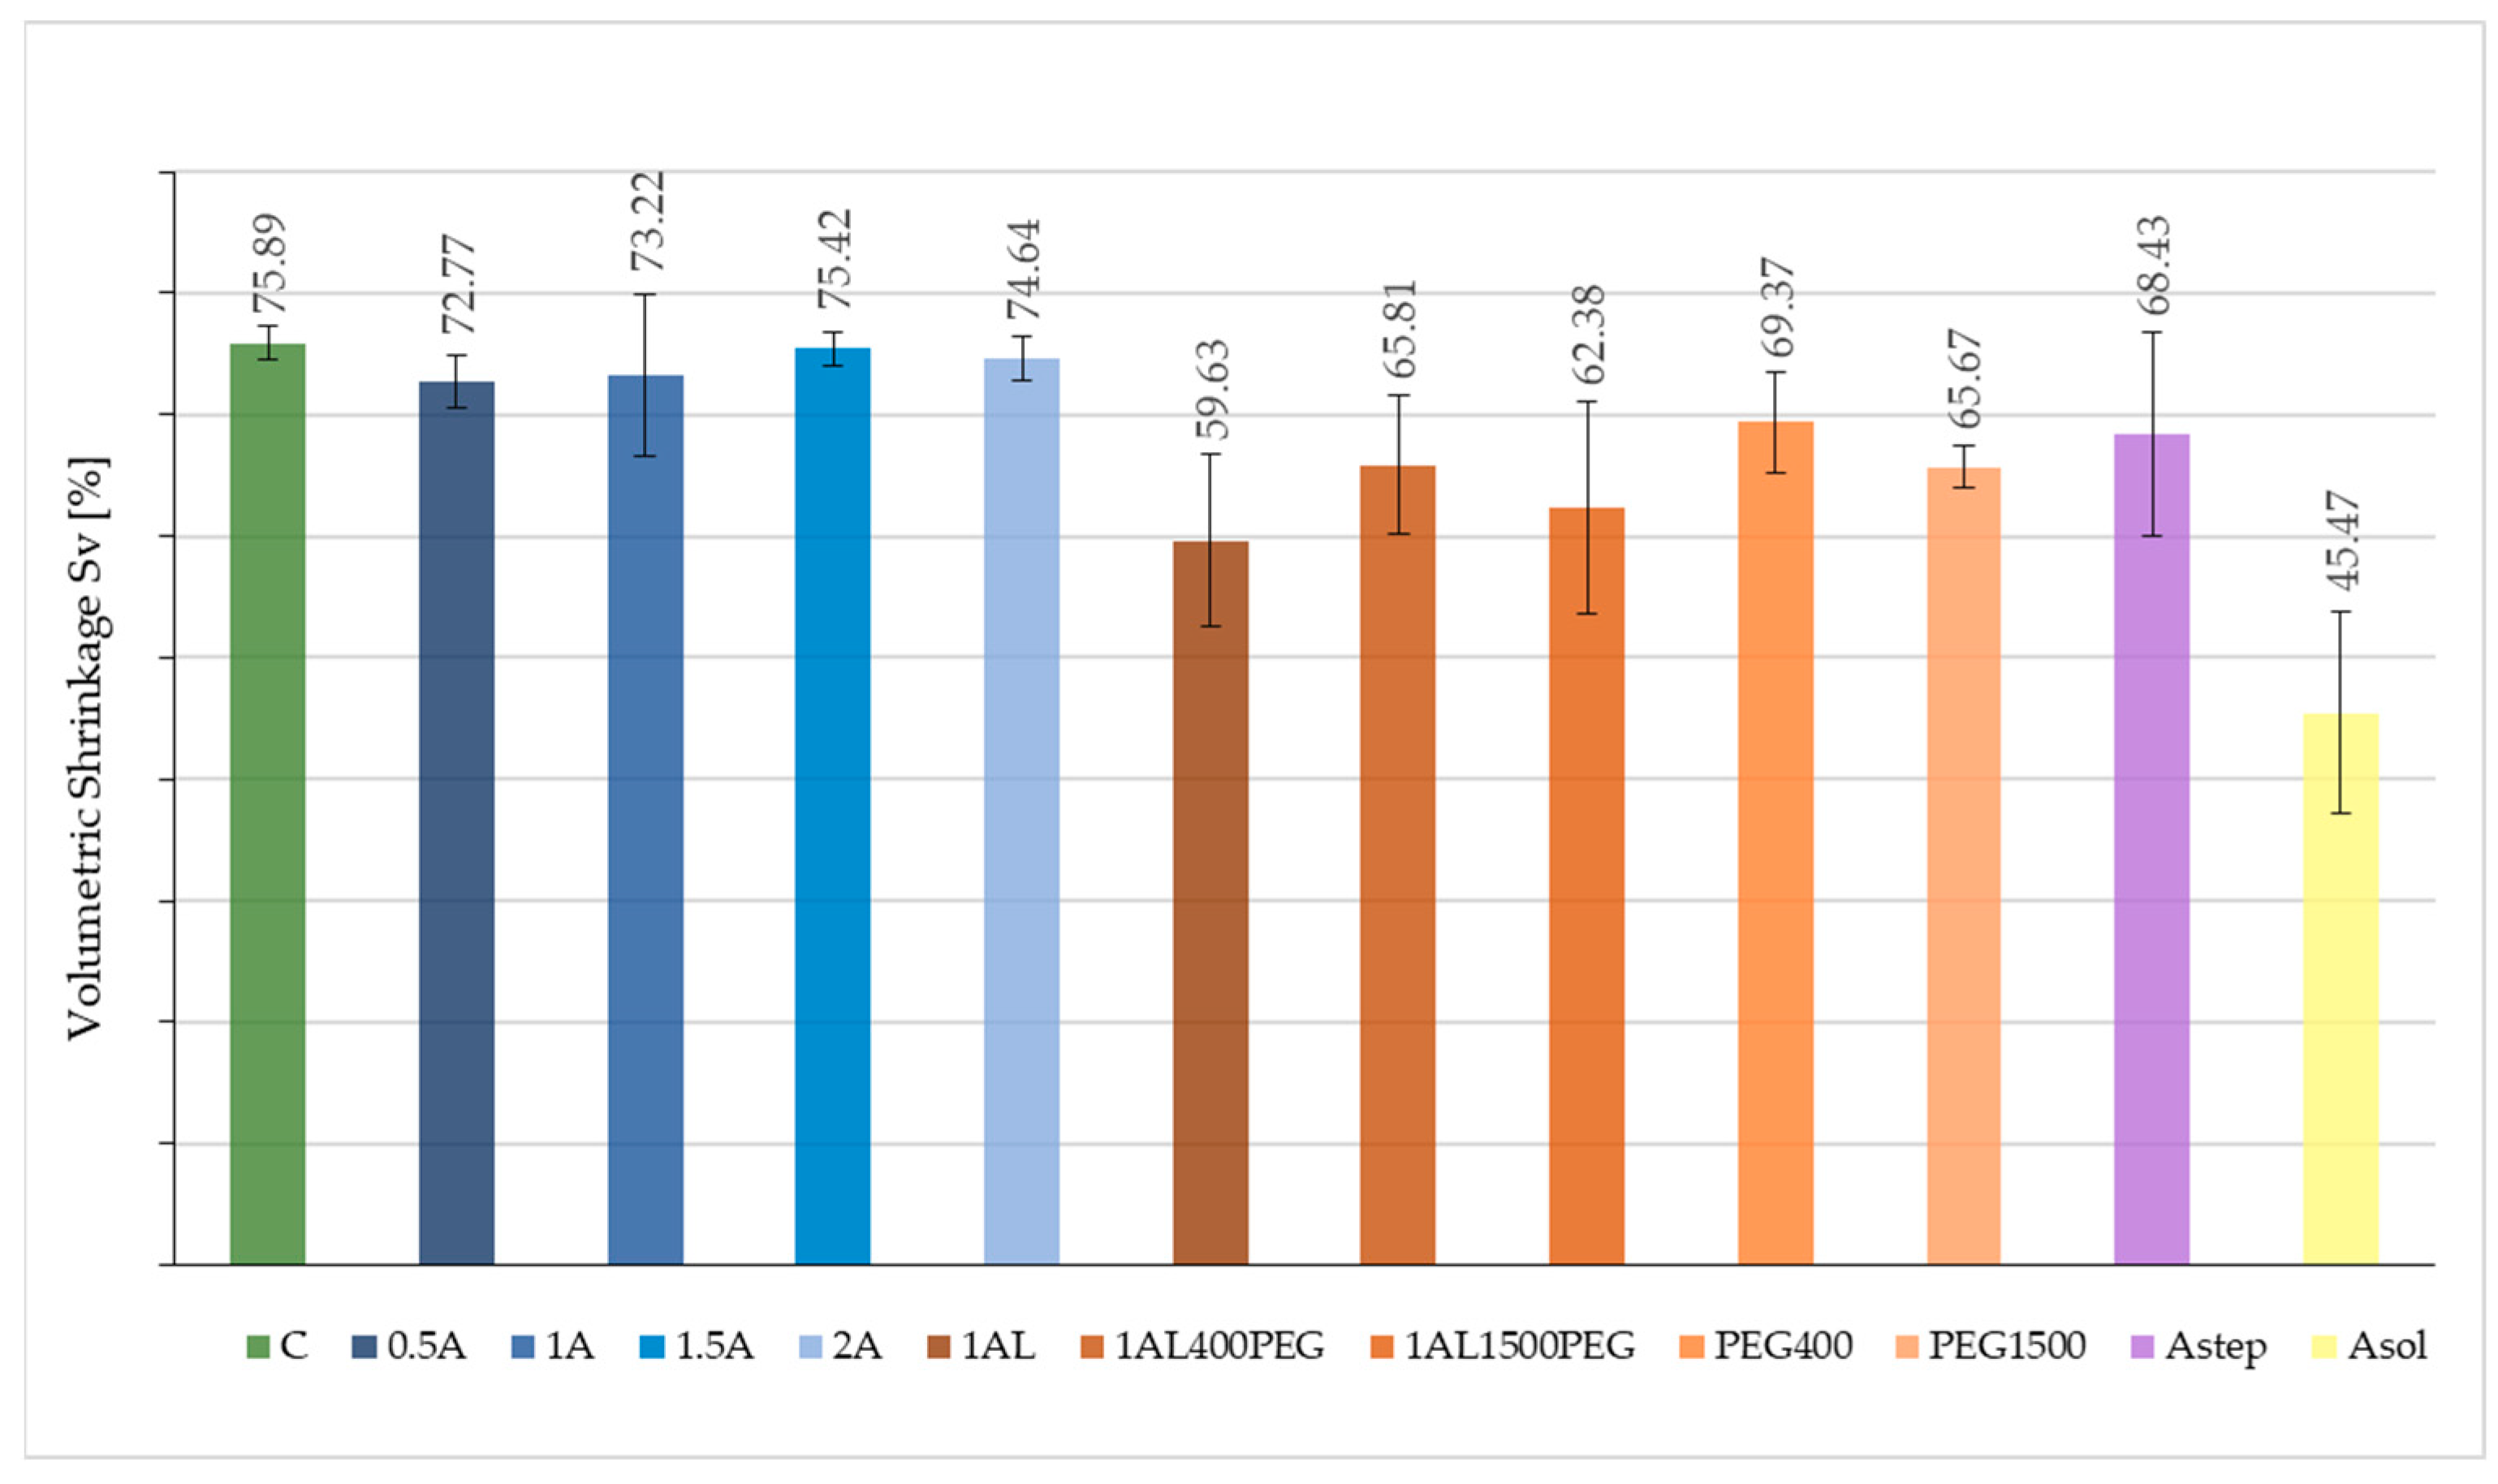
3.3. Stabilising Effectiveness of Alginate-Based Treatments

Macroscopic observations of the wood samples treated with alginate solutions using an oscillating-pressure method and untreated control after drying (Figure 4) revealed no significant differences between them. Compared to specimens fully saturated with water (wet waterlogged samples in Figure 4), all air-dried samples, untreated and treated, despite keeping the original wood colour, shrunk significantly, indicating the ineffectiveness of applied treatments in stabilising waterlogged wood dimensions.
Slightly better results were obtained for waterlogged wood treated using a soaking method, in particular for those impregnated with 1% alginate, mixtures of alginate and PEGs, and those left to dry in a conservation solution (Figure 5). It can be seen, however, that the effectiveness of applied treatments was uneven despite a similar degree of degradation of wood specimens—some samples were more and others less shrunken (the most and the least shrunken examples for each treatment are presented in Figure 5). In some cases, the dimensions after drying were different for different parts of the same wooden block. This might result from the anatomical structure of the wood (the proportion between early- and latewood or local differences in the degree of degradation), uneven penetration of conservation agents in wood, or/and from uneven drying producing higher capillary forces, leading to higher shrinkage.
The best results were obtained for the samples dried from a solution, which showed much less shrinkage compared to others. This suggests that prolonged exposure to alginate under slowed-down drying conditions may have allowed for better penetration and more uniform alginate polymerisation inside wood tissue. On the other hand, unlike the rest of the treated samples, the surfaces of specimens dried with this method were covered with a film reflecting light, which changed the natural wood appearance, but since alginate is soluble in water, it should be relatively easy to remove.
Parameters calculated based on changes in wood dimensions before and after treatment and air-drying, such as volumetric wood shrinkage and anti-shrink efficiency, are presented in Table 2 and Figure 6 (for better visualisation). The volumetric shrinkage values for untreated wood and wood treated using the oscillating-pressure method all exceed 70%, showing the ineffectiveness of the applied treatment. Sv values for samples treated using the soaking method are slightly lower, ranging between 60% and 70%, except for the least shrunken Asol sample with an Sv of 45.5%, signalling the somewhat higher stabilising effectiveness of the treatments using this method. The calculated ASE values are in the range of 0.6%–21.5%, except for Asol, with an ASE value of 40%. They are too low from the conservation perspective to consider the applied treatments effective since the minimum ASE for a declared conservation method is 75% [99]. For comparison, the anti-shrink efficiency of the traditional treatment with PEG combined with slow freeze-drying or air-drying, depending on the concentration and molecular weight and PEG, and the degree of degradation of treated wood, on average, range from 41% to 116% [14,15,16,17,100,101,102], where lower values were achieved for low PEG concentrations (up to 20%), shorter treatment time, or poorly selected PEG type in relation to the degree of wood degradation.

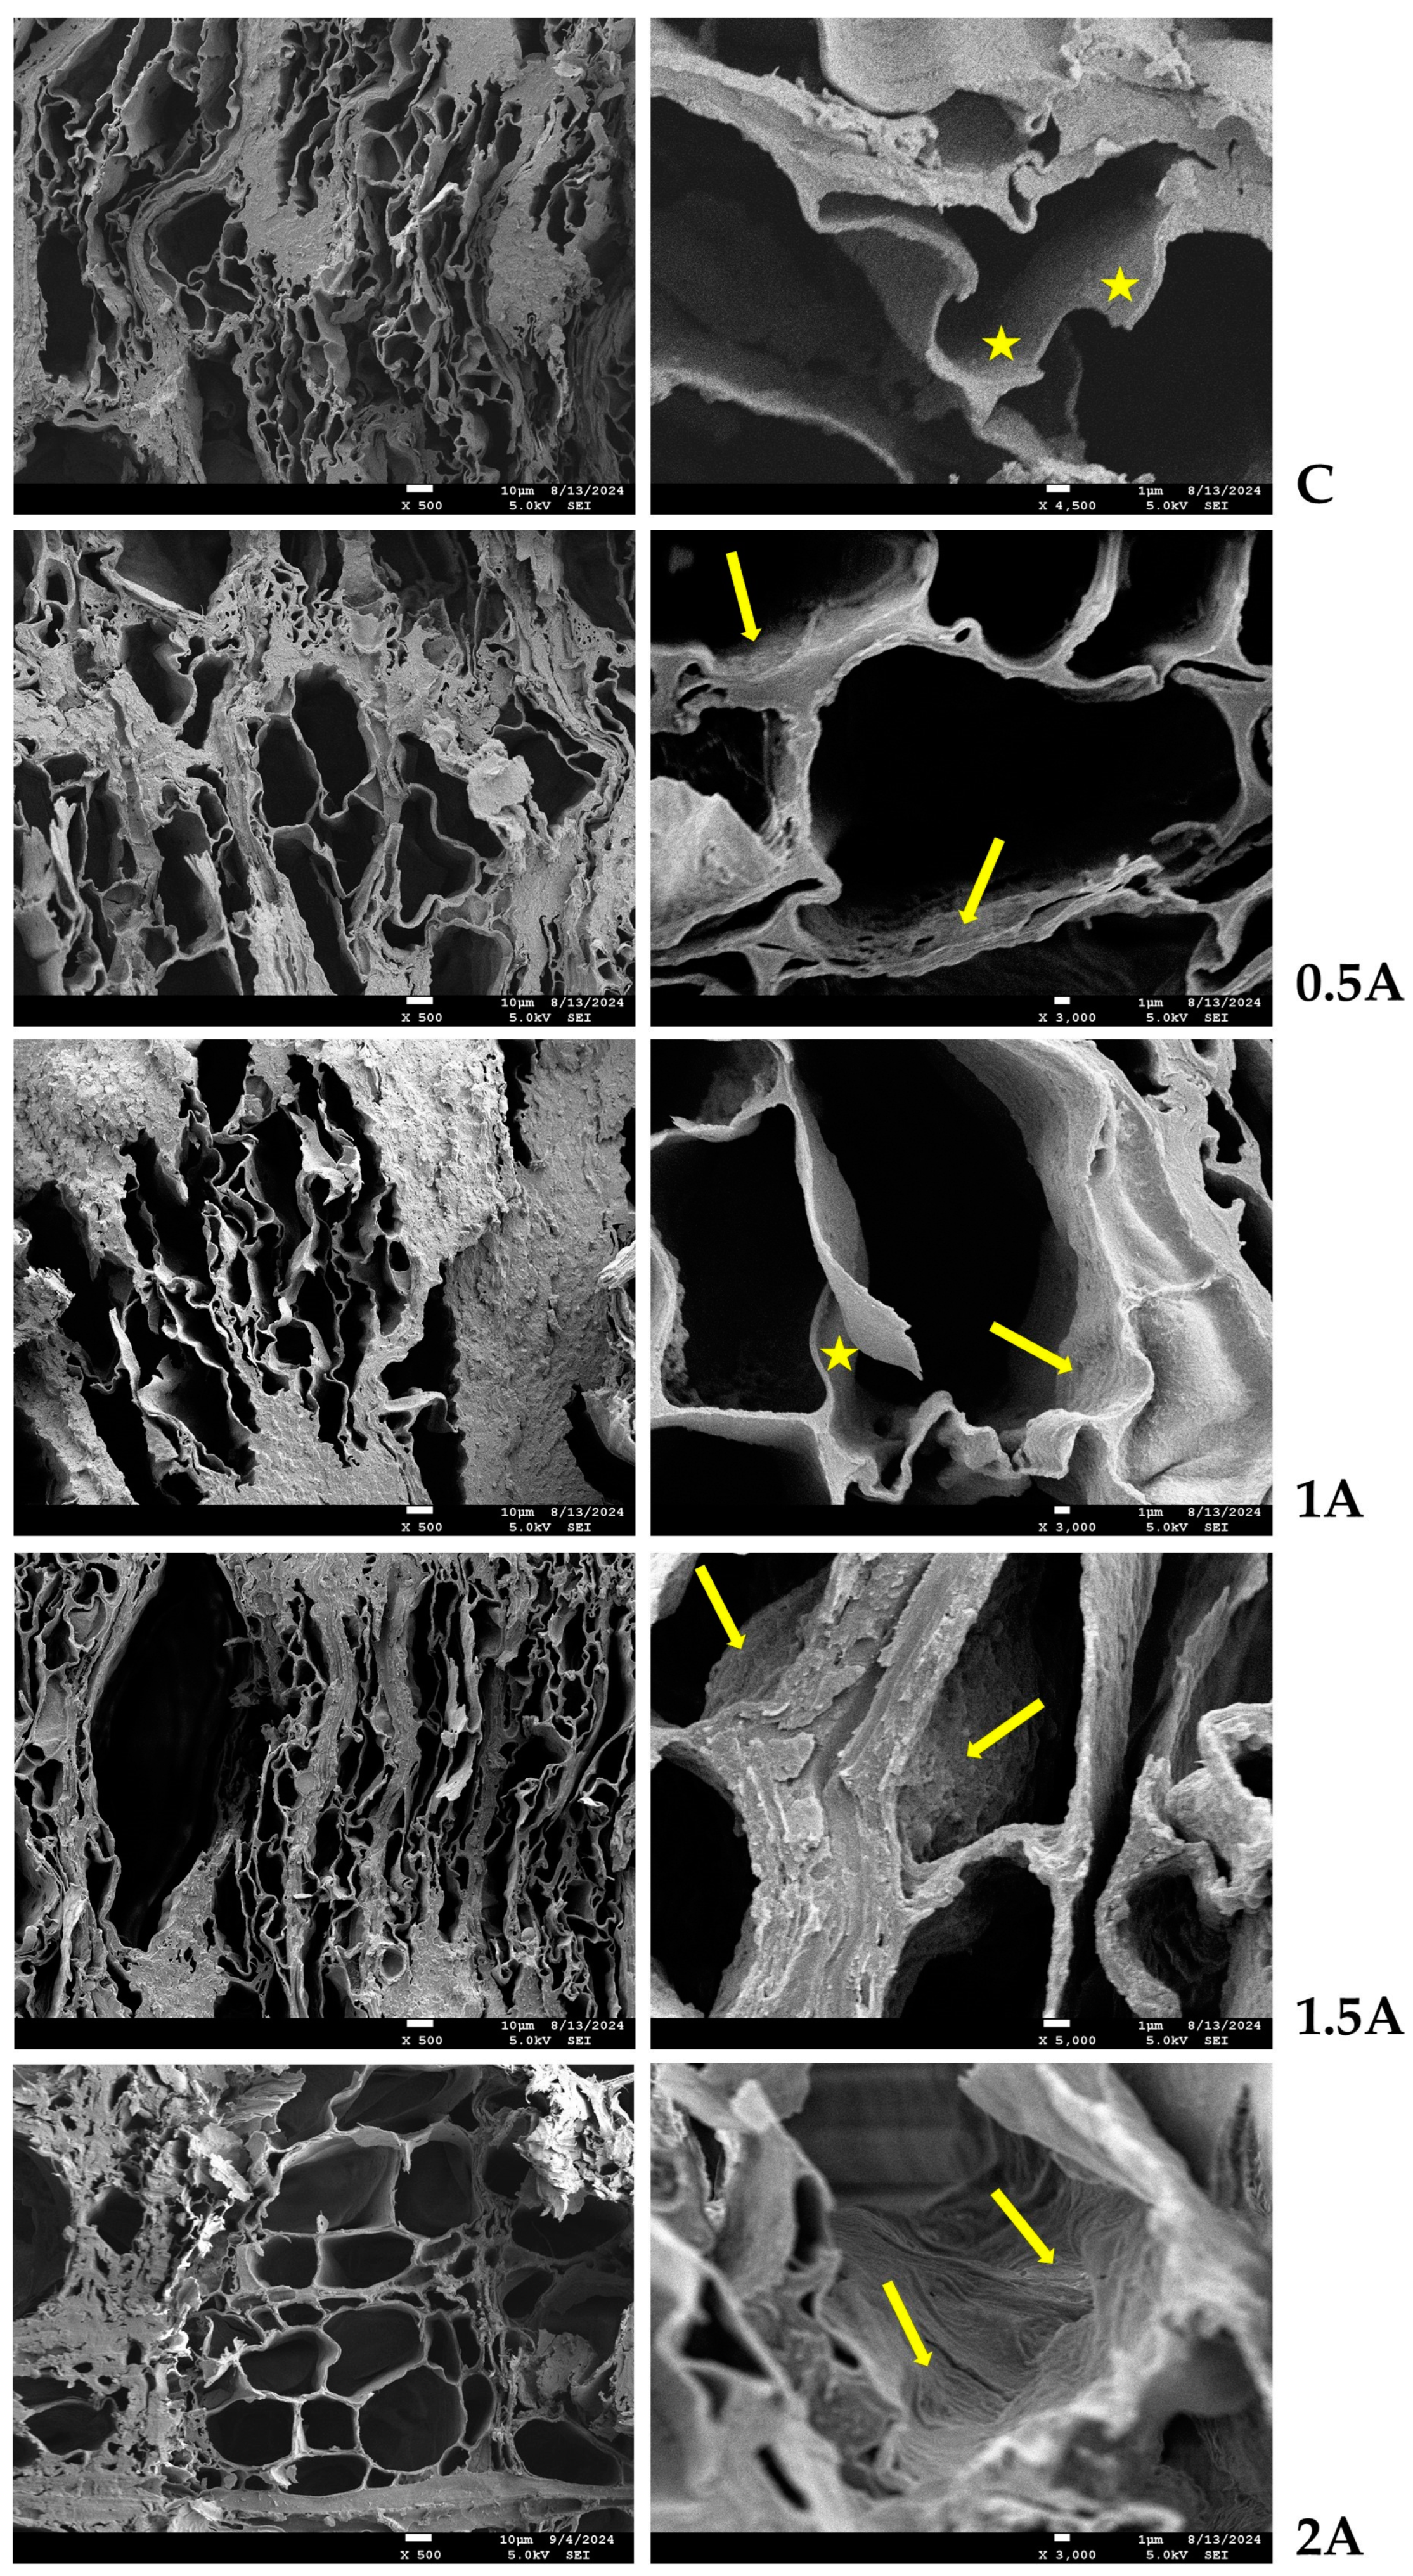
3.4. Microscopic Observations of Untreated and Treated Wood

SEM images reveal the internal structure of untreated and treated waterlogged elm wood. From Figure 7, where images of wood treated using the oscillating-pressure method are presented, an uneven wood structure can be seen, with parts containing highly shrunken cells and others with more regular shapes, which align with the macroscopic observations of the samples. Images taken under higher magnification reveal details about the cell walls. In the control sample (C), the cell wall surface is smooth, with no visible substances on it (marked with stars). In the case of treated samples, some fibrous coatings can be seen in several parts of cell wall surfaces (arrows), which are presumably alginate films polymerised inside wood. It is worth noting that all visible cell lumina are empty, and the polymer network can be observed only on the cell walls, enabling additional conservation of already treated wood if necessary.
The internal structures of wood samples treated using the soaking method are presented in Figure 8. For Asol and 1Al samples, the shape of cells is more regular, which aligns with the calculated shrinkage values and macroscopic observations. However, for some other samples, similar to Figure 7, areas with more and less shrunken cells can be seen, confirming the unevenness of dimensional stability provided by the applied treatments. Some fibrous coatings are present on several cell wall surfaces, while others remain smooth, as they have not been covered with any additional substance. Since the FT-IR analysis confirmed the presence of alginate and PEGs in all treated samples, the lack of a visible coating may mean that the wood area selected for SEM imaging was not penetrated by the conservation agent (which contradicts the well-preserved shape of cells) or that the coating is smooth and is therefore challenging to recognise using scanning electron microscopy.

4. Conclusions

The presented research aimed to evaluate the effectiveness of sodium alginate used for waterlogged wood treatment to stabilise its dimensions during drying.
The results showed that alginate solution in water in the concentration range between 0.5% and 2% can penetrate degraded wood tissue, with 1% being the most effective one providing the highest weight percent gain. Higher alginate concentrations are too viscous to be used for wood impregnation. Adding PEG does not enhance alginate penetration into wood or provide any additional dimensional stabilisation.
A soaking method was more effective than the oscillating-pressure one applied for waterlogged wood impregnation with alginate solution, providing higher retention of the conservation agent and better dimensional stabilisation.
The best stabilising results were obtained for wood treated with 1% alginate solution using a soaking method and left to slow dry in the solution (Asol sample), suggesting that prolonged exposure to alginate under slowed-down drying conditions may have allowed for better penetration and more uniform alginate polymerisation inside wood tissue. The stabilising effectiveness may result not only from its good penetrability throughout wood but also from interactions with wood polymers through hydrogen bonds and cross-linking during polymerisation.
Treatment with sodium alginate does not alter the natural wood colour or make it extremely heavy.
Although the dimensional stability provided by the applied alginate treatment is insufficient from the conservation perspective, reaching a maximum ASE of 40% for the Asol sample when the minimum ASE for a declared conservation method is 75%, we showed that sodium alginate has great potential in wood conservation. Its compatibility with wood structure, good penetration, non-toxicity, solubility in water, and easy polymerisation involving interactions with other polymers make it a promising consolidation agent worth further study. Lowering the viscosity of alginate solutions to enable the application of its higher concentrations and investigating chemical modifications to increase alginate reactivity with wood polymers and enhance the penetrability of its molecules in wood seem to be good research directions for the near future.

Author Contributions

Conceptualisation, E.V. and M.B.; methodology, M.B., E.V., C.-M.P. and M.J.; formal analysis, M.B. and S.C.; investigation, E.V., M.B., C.-M.P., V.S. and M.J.; writing—original draft preparation, E.V., M.B. and S.C.; writing—review and editing, M.B., E.V., S.C., V.S., C.-M.P. and M.J.; visualisation, M.B. and E.V.; supervision, M.B. and S.C. All authors have read and agreed to the published version of the manuscript.

Funding

This research received no external funding.

Data Availability Statement

The data presented in this study are available on request from the corresponding authors.

Acknowledgments

The authors would like to express their gratitude to the Directorate of the Museum of the First Piasts at Lednica for sharing the waterlogged elm log.

Conflicts of Interest

The authors declare no conflicts of interest.

References

  1. Jordan, B.A. Site characteristics impacting the survival of historic waterlogged wood: A review. Int. Biodeterior. Biodegrad. 2001, 47, 47–54. [Google Scholar] [CrossRef]
  2. Broda, M.; Hill, C.A.S. Conservation of Waterlogged Wood—Past, Present and Future Perspectives. Forests 2021, 12, 1193. [Google Scholar] [CrossRef]
  3. Björdal, C.G. Microbial degradation of waterlogged archaeological wood. J. Cult. Herit. 2012, 13, S118–S122. [Google Scholar] [CrossRef]
  4. Capretti, C.; Macchioni, N.; Pizzo, B.; Galotta, G.; Giachi, G.; Giampaola, D. The characterization of waterlogged archaeological wood: The three roman ships found in naples (Italy). Archaeometry 2008, 50, 855–876. [Google Scholar] [CrossRef]
  5. Singh, A.P.; Kim, Y.S.; Chavan, R.R. Advances in Understanding Microbial Deterioration of Buried and Waterlogged Archaeological Woods: A Review. Forests 2022, 13, 394. [Google Scholar] [CrossRef]
  6. Björdal, C.; Nilsson, T.; Daniel, G. Microbial decay of waterlogged archaeological wood found in Sweden Applicable to archaeology and conservation. Int. Biodeterior. Biodegrad. 1999, 43, 63–73. [Google Scholar] [CrossRef]
  7. Singh, A.P.; Kim, Y.S.; Singh, T. Bacterial Degradation of Wood. In Secondary Xylem Biology; Elsevier: Amsterdam, The Netherlands, 2016; pp. 169–190. [Google Scholar]
  8. Hocker, E.; Almkvist, G.; Sahlstedt, M. The Vasa experience with polyethylene glycol: A conservator’s perspective. J. Cult. Herit. 2012, 13, S175–S182. [Google Scholar] [CrossRef]
  9. Collett, H.; Bouville, F.; Giuliani, F.; Schofield, E. Structural Monitoring of a Large Archaeological Wooden Structure in Real Time, Post PEG Treatment. Forests 2021, 12, 1788. [Google Scholar] [CrossRef]
  10. Mortensen, M.N.; Egsgaard, H.; Hvilsted, S.; Shashoua, Y.; Glastrup, J. Characterisation of the polyethylene glycol impregnation of the Swedish warship Vasa and one of the Danish Skuldelev Viking ships. J. Archaeol. Sci. 2007, 34, 1211–1218. [Google Scholar] [CrossRef]
  11. Piva, E. Conservation of a Tudor Warship: Investigating the Timbers of the Mary Rose. Ph.D. Thesis, University of Portsmouth, Portsmouth, UK, 2017. [Google Scholar]
  12. Hoffmann, P.; Singh, A.; Kim, Y.; Wi, S.; Kim, I.-J.; Schmitt, U. The Bremen Cog of 1380—An electron microscopic study of its degraded wood before and after stabilization with PEG. Holzforschung 2004, 58, 211–218. [Google Scholar] [CrossRef]
  13. Hoffmann, P. To be and to continue being a Cog: The conservation of the Bremen Cog of 1380. Int. J. Naut. Archaeol. 2001, 30, 129–140. [Google Scholar] [CrossRef]
  14. Ossowski, W. (Ed.) The Copper Ship: A Medieval Shipwreck and Its Cargo; Narodowe Muzeum Morskie: Gdańsk, Poland, 2014. [Google Scholar]
  15. Grattan, D. A practical comparative study of several treatments for waterlogged wood. Stud. Conserv. 1982, 27, 124–136. [Google Scholar] [CrossRef]
  16. Jensen, P.; Schnell, U. The Implications of Using Low Molecular Weight PEG for Impregnation of Waterlogged Archaeological Wood Prior to Freeze Drying. In Proceedings of the 9th ICOM Group on Wet Organic Archaeological Materials Conference, Copenhagen, Denmark, 7–11 June 2004; pp. 279–308. [Google Scholar]
  17. Hoffmann, P. On the stabilization of waterlogged oakwood with PEG. II. Designing a two-step treatment for multi-quality timbers. Stud. Conserv. 1986, 31, 103–113. [Google Scholar] [CrossRef]
  18. Albright, A.B. The Preservation of Small Water-Logged Wood Specimens with Polyethylene Glycol. Curator Mus. J. 1966, 9, 228–234. [Google Scholar] [CrossRef]
  19. Smith, C.W. Archaeological Conservation Using Polymers: Practical Applications for Organic Artifact Stabilization; Texas A&M University Press: College Station, TX, USA, 2006. [Google Scholar]
  20. Lechner, T.; Bjurhager, I.; Kliger, R.I. Strategy for developing a future support system for the Vasawarship and evaluating its mechanical properties. Herit. Sci. 2013, 1, 35. [Google Scholar] [CrossRef]
  21. Bjurhager, I.; Ljungdahl, J.; Wallström, L.; Gamstedt, E.K.; Berglund, L.A. Towards improved understanding of PEG-impregnated waterlogged archaeological wood: A model study on recent oak. Holzforschung 2010, 64, 243–250. [Google Scholar] [CrossRef]
  22. Vorobyev, A.; van Dijk, N.P.; Gamstedt, E.K. Orthotropic creep in polyethylene glycol impregnated archaeological oak from the Vasa ship. Mech. Time Depend. Mater. 2018, 23, 35–52. [Google Scholar] [CrossRef]
  23. Olek, W.; Majka, J.; Stempin, A.; Sikora, M.; Zborowska, M. Hygroscopic properties of PEG treated archaeological wood from the rampart of the 10th century stronghold as exposed in the Archaeological Reserve Genius loci in Poznań (Poland). J. Cult. Herit. 2016, 18, 299–305. [Google Scholar] [CrossRef]
  24. Almkvist, G.; Hocker, E.; Sahlstedt, M. Iron Removal from Waterlogged Wood; SLU Repro: Uppsala, Sweden, 2013. [Google Scholar]
  25. Almkvist, G.; Persson, I. Degradation of polyethylene glycol and hemicellulose in the Vasa. Holzforschung 2007, 62, 64–70. [Google Scholar] [CrossRef]
  26. Glastrup, J.; Shashoua, Y.; Egsgaard, H.; Mortensen, M.N. Degradation of PEG in the Warship Vasa. Macromol. Symp. 2006, 238, 22–29. [Google Scholar] [CrossRef]
  27. Kaye, B. Conservation of waterlogged archaeological wood. Chem. Soc. Rev. 1995, 24, 35–43. [Google Scholar] [CrossRef]
  28. Grattan, D.W.; Clarke, R.W. 9—Conservation of Waterlogged Wood. In Conservation of Marine Archaeological Objects; Pearson, C., Ed.; Butterworth-Heinemann: Oxford, UK, 1987; pp. 164–206. ISBN 978-0-408-10668-9. [Google Scholar]
  29. Liu, L.; Zhang, L.; Zhang, B.; Hu, Y. A comparative study of reinforcement materials for waterlogged wood relics in laboratory. J. Cult. Herit. 2018, 36, 94–102. [Google Scholar] [CrossRef]
  30. Kennedy, A.; Pennington, E.R. Conservation of chemically degraded waterlogged wood with sugars. Stud. Conserv. 2014, 59, 194–201. [Google Scholar] [CrossRef]
  31. Babiński, L. Dimensional changes of waterlogged archaeological hardwoods pre-treated with aqueous mixtures of lactitol/trehalose and mannitol/trehalose before freeze-drying. J. Cult. Herit. 2015, 16, 876–882. [Google Scholar] [CrossRef]
  32. Tahira, A.; Howard, W.; Pennington, E.R.; Kennedy, A. Mechanical strength studies on degraded waterlogged wood treated with sugars. Stud. Conserv. 2016, 62, 223–228. [Google Scholar] [CrossRef]
  33. Han, L.; Guo, J.; Tian, X.; Jiang, X.; Yin, Y. Evaluation of PEG and sugars consolidated fragile waterlogged archaeological wood using nanoindentation and ATR-FTIR imaging. Int. Biodeterior. Biodegrad. 2022, 170, 105390. [Google Scholar] [CrossRef]
  34. Parrent, J.M. The conservation of waterlogged wood using sucrose. Stud. Conserv. 1985, 30, 63–72. [Google Scholar] [CrossRef]
  35. Hu, Y.; Wang, X.; Liu, L.; Zhang, B.; Jiang, L. Preparation of bacterial cellulose for xylitol-reinforced waterlogged wood. Archaeometry 2024, 66, 618–632. [Google Scholar] [CrossRef]
  36. Endo, R.; Kamei, K.; Iida, I.; Yokoyama, M.; Kawahara, Y. Physical and mechanical properties of waterlogged wood treated with hydrolyzed feather keratin. J. Archaeol. Sci. 2010, 37, 1311–1316. [Google Scholar] [CrossRef]
  37. Endo, R.; Kamei, K.; Iida, I.; Kawahara, Y. Dimensional stability of waterlogged wood treated with hydrolyzed feather keratin. J. Archaeol. Sci. 2008, 35, 1240–1246. [Google Scholar] [CrossRef]
  38. Endo, R.; Sugiyama, J. New attempts with the keratin-metal/magnesium process for the conservation of archaeological waterlogged wood. J. Cult. Herit. 2022, 54, 53–58. [Google Scholar] [CrossRef]
  39. Endo, R.; Sugiyama, J. Evaluation of cell wall reinforcement in feather keratin-treated waterlogged wood as imaged by synchrotron X-ray microtomography (μXRT) and TEM. Holzforschung 2013, 67, 795–803. [Google Scholar] [CrossRef]
  40. Giachi, G.; Capretti, C.; Donato, I.D.; Macchioni, N.; Pizzo, B. New trials in the consolidation of waterlogged archaeological wood with different acetone-carried products. J. Archaeol. Sci. 2011, 38, 2957–2967. [Google Scholar] [CrossRef]
  41. Christensen, M.; Hansen, F.K.; Kutzke, H. Phenol Formaldehyde Revisited-Novolac Resins for the Treatment of Degraded Archaeological Wood. Archaeometry 2014, 57, 536–559. [Google Scholar] [CrossRef]
  42. Broda, M.; Dąbek, I.; Dutkiewicz, A.; Dutkiewicz, M.; Popescu, C.-M.; Mazela, B.; Maciejewski, H. Organosilicons of different molecular size and chemical structure as consolidants for waterlogged archaeological wood—A new reversible and retreatable method. Sci. Rep. 2020, 10, 2188. [Google Scholar] [CrossRef] [PubMed]
  43. Broda, M.; Jakes, J.E.; Li, L.; Antipova, O.A.; Maxey, E.R.; Jin, Q. Conservation of model degraded pine wood with selected organosilicons studied by XFM and nanoindentation. Wood Sci. Technol. 2024, 58, 649–675. [Google Scholar] [CrossRef]
  44. Parisi, F.; Bernardini, F.; Cavallaro, G.; Mancini, L.; Milioto, S.; Prokop, D.; Lazzara, G. Halloysite nanotubes/pluronic nanocomposites for waterlogged archeological wood: Thermal stability and X-ray microtomography. J. Therm. Anal. Calorim. 2020, 141, 981–989. [Google Scholar] [CrossRef]
  45. Cavallaro, G.; Lazzara, G.; Milioto, S.; Parisi, F.; Ruisi, F. Nanocomposites based on esterified colophony and halloysite clay nanotubes as consolidants for waterlogged archaeological woods. Cellulose 2017, 24, 3367–3376. [Google Scholar] [CrossRef]
  46. Cavallaro, G.; Milioto, S.; Parisi, F.; Lazzara, G. Halloysite Nanotubes Loaded with Calcium Hydroxide: Alkaline Fillers for the Deacidification of Waterlogged Archeological Woods. ACS Appl. Mater. Interfaces 2018, 10, 27355–27364. [Google Scholar] [CrossRef]
  47. Walsh, Z.; Janeček, E.-R.; Jones, M.; Scherman, O.A. Natural polymers as alternative consolidants for the preservation of waterlogged archaeological wood. Stud. Conserv. 2016, 62, 173–183. [Google Scholar] [CrossRef]
  48. Walsh-Korb, Z.; Stelzner, I.; dos Santos Gabriel, J.; Eggert, G.; Avérous, L. Morphological Study of Bio-Based Polymers in the Consolidation of Waterlogged Wooden Objects. Materials 2022, 15, 681. [Google Scholar] [CrossRef]
  49. Christensen, M.; Larnøy, E.; Kutzke, H.; Hansen, F.K. Treatment of waterlogged archaeological wood using chitosan- and modified chitosan solutions. part 1: Chemical compatibility and microstructure. J. Am. Inst. Conserv. 2015, 54, 3–13. [Google Scholar] [CrossRef]
  50. Gregory, D.J.; Shashoua, Y.; Hansen, N.B.; Jensen, P. Anyone for a Nice Cup of Tea? The Use of Bacterial Cellulose for Conservation of Waterlogged Archaeological Wood. In Proceedings of the ICOM-CC 18th Triennial Conference, Copenhagen, Denmark, 4–8 September 2017. [Google Scholar]
  51. Cipriani, G.; Salvini, A.; Baglioni, P.; Bucciarelli, E. Cellulose as a renewable resource for the synthesis of wood consolidants. J. Appl. Polym. Sci. 2010, 118, 2939–2950. [Google Scholar] [CrossRef]
  52. Cipriani, G.; Salvini, A.; Fioravanti, M.; Di Giulio, G.; Malavolti, M. Synthesis of hydroxylated oligoamides for their use in wood conservation. J. Appl. Polym. Sci. 2012, 127, 420–431. [Google Scholar] [CrossRef]
  53. McHale, E.; Braovac, S.; Steindal, C.C.; Gillis, R.B.; Adams, G.G.; Harding, S.E.; Benneche, T.; Kutzke, H. Synthesis and characterisation of lignin-like oligomers as a bio-inspired consolidant for waterlogged archaeological wood. Pure Appl. Chem. 2016, 88, 969–977. [Google Scholar] [CrossRef]
  54. McHale, E.; Steindal, C.C.; Kutzke, H.; Benneche, T.; Harding, S.E. In situ polymerisation of isoeugenol as a green consolidation method for waterlogged archaeological wood. Sci. Rep. 2017, 7, 46481. [Google Scholar] [CrossRef] [PubMed]
  55. Wu, M.; Han, X.; Zhang, Z.; Wang, J. Effectiveness Evaluation of Silicone Oil Emulsion in Situ Polymerization for Dehydration of Waterlogged Wooden Artifacts. Molecules 2024, 29, 4971. [Google Scholar] [CrossRef] [PubMed]
  56. Zhou, Y.; Zhang, Y.; Wang, K.; Hu, D. Well-controlled SI-ARGET ATRP of EGDMA for maintaining the dimensions of waterlogged archaeological wood. Wood Sci. Technol. 2023, 57, 523–535. [Google Scholar] [CrossRef]
  57. Zhou, Y.; Wang, K.; Hu, D. Surface-initiated ARGET ATRP for maintaining the dimension of waterlogged archaeological wood (Pinus massoniana): Polymer distribution behaviors and anti-shrinkage mechanism. Wood Sci. Technol. 2021, 56, 205–218. [Google Scholar] [CrossRef]
  58. Zhou, Y.; Wang, K.; Hu, D. An aqueous approach to functionalize waterlogged archaeological wood followed by improved surface-initiated ARGET ATRP for maintaining dimensional stability. Cellulose 2021, 28, 2433–2443. [Google Scholar] [CrossRef]
  59. Zhou, Y.; Wang, K.; Hu, D. High retreatability and dimensional stability of polymer grafted waterlogged archaeological wood achieved by ARGET ATRP. Sci. Rep. 2019, 9, 9879. [Google Scholar] [CrossRef] [PubMed]
  60. Caruso, M.R.; Cavallaro, G.; Milioto, S.; Lazzara, G. Halloysite nanotubes/Keratin composites for wool treatment. Appl. Clay Sci. 2023, 238, 106930. [Google Scholar] [CrossRef]
  61. Papacchini, A.; Dominici, S.; Di Giulio, G.; Fioravanti, M.; Salvini, A. Bio-based consolidants for waterlogged archaeological wood: Assessment of the performance and optimization of the diagnostic protocol. J. Cult. Herit. 2019, 40, 49–58. [Google Scholar] [CrossRef]
  62. Ciolacu, F.; Nicu, R.; Balan, T.; Bobu, E. Chitosan Derivatives as Bio-based Materials for Paper Heritage Conservation. BioResources 2016, 12, 735–747. [Google Scholar] [CrossRef]
  63. Çakmak, Y.; Çakmakçi, E.; Apohan, N.K.; Karadag, R. Isosorbide, pyrogallol, and limonene-containing thiol-ene photocured bio-based organogels for the cleaning of artworks. J. Cult. Herit. 2022, 55, 391–398. [Google Scholar] [CrossRef]
  64. Biro, C. Researching and Developing Bio-based Materials for the Transport, Conservation and Exhibition of Museum Collections: A Case Study from France. Mus. Int. 2023, 75, 136–147. [Google Scholar] [CrossRef]
  65. Irizar, P.; Pintor-Rial, A.; Martinez-Arkarazo, I.; Olazabal, M.; Ruiz-Rubio, L.; Cardiano, P.; Gomez-Laserna, O. Bio-based hybrid nanocomposites as multifunctional sustainable materials for stone conservation. Prog. Org. Coat. 2023, 185, 107899. [Google Scholar] [CrossRef]
  66. Paolino, B.; Sorrentino, M.C.; Pacifico, S. Greener solutions for biodeterioration of organic-media cultural heritage: Where are we? Herit. Sci. 2024, 12, 334. [Google Scholar] [CrossRef]
  67. Caruso, M.R.; D’agostino, G.; Milioto, S.; Cavallaro, G.; Lazzara, G. A review on biopolymer-based treatments for consolidation and surface protection of cultural heritage materials. J. Mater. Sci. 2023, 58, 12954–12975. [Google Scholar] [CrossRef]
  68. Ching, S.H.; Bansal, N.; Bhandari, B. Alginate gel particles—A review of production techniques and physical properties. Crit. Rev. Food Sci. Nutr. 2015, 57, 1133–1152. [Google Scholar] [CrossRef] [PubMed]
  69. Abka-Khajouei, R.; Tounsi, L.; Shahabi, N.; Patel, A.K.; Abdelkafi, S.; Michaud, P. Structures, Properties and Applications of Alginates. Mar. Drugs 2022, 20, 364. [Google Scholar] [CrossRef] [PubMed]
  70. Lee, K.Y.; Mooney, D.J. Alginate: Properties and biomedical applications. Prog. Polym. Sci. 2012, 37, 106–126. [Google Scholar] [CrossRef]
  71. Akbar, M.; Yaqoob, A.; Ahmad, A.; Luque, R. Chapter 1—Sodium Alginate: An Overview. In Sodium Alginate-Based Nanomaterials for Wastewater Treatment; Ahmad, A., Ahmad, I., Kamal, T., Asiri, A.M., Tabassum, S., Eds.; Micro and Nano Technologies; Elsevier: Amsterdam, The Netherlands, 2023; pp. 1–17. ISBN 978-0-12-823551-5. [Google Scholar]
  72. Lee, C.; Volpi, F.; Fiocco, G.; Weththimuni, M.L.; Licchelli, M.; Malagodi, M. Preliminary Cleaning Approach with Alginate and Konjac Glucomannan Polysaccharide Gel for the Surfaces of East Asian and Western String Musical Instruments. Materials 2022, 15, 1100. [Google Scholar] [CrossRef] [PubMed]
  73. Lee, C.; Fiocco, G.; Vigani, B.; Recca, T.; Rossi, S.; Licchelli, M.; Malagodi, M.; Weththimuni, M.L.; Volpi, F. Retentive bio-based chemical gel for removing glues from water-sensitive wooden artworks. J. Cult. Herit. 2024, 68, 9–16. [Google Scholar] [CrossRef]
  74. Salim, E.; Taha, A. Evaluating the Use of Sodium Alginate Polymer for Eco-friendly Consolidation and De-acidification of Ancient Printed Papers. Egypt. J. Chem. 2023, 66, 585–596. [Google Scholar] [CrossRef]
  75. Smith, C.A.; Paterson, R.A.; Lowe, B.J.; Kanawa, R.T. Consolidation of Black-dyed Māori Textile Artefacts: Evaluating the Efficacy of Sodium Alginate. Stud. Conserv. 2016, 63, 139–154. [Google Scholar] [CrossRef]
  76. Abdel-Maksoud, G.; Ghozy, H.; Ezzat, R.; Helmy, M.; Elsaka, M.; Gamal, M.; Mohamed, W.S. Evaluation of the efficiency of sodium alginate for the consolidation of bone artifacts. Egypt. J. Chem. 2022, 66, 357–366. [Google Scholar] [CrossRef]
  77. Chen, J.; Yang, L.; Zhang, X.; Gu, Y.; Su, B.; Sun, X.; Chen, Q. Alginate–Nanosilver Hydrogels: A Self-Dissolving System for Comprehensive Preservation of Waterlogged Wooden Artifacts. ACS Sustain. Chem. Eng. 2024, 12, 16091–16103. [Google Scholar] [CrossRef]
  78. Broda, M.; Spear, M.J.; Curling, S.F.; Ormondroyd, G.A. The Viscoelastic Behaviour of Waterlogged Archaeological Wood Treated with Methyltrimethoxysilane. Materials 2021, 14, 5150. [Google Scholar] [CrossRef] [PubMed]
  79. Broda, M.; Mazela, B.; Radka, K. Methyltrimethoxysilane as a stabilising agent for archaeological waterlogged wood differing in the degree of degradation. J. Cult. Herit. 2019, 35, 129–139. [Google Scholar] [CrossRef]
  80. Broda, M.; Yelle, D.J. Reactivity of Waterlogged Archeological Elm Wood with Organosilicon Compounds Applied as Wood Consolidants: 2D 1H–13C Solution-State NMR Studies. Molecules 2022, 27, 3407. [Google Scholar] [CrossRef]
  81. Grattan, D.W. Treatment of Waterlogged Wood. In Wet Site Archaeology; CRC Press: Boca Raton, FL, USA, 1988; ISBN 978-1-351-07775-0. [Google Scholar]
  82. Christensen, M.; Kutzke, H.; Hansen, F.K. New materials used for the consolidation of archaeological wood–past attempts, present struggles, and future requirements. J. Cult. Herit. 2012, 13, S183–S190. [Google Scholar] [CrossRef]
  83. Broda, M.; Mazela, B.; Dutkiewicz, A. Organosilicon compounds with various active groups as consolidants for the preservation of waterlogged archaeological wood. J. Cult. Herit. 2019, 35, 123–128. [Google Scholar] [CrossRef]
  84. Broda, M. Biological effectiveness of archaeological oak wood treated with methyltrimethoxysilane and PEG against Brown-rot fungi and moulds. Int. Biodeterior. Biodegradation 2018, 134, 110–116. [Google Scholar] [CrossRef]
  85. Morgós, A.; Imazu, S.; Ito, K. Sugar Conservation of Waterlogged Archaeological Finds in the Last 30 Years. In Proceedings of the Condition. 2015 Conservation and Digitalization Conference, Gdańsk, Poland, 19–22 May 2015; pp. 15–20. [Google Scholar]
  86. Wachsmann, S.; Raveh, K.; Cohen, O. The Kinneret boat project Part, I. The excavation and conservation of the Kinneret boat. Int. J. Naut. Archaeol. 1987, 16, 233–245. [Google Scholar] [CrossRef]
  87. Popescu, C.-M.; Popescu, M.-C.; Vasile, C. Structural analysis of photodegraded lime wood by means of FT-IR and 2D IR correlation spectroscopy. Int. J. Biol. Macromol. 2011, 48, 667–675. [Google Scholar] [CrossRef] [PubMed]
  88. Torniainen, P.; Popescu, C.-M.; Jones, D.; Scharf, A.; Sandberg, D. Correlation of Studies between Colour, Structure and Mechanical Properties of Commercially Produced ThermoWood® Treated Norway Spruce and Scots Pine. Forests 2021, 12, 1165. [Google Scholar] [CrossRef]
  89. Traoré, M.; Kaal, J.; Cortizas, A.M. Application of FTIR spectroscopy to the characterization of archeological wood. Spectrochim. Acta Part A Mol. Biomol. Spectrosc. 2016, 153, 63–70. [Google Scholar] [CrossRef]
  90. Kondo, T. Hydrogen Bonds in Cellulose and Cellulose Derivatives. Polysacch. Struct. Divers. Funct. Versatility 2005, 69–98. [Google Scholar]
  91. Xiao, Q.; Gu, X.; Tan, S. Drying process of sodium alginate films studied by two-dimensional correlation ATR-FTIR spectroscopy. Food Chem. 2014, 164, 179–184. [Google Scholar] [CrossRef] [PubMed]
  92. Popescu, C.-M.; Jones, D.; Kržišnik, D.; Humar, M. Determination of the effectiveness of a combined thermal/chemical wood modification by the use of FT–IR spectroscopy and chemometric methods. J. Mol. Struct. 2020, 1200, 127133. [Google Scholar] [CrossRef]
  93. Nguyen, H.; Lagarde, F.; Louarn, G.; Daniel, P. A new way to discriminate polluted wood by vibrational spectroscopies. Talanta 2017, 167, 436–441. [Google Scholar] [CrossRef] [PubMed]
  94. Faix, O. Classification of Lignins from Different Botanical Origins by FT-IR Spectroscopy. Holzforschung 1991, 45, 21–28. [Google Scholar] [CrossRef]
  95. Gelbrich, J.; Mai, C.; Militz, H. Chemical changes in wood degraded by bacteria. Int. Biodeterior. Biodegrad. 2008, 61, 24–32. [Google Scholar] [CrossRef]
  96. Huang, Y.; Wang, L.; Chao, Y.; Nawawi, D.S.; Akiyama, T.; Yokoyama, T.; Matsumoto, Y. Analysis of Lignin Aromatic Structure in Wood Based on the IR Spectrum. J. Wood Chem. Technol. 2012, 32, 294–303. [Google Scholar] [CrossRef]
  97. Popescu, C.-M.; Broda, M. Interactions between Different Organosilicons and Archaeological Waterlogged Wood Evaluated by Infrared Spectroscopy. Forests 2021, 12, 268. [Google Scholar] [CrossRef]
  98. Khanna, L.; Verma, N.K. PEG/CaFe2O4 nanocomposite: Structural, morphological, magnetic and thermal analyses. Phys. B Condens. Matter 2013, 427, 68–75. [Google Scholar] [CrossRef]
  99. Grattan, D.W.; Mccawley, J.C.; Cook, C. The potential of the Canadian winter climate for the freeze-drying of degraded waterlogged wood: Part II. Stud. Conserv. 1980, 25, 118–136. [Google Scholar] [CrossRef]
  100. Babiński, L.; Fabisiak, E.; Dąbrowski, H.P.; Kittel, P. Study on dimensional stabilization of 12,500-year-old waterlogged subfossil Scots pine wood from the Koźmin Las site, Poland. J. Cult. Herit. 2016, 23, 119–127. [Google Scholar] [CrossRef]
  101. Kılıç, N.; Kılıç, A.G. Evaluation of the Polyethylene Glycol Impregnation and Vacuum Freeze-Drying Method for Waterlogged Archaeological Wood: Conservation of the Yenikapı 1 Shipwreck. Stud. Conserv. 2023, 69, 336–347. [Google Scholar] [CrossRef]
  102. Stelzner, J.; Stelzner, I.; Martinez-Garcia, J.; Gwerder, D.; Wittköpper, M.; Muskalla, W.; Cramer, A.; Heinz, G.; Egg, M.; Schuetz, P. Stabilisation of waterlogged archaeological wood: The application of structured-light 3D scanning and micro computed tomography for analysing dimensional changes. Herit. Sci. 2022, 10, 60. [Google Scholar] [CrossRef] [PubMed]
Figure 1. Infrared spectra and their second derivatives for untreated wood (C), sodium alginate (A), and wood treated with different concentrations of sodium alginate (0.5A, 1A, 1.5A, and 2A treated with 0.5%, 1%, 1.5%, and 2%, respectively) in the (a) 3700–2700 cm−1 region and (b) 1820–800 cm−1 region.
Forests 16 00325 g001
Figure 2. Infrared spectra and their second derivatives for the treated wood with 1% solution of sodium alginate (1AL), treated wood with 1% sodium alginate and PEG 400 (1AL400PEG), treated wood with 1% sodium alginate and PEG 1500 (1AL1500PEG), wood treated with PEG 400 and PEG 1500, and pure PEG400 (P400) and PEG1500 (P1500) in the (a) 3700–2700 cm−1 region and (b) 1820–800 cm−1 region.
Forests 16 00325 g002
Figure 3. Infrared spectra and their second derivatives for untreated wood (C), sodium alginate (A), wood treated with 1% solution of sodium alginate by soaking that was left to dry in the solution (Asol), and wood treated with an increasing concentration of sodium alginate (0.5%–1%–1.5%) by soaking (Astep) in the (a) 3700–2700 cm−1 region and (b) 1820–800 cm−1 region.
Forests 16 00325 g003
Figure 4. Macroscopic images of elm samples fully saturated with water before treatment (wet waterlogged) and air-dried specimens untreated and treated with different alginate solutions using an oscillating-pressure method.
Forests 16 00325 g004
Figure 5. Macroscopic images of exemplary air-dried elm samples untreated and treated using a soaking method.
Forests 16 00325 g005
Figure 6. Volumetric shrinkage of untreated and treated elm wood samples after air-drying, where results for samples treated using the oscillating-pressure method are presented in blue (with numbers indicating % alginate concentration), samples treated using the soaking method in orange, samples impregnated with increasing alginate concentrations in violet, and those left to dry in the solution in yellow.
Forests 16 00325 g006
Figure 7. SEM images of cross-sections of untreated air-dried wood samples and those treated using an oscillating-pressure method with increasing alginate concentrations indicated with numbers. C stands for untreated control wood. Stars point to smooth uncovered surfaces, while arrows indicate fibrous coatings on the cell wall surfaces.
Forests 16 00325 g007
Figure 8. SEM images of cross-sections of air-dried wood samples treated using a soaking method with alginate and/or with PEG. Astep stands for the treatment with increasing alginate concentration, and Asol stands for the sample left in the alginate solution for slow drying. Stars point to smooth uncovered surfaces, while arrows indicate fibrous coatings on the cell wall surfaces.
Forests 16 00325 g008
Table 1. Detailed information about treatment methods applied to waterlogged wood in the study. C—untreated control sample.
Sample IDMethod TypeChemical AppliedExperimental Details
0.5Aoscillating pressure0.5% alginate solution−0.9 bar vacuum for 0.5 h + 10 bars pressure for 6 h, repeated 6 times every 24 h, air-drying
1Aoscillating pressure1% alginate solution−0.9 bar vacuum for 0.5 h + 10 bars pressure for 6 h, repeated 6 times every 24 h, air-drying
1.5Aoscillating pressure1.5% alginate solution−0.9 bar vacuum for 0.5 h + 10 bars pressure for 6 h, repeated 6 times every 24 h, air-drying
2Aoscillating pressure2% alginate solution−0.9 bar vacuum for 0.5 h + 10 bars pressure for 6 h, repeated 6 times every 24 h, air-drying
1ALsoaking1% alginate solutionimmersion in solution for 3 weeks, air-drying
1AL400PEGsoaking1% alginate solution + 1% PEG 400immersion in solution for 3 weeks, air-drying
1AL1500PEGsoaking1% alginate solution + 1% PEG 1500immersion in solution for 3 weeks, air-drying
PEG400soaking1% PEG 400immersion in solution for 3 weeks, air-drying
PEG1500soaking1% PEG1500immersion in solution for 3 weeks, air-drying
Asolsoaking1% alginate solutionimmersion in solution for 3 weeks, then left in solution for slow drying
Astepsoakingalginate solution from 0.5% to 1.5%immersion in solutions with gradually increasing alginate concentrations: 0.5%/1 week, 1%/1 week, 1.5%/1 week, air-drying
Cno treatment--
Table 2. The density of waterlogged samples before treatment in a waterlogged state (ρ), the effectiveness of applied treatments expressed as weight percent gain (WPG), and their stabilising effectiveness expressed as sample volumetric shrinkage (Sv) and volumetric anti-shrink efficiency coefficient (ASEv). The table gives the average values of each parameter and standard deviations, respectively.
Sample IDρ [g cm−3]WPG [%]Sv [%]ASEv [%]
0.5A1072.4 ± 18.01.97 ± 0.0272.8 ± 2.24.1 ± 2.2
1A1072.1 ± 8.52.74 ± 0.0373.2 ± 6.73.5 ± 6.7
1.5A1064.5 ± 5.83.56 ± 0.0275.4 ± 1.30.6 ± 1.3
2A1055.7 ± 9.12.41 ± 0.0374.6 ± 1.91.7 ± 1.9
1AL1083.6 ± 2.85.76 ± 0.0159.6 ± 7.021.4 ± 7.0
1AL400PEG1078.5 ± 3.51.67 ± 0.0465.8 ± 5.713.3 ± 5.7
1AL1500PEG1064.4 ± 9.35.35 ± 0.0262.4 ± 8.817.8 ± 8.8
PEG4001058.7 ± 3.70.77 ± 0.0269.4 ± 4.28.6 ± 4.2
PEG15001040.2 ± 6.52.71 ± 0.0365.7 ± 1.813.5 ± 1.8
Asol1074.5 ± 11.16.69 ± 0.0145.5 ± 8.240.1 ± 8.2
Astep1091.8 ± 24.24.81 ± 0.0368.4 ± 8.49.8 ± 11.2
C1080.0 ± 23.0-75.9 ± 1.4-
Table 3. Band assignments in the 3700–2700 cm−1 region in infrared spectra of wood and treated wood with sodium alginate [87,88,89,90].
Band Position (cm−1)Band Assignment
3420 (in C)O2–H2⋯O6 intramolecular stretching vibration modes (in cellulose)
3345/3343 (in C/A)O5–H5⋯O3 intramolecular stretching vibration modes
3120/3128 (in C/A)C–H stretching vibration in methyl and methylene group
3107 (in A)C–H stretching vibration in methyl and methylene group
2934/2922 (in C/A)asymmetric stretching vibration of C–H bonds in methyl and methylene groups
2878/2867 (in C/A)symmetric stretching vibration of C–H bonds in methylene groups
2841 (in C)asymmetric stretching vibration of C–H bonds in methylene groups
Table 4. Band assignments in the 1820–800 cm−1 region in infrared spectra of wood and treated wood with sodium alginate [88,91,92,93,94,95,96].
Band Position (cm−1)Band Assignment
1736 (in C)C=O stretching vibration of carbonyl, carboxyl and acetyl groups
1661 (in C)conjugated C–O in quinines coupled with C=O stretching of various groups
1371/1374 (in C/A)C–H deformation vibration in polysaccharides and alginate
1328/1325 (in C/A)C–H stretching vibration in polysaccharides and alginate
1083 (in C)glucose ring stretching vibration
1027/1026 (in C/A)C–O ester stretching vibrations in wood and OH bending vibration of alginate
956/946 (in C/A)C–O stretching vibration in wood and specific to guluronic and mannuronic acids from alginate
893/896 (in C/A)C–H deformation vibration in cellulose and specific to guluronic and mannuronic acids from alginate
854 (in A)C–H deformation vibration in cellulose and specific to guluronic and mannuronic acids from alginate
Table 5. Band assignments in the 1820–800 cm−1 region in infrared spectra for PEG [26,98].
Band Position (cm−1)Band Assignment
1743C–O stretching vibration
1636O–H bending vibration
1461/1462asymmetrical stretching vibration of CH2 group
1401in-plane bending (scissoring) vibration of CH2 group
1351out-of-plane bending (wagging) vibration of CH2 group
1108–CH2–O–CH2– groups
995out-of-plane bending vibrations of CH2
886C–C stretching vibrations
838C–C stretching vibrations
Disclaimer/Publisher’s Note: The statements, opinions and data contained in all publications are solely those of the individual author(s) and contributor(s) and not of MDPI and/or the editor(s). MDPI and/or the editor(s) disclaim responsibility for any injury to people or property resulting from any ideas, methods, instructions or products referred to in the content.

