Article

Genetic Diversity and Population Structure of Siamese Rosewood (Dalbergia cochinchinensis Pierre) in Thailand Using matK and Internal Transcribed Spacer Markers

by
Benjarat Prompen
1,2,
Weerachai Saijuntha
3,4,
Warayutt Pilap
2,4 and
Sudarat Thanonkeo
2,4,*
1
Graduate School, Mahasarakham University, Maha Sarakham 44150, Thailand
2
Walai Rukhavej Botanical Research Institute, Mahasarakham University, Maha Sarakham 44150, Thailand
3
Faculty of Medicine, Mahasarakham University, Maha Sarakham 44000, Thailand
4
Center of Excellence in Biodiversity Research, Mahasarakham University, Maha Sarakham 44150, Thailand
*
Author to whom correspondence should be addressed.
Forests 2025, 16(2), 332; https://doi.org/10.3390/f16020332
Submission received: 11 January 2025 / Revised: 10 February 2025 / Accepted: 11 February 2025 / Published: 13 February 2025

Abstract

:
Siamese rosewood (Dalbergia cochinchinensis Pierre) is a highly valuable economic tree species in Thailand. This study investigated genetic diversity across 72 tree samples from 17 Thai locations using two genetic markers: the chloroplast maturase K (matK) gene and the nuclear internal transcribed spacer (ITS) region. Analysis of 48 matK and 65 ITS sequences revealed 34 (DcM1–DcM34) and 31 (DcI1–DcI31) haplotypes, respectively. The Saraburi province haplotype DcM10 exhibited the highest genetic divergence, differing by 25 mutational steps from other haplotypes. Phylogenetic analysis incorporating GenBank sequences from other Dalbergia species showed that matK sequences separated D. cochinchinensis into two distinct clades: Clade A, comprising most Thai samples, and Clade B, containing Saraburi samples grouped with sequences from Laos and Cambodia. In contrast, ITS analysis revealed a single monophyletic group. These findings have important applications for conservation strategies, particularly in prioritizing the genetically distinct Saraburi population for protection, and can inform breeding programs to maintain genetic diversity. Additionally, the identified genetic markers could be developed into tools for timber authentication to combat illegal logging, while the revealed population structure can guide reforestation efforts and international conservation collaboration with Laos and Cambodia.

1. Introduction

Siamese rosewood (Dalbergia cochinchinensis Pierre) is one of approximately 250 species in the genus Dalbergia (family Fabaceae) found across pan-tropical regions [1]. While its genus has a broad distribution, D. cochinchinensis is endemic to Southeast Asia, specifically Thailand, Myanmar, Cambodia, Laos PDR, and Vietnam. In Thailand, where 26 Dalbergia species have been documented [2], Siamese rosewood populations primarily occur in the northeastern, eastern, and central regions. These species’ highly prized heartwood make it one of Thailand’s most economically valuable plants, with strong demand in both domestic and international markets. However, this commercial value has led to extensive exploitation, threatening its survival and natural distribution patterns across Thailand.
The threat to Siamese rosewood has intensified significantly in recent years. In 2018 alone, Thai authorities recorded 576 cases of illegal harvesting in natural forests, predominantly in the eastern and northeastern regions, with damage valued at THB 103 million [3]. These species’ critical status has prompted multiple protective measures: it was classified as restricted timber under the Royal Decree BE 2530 and the Forest Act BE 2484, and in 2013, Thailand successfully advocated for its inclusion in CITES List 2 for controlled international trade [4]. Further protection came through National Announcement No. 106/2014 [5], and the species is currently listed as critically endangered on the IUCN Red List.
The conservation of genetic resources is crucial for preserving endangered species with economic significance and maintaining genetic diversity for future breeding programs. Two main conservation approaches are employed: in situ conservation (preservation in natural forest conditions) and ex situ conservation (establishment of plantations). Genetic studies using DNA analysis have revealed that Siamese rosewood is an outcrossing species with high genetic diversity both within and between populations. Research has shown genetic differences between populations of approximately 0.127 [6,7]. Population structure studies have employed various genetic markers, including RAPD and ISSR [8,9], microsatellite [10], chloroplast maturase K (matK), and nuclear internal transcribed spacer (ITS) regions [11]. Among these markers, the matK and ITS regions have emerged as particularly valuable tools for genetic analysis despite some limitations in discrimination power. These markers are part of the plant DNA barcode system and offer complementary insights as follows: matK is maternally inherited and helps track seed dispersal patterns, while ITS provides information about both parental lineages and can reveal recent evolutionary events [11].
While both government agencies and farmers have begun establishing economic forest plantations for Siamese rosewood, a significant challenge remains: the shortage of high-quality seedlings from superior mother plants. To address this issue, molecular approaches using chloroplast and nuclear genome markers are essential to study genetic diversity. The present research aims to assess the genetic diversity of D. cochinchinensis using matK and ITS regions as genetic markers. This genetic database will support future propagation efforts, breeding development, and conservation programs for sustainable utilization.

2. Materials and Methods

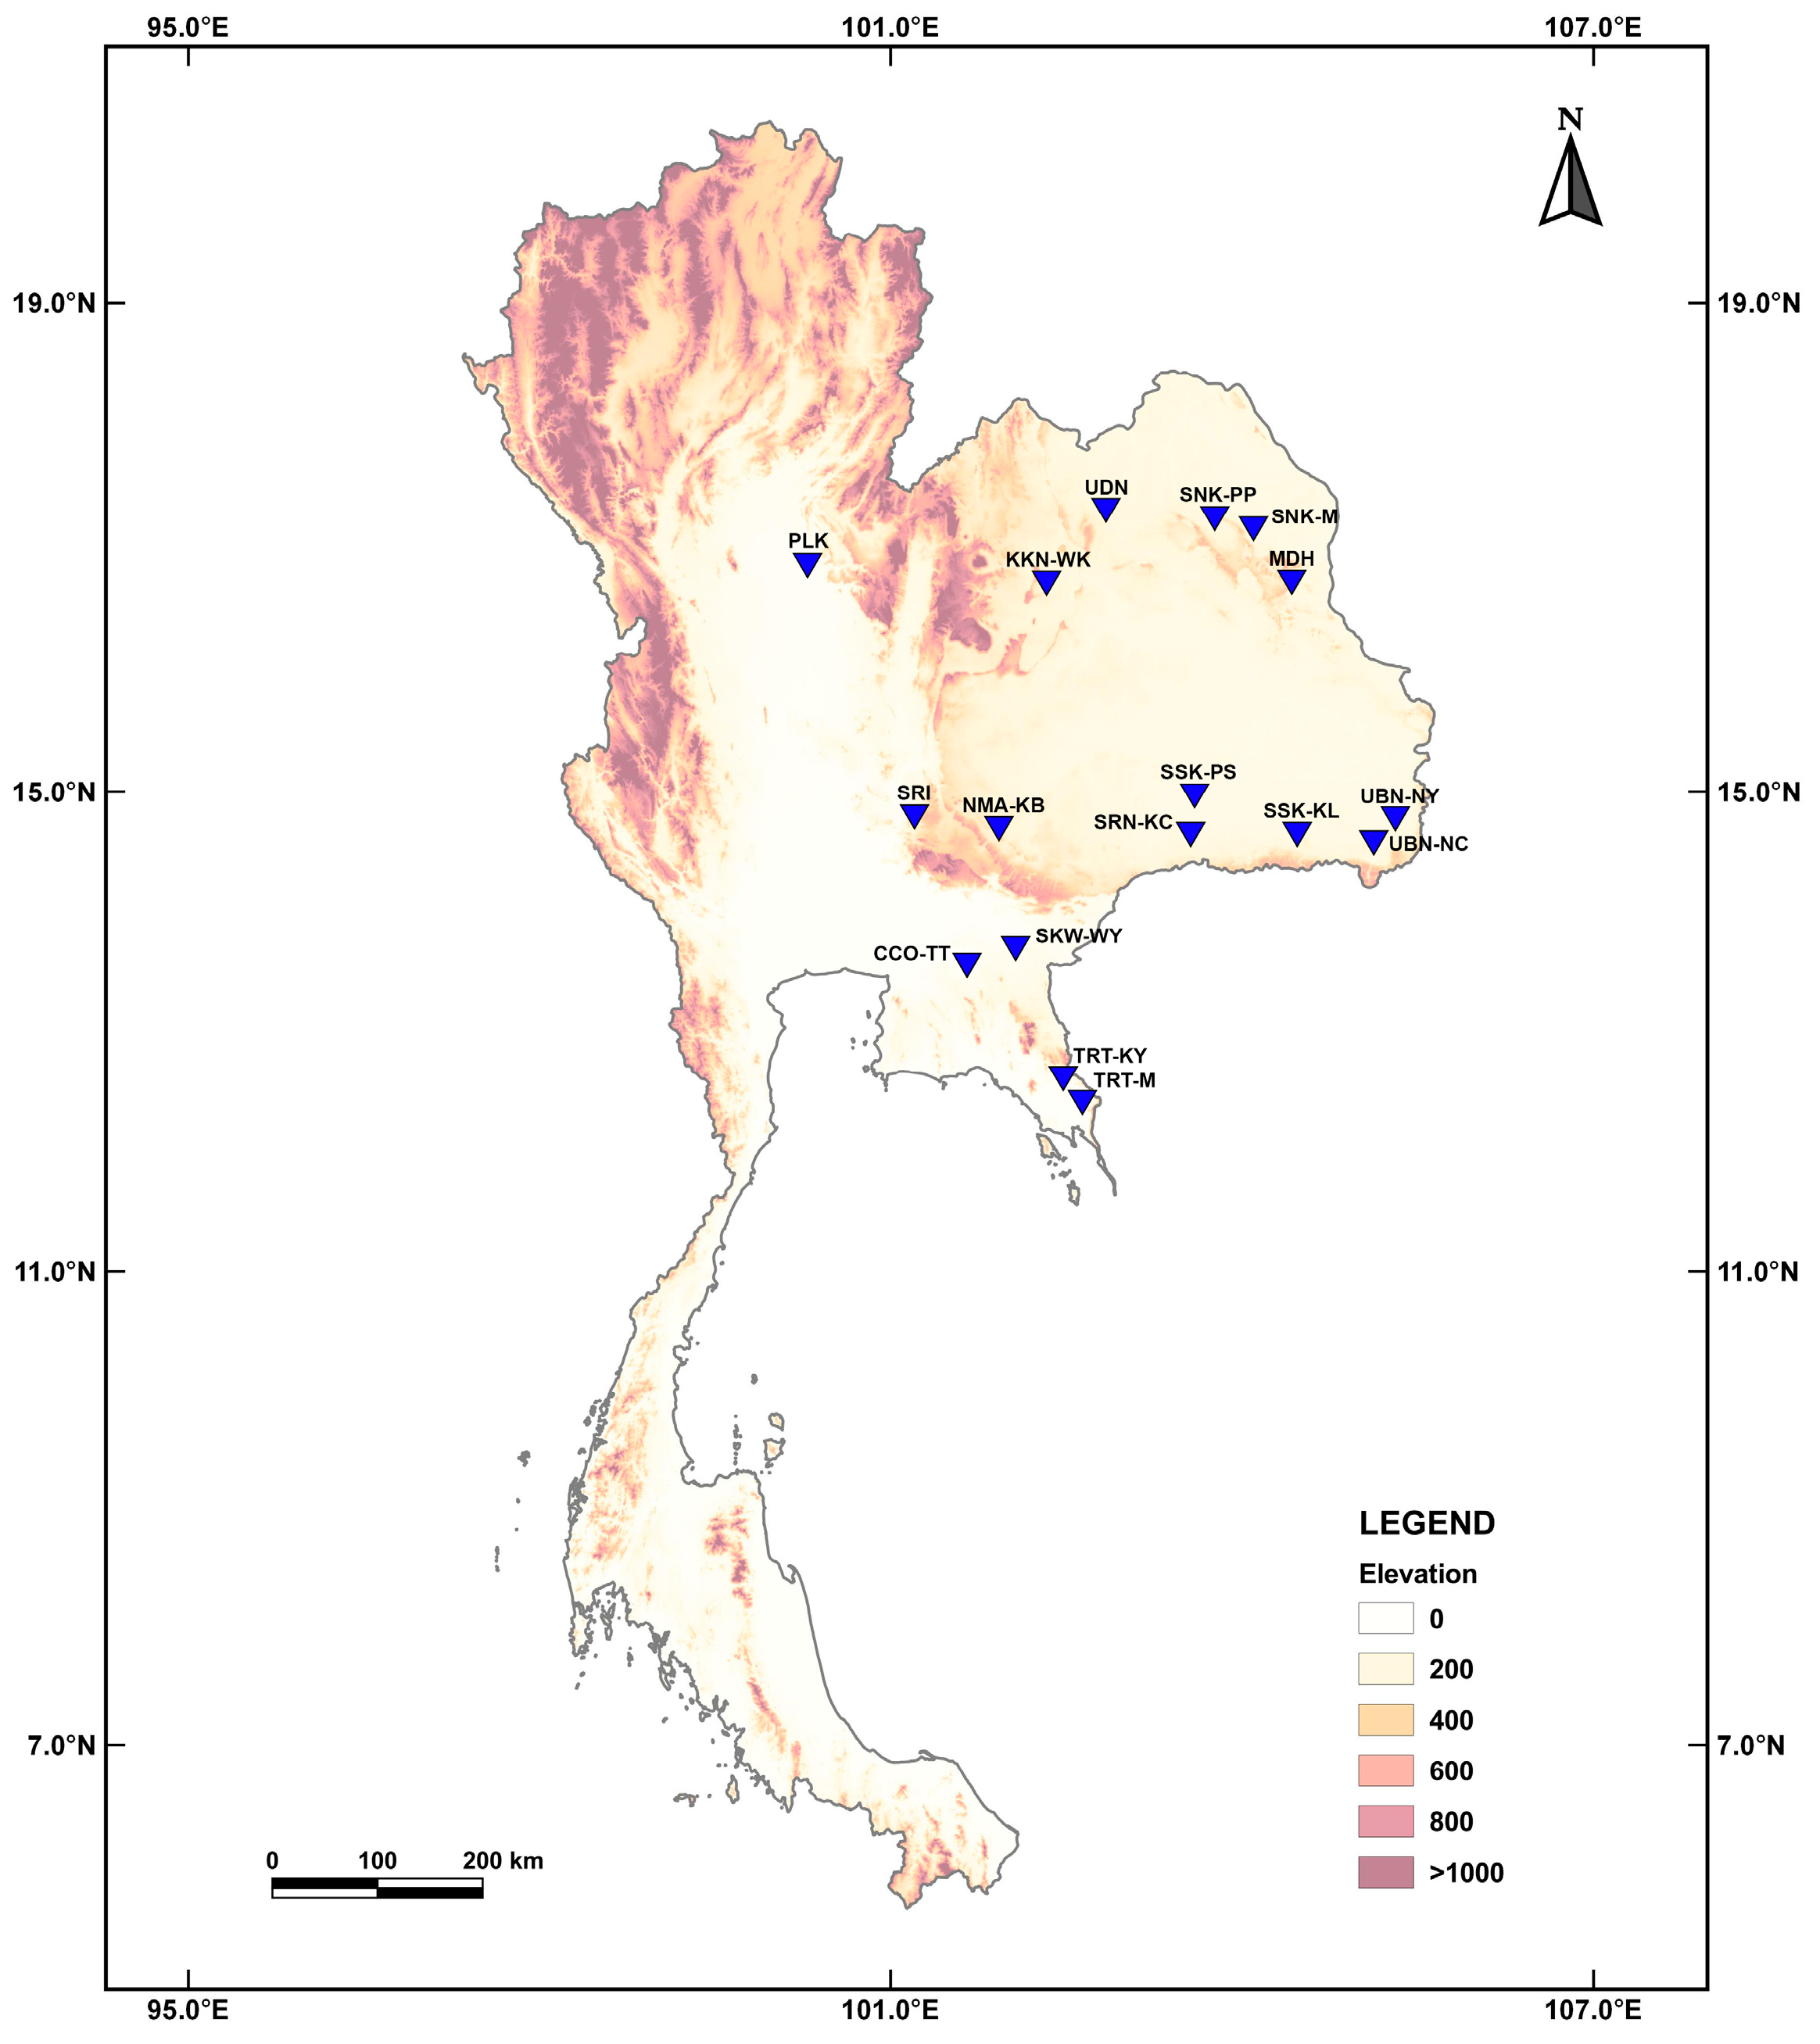
2.1. Sample Collection

Siamese rosewood samples (Figure 1) were collected from 17 distinct geographical locations across Thailand, primarily in the northeastern, eastern, and central regions, following their natural distribution patterns (Table 1 and Figure 2). The collected specimens were registered and deposited in the Forest Herbarium—BKF—under voucher codes “Prompen, B. No. 1 BKF NO. 224371” and “Prompen, B. No. 2 BKF NO. 224372”. To ensure genetic conservation and propagation, branches from the original trees were collected from natural forests for grafting [12] and established in a collection at the Northeastern Forest Tree Seed Center of the Royal Forest Department in Khon Kaen Province, Thailand.
For molecular analysis, young leaves were collected using sterile scissors, immediately preserved in silica gel, and transferred to the Walai Rukhavej Botanical Research Institute laboratory for subsequent analysis.

2.2. Molecular Analysis

Genomic DNA was extracted from young leaves using the DNeasy® Plant Mini Kit (Qiagen, Hilden, Germany) following the manufacturer’s protocol, with samples stored at −20 °C until analysis. Two genomic regions were targeted for amplification: the chloroplast maturase K (matK) and the nuclear internal transcribed spacer (ITS), which includes ITS1, 5.8S ribosomal RNA gene, and ITS2. For matK amplification, the forward primer matK-3F_IH (5′-CGT ATA GTA CTC TTG TGT TTA CGA G-3′) and reverse primer matK-3R (5′-ATC CTA TTC ATC TGG AAA TCT TGG TTC-3′) were used [13], while ITS amplification employed the forward primer ITS4-F (5′-GGA AGG AGA AGT CGT AAC AAG G-3′) and reverse primer ITS5-R (5′-TCC TCC GCT TAT TGA TAT GC-3′) [14]. PCR amplification was performed using the HotStarTaq Master Mix Kit (Qiagen, Hilden, Germany) in 25 μL reaction volumes. Both genomic regions were amplified using a thermal cycler (Applied Biosystems, Waltham, MA, USA) under identical conditions consisting of initial denaturation at 95 °C for 5 min, followed by 35 cycles of denaturation at 95 °C for 30 s, annealing at 55 °C for 1 min, and extension at 72 °C for 1 min, with a final extension at 72 °C for 5 min. The amplified products were visualized on 1% agarose gels in a 0.5× TBE buffer using the GelRed™ Nucleic Acid Gel Stain (Biotium, Inc., Hayward, CA, USA), after which PCR products were excised and purified using the E.Z.N.A.® Gel Extraction Kit (Omega Biotek, Seattle, WA, USA), and sequenced using Sanger sequencing (ATGC Co., Ltd., Pathum Thani, Thailand).

2.3. Data Analysis

Sequence alignment and analysis were performed using the ClustalW program [15], with manual editing conducted in BioEdit [16]. Molecular diversity indices and haplotype data were generated using DnaSp v5 [17]. Genetic differentiation between populations was assessed using both the p-distance and the Kimura 2-parameter (K2P) distance [18] in MEGA XI [19]. To visualize haplotype relationships, a minimum-spanning network was constructed using Network version 10.2, employing the median-joining algorithm [20].
Phylogenetic analyses were conducted separately for matK and ITS sequences using haplotypes identified from all D. cochinchinensis populations in this study. Additional Dalbergia species sequences were retrieved from GenBank for comparative analysis. Tectona grandis and Pterocarpus indicus were selected as outgroups for matK and ITS trees, respectively. Phylogenetic trees were constructed using two methods in MEGA XI [21]: maximum likelihood (ML) with the general time reversible model incorporating gamma distribution and invariant sites (GTR + G + I) [22] and neighbor-joining [23]. Node support was assessed using 1000 bootstrap replicates.

3. Results

3.1. Genetic Diversity of D. cochinchinensis

We analyzed genetic variation in D. cochinchinensis populations using two genetic markers: matK and ITS sequences. For the matK gene, we successfully amplified and sequenced an 821 bp fragment from 48 samples collected across 12 localities. These sequences were deposited in GenBank (accession numbers PQ317478–PQ317748). The analysis revealed 66 variable nucleotide sites (8% of total sites), comprising 5 singletons and 61 parsimony informative sites. We identified 34 distinct haplotypes (DcM1–DcM34), each exclusively found in a specific geographical area (Figure 3). The matK sequences showed high genetic diversity, with a haplotype diversity of 0.986 ± 0.007 and nucleotide diversity of 0.0161 ± 0.0022 (Table 2).
For the ITS region, we obtained sequences from 65 samples representing 17 localities (GenBank accession numbers PQ317478–PQ317748). The analysis identified 19 variable sites, including 1 singleton and 18 parsimony informative sites. These variations defined 31 haplotypes (DcI1–DcI34), with 18 haplotypes being location-specific and 13 shared across multiple localities (Figure 3). The ITS sequences also showed substantial genetic diversity, with a haplotype diversity of 0.968 ± 0.008 and nucleotide diversity of 0.0069 ± 0.0003 (Table 2).
Genetic differentiation among populations was assessed using both the p-distance and K2P methods. For matK, p-distance values ranged from 0.0061 to 0.0572, while K2P distances ranged from 0.0061 to 0.0597 (Table 3). The ITS sequences showed lower genetic differentiation, with a p-distance ranging from 0.0010 to 0.0127 and K2P from 0.0010 to 0.0129 (Table 4). Notably, populations from SRI showed remarkably high genetic differentiation based on matK analysis, with p-distance (0.0398–0.0572) and K2P values (0.0411–0.0597) consistently higher than other populations.

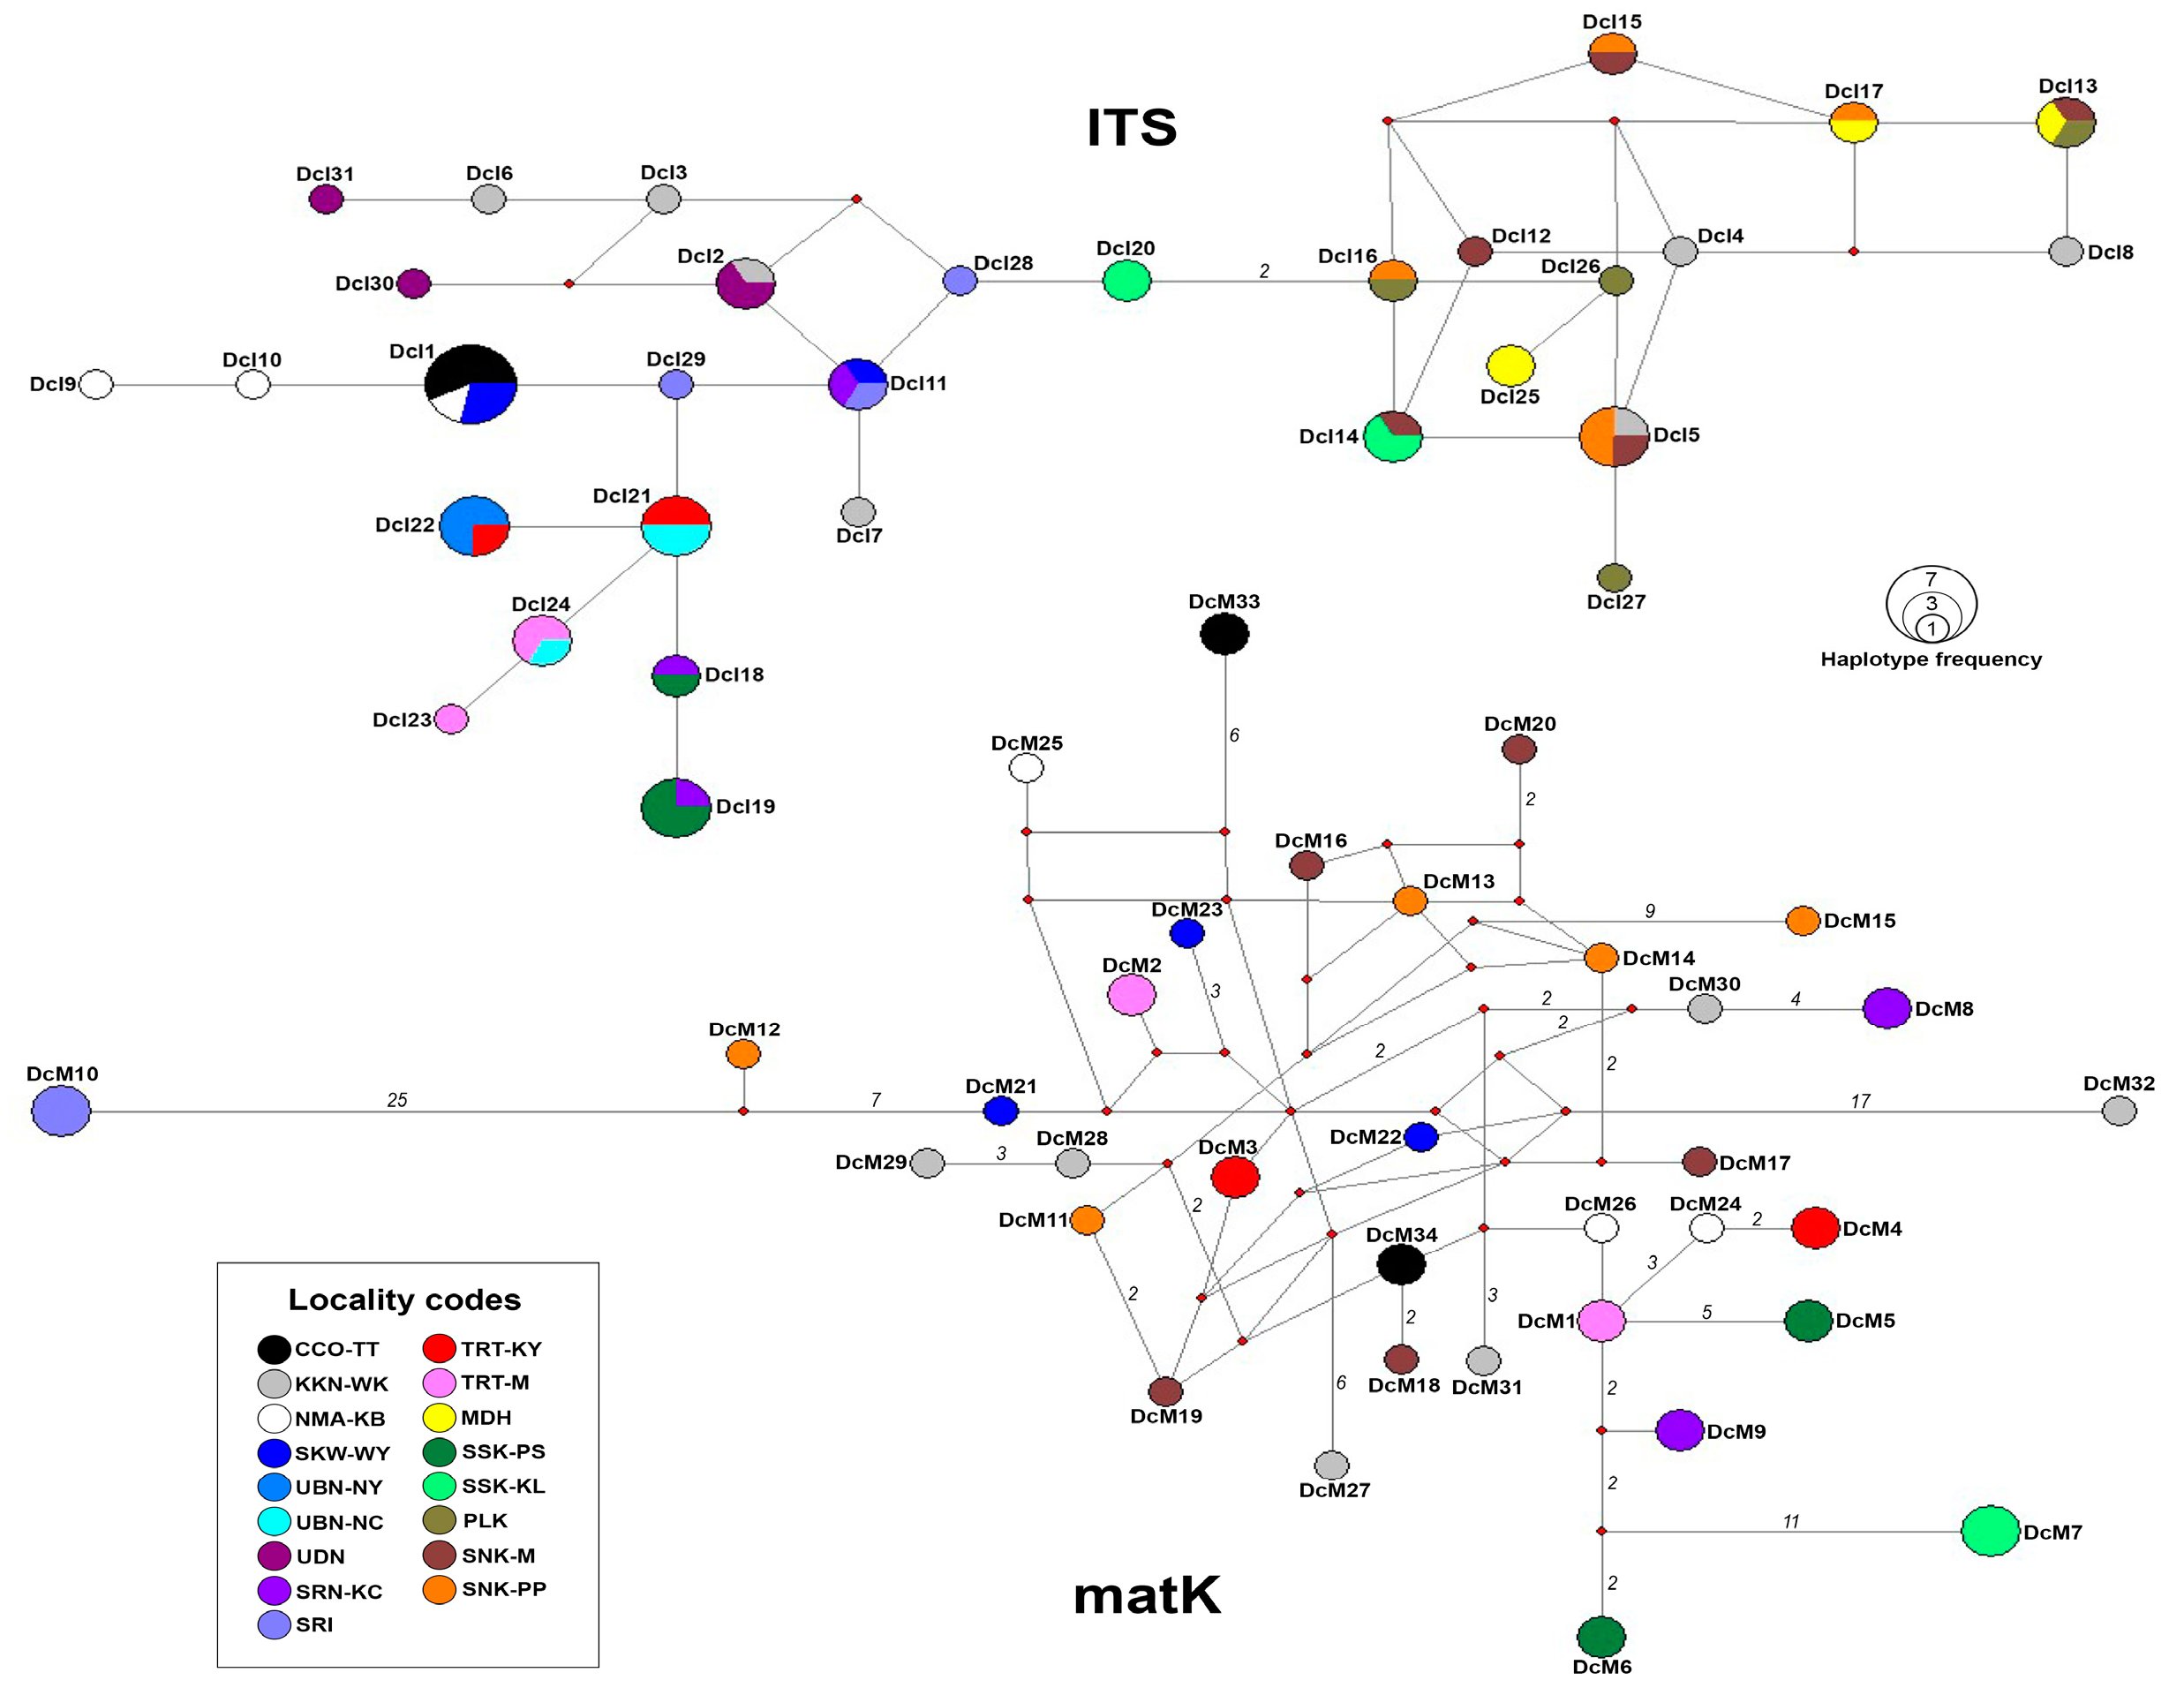
3.2. Haplotype Network

Haplotype networks were constructed separately for 34 matK (DcM1–DcM34) and 31 ITS (DcI1–DcI34) sequences. The matK analysis revealed distinct geographical patterns with no shared haplotypes between localities. Three haplotypes showed notable genetic distances from the others as follows: DcM10 from Muak Lek District, Saraburi Province (25 mutational steps), DcM32 from Wiang Kao District, Khon Kaen Province (17 mutational steps), and DcM7 from Kantaralak District, and Sisaket Province (11 mutational steps) (Figure 3).
In contrast, the ITS sequence analysis showed minimal genetic differentiation, with a maximum of two mutational steps between haplotypes. Unlike matK, the ITS analysis identified 14 shared haplotypes across different localities: DcI1, DcI5, DcI11, DcI12, DcI13, DcI14, DcI15, DcI16, DcI17, DcI18, DcI19, DcI21, DcI22, and DcI24 (Figure 3).

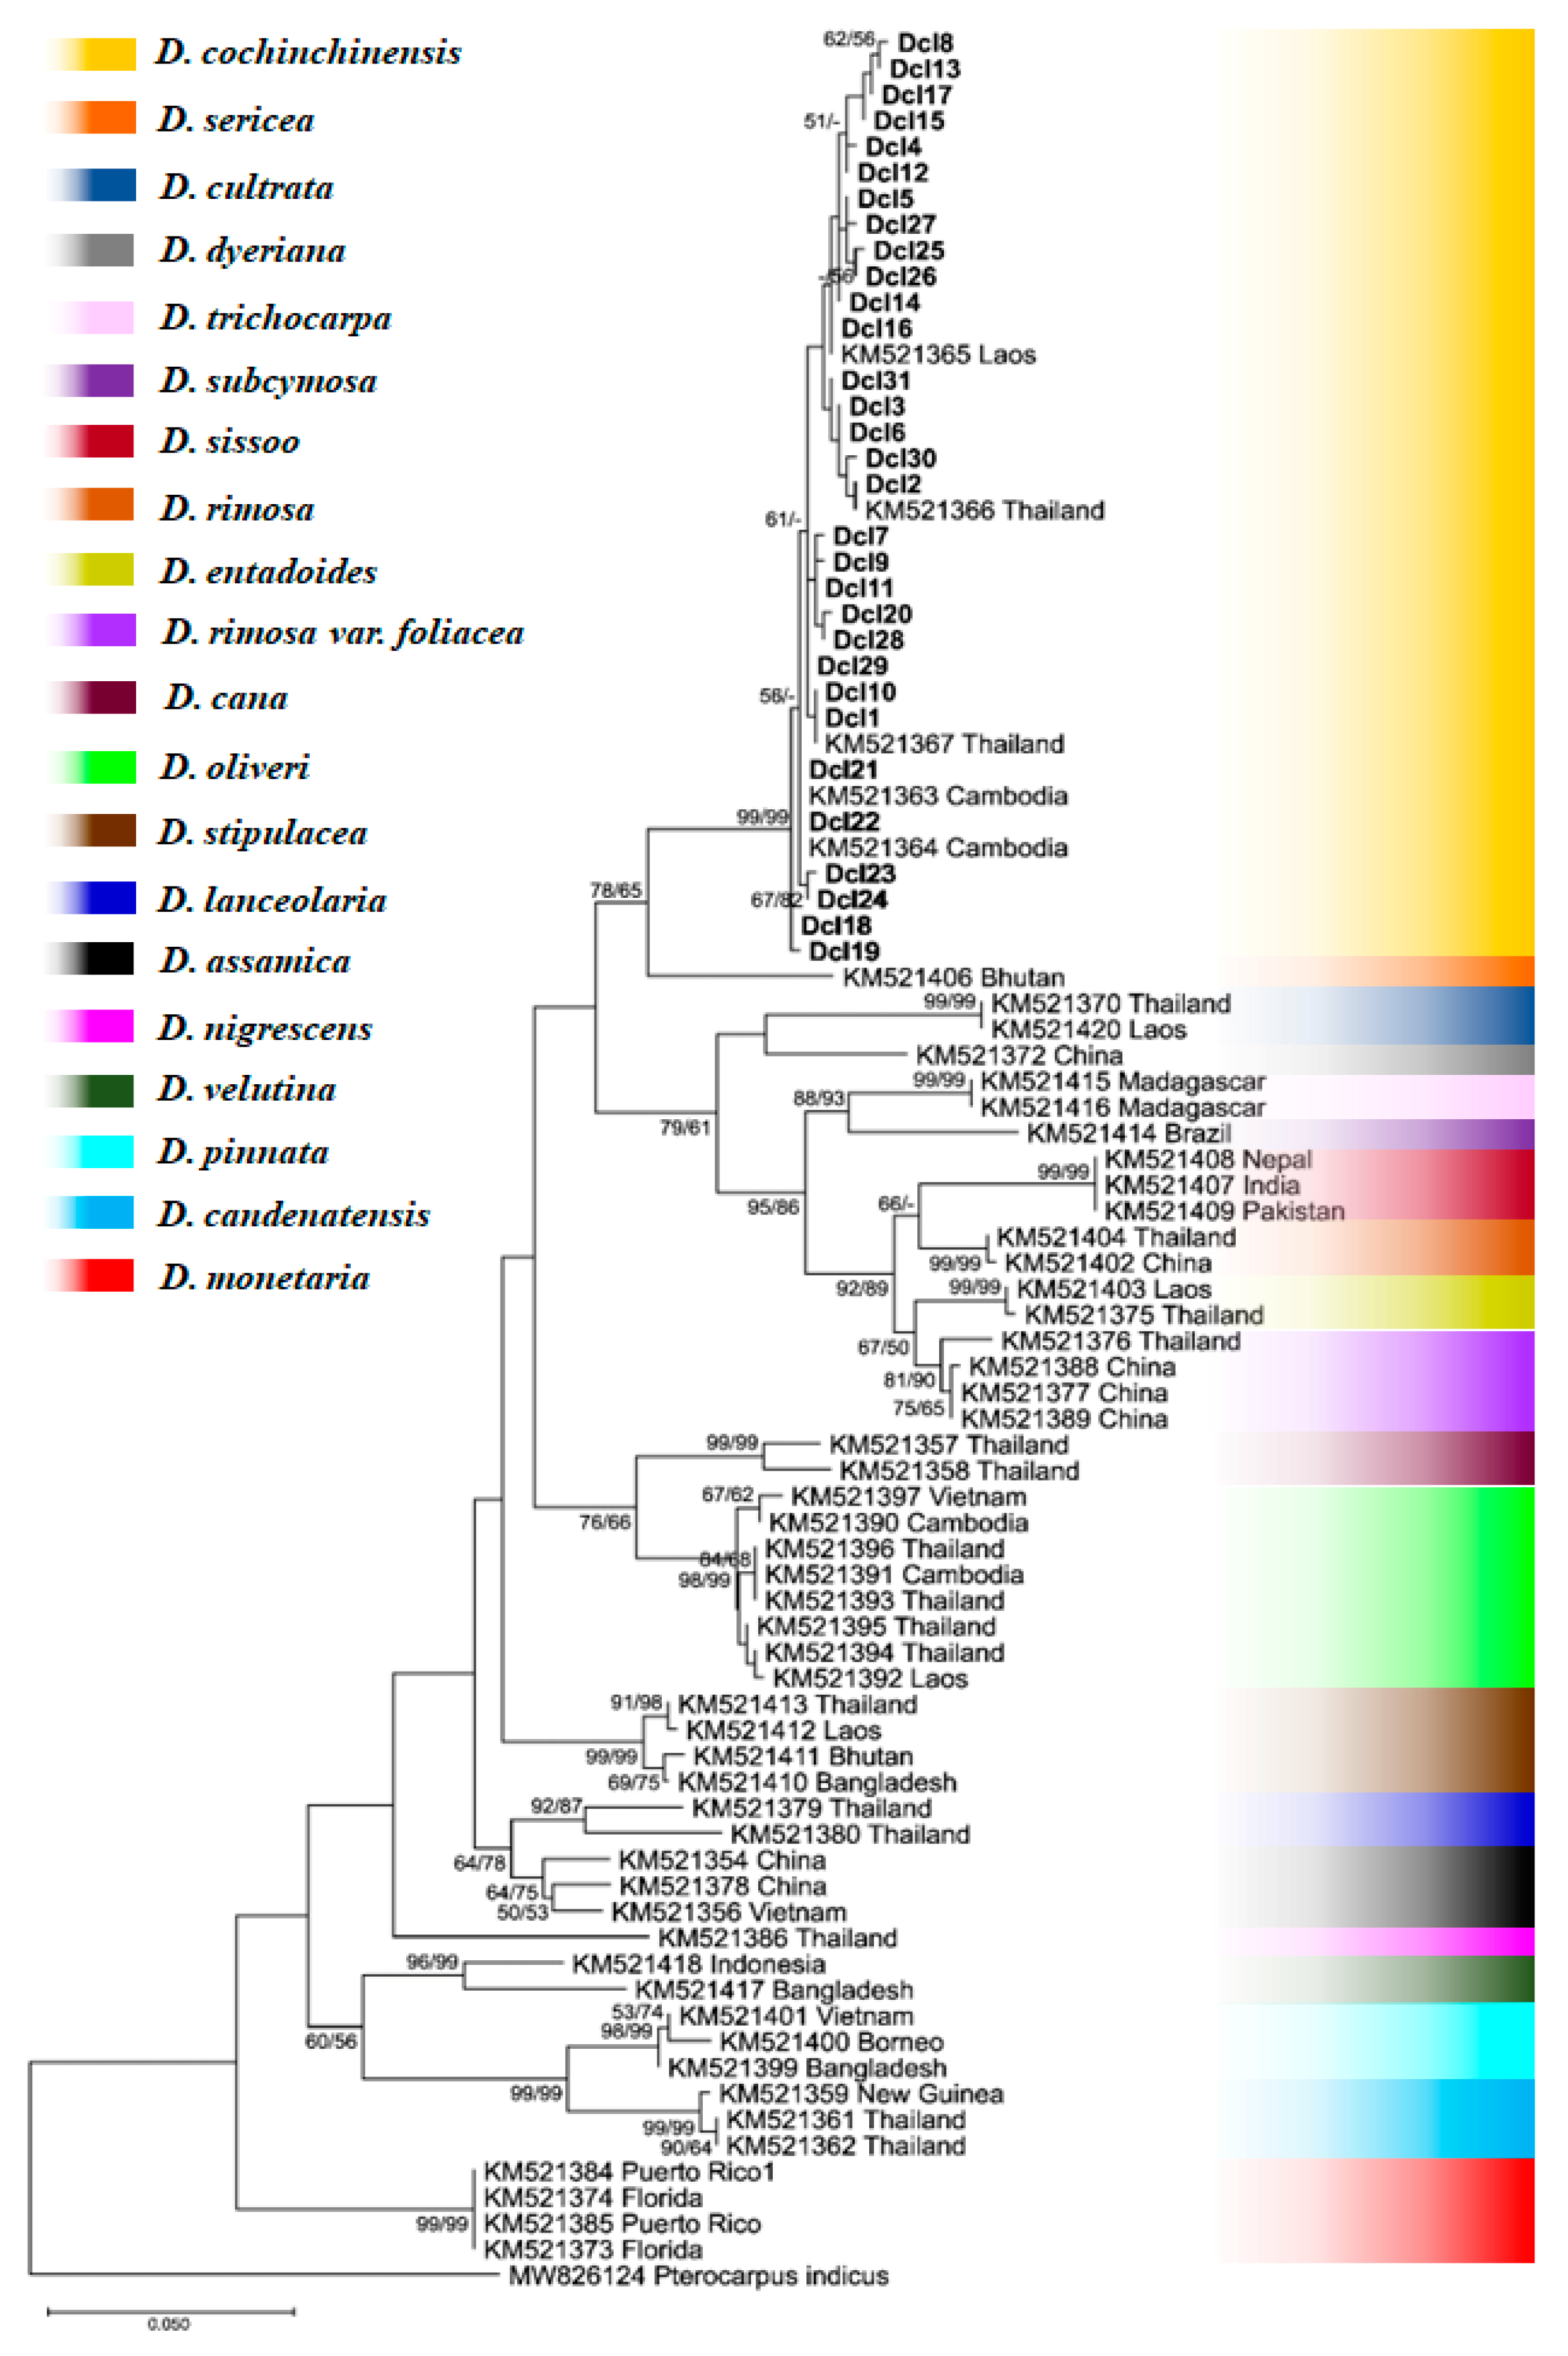
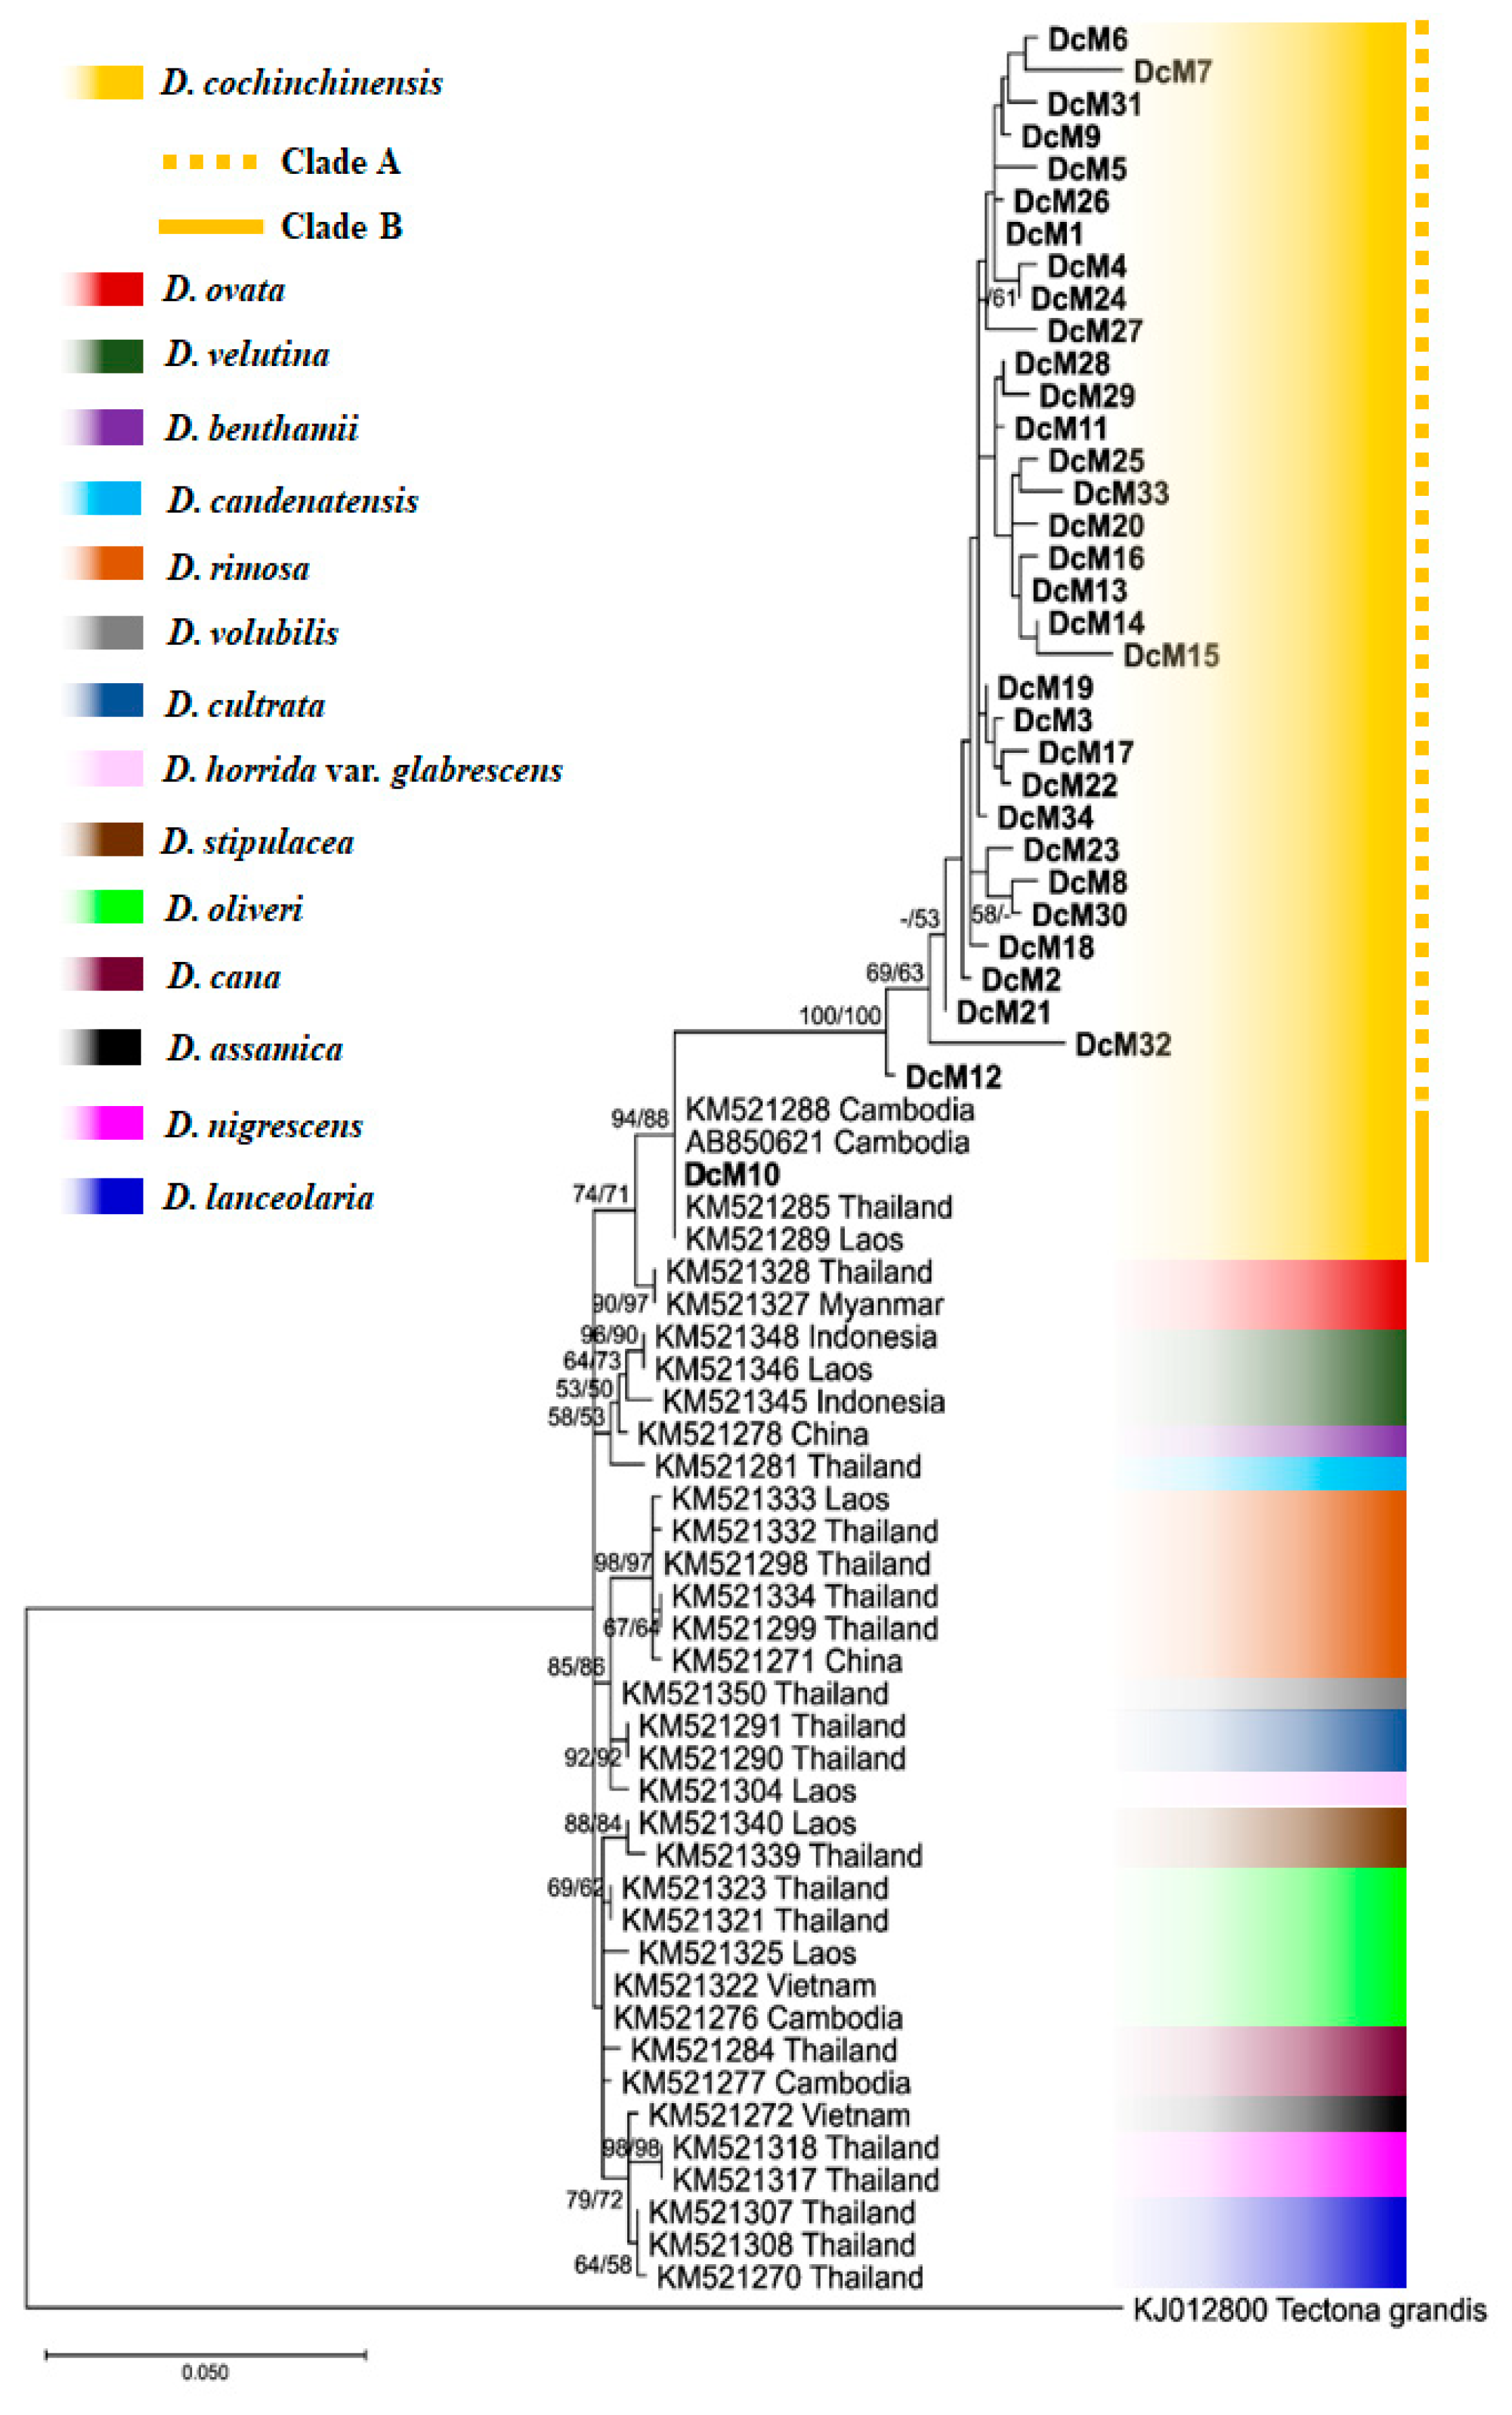
3.3. Phylogenetic Tree

Phylogenetic analyses were conducted separately for matK and ITS sequences, incorporating both our sequences and previously published sequences of D. cochinchinensis and other Dalbergia species from GenBank. The ITS-based phylogenetic tree demonstrated that all D. cochinchinensis samples formed a well-supported monophyletic group, distinct from other Dalbergia species. Within the genus, D. cochinchinensis showed the closest phylogenetic affinity to D. sericea from Bhutan (Figure 4).
The matK-based phylogenetic analysis revealed two distinct clades within D. cochinchinensis (Figure 5). Clade A comprised all matK haplotypes generated in this study except for DcM10, while Clade B contained haplotype DcM10 from Saraburi Province together with previously published D. cochinchinensis sequences from Thailand, Laos, and Cambodia. Notably, both clades showed close phylogenetic relationships with D. ovata sequences from Thailand and Myanmar, suggesting potential evolutionary connections between these species within the region.

4. Discussion

For the genetic diversity and population structure analysis of D. cochinchinensis, we selected matK and ITS markers from among several available genetic markers based on their complementary molecular characteristics and established effectiveness in population genetics studies. The chloroplast matK region, which is maternally inherited, provides crucial insights into seed dispersal patterns and historical gene flow through maternal lineages. Complementing this, the nuclear ITS region, with its biparental inheritance pattern, enables us to detect recent evolutionary events and genetic contributions from both parents. Although these markers have some limitations in discrimination power, their combined application offers a comprehensive understanding of the genetic structure and diversity patterns [10,11,13].
Our analysis revealed significant genetic diversity patterns in D. cochinchinensis populations across Thailand. The matK sequences showed high overall genetic diversity (haplotype diversity = 0.986 ± 0.007 and nucleotide diversity = 0.0161 ± 0.0022), with 34 distinct haplotypes exhibiting strong geographical structuring. Population-level diversity varied considerably, with the highest haplotype diversity (1.000) observed in populations from Khon Kaen (DC-KKN-WK), Nakhon Ratchasima (DC-NMA-KB), Sa Kaeo (DC-SKW-WY), and Sakon Nakhon provinces (DC-SNK-M), while the lowest diversity (0.000) was found in Saraburi (DC-SRI). Similarly, ITS sequences revealed 31 haplotypes with substantial overall diversity (haplotype diversity = 0.968 ± 0.008 and nucleotide diversity = 0.0069 ± 0.0003), though with less pronounced geographical structuring.
The relatively low nucleotide diversity observed in both markers aligns with previous findings, though our study revealed higher overall genetic diversity compared to earlier research. Yooyuen [7] reported low genetic diversity (haplotype diversity = 0.608 and nucleotide diversity = 0.00033) in northeastern and central Thai populations, identifying only 11 haplotypes across populations. This difference might be attributed to our more comprehensive sampling strategy across the species’ range. Similar patterns of low nucleotide diversity have been reported in other endangered Dalbergia species, such as D. monticola in Madagascar [24], D. oliveri, D. hancei, D. entadoides, D. dialoides, and D. cochinchinensis in Vietnam [25], and D. odorifera in China [26], suggesting that this might be a common characteristic within the genus. This consistently low genetic diversity may reflect the species’ historically narrow distribution and specific ecological requirements, as D. cochinchinensis occupies a more restricted ecological niche compared to related species like D. oliveri [2,27,28]. This pattern is particularly notable when compared to the higher genetic diversity observed in more widely distributed Dalbergia species, such as D. nigra in the Brazilian Atlantic forest [29], highlighting the potential vulnerability of geographically restricted species to genetic erosion.
Our phylogenetic analyses revealed distinct patterns between markers. The ITS-based phylogeny showed D. cochinchinensis as a well-supported monophyletic group, while matK analysis identified two distinct clades with differential levels of geographic distribution. These patterns suggest that landscape features have played a crucial role in shaping the species’ genetic structure, which is consistent with recent findings by Hartvig et al. [10] and Huang et al. [30], who demonstrated that drainage systems significantly influence phylogeographic patterns of Dalbergia species in Indochina.
The higher haplotype diversity we observed in certain populations (particularly in Khon Kaen and Nakhon Ratchasima) contrasts with studies of other threatened Dalbergia species in Southeast Asia. For instance, research on D. dialoides and D. entadoides in Vietnam found lower haplotype diversity even in presumably stable populations [25].
The genetic patterns observed in this study have important implications for conservation and breeding strategies. The selected specimens exhibited desirable traits for breeding programs, including high growth rates, straight trunks, quality wood characteristics, and disease resistance. The distinct genetic lineages identified through both markers suggest the importance of maintaining population-level diversity in conservation efforts. Moreover, the strong geographic structuring observed, particularly in matK sequences, indicates that conservation strategies should consider preserving populations across different regions to maintain the full range of genetic diversity.
Several limitations should be considered when interpreting our results. Our study focused primarily on Thai populations, potentially missing important genetic variations in neighboring countries. The use of only chloroplast and nuclear markers may not fully capture the genetic complexity of these species, and the lack of temporal genetic data limits our understanding of how diversity patterns have changed over time in response to anthropogenic pressures. Future research directions should focus on expanding the geographical scope to include populations from neighboring countries, which would provide a more comprehensive understanding of regional genetic patterns. The incorporation of additional genetic markers, particularly those related to adaptive traits, would offer deeper insights into these species’ evolutionary potential. Studies investigating the impact of recent habitat fragmentation on genetic diversity, the relationship between genetic diversity and phenotypic variation in important timber quality traits, and the effects of current conservation practices on genetic diversity maintenance would also be valuable. Furthermore, the examination of potential hybridization patterns with closely related Dalbergia species and the development of more comprehensive landscape genetic models incorporating contemporary environmental changes could enhance our understanding of these economically important species and inform more effective conservation strategies.

5. Conclusions

This study reveals significant insights into the genetic diversity of D. cochinchinensis through the analysis of matK and ITS markers. Our findings demonstrate high genetic diversity within the species, evidenced by numerous haplotypes (34 matK and 31 ITS) and high-haplotype diversity indices (matK: 0.986 ± 0.007; ITS: 0.968 ± 0.008). The markers showed contrasting patterns: matK sequences exhibited strong geographical structuring with location-specific haplotypes, while ITS sequences showed more limited differentiation with shared haplotypes across localities. Notably, phylogenetic analyses identified two distinct evolutionary lineages, with the Saraburi Province population showing remarkable genetic divergence. This population, along with samples from neighboring countries, forms a separate clade that may represent a unique evolutionary line requiring special conservation attention. These findings suggest that despite recent population declines, D. cochinchinensis maintains substantial genetic diversity, implying the need to protect multiple populations across its range, with a particular focus on preserving distinct evolutionary lineages and maintaining connectivity between populations to ensure the species’ long-term survival.

Author Contributions

Conceptualization, W.S. and S.T.; methodology, B.P., W.S. and S.T.; software, W.S. and S.T.; validation, B.P., W.P., W.S. and S.T.; formal analysis, W.S. and S.T.; investigation, B.P., W.P. and S.T.; resources, S.T.; data curation, W.S. and S.T.; writing—original draft preparation, B.P., W.S. and S.T.; writing—review and editing, S.T.; visualization, B.P., W.P. and W.S.; supervision, S.T.; project administration, S.T.; funding acquisition, B.P. and S.T. All authors have read and agreed to the published version of the manuscript.

Funding

This research was kindly supported by Mahasarakham University, Thailand.

Data Availability Statement

The original contributions presented in this study are included in the article. Further inquiries can be directed to the corresponding author.

Acknowledgments

A part of this research work was supported by the Royal Forest Department, Thailand. The authors also thank all staff of the Royal Forest Department and Walai Rukhavej Botanical Research Institute, Mahasarakham University, for their technical support.

Conflicts of Interest

The authors declare no conflicts of interest.

References

  1. Vatanparast, M.; Klitgård, B.B.; Adema, F.A.; Pennington, R.T.; Yahara, T.; Kajita, T. First molecular phylogeny of the pantropical genus Dalbergia: Implications for infrageneric circumscription and biogeography. S. Afr. J. Bot. 2013, 89, 143–149. [Google Scholar]
  2. Niyomdham, C. An accont of Dalbergia (Leguminosae-Papilionoideae) in Thailand. Thai For. Bull. 2002, 30, 124–166. [Google Scholar]
  3. Department of National Parks, Wildlife and Plant Conservation. Report Summarizing Statistics of Illegal Cases Related to Forestry. 2018. Available online: https://portal.dnp.go.th/Content?contentId=2134 (accessed on 20 December 2023).
  4. CITES. Appendices I, II and III: Valid from 4 October 2017. In Convention on International Trade in Endangered Species of Wild Fauna and Flora; CITES: Geneva, Switzerland, 2018. [Google Scholar]
  5. National Council for Peace and Order. Announcement of the National Council for Peace and Order No. 106/2014 Regarding Amendments to the Forest Law; National Council for Peace and Order: Bangkok, Thailand, 2014. [Google Scholar]
  6. Soonhuae, P.; Piewluang, C.; Boyle, T. Population Genetics of Dalbergia cochinchinensis Pierre and Implications for Genetic Conservation; Technical Publication No. 18; ASEAN Forest Tree Seed Centre Project: Saraburi, Thailand, 1994. [Google Scholar]
  7. Yooyuen, R.; Duangjai, S.; Changtragoon, S. Chloroplast DNA variation of Dalbergia cochinchinensis Pierre in Thailand and Laos. In Proceedings of the IUFRO World Series Volume 30: Asia and the Pacific Workshop Multinational and Transboundary Conservation of Valuable and Endangered Forest Tree Species, Guangzhou, China, 5–7 December 2011. [Google Scholar]
  8. Hien, V.T.T.; Phong, D.T. Genetic diversity among endangered rare Dalbergia cochinchinensis (Fabaceae) genotypes in Vietnam revealed by random amplified polymorphic DNA (RAPD) and inter simple sequence repeats (ISSR) markers. Afr. J. Biotechnol. 2012, 11, 8632–8644. [Google Scholar]
  9. Bal, P.; Panda, P.C. Molecular characterization and phylogenetic relationships of Dalbergia species of eastern India based on RAPD and ISSR analysis. Int. J. Innov. Science Res. Technol. 2018, 3, 417–422. [Google Scholar]
  10. Hartvig, I.; So, T.; Changtragoon, S.; Tran, H.T.; Bouamanivong, S.; Theilade, I.; Kjaer, E.D.; Nielsen, L.R. Population genetic structure of the endemic rosewoods Dalbergia cochinchinensis and D. oliveri at a regional scale reflects the Indochinese landscape and life-history traits. Ecol. Evol. 2018, 8, 530–545. [Google Scholar] [PubMed]
  11. Hartvig, I.; Czako, M.; Kjaer, E.D.; Nielsen, L.R.; Theilade, I. The use of DNA barcoding in identification and conservation of rosewood (Dalbergia spp.). PLoS ONE 2015, 10, e0138231. [Google Scholar]
  12. Pérez-Luna, A.; Hernández-Díaz, J.C.; Wehenkel, C.; Simental-Rodríguez, S.L.; Hernández-Velasco, J.; Prieto-Ruíz, J.A. Graft survival of Pinus engelmannii Carr. in relation to two grafting techniques with dormant and sprouting buds. PeerJ 2021, 9, e12182. [Google Scholar]
  13. Dunning, L.T.; Savolainen, V. Broad-scale amplification of matK for DNA barcoding plants a technical note. Bot. J. Linn. Soc. 2010, 164, 1–9. [Google Scholar]
  14. Sotuyo, S.; Pedraza-Ortega, E.; Martinez-Salas, E.; Linares, J.; Cabrera, L. Insights into phylogenetic divergence of Dalbergia (Leguminosae: Dalbergiae) from Mexico and Central America. Front. Ecol. Evol. 2022, 10, 910250. [Google Scholar]
  15. Larkin, M.A.; Blackshields, G.; Brown, N.P.; Chenna, R.; McGettigan, P.A.; McWilliam, H.; Valentin, F.; Wallace, I.M.; Wilm, A.; Lopez, R.; et al. Clustal W and clustal X version 2.0. Bioinformatics 2007, 23, 2947–2948. [Google Scholar] [PubMed]
  16. Hall, T.A. BioEdit: A user-friendly biological sequence alignment editor and analysis program for Windows 95/98/NT. Nucl. Acid Ser. 1999, 41, 95–98. [Google Scholar]
  17. Librado, P.; Rozas, J. DnaSP v5: A software for comprehensive analysis of DNA polymorphism data. Bioinformatics 2009, 25, 1451–1452. [Google Scholar] [PubMed]
  18. Kimura, M. A simple method for estimating evolutionary rates of base substitutions through comparative studies of nucleotide sequences. J. Mol. Evol. 1980, 16, 111–120. [Google Scholar] [PubMed]
  19. Tamura, K.; Stecher, G.; Kumar, S. MEGA 11: Molecular Evolutionary Genetics Analysis Version 11. Mol. Biol. Evol. 2021, 18, 3022–3027. [Google Scholar]
  20. Bandelt, H.J.; Forster, P.; Röhl, A. Median-joining networks for inferring intraspecific phylogenies. Mol. Biol. Evol. 1999, 16, 37–48. [Google Scholar]
  21. Kumar, S.; Stecher, G.; Li, M.; Knyaz, C.; Tamura, K. MEGA X: Molecular evolutionary genetics analysis across computing platforms. Mol. Biol. Evol. 2018, 35, 1547–1549. [Google Scholar] [PubMed]
  22. Nei, M.; Kumar, S. Molecular Evolution and Phylogenetics; Oxford University Press: New York, NY, USA, 2000. [Google Scholar]
  23. Saitou, N.; Nei, M. The neighbor-joining method: A new method for reconstructing phylogenetic trees. Mol. Biol. Evol. 1987, 4, 406–425. [Google Scholar] [PubMed]
  24. Andrianoelina, O.; Rakotondraoelina, H.; Ramamonjisoa, L.; Maley, J.; Danthu, P.; Bouvet, J.M. Genetic diversity of Dalbergia monticola (Fabaceae) an endangered tree species in the fragmented oriental forest of Madagascar. Biodivers. Conserv. 2006, 15, 1109–1128. [Google Scholar]
  25. Phong, D.T.; Tang, D.V.; Hien, V.T.T.; Ton, N.D.; Hai, N.V. Nucleotide diversity of a nuclear and four chloroplast DNA regions in rare tropical wood species of Dalbergia in Vietnam: A DNA barcode identifying utility. Asian J. Appl. Sci. 2014, 2, 116–125. [Google Scholar]
  26. Liu, F.M.; Zhang, N.N.; Liu, X.J.; Yang, Z.J.; Jia, H.Y.; Xu, D.P. Genetic diversity and population structure analysis of Dalbergia odorifera germplasm and development of a core collection using microsatellite markers. Genes 2019, 10, 281. [Google Scholar] [CrossRef] [PubMed]
  27. Niyomdham, C.; Hô, P.H.; Dy Phon, P.; Vidal, E. Leguminoseae-Papilionoideae Dalbergieae. In Flore du Cambodge du Laos et du Viêtnam; Morat, P., Ed.; Muséum National d’Histoire Naturelle: Paris, France, 1997. [Google Scholar]
  28. CTSP. Cambodian Tree Species. Monographs. Cambodia Tree Seed Project, FA, Cambodia, and DANIDA, Denmark. 2004. Available online: https://www.scribd.com/document/125785024/Cambodian-Tree-Species (accessed on 20 December 2023).
  29. Barreto, M.A.; Mucherino-Muňoz, J.J.; Menezes, I.P.P.; Tarazi, R.; Silva, J.G.; Gaiotto, F.A.; Corrêa, R. Genetic structure and diversity of Dalbergia nigra from Brazilian Atlantic forest fragments. Forests 2023, 14, 2165. [Google Scholar] [CrossRef]
  30. Huang, J.F.; Li, S.Q.; Xu, R.; Peng, Y.Q. East-West genetic differentiation across the Indo-Burma hotspot: Evidence from two closely related dioecious figs. BMC Plant Biol. 2023, 23, 321. [Google Scholar]
Figure 1. Morphological characteristics of D. cochinchinensis used for species identification: (a) Siamese rosewood tree; (b) inflorescences; (c) green pods; (d) dried pods; (e) seeds; and (f) stem.
Forests 16 00332 g001
Figure 2. Geographic distribution of D. cochinchinensis sampling locations in this study.
Forests 16 00332 g002
Figure 3. The median-joining haplotype network of the chloroplast maturase K (matK) and nuclear internal transcribed spacer (ITS) depicts the relationships among haplotypes from examined populations of D. cochinchinensis. The area of the circles represents the proportion of specimen numbers found in each haplotype. The length of each branch demonstrates the number of mutational steps (ms).
Forests 16 00332 g003
Figure 4. Phylogenetic tree based on the nuclear internal transcribed spacer (ITS) sequences showing relationships among D. cochinchinensis samples from this study and previously published sequences of D. cochinchinensis and other Dalbergia species from GenBank. Numbers at nodes indicate bootstrap support values from maximum likelihood/maximum parsimony analyses. Pterocarpus indicus was used as an outgroup.
Forests 16 00332 g004
Figure 5. Phylogenetic tree based on the chloroplast maturase K (matK) sequences showing relationships among D. cochinchinensis samples from this study and previously published sequences of D. cochinchinensis and other Dalbergia species from GenBank. Two distinct clades (A and B) were identified within D. cochinchinensis. Numbers at nodes indicate bootstrap support values from maximum likelihood/maximum parsimony analyses. Pterocarpus indicus was used as an outgroup.
Forests 16 00332 g005
Table 1. List of samples and molecular markers examined in this study.
Sample No.Sample CodeMolecular Markern ***Sample Collection Site (Habitat Characteristics)Elevation Above Sea Level (m)
matK *ITS **
1TRT-M1DcM1DcI234Mueang District, Trat Province (mixed deciduous forest, silty and sandy clay loam)11
2TRT-M2DcM2DcI244
3TRT-M3DcM2DcI2412
4TRT-M4DcM1n/a10
5TRT-KY1DcM4DcI214Khlong Yai District, Trat Province (mixed deciduous forest, silty and sandy clay loam)16
6TRT-KY2DcM3DcI2111
7TRT-KY3DcM4DcI2222
8TRT-KY4DcM3n/a20
9SSK-PS1DcM6n/a5Phu Sing District, Sisaket Province (mixed deciduous forest, sandy clay loam)480
10SSK-PS2DcM6DcI19530
11SSK-PS3DcM5DcI19520
12SSK-PS4n/aDcI19521
13SSK-PS5DcM5DcI18524
14SSK-KL1DcM7DcI204Kantaralak District, Sisaket Province (mixed deciduous forest, sandy clay loam)270
15SSK-KL2DcM7DcI14265
16SSK-KL3DcM7DcI20268
17SSK-KL4n/aDcI14271
18SRN-KC1DcM9DcI184Kap Choeng District, Surin Province (mixed deciduous forest, sandy clay loam)242
19SRN-KC2DcM8DcI19241
20SRN-KC3DcM9DcI11222
21SRN-KC4DcM8n/a220
22SRI76DcM10n/a6Muak Lek District, Saraburi Province (mixed deciduous forest, sandy clay loam)455
23SRI80DcM10n/a370
24SRIDcM10n/a330
25SRI6n/aDcI28310
26SRI27n/aDcI29380
27SRI34n/aDcI11380
28SNK-PP1DcM15DcI155Phu Phan District, Sakon Nakhon Province (mixed deciduous forest, sandy clay loam)472
29SNK-PP2DcM14DcI16490
30SNK-PP3DcM13DcI5493
31SNK-PP4DcM12DcI17488
32SNK-PP5DcM11DcI5469
33SNK-M1DcM20DcI125Mueang District, Sakon Nakhon Province (mixed deciduous forest, silty and sandy clay loam)324
34SNK-M2DcM19DcI13339
35SNK-M3DcM18DcI5321
36SNK-M4DcM17DcI14540
37SNK-M5DcM16DcI15535
38SKW-WY1DcM23DcI13Wang Nam Yen District, Sa Kaeo Province (mixed deciduous forest, sandy clay loam)143
39SKW-WY2DcM22DcI1183
40SKW-WY3DcM21DcI11163
41NMA-KB1DcM26DcI13Khonburi District, Nakhon Ratchasima Province (mixed deciduous forest, sandy clay loam)307
42NMA-KB2DcM25DcI9306
43NMA-KB3DcM24DcI10309
44KKN-WK1DcM32DcI27Wiang Kao District, Khon Kaen Province (mixed deciduous forest, sandy clay loam)568
45KKN-WK2DcM31DcI3564
46KKN-WK3DcM30DcI4668
47KKN-WK4DcM29DcI5602
48KKN-WK5DcM28DcI6612
49KKN-WK6DcM27DcI7606
50KKN-WK7n/aDcI8577
51CCO-TT1DcM34DcI14Tha Takiap District, Chachoengsao Province (mixed deciduous forest, sandy clay loam/laterite)88
52CCO-TT2DcM33DcI1101
53CCO-TT3DcM34DcI1100
54CCO-TT4DcM33DcI1108
55UBN-NC1n/aDcI243Na Chaluai District, Ubon Ratchathani Province (mixed deciduous forest, sandy clay loam)300
56UBN-NC2n/aDcI21348
57UBN-NC4n/aDcI21302
58UBN-NY1n/aDcI223Nam Yuen District, Ubon Ratchathani Province (mixed deciduous forest, sandy clay loam)384
59UBN-NY2n/aDcI22371
60UBN-NY3n/aDcI22388
61MDH8n/aDcI254Kham Chai District, Mukdahan Province (mixed deciduous forest, sandy clay loam)390
62MDH12n/aDcI13396
63MDH41n/aDcI25401
64MDH67n/aDcI17416
65UDN36n/aDcI304Nong Wua So District, Udon Thani Province (mixed deciduous forest, sandy clay loam)377
66UDN37n/aDcI2383
67UDN43n/aDcI2238
68UDN45n/aDcI31243
69PLK5n/aDcI164Nakhon Thai District, Phisanulok Province (mixed deciduous forest, silty and sandy clay loam)622
70PLK9n/aDcI26615
71PLK21n/aDcI27630
72PLK32n/aDcI13640
* matK haplotype detection using the forward primer matK-3F_IH (5′-CGT ATA GTA CTC TTG TGT TTA CGA G-3′) and reverse primer matK-3R (5′-ATC CTA TTC ATC TGG AAA TCT TGG TTC-3′); ** ITS haplotype detection using the forward primer ITS4-F (5′-GGA AGG AGA AGT CGT AAC AAG G-3′) and reverse primer ITS5-R (5′-TCC TCC GCT TAT TGA TAT GC-3′); *** n means sample size; and n/a means not available.
Table 2. Molecular diversity indices of the 17 populations of D. cochinchinensis based on the nuclear internal transcribed spacer (ITS) and chloroplast maturase K (matK) sequences analyses.
PopulationsITSmatK
nSHUhHd ± SDNd ± SDnSHUhHd ± SDNd ± SD
TRT-M31210.667 ± 0.3140.0010 ± 0.000545220.667 ± 0.2040.0041 ± 0.0012
TRT-KY31200.667 ± 0.3140.0010 ± 0.000544220.667 ± 0.2040.0033 ± 0.0001
SSK-KL43210.667 ± 0.2040.0030 ± 0.000930110.000 ± 0.0000.0000 ± 0.0000
SSK-PS41200.500 ± 0.2650.0008 ± 0.0004411220.667 ± 0.2040.0089 ± 0.0027
SRN-KC33301.000 ± 0.2720.0035 ± 0.0012410220.667 ± 0.2040.0081 ± 0.0025
SRI32321.000 ± 0.2720.0020 ± 0.000730110.000 ± 0.0000.0000 ± 0.0000
SNK-M55511.000 ± 0.1260.0042 ± 0.0009512551.000 ± 0.1260.0073 ± 0.0011
SNK-PP54400.900 ± 0.1610.0036 ± 0.0007522551.000 ± 0.1260.0122 ± 0.0032
SKW-WY32200.667 ± 0.3140.0020 ± 0.0009310331.000 ± 0.2720.0081 ± 0.0023
NMA-KB32321.000 ± 0.2720.0020 ± 0.0007310331.000 ± 0.2720.0081 ± 0.0025
KKN-WK711751.000 ± 0.0760.0078 ± 0.0012628661.000 ± 0.0960.0138 ± 0.0034
CCO-TT41100.000 ± 0.0000.0000 ± 0.0000412220.667 ± 0.2040.0097 ± 0.0030
UBN-NY31100.000 ± 0.0000.0000 ± 0.0000n/an/an/an/an/an/a
UBN-NC31200.667 ± 0.3140.0010 ± 0.0005n/an/an/an/an/an/a
UDN45320.833 ± 0.2220.0040 ± 0.0013n/an/an/an/an/an/a
MDH44310.833 ± 0.2220.0038 ± 0.0011n/an/an/an/an/an/a
PLK46421.000 ± 0.1770.0045 ± 0.0013n/an/an/an/an/an/a
Total651731170.968 ± 0.0080.0069 ± 0.0003486634250.986 ± 0.0070.0161 ± 0.0022
n, sample site; S, segregation site; H, number of haplotypes; Uh, unique haplotype; Hd, haplotype diversity; Nd, nucleotide diversity; SD, standard deviation; n/a, not available.
Table 3. Pairwise genetic distances between D. cochinchinensis populations based on the chloroplast maturase K (matK) sequences, showing the p-distance (lower triangle) and Kimura 2-parameter (K2P) distance (upper triangle).
PopulationsTRT-MTRT-KYSSK-KLSSK-PSSRN-KCSNK-MSNK-PPSKW-WYNMA-KBKKN-WKCCO-TTSRI
TRT-M0.00610.02040.00860.00860.00720.01140.00710.00630.01110.00920.0448
TRT-KY0.00610.02230.01170.00980.00740.01130.00650.00650.01230.00980.0429
SSK-KL0.02010.02190.01790.02100.02250.02600.02270.02230.02350.02350.0597
SSK-PS0.00850.01160.01770.01170.01320.01690.01370.01040.01460.01350.0513
SRN-KC0.00850.00970.02070.01160.01080.01400.00940.00940.01270.01170.0467
SNK-M0.00720.00730.02220.01300.01070.00950.00800.00910.01190.00930.0444
SNK-PP0.01130.01120.02560.01670.01390.00950.01160.01220.01510.01260.0429
SKW-WY0.00710.00650.02230.01360.00930.00800.01150.00940.01240.01110.0411
NMA-KB0.00630.00650.02190.01040.00930.00900.01210.00930.01180.01020.0476
KKN-WK0.01100.01220.02310.01440.01260.01180.01490.01230.01160.01290.0493
CCO-TT0.00910.00970.02310.01340.01160.00930.01240.01100.01020.01280.0467
SRI0.04320.04140.05720.04930.04510.04290.04140.03980.04590.04750.0451
Table 4. Pairwise genetic distances between D. cochinchinensis populations based on the nuclear internal transcribed spacer (ITS) sequences, showing the p-distance (lower triangle) and Kimura 2-parameter (K2P) distance (upper triangle).
PopulationsTRT-MTRT-KYSSK-KLSSK-PSSRN-KCSNK-MSNK-PPSKW-WYNMA-KBKKN-WKCCO-TTUBN-NYUBN-NCMDHUDNPLKSRI
TRT-M0.00250.00880.00460.00450.01140.01080.00500.00650.01040.00500.00350.00150.01220.00800.01030.0050
TRT-KY0.00250.00730.00310.00300.00990.00930.00350.00430.00880.00350.00100.00100.01070.00630.00880.0035
SSK-KL0.00870.00720.00890.00750.00470.00440.00630.00780.00600.00680.00830.00730.00640.00720.00490.0048
SSK-PS0.00460.00310.00880.00200.01200.01140.00530.00680.01040.00560.00410.00310.01290.00780.01100.0049
SRN-KC0.00450.00300.00750.00200.01090.01030.00400.00550.00910.00450.00400.00300.01170.00640.00980.0035
SNK-M0.01130.00980.00460.01190.01080.00340.00940.01090.00690.00940.01090.00990.00460.00980.00410.0083
SNK-PP0.01070.00920.00430.01130.01020.00340.00880.01030.00650.00880.01030.00930.00380.00910.00350.0077
SKW-WY0.00500.00350.00620.00520.00400.00930.00870.00220.00780.00100.00450.00350.01020.00530.00830.0023
NMA-KB0.00650.00430.00770.00670.00550.01080.01020.00220.00910.00150.00400.00500.01170.00630.00980.0038
KKN-WK0.01040.00870.00600.01030.00900.00680.00650.00780.00900.00840.00950.00890.00770.00670.00650.0065
CCO-TT0.00500.00350.00670.00560.00450.00930.00870.00100.00150.00840.00450.00350.01020.00600.00830.0030
UBN-NY0.00350.00100.00820.00410.00400.01080.01020.00450.00400.00940.00450.00200.01170.00680.00980.0045
UBN-NC0.00150.00100.00720.00310.00300.00980.00920.00350.00500.00890.00350.00200.01070.00650.00880.0035
MDH0.01210.01060.00640.01270.01160.00460.00380.01010.01160.00770.01010.01160.01060.01020.00390.0092
UDN0.00800.00620.00710.00780.00640.00970.00900.00520.00620.00660.00600.00670.00650.01010.00850.0043
PLK0.01020.00870.00490.01090.00970.00400.00340.00820.00970.00640.00820.00970.00870.00390.00840.0073
SRI0.00500.00350.00470.00490.00350.00830.00770.00230.00380.00650.00300.00450.00350.00910.00420.0072
Disclaimer/Publisher’s Note: The statements, opinions and data contained in all publications are solely those of the individual author(s) and contributor(s) and not of MDPI and/or the editor(s). MDPI and/or the editor(s) disclaim responsibility for any injury to people or property resulting from any ideas, methods, instructions or products referred to in the content.

