Abstract
Intensive anthropogenic disturbances have driven significant spatial disparities and progressive fragmentation of forest-based green infrastructure (GI) that delivers vital ecosystem services across river basins. To address these challenges, delineating ecological management zones and developing spatially targeted GI optimization measures are imperative for safeguarding regional ecological security and advancing nature-based solutions in coupled human–water–forest systems. Focused on the mainstream area of the Jialing River Basin, we establish an ecological optimization zoning system that reconciles forest ecosystem resilience with regional development equity. By using morphological spatial pattern analysis, landscape pattern analysis and the In-VEST model, the GI supply capacity was assessed from three dimensions: element composition, structural configuration, and ecosystem services. The demand intensity was evaluated based on environmental governance pressure, urban expansion demand and social development needs across counties. Supply–demand matching was analyzed using quadrant-based mismatch typology and coupling coordination degree model. The results reveal that the following: (1) supply-deficit counties are predominantly located in the middle and lower reaches of the basin, characterized by high urbanization and economic development; (2) supply-surplus and high-level balanced counties cluster in the ecologically conserved upper reaches; (3) low-level balanced counties are concentrated in agricultural zones; (4) the overall coordination degree of supply and demand show a preliminary state of coordination. Based on these findings, the basin was classified into five zones at the county level: GI restoration, management, rehabilitation, enhancement, and conservation. Tailored ecological management measures and policies were formulated for each zone to advance sustainable basin development.
1. Introduction
Amidst rapid urbanization, unregulated anthropogenic activities have triggered a cascade of ecological crises across river basins, including severe soil erosion, habitat degradation, and deteriorating human settlement quality [1]. In recent years, the paradigm of “ecological primacy and green development” has progressively supplanted the singular pursuit of economic performance [2]. Implementing spatially targeted management zones and optimization strategies for forest-based green infrastructure (GI) has emerged as a critical pathway toward achieving sustainable human–nature harmony in watershed systems [3]. Given the pronounced spatial disparities in ecological resource distribution and inter-county socioeconomic heterogeneity, identifying the spatial patterns and coupling mechanisms of GI supply and demand is essential for enhancing ecological governance efficiency [4]. This spatially explicit approach provides a scientific foundation for advancing integrated ecological protection and restoration within territorial spatial planning frameworks, while simultaneously promoting high-quality urban–rural development [5].
The assessment of green infrastructure (GI) supply capacity has increasingly focused on its functional performance [6]. Recent studies have explored the impact of urban green space configuration on ecosystem services from multiple perspectives, including climate regulation [7], air quality improvement [8], stormwater management [9], biodiversity conservation [10], enhanced carbon sequestration [11], public health and community identity promotion [12,13]. Empirical evidence demonstrates that GI’s ecological performance is directly influenced by its typology, quantity, structural configuration, and quality [14,15]. As the integrity of landscape patterns directly governs key ecological processes, quantifying landscape composition and configuration through landscape metrics provides a methodological foundation for unraveling the mechanisms and spatial efficacy of GI’s supply [16,17]. For instance, high edge density (ED) may indicate habitat fragmentation risks, while Largest Patch Index (LPI) correlates positively with habitat quality [18,19]. Scholars have also employed studies on land-use and landscape pattern dynamics to explore how evolving landscape indices aid in identifying ecologically sensitive areas and promoting sustainable planning and management [20].
Conversely, GI demand intensity exhibits a significant positive association with regional socioeconomic development levels, particularly in rapidly urbanizing watersheds, highlighting the need for spatially targeted management strategies to balance ecological and developmental priorities [21]. At the same time, research commonly employs indicators such as population density, human activity intensity, and per capita green space availability for vulnerable groups (e.g., youth and elderly populations) to quantify urban demand for GI [22]. Studies reveal that densely populated areas typically exhibit heightened demand, while insufficient per capita green space often exacerbates supply–demand mismatches in ecosystem services [23].
The research on the matching of GI supply and demand mainly focuses on three aspects: firstly, the research measures the supply and demand of specific ecosystem services of urban GI. For example, based on flood disaster assessments, some studies visualize the supply and demand for GI’s stormwater management functions and identify priority areas for GI allocation [24]. Some scholars have proposed the Ecosystem Service Process Misalignment Index (MbSDES) to assess the degree of mismatch in urban ecosystem services such as air purification and cooling [25]. Additionally, other scholars have developed a framework for mapping, modifying, and identifying the supply–demand matching of GI’s ecosystem services, applying it to five functional categories: cooling, air purification, noise reduction, landscape aesthetics, and outdoor recreation [26]. Secondly, some studies incorporate time series analysis, using multi-scenario simulations to integrate the diversity and variability of ecological services supply and demand into GI decision-making processes to enhance human well-being and promote sustainable development [27]. Thirdly, some studies explore the supply–demand matching of GI from a comprehensive perspective, such as measuring GI supply using ecosystem service value methods and assessing GI demand from social, economic, ecological, and environmental dimensions, in order to study the spatial-temporal differences in GI supply and demand configuration [28]. Alternatively, from the perspective of spatial or social equity, a coupling method between the spatial distribution of urban residents’ activity spaces and the spatial distribution of GI service supply is constructed [29,30]. To summarize, the basic research paradigm involves establishing the connection between supply and demand through statistical data and map overlays, where GI supply indicators are often physical attributes such as area, shape, type, and connectivity, while demand indicators are primarily social attributes, including population, economy, and environmental value [31].
In terms of research scale, studies on the supply–demand matching of GI are largely focused on the urban and community scales [32,33,34], with fewer studies at the macro level, such as those on urban agglomerations or basin scales. However, the spatial relationship and quantitative assessment of supply and demand remain key issues in macro-scale GI planning [35,36]. Current research at the macro level mainly focuses on the supply–demand analysis of ecosystem services, using the overlay and comparison of specific ecosystem service supply–demand grid data to delineate ecological control zones and propose optimization strategies [37,38]. At the macro scale, there is a lack of more comprehensive and systematic indicators to assess the levels of GI supply and demand, in order to develop GI optimization plans that are closely aligned with administrative divisions and offer effective guidance.
Human settlements in river basin, as a hub of socio-economic activities located in the water–land ecotone, faces complex and multifaceted environmental pressures on its ecological processes [39]. China recently released the Guidelines on Strengthening Ecological and Environmental Zoning Regulation, which outlines targets to establish a preliminary framework for ecological–environmental zoning regulation by 2025 and achieve a fully established, institutionally robust, and operationally efficient system by 2035. China’s watershed planning and ecological functional zoning are increasingly characterized by systemic integration, policy synergy, and legal standardization. However, ecological spatial zoning strategies for mountainous watersheds in southwestern China remain underdeveloped, with current efforts largely confined to academic exploration rather than codified policy frameworks.
This study focuses on the mainstream area of the Jialing River Basin. Serving as a strategic ecological barrier for both the upper Yangtze River and the Three Gorges Reservoir area, the Jialing River basin plays vital roles in water yield, soil retention, and biodiversity protection [40]. However, intensive anthropogenic activities, including urban–rural construction, agricultural expansion, and waterway development, have led to severe fragmentation of forest-based ecological spaces, with forest connectivity decreasing. Therefore, adopting location-specific and scientifically sound approaches to delineate GI management zones within the basin, and formulating optimization strategies are of great significance for ensuring ecological security in the basin and achieving regional sustainable development [41]. This study integrated MSPA-based structural integrity assessment with InVEST-driven ecosystem service quantification within a GI evaluation framework. By incorporating geospatial analysis of GI supply capacity, demand intensity, and spatial mismatch degree at the sub-basin administrative scale, an ecological optimization zoning system that reconciles forest ecosystem resilience with regional development equity was established, providing a foundation for the formulation of targeted strategies to optimize green ecological spaces in the future.
2. Materials and Methods
2.1. Study Area and Data
The Jialing River Basin exhibits complex and diverse topography, characterized by higher elevations in the northern, western, and eastern regions, with a gradual decline toward the southeast. Geomorphologically, it can be categorized into three zones: the northern mid-mountain area, central low-mountain hilly region, and southern parallel ridge-valley terrain. The basin experiences a subtropical monsoon climate with distinct seasons, featuring a multi-year average temperature of 11–18 °C. Annual humidity progressively increases from the upper to lower reaches, notably peaking between September and December. Precipitation typically exceeds 1000 mm annually, with the most abundant rainfall occurring from June to October, reflecting its distinctive “autumn rain-dominated” hydrological regime. As one of the most socioeconomically developed and rapidly urbanizing mountainous watersheds in Southwest China, the Jialing River Basin exhibits typical characteristics of ecological vulnerability, high disturbance sensitivity, and low resilience capacity [42].
The study area spans the administrative divisions of Shaanxi Province, Gansu Province, Sichuan Province, and Chongqing Municipality, including a total of 29 counties with an area of approximately 57,700 square kilometers. The study area is shown in Figure 1. The sources of all data are detailed in Table 1.
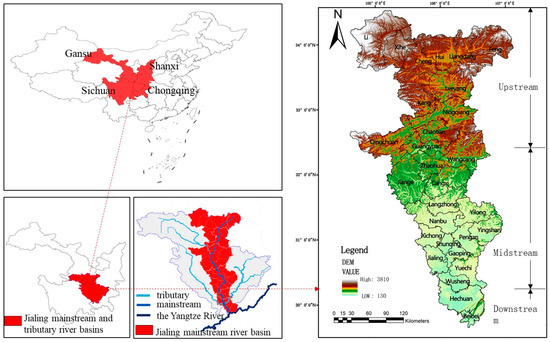
Figure 1.
Study area.

Table 1.
Data sources.
2.2. Method
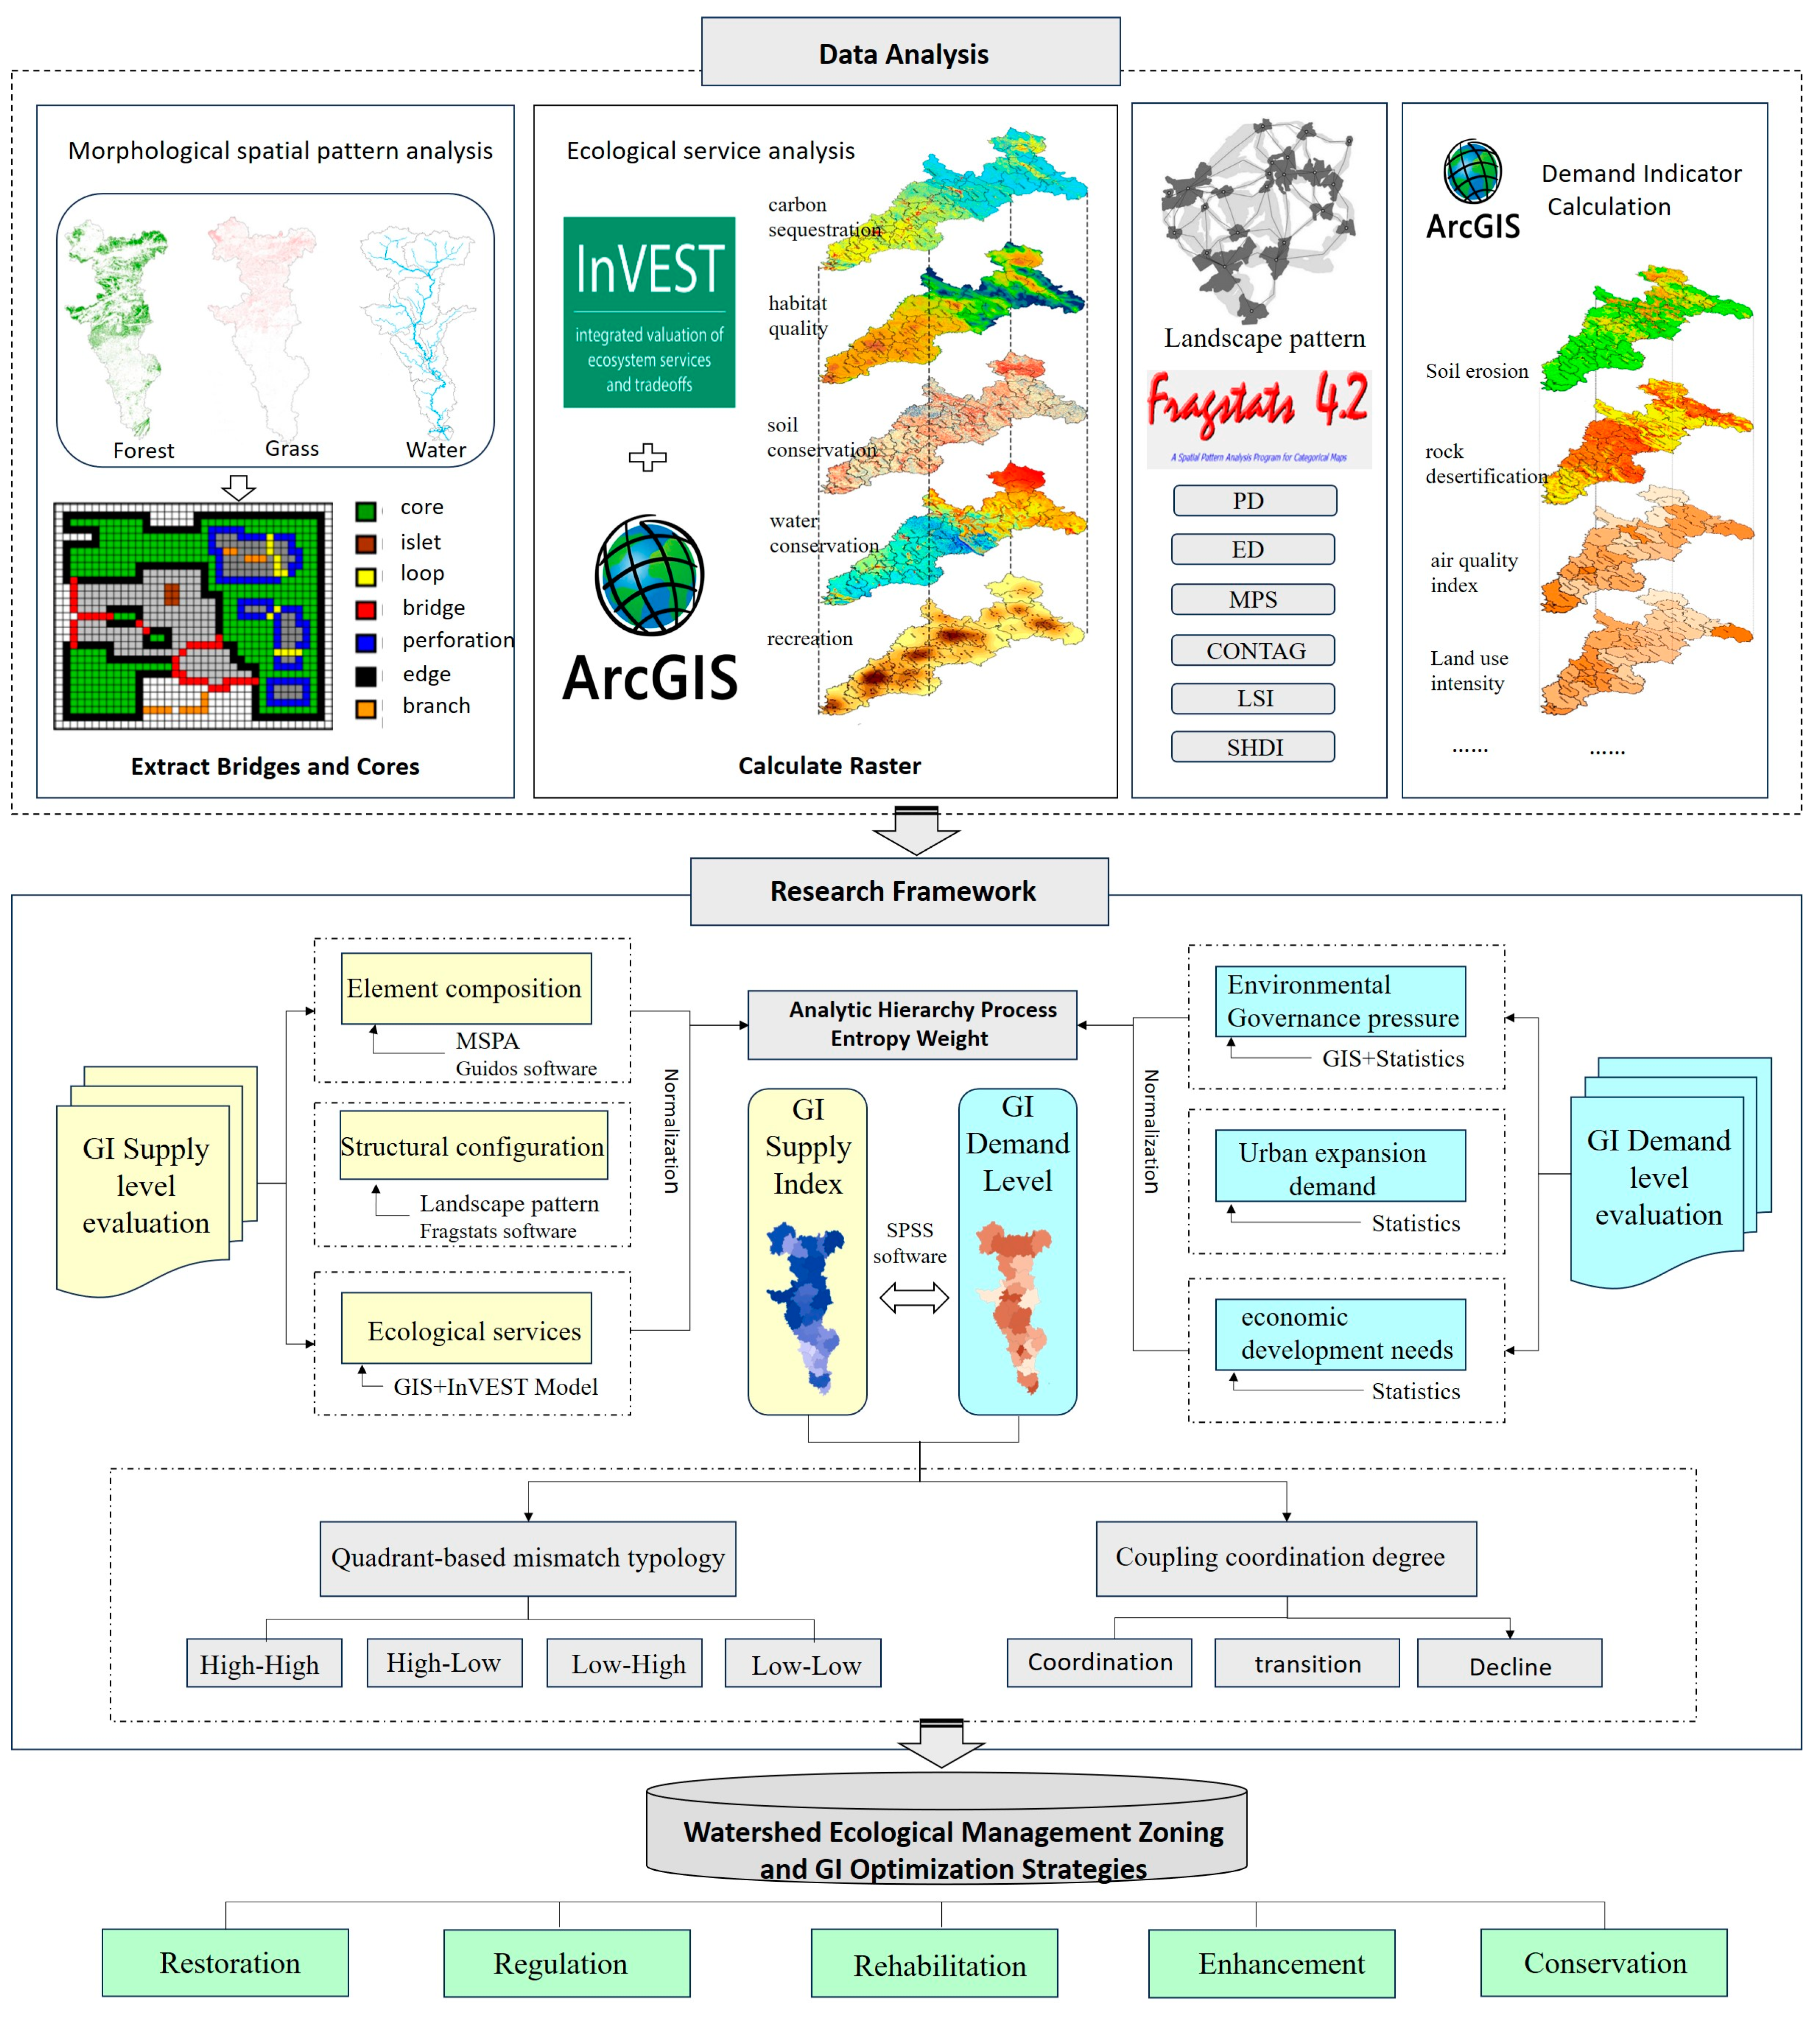
According to the flowchart (Figure 2), this study focused on the river basin space that emphasized the coordinated development of ecological protection and urban economic and social construction as the research area. The counties within the basin were used as the analysis units, which facilitated the integration with various types of territorial spatial planning to enhance the applicability and implementability of the research conclusions. This study attempted to explore the construction of a more comprehensive and integrated assessment index system for the supply and demand levels of GI. The matching quantification methods under multi-source data (biophysical data and socio-economic data) were more scientific and better reflected the complexity and dynamic characteristics of the basin (Figure 2).
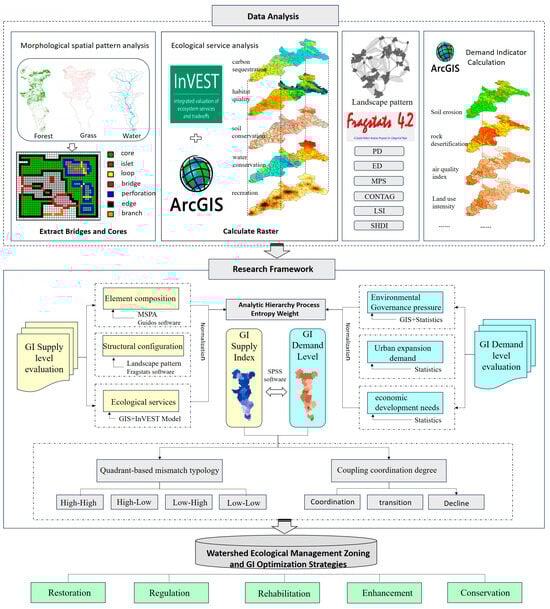
Figure 2.
Research Design.
2.2.1. Assessment of GI Supply Capacity
- GI element composition indicators
Land cover composition, ecological hubs, and corridor composition are key element types of GI that directly influence the performance level and quality of GI functions in a county. Forest, grassland, and water land uses serve as core sources and sinks of ecological flows, and a higher proportion of these land uses is more beneficial for improving the ecological environment and enhancing ecological functions [43]. The greater the proportion of ecological source areas and corridors dominated by forest, grassland, and water land uses, the higher the stability and resilience of a county’s GI [44]. The identification of ecological source areas and corridors can be carried out using Morphological Spatial Pattern Analysis (MSPA) [45], which effectively identifies different types of ecological spaces in a region. By using the Guidos Toolsbox 2.8, this method classifies landscape patches into seven types of landscape categories [46], with advantages such as detailed identification and assessment, low data requirements, and the ability to visualize results. In this classification, “core” corresponds to ecological source areas, and “bridge” corresponds to ecological corridors.
- 2.
- GI structural configuration indicators
GI spatial structure information can be effectively summarized using landscape pattern indices, which are subsequently employed to assess the fragmentation, heterogeneity, and stability of GI networks across different counties [47]. During the research process, to avoid strong correlations between indices and redundant contributions to the evaluation, cluster analysis was used to remove redundant indices and select secondary indicators [48]. These include indicators that represent fragmentation: Mean Patch Size (MPS) and Patch Density (PD); indicators that represent heterogeneity: Edge Density (ED) and Shannon’s Diversity Index (SHDI); indicators that represent connectivity: Contagion Index (CONTAG); and indicators that represent shape regularity: Landscape Shape Index (LSI). When higher values of MPS, SHDI, CONTAG, and LSI coincide with lower PD and ED, this indicates reduced landscape fragmentation and heterogeneity, enhanced connectivity and edge effects, and greater structural stability of GI. Such configurations facilitate wildlife migration and pollutant degradation, reflecting an elevated GI supply capacity [18,19,20]. The landscape pattern index data were calculated using Fragstats 4.2 software.
- 3.
- GI ecological services indicators
Basin GI can provide ecological services or ecological products, including four major categories: provisioning, supporting, regulating, and socio-cultural. Based on the characteristics of the Jialing River basin, the core functions of GI in ensuring the ecological security and sustainable development of the basin include providing high-quality habitats [49] (supporting), water yield [50] (provisioning), carbon sequestration [51], soil conservation [52], and recreational resources [53] (socio-cultural). Applying the InVEST model and GIS to assess ecosystem services [54]. The ecological services were analysis by InVEST software (3.13.0) and GIS. The evaluation methods are expressed in Table 2 as follows:
Table 2.
GI ecosystem services assessment methodology table.
2.2.2. Assessment of GI Demand Intensity
- Environmental pressure indicators
At the level of environmental pressure and management needs: the Jialing River basin is an area severely affected by soil erosion and rocky desertification, which directly threaten the ecological health of the basin. The intensity of soil erosion (proportion of areas with very high and high sensitivity to soil erosion) and the intensity of rocky desertification (proportion of areas with very high and high sensitivity to rocky desertification) were used as indicators to measure the degree of soil erosion and rocky desertification in the region. Higher values indicate greater sensitivity to soil erosion and rocky desertification in that county, signifying a greater need for environmental management measures such as GI protection and restoration [55]. The formulas for calculating soil erosion [56] and rocky desertification are presented in Equations (1) and (2) [57]. In recent years, resource exploitation and industrial development have led to a significant decline in urban air quality in the basin. The poorer the air quality in a county, the higher the demand for GI air purification services. The Air Quality Index (AQI) was selected as the measurement indicator, with higher values indicating poorer urban air quality.
In the formula, Ri represents rainfall erosivity, Ki is the soil erodibility factor, LSi is the slope length and steepness, and Ci is the vegetation cover index.
In the formula, RDi represents the rocky desertification sensitivity index, Di is the proportion of carbonate rock exposure, Pi is the terrain slope, and Ci is the vegetation cover index.
- 2.
- Urban expansion demand indicators
At the level of urban expansion pressure, due to population growth and urbanization, the density of urban construction land and infrastructure such as transportation, industrial, and mining facilities has increased, leading to intensified GI fragmentation and greater demand for GI network construction and restoration [58]. Based on data availability, two indicators are selected to represent urban expansion pressure: land use intensity and population density. Land use intensity reflects the intensity of human activity; the more intense the human activity, the higher the demand for GI functions. Population density indicates the strength of demand for GI functions; the higher the population density, the greater the demand.
- 3.
- Social development needs indicators
At the level of social development needs, the larger the urban population and the higher the level of regional economic development, the greater the demand for GI service provision [59]. Considering the relevance and availability of data, the selected indicators include per capita GDP, urbanization rate, and the proportion of the tertiary industry’s output value. Per capita GDP reflects the region’s consumption capacity, which indicates the demand for GI functions (such as cultural and recreational functions). The urbanization rate and the proportion of the tertiary industry reflect the intensity of demand for environmental quality and tourism aesthetics in the region.
2.2.3. GI Supply–Demand Matching and Coupling Coordination Degree
Due to the different nature, measurement units, and meanings of multiple indicators, direct quantitative analysis is not possible, and normalization is required. The maximum normalization method was used to process the values, and to facilitate comparison between counties [60], the normalization range is set between 0 and 1, which is expressed in Equation (3) as follows:
In the formula: Xmax, Xmin, and Xi represent the maximum value, minimum value, and a specific value of the indicator, respectively.
This study employed a combination of subjective and objective weighting methods. The weights were calculated based on the expert scoring method [61], with adjustments made using the entropy method from the objective weighting approach [62]. The final weights were determined by taking the average of both methods. The supply and demand indicators are shown in Table 3 and Table 4:
Table 3.
GI supply level evaluation indicator explanations and weights.
Table 4.
GI demand level evaluation indicator explanations and weights.
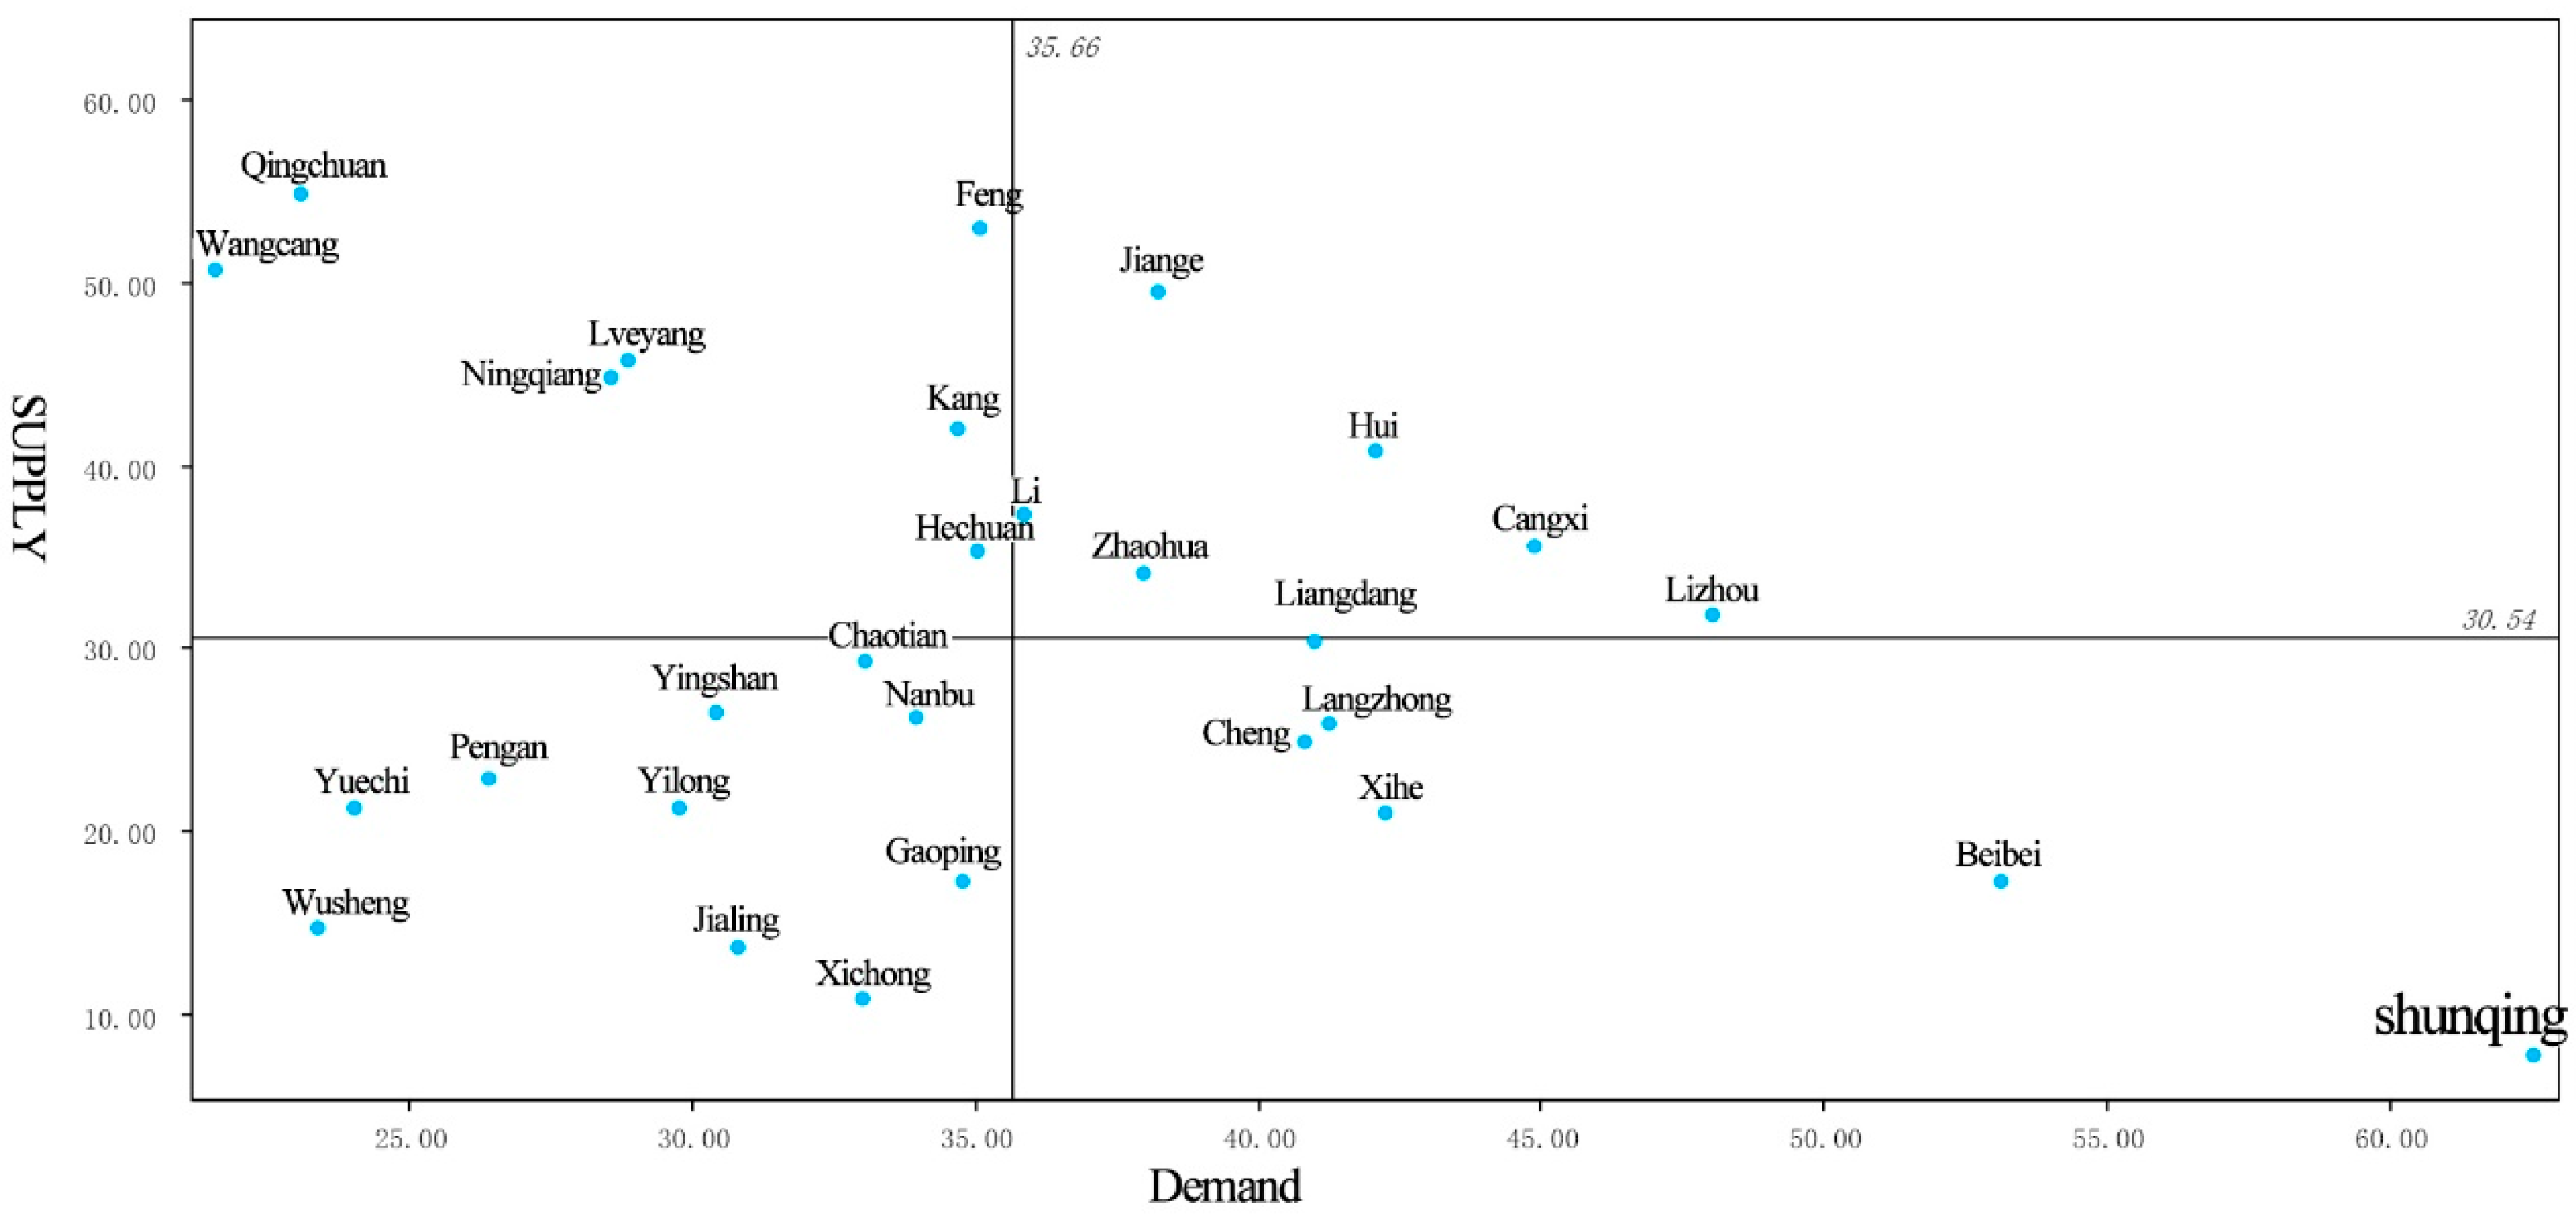
The GI supply and demand indices for each county within the basin were calculated, and the results were analyzed through Quadrant-based mismatch typology [63] to assess supply–demand matching. The GI supply and demand levels were represented on the Y-axis and X-axis, respectively, dividing the counties into four quadrants. Quadrants I, II, III, and IV represented counties with high demand and high supply, low demand and high supply, low demand and low supply, and high demand and low supply, respectively.
This study also evaluated the coupling coordination degree of GI supply and demand levels across various counties in the Jialing River Basin. The coupling degree is used to measure the synergistic interaction between parameters within a system, and the coupling coordination degree further analyzes the extent of this coordination. This paper used SPSS 19.0 for coupling coordination degree analysis, which is expressed in Equations (4)–(6) [64].
In the formula, D represents the supply–demand coupling coordination degree of the county, with D values ranging between 0 and 1; the larger the value, the better the supply–demand coordination. C represents the coupling degree, T is the comprehensive supply–demand coordination index, and XS and XD are the standardized values of GI supply level and demand level, respectively. The sum of the coefficients is to be determined, and since supply and demand are equally important, each is set to 0.5.
3. Results
3.1. Evaluation Results of GI Supply Level Index in Counties of the Jialing Basin
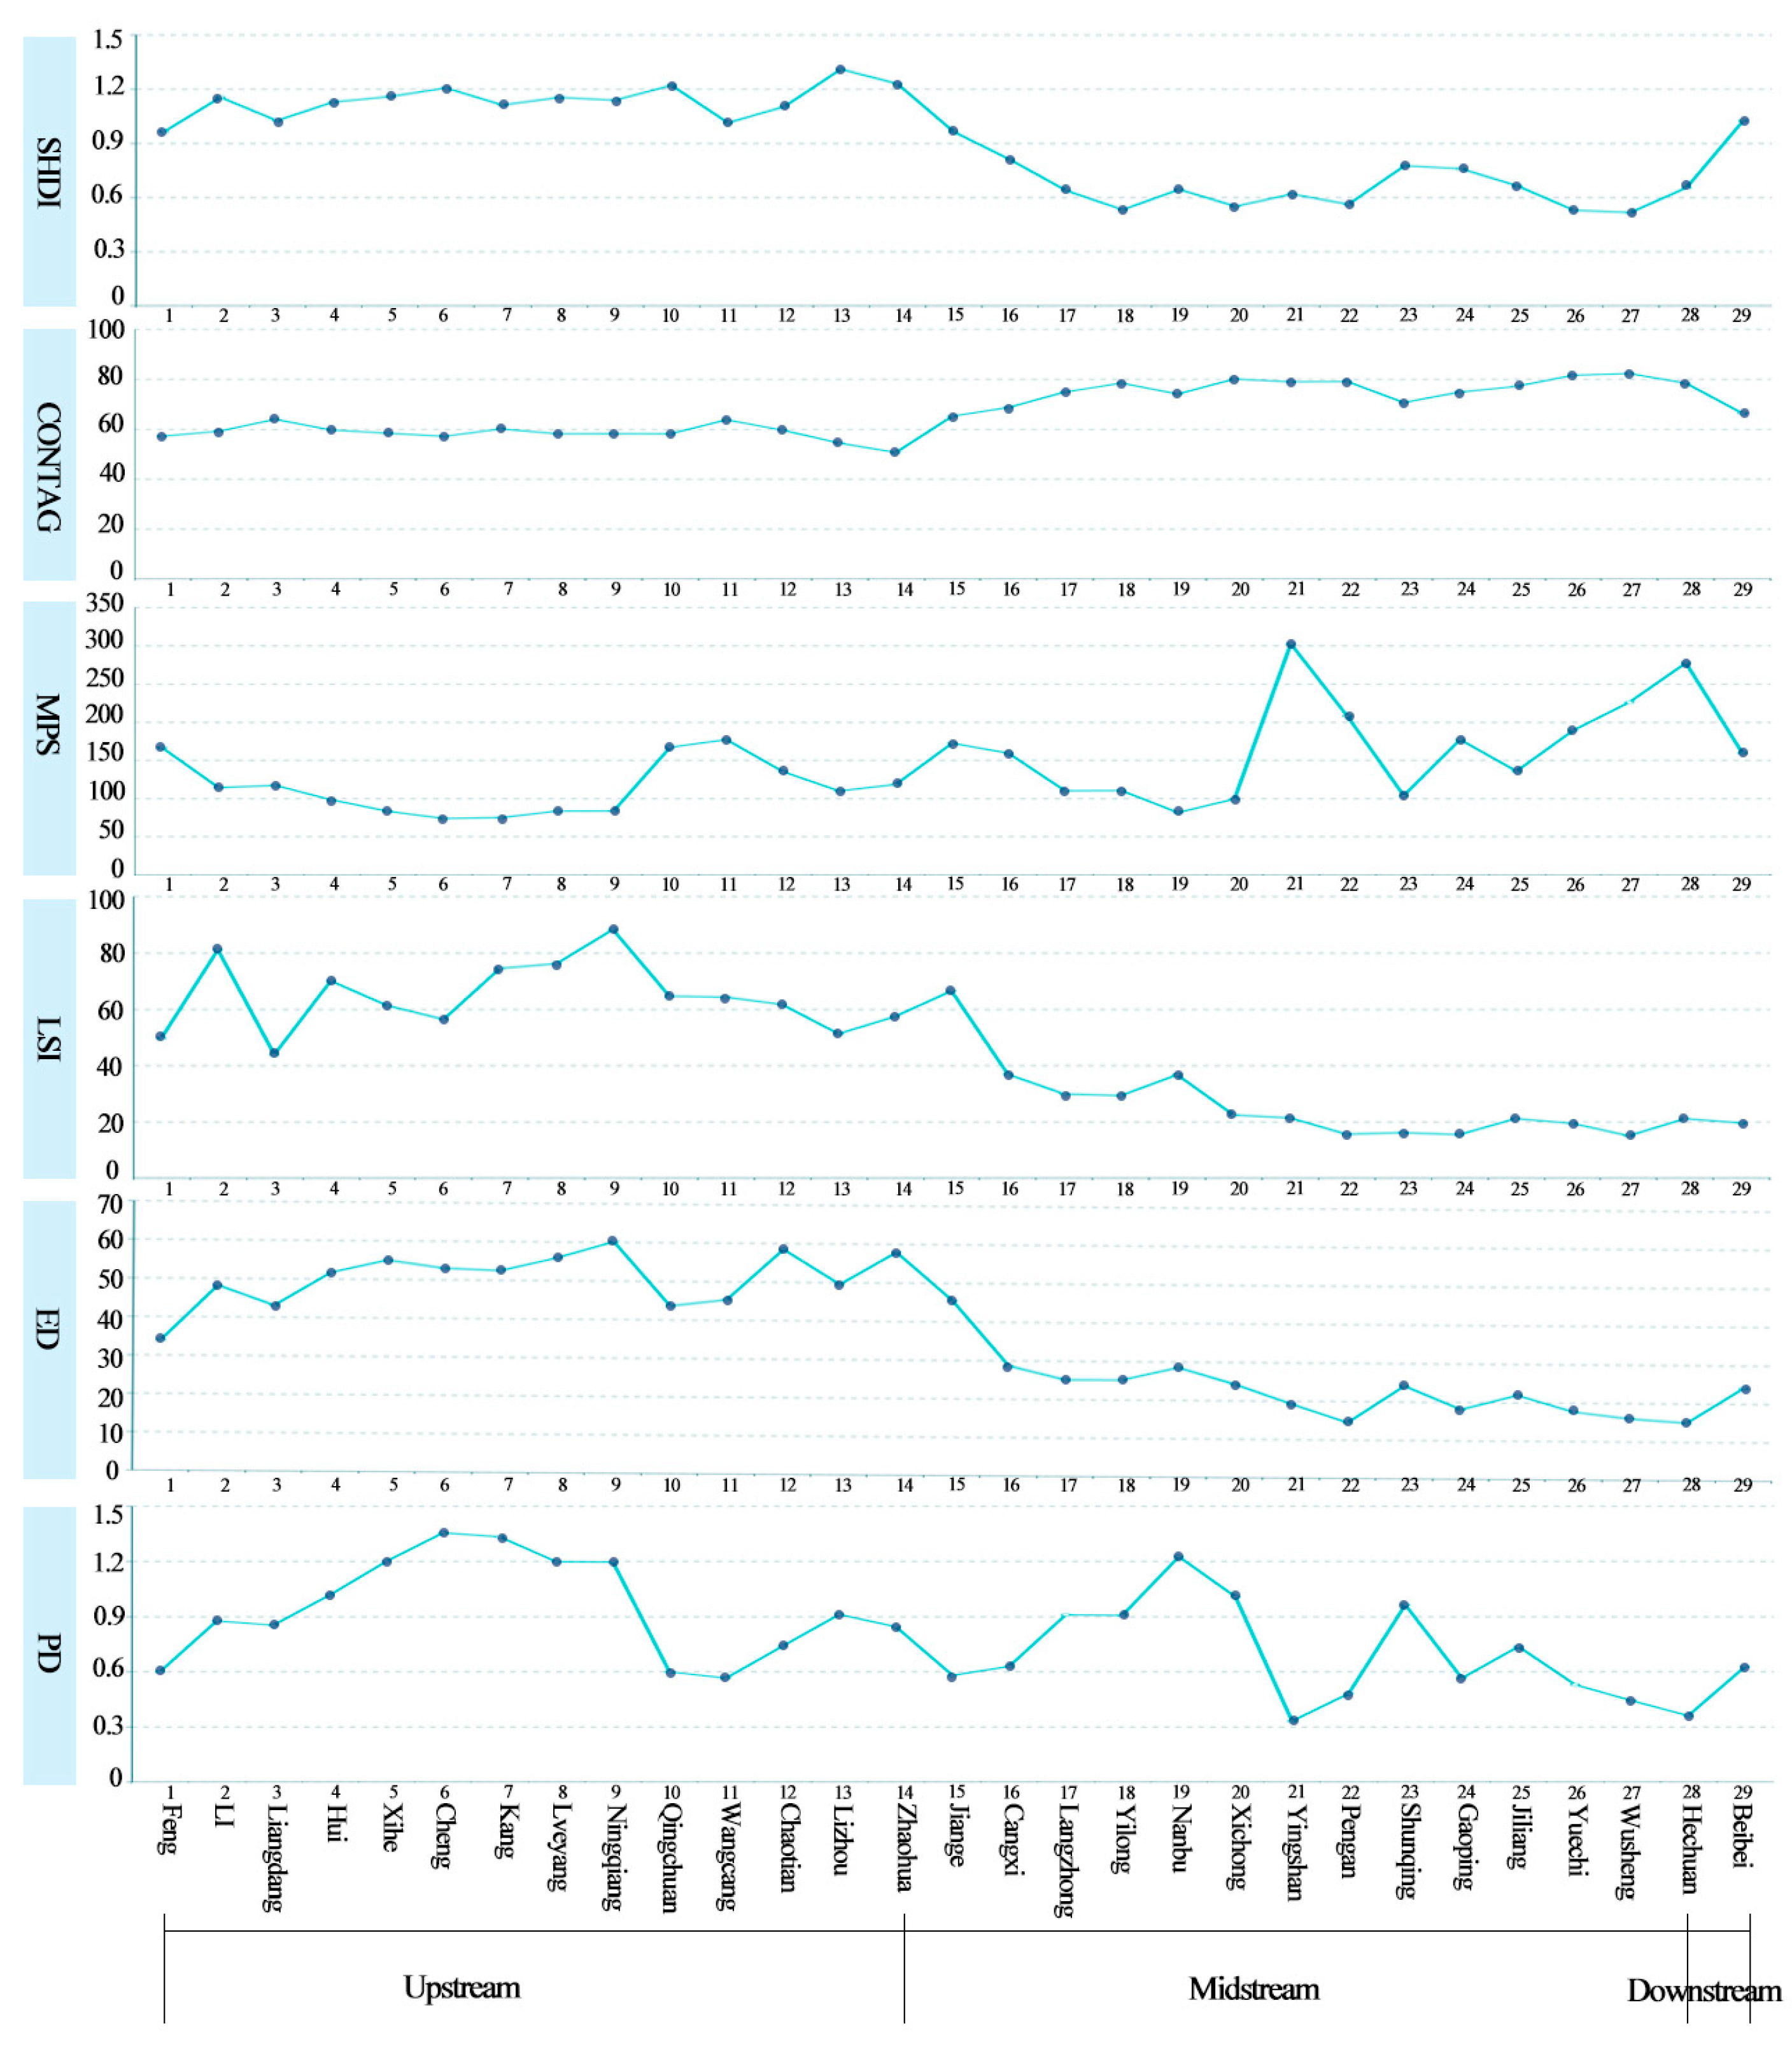
From the perspective of structural status (Figure 3), according to the landscape pattern analysis results, the counties in the Jialing River basin can be categorized into three types. The first type included Cheng County, Kang County, and so on. These counties had generally average landscape patterns, characterized by relatively high PD, LSI, ED, and SHDI indices, and relatively low MSP and CONGTAG indices. This indicated a high degree of patch fragmentation, high landscape heterogeneity, strong disturbance to GI, and low system stability. The second type included Wusheng County, Pengan County, and so on. These counties had better overall landscape patterns, characterized by relatively low PD, LSI, ED, and SHDI indices, and relatively high MSP and CONGTAG indices. This suggested large patch areas, low fragmentation, high aggregation of different patch types, low landscape heterogeneity, and high GI landscape cohesion. The third type included Feng County, Jiange County, Langzhong, and so on. These counties have good landscape patterns, with various indices falling between those of the first and second types.
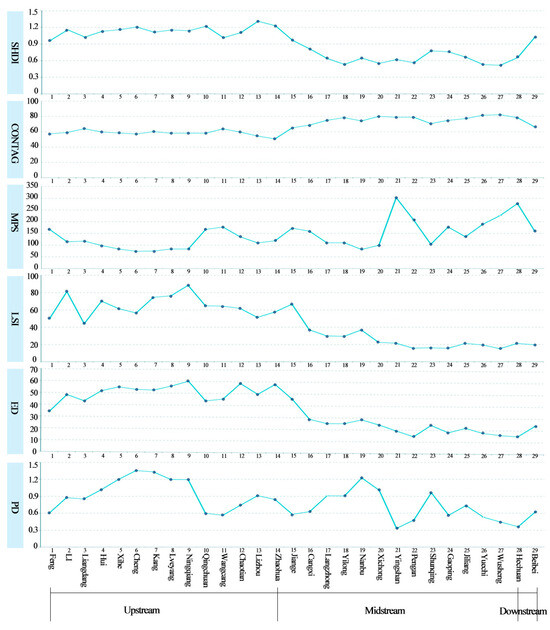
Figure 3.
GI structural status of counties in Jiangling River Basin.
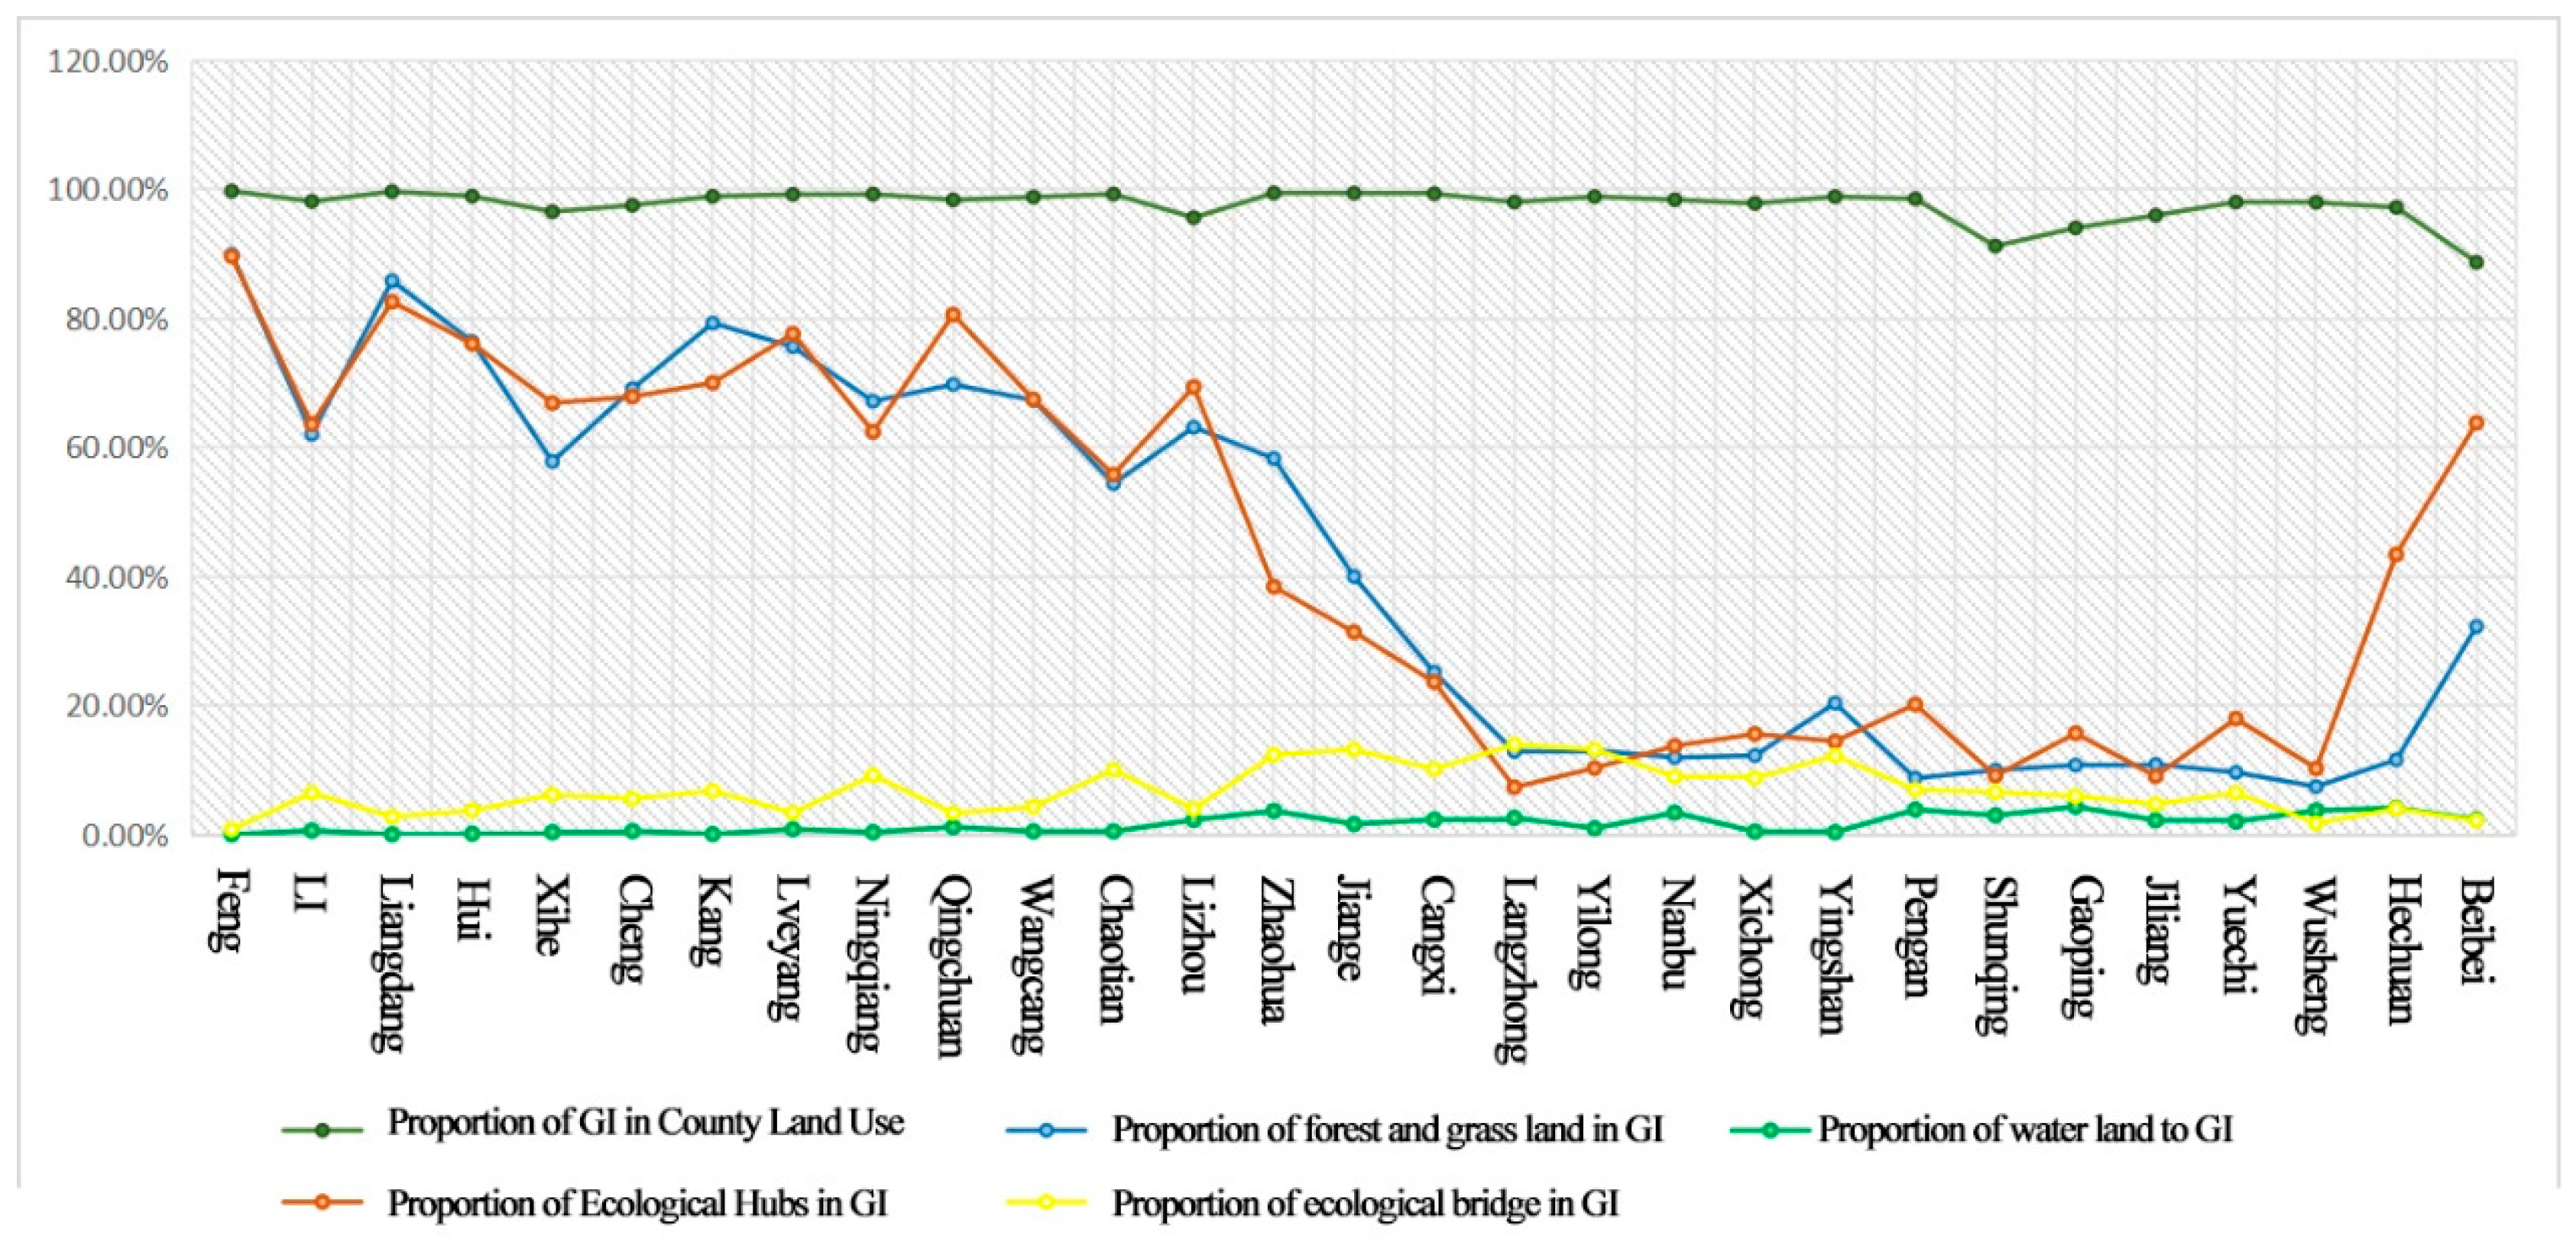
From the perspective of element composition (Figure 4 and Figure 5a,b), the proportions of forest, grass, and ecological core areas in GI varied significantly across counties, with clear distinctions between the upper, middle, and lower reaches. The indices for counties in the upper and lower reaches were generally higher than those in the middle reach. The proportion of GI in county land use, as well as the coverage of connectivity corridors and water areas, showed minimal variation from upstream to downstream, with only slight fluctuations. The counties in the upper reach were dominated by large-scale GI ecological cores and corridors, with counties such as Fengxian and Qingchuan exhibiting the most optimal GI composition. The middle reach, on the other hand, was characterized by smaller ecological cores, corridors, and isolated patches, with the central urban area of Nanchong and the counties of Wusheng and Yuechi in Guang’an facing a significant GI deficit compared to other regions. The lower reach, located in the eastern Sichuan parallel mountain–valley region, had better distribution of ecological cores and corridors than the middle reach, as exemplified by Beibei District.
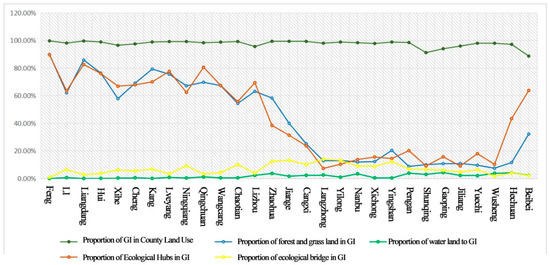
Figure 4.
GI element composition in Jiangling River Basin.

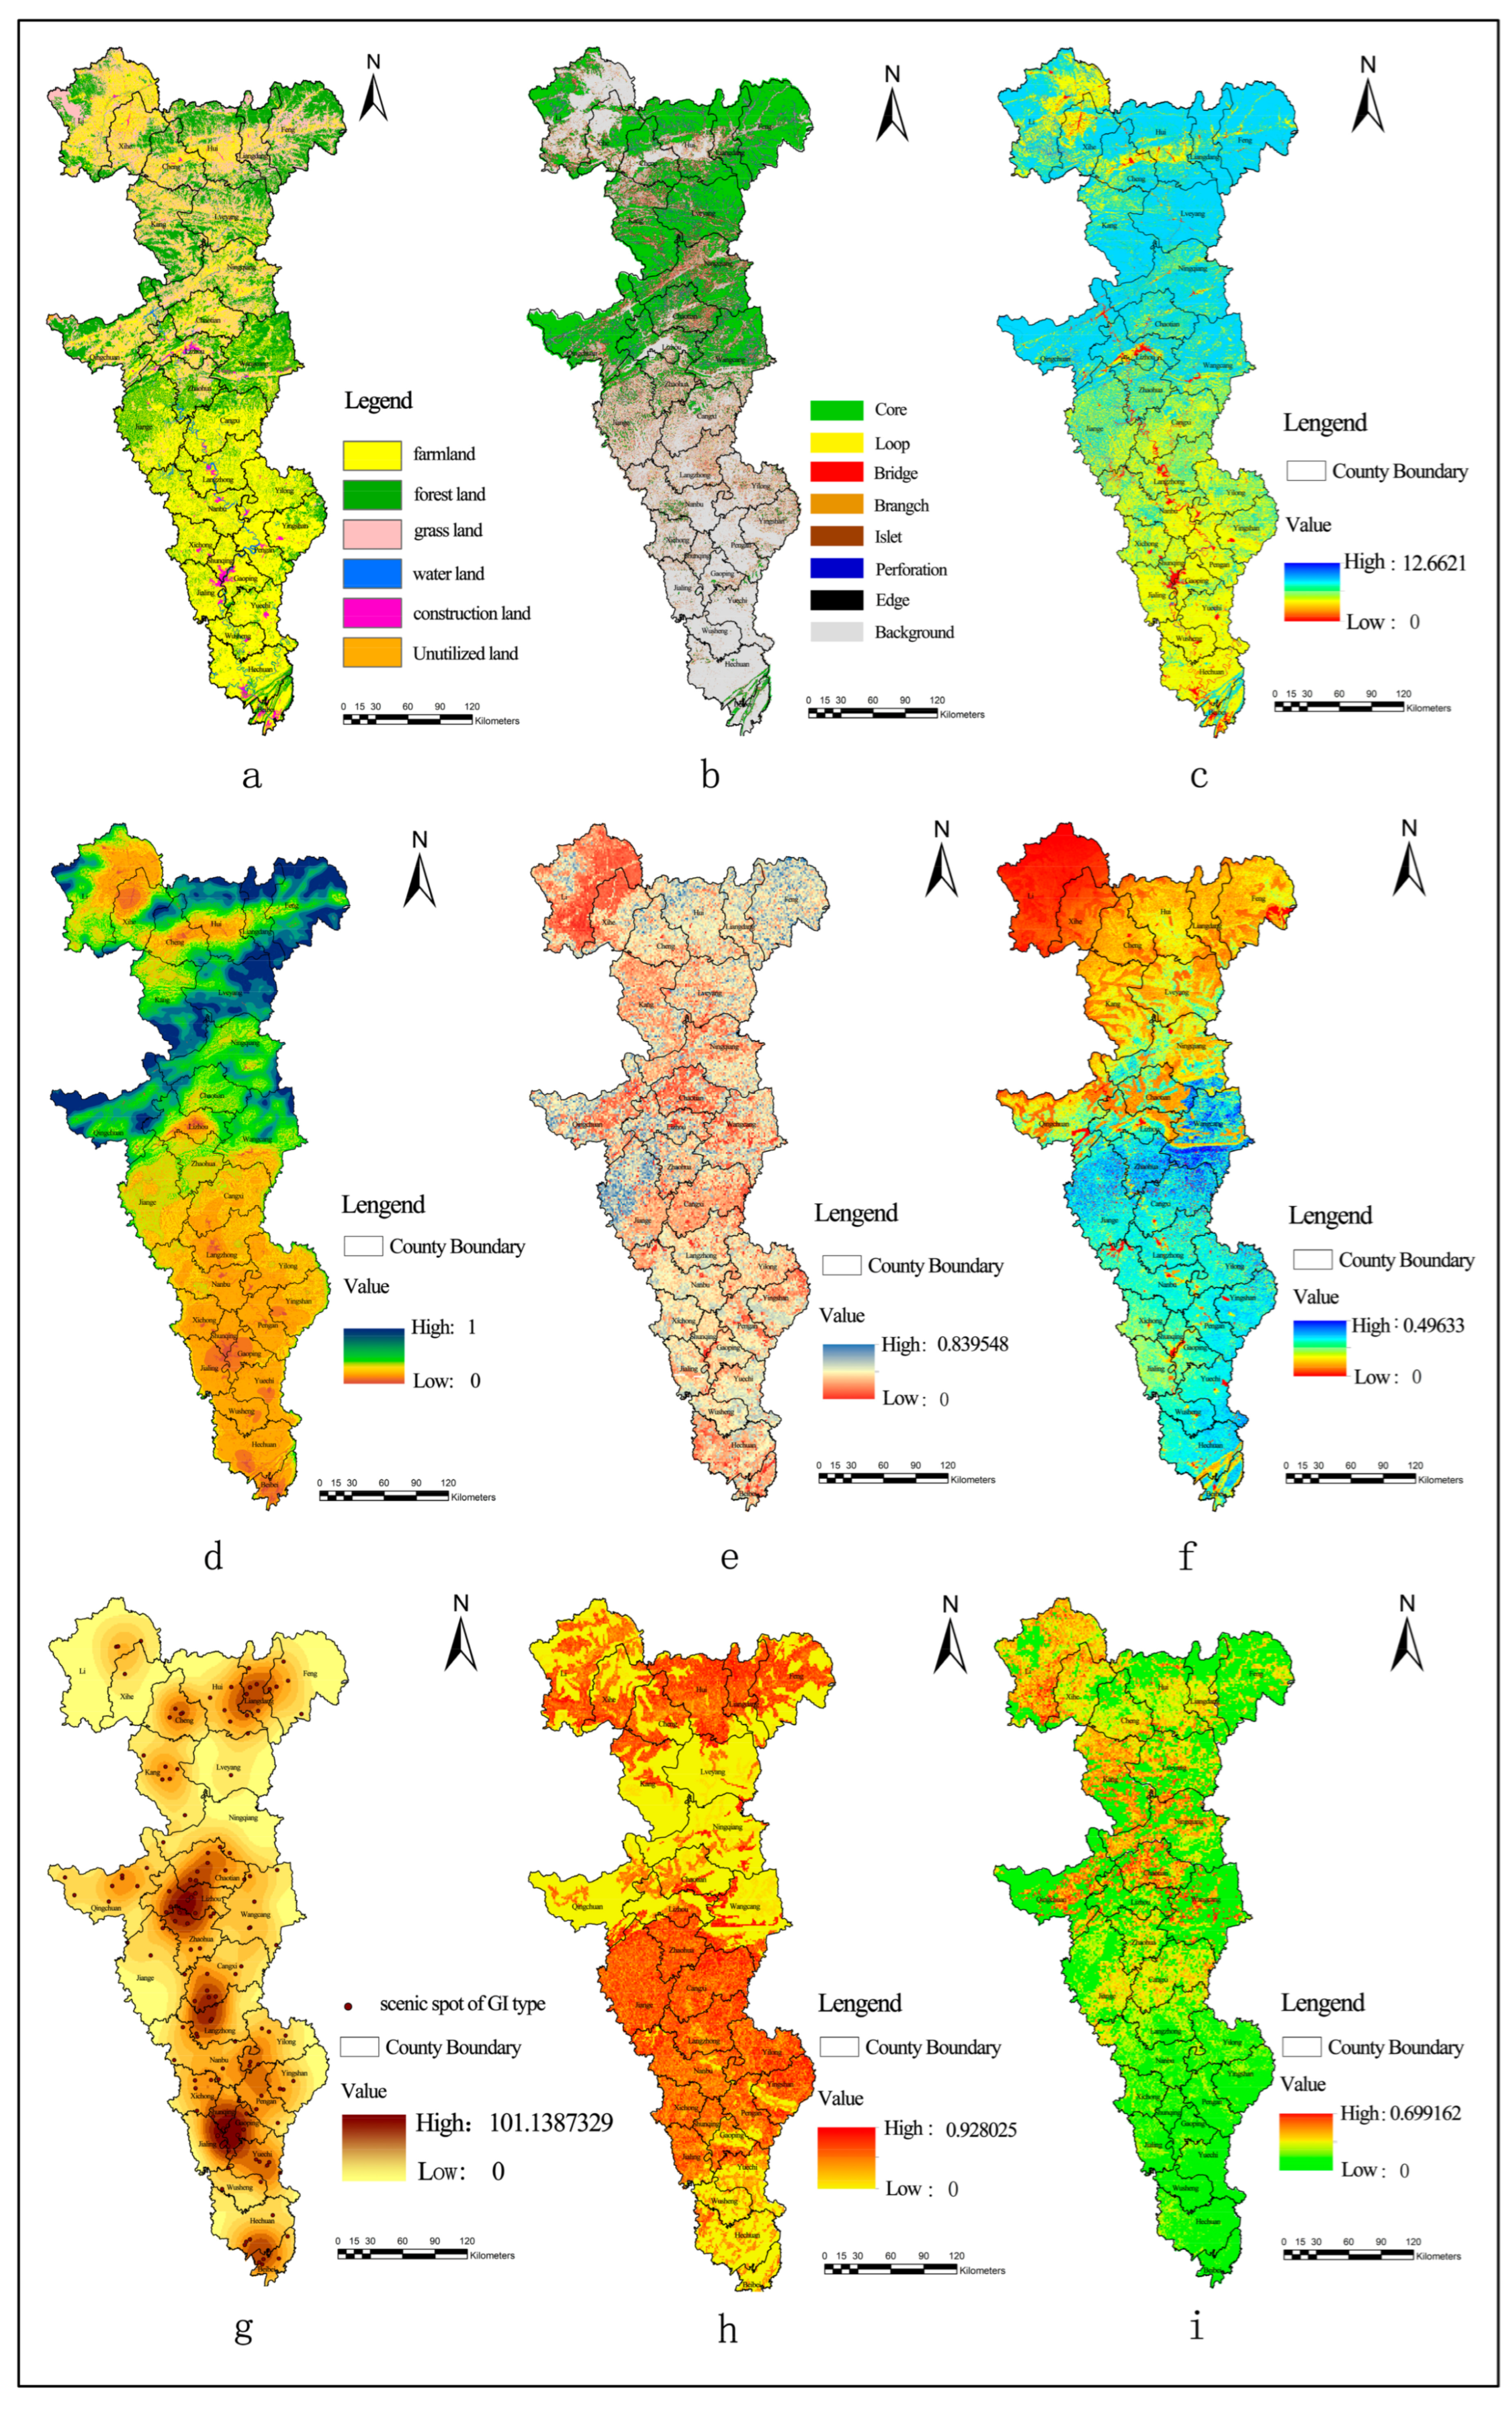
Figure 5.
(a) Land use; (b) MSPA result; (c) carbon sequestration; (d) habitat quality; (e) soil conservation; (f) water yield; (g) recreation; (h) rocky desertification; (i) soil erosion.
From the perspective of ecological services (Figure 5c–g), counties with a higher supply level of wate yield functions were mainly distributed in the central part of the basin. Overall, the middle and lower reaches were better than the upper reaches. Counties with a lower supply level of wate yield functions were mainly located within the Gansu Province section of the Jialing River basin. Regions with a better supply level of soil conservation functions were mainly distributed in the basin. The supply levels of carbon sequestration functions and habitat quality are negatively correlated with the level of urban and rural development, showing a trend of higher levels in the upper reaches and lower levels in the middle and lower reaches. Counties with better functional supply included Feng County and Qingchuan County, while counties with poorer functional supply included Shunqing District and Wusheng County. The supply of recreational functions was positively correlated with the historical and cultural heritage of the counties and the characteristics of the GI landscape. The upper and middle reaches of the Jialing River Basin are rich in cultural landscapes and historical relics, making them the regions with the highest level of GI recreational supply in the basin.
3.2. Evaluation Results of GI Demand Level Index in Counties of the Jialing Basin
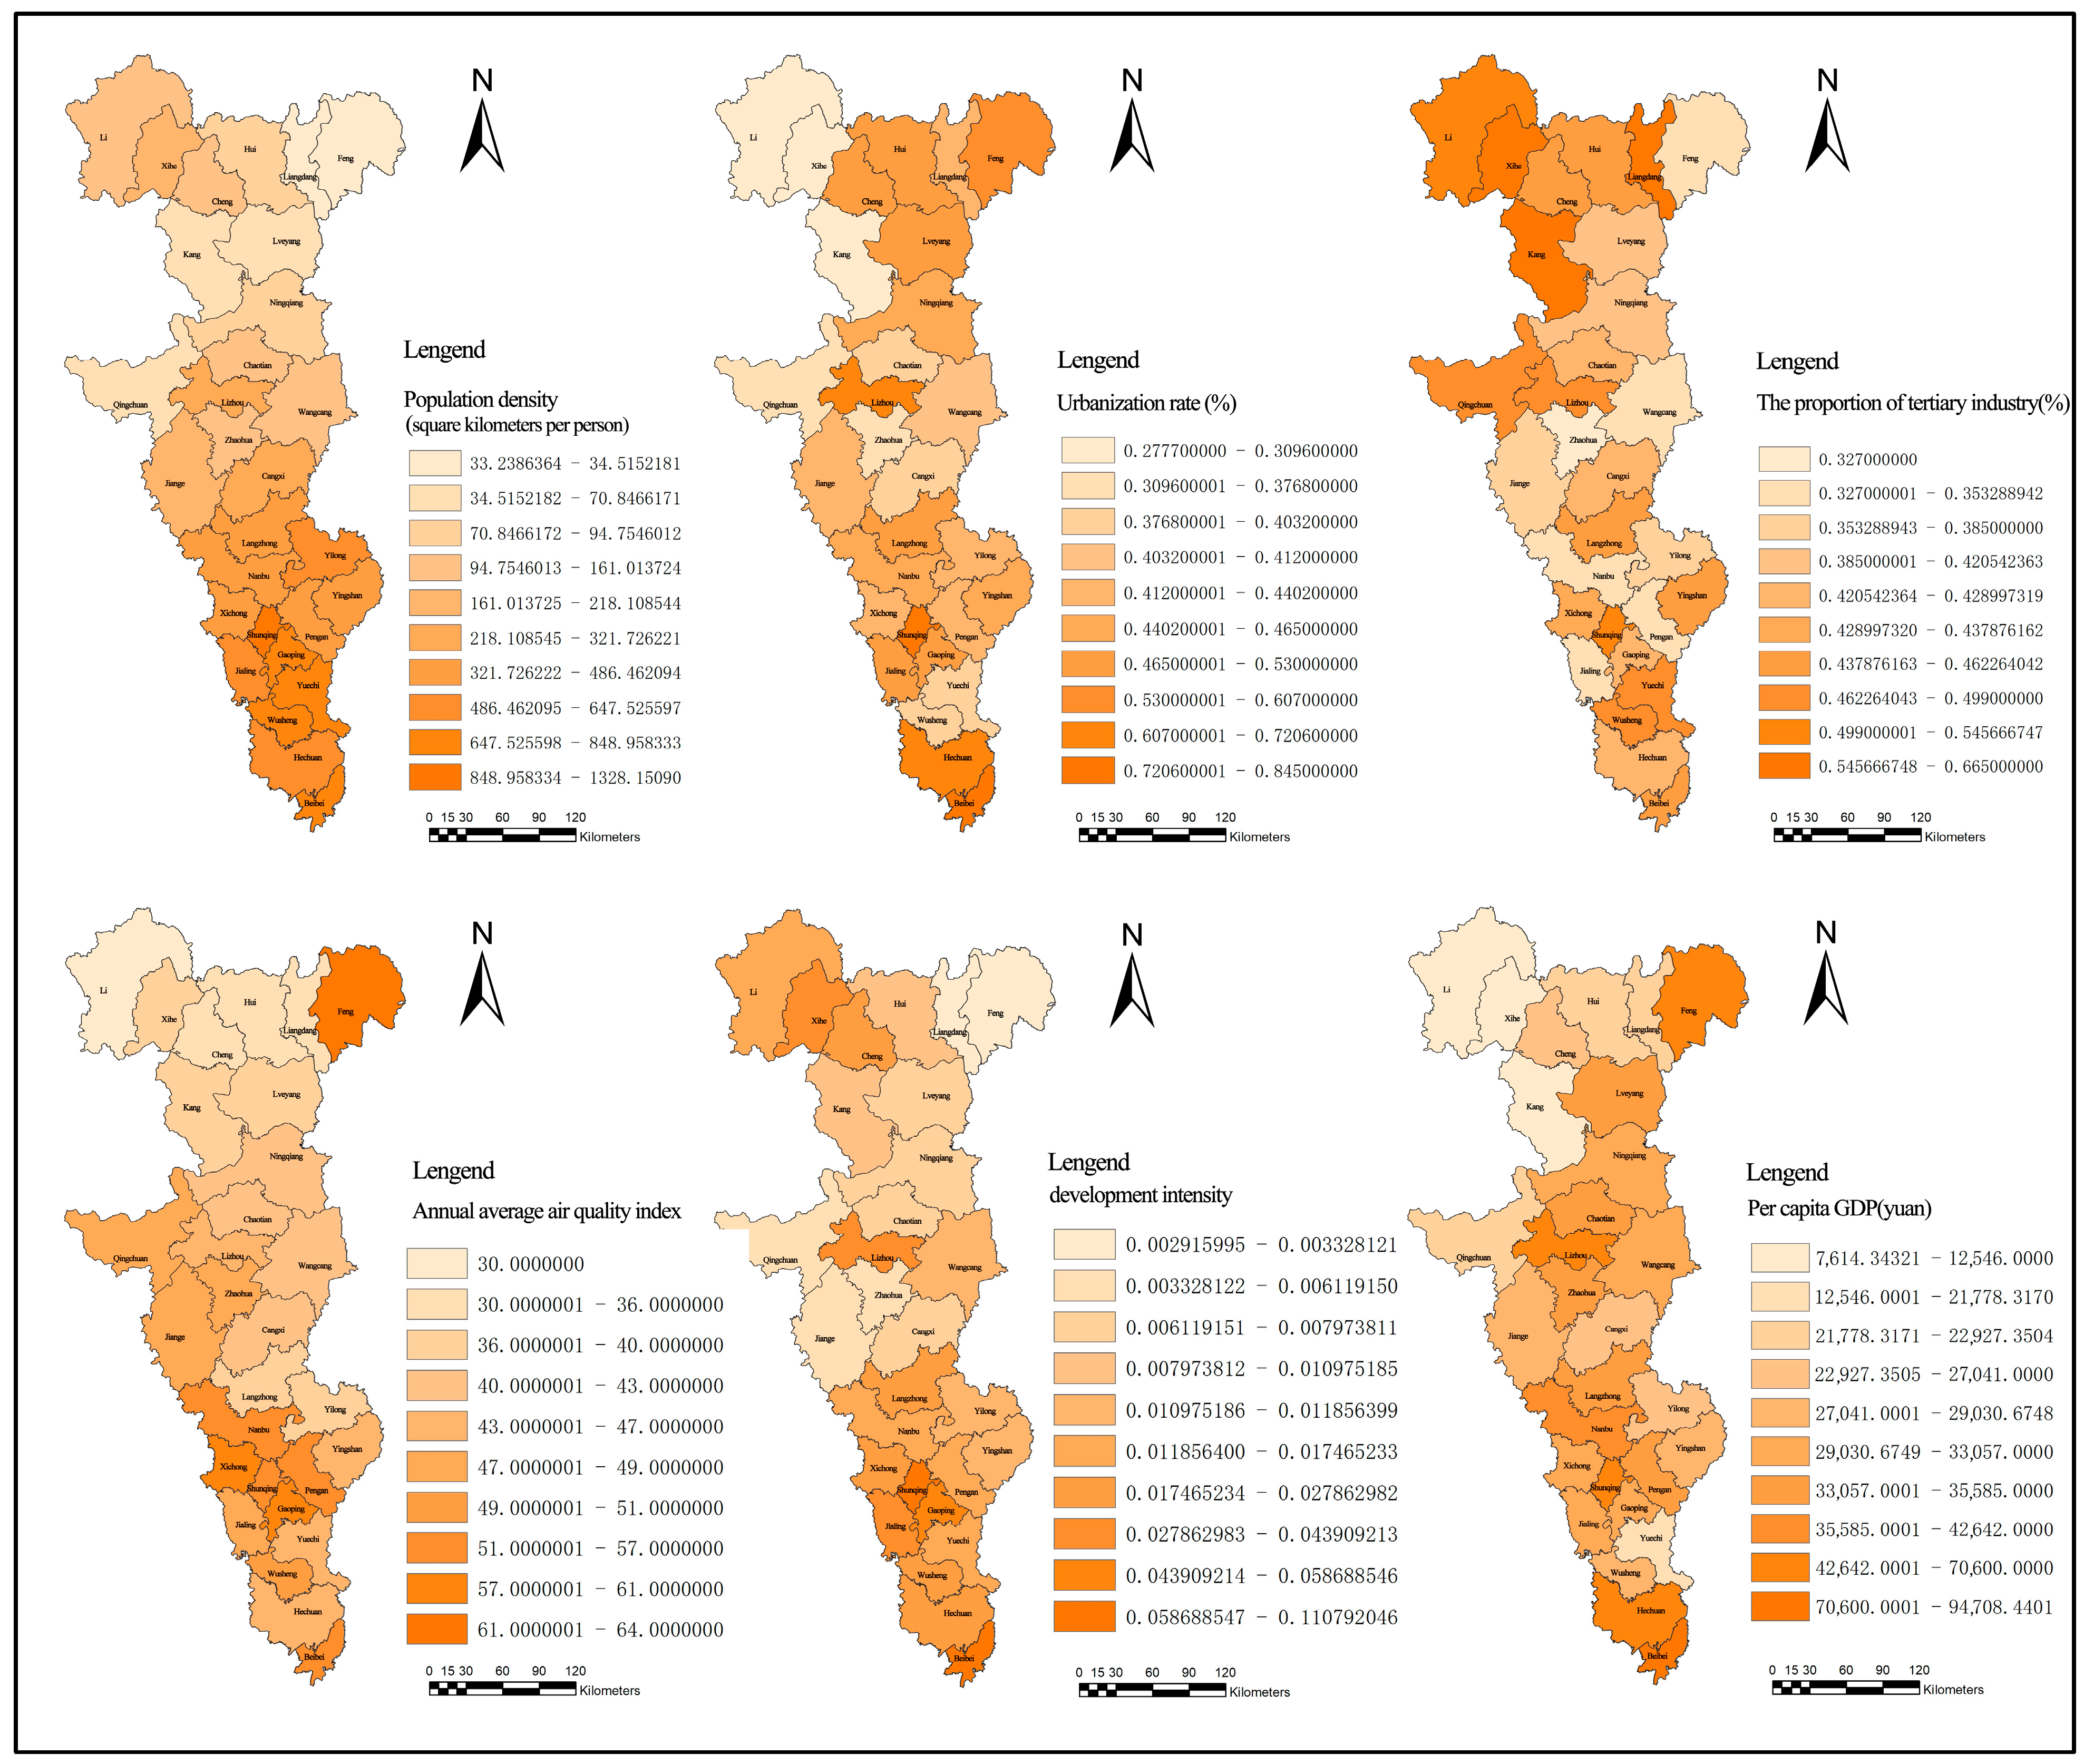
Evaluation results of GI demand indicators are shown in Figure 6. In terms of environmental pressure (Figure 5h,i), soil erosion exhibited significant upstream–downstream differentiation. The degree of soil erosion in upstream counties was generally higher than in the middle and lower reaches. Lixian County, Xihe County, Chaotian District, and Cangxi County were the areas within the study scope with severe soil erosion. The areas sensitive to rocky desertification were mainly located in the middle reaches, where agriculture was more developed, including Jiange County and Cangxi County. Counties with higher levels of air pollution were mainly found in areas with heating systems, developed industries, and dense populations, such as Fengxian County, Nanbu County, and Beibei District.
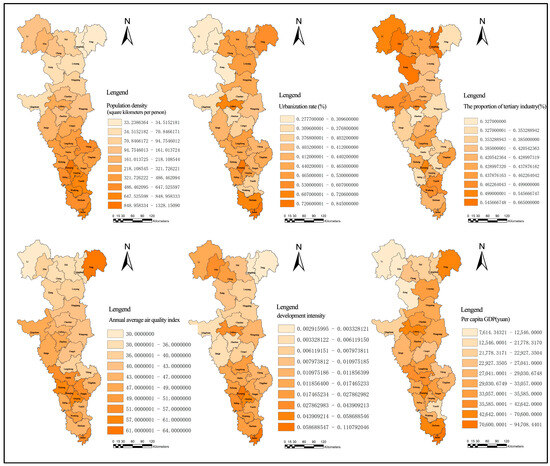
Figure 6.
GI demand indicators of counties in Jialing River basin.
In terms of urban and social development, land use intensity, population density, and urbanization rates were higher in urban areas, including Lizhou District, Shunqing District, and Beibei District. Counties with higher per capita GDP included Fengxian, Shunqing District, Hechuan District, and Beibei District. The proportion of the tertiary industry showed relatively small fluctuations across counties, with higher values observed in Lixian, Xihe County, Kangxian, and Shunqing District.
In summary, the threats and pressures faced by GI in the Jialing River Basin exhibited an uneven spatial distribution. The upstream region was characterized by smaller urban areas and a sparse population, while the middle and downstream regions experienced higher population densities and rapid urban land expansion. This led to a significant reduction in the proportion of forest, grassland, and water land uses in the middle and downstream regions, with landscape patches showing an increasing trend of fragmentation.
3.3. Analysis of Coupling Coordination Degree of GI Supply and Demand Matching Level in Basin Counties
Due to differences in economic strength, population density, and development intensity across counties in the Jialing River Basin, mismatches occurred between GI supply levels and ecological demand. Based on the above analysis, the quadrant-based mismatch typology and the coupling coordination degree model were applied to spatially match the comprehensive GI supply level with the social demand level. This approach classified the counties within the Jialing River Basin into four types of supply–demand matching categories. Additionally, the coupling coordination analysis further divided the coordination degrees into three major categories and five subcategories (Table 5). This classification provided a comprehensive spatial understanding of the ecological and socio-economic dynamics of the Jialing River Basin, offering valuable guidance for region-specific GI planning and management strategies.
Table 5.
Coupling coordination analysis of counties in Jialing River basin.
Based on the quadrant classification, the spatial matching pattern of GI supply and demand in the Jialing River Basin is illustrated in Figure 7, Figure 8 and Figure 9. The results revealed notable regional disparities in the supply–demand relationship:
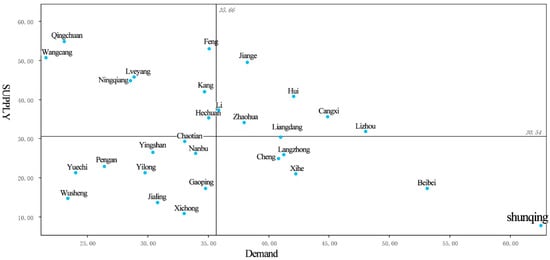
Figure 7.
GI supply and demand quadrant-based mismatch analysis of counties in Jialing River basin.
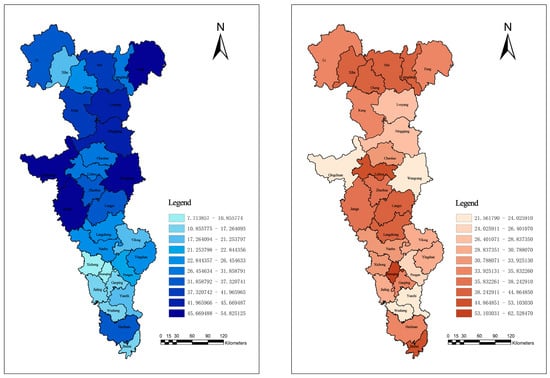
Figure 8.
GI supply index (left) and demand index (right) of counties in Jialing River Basin.

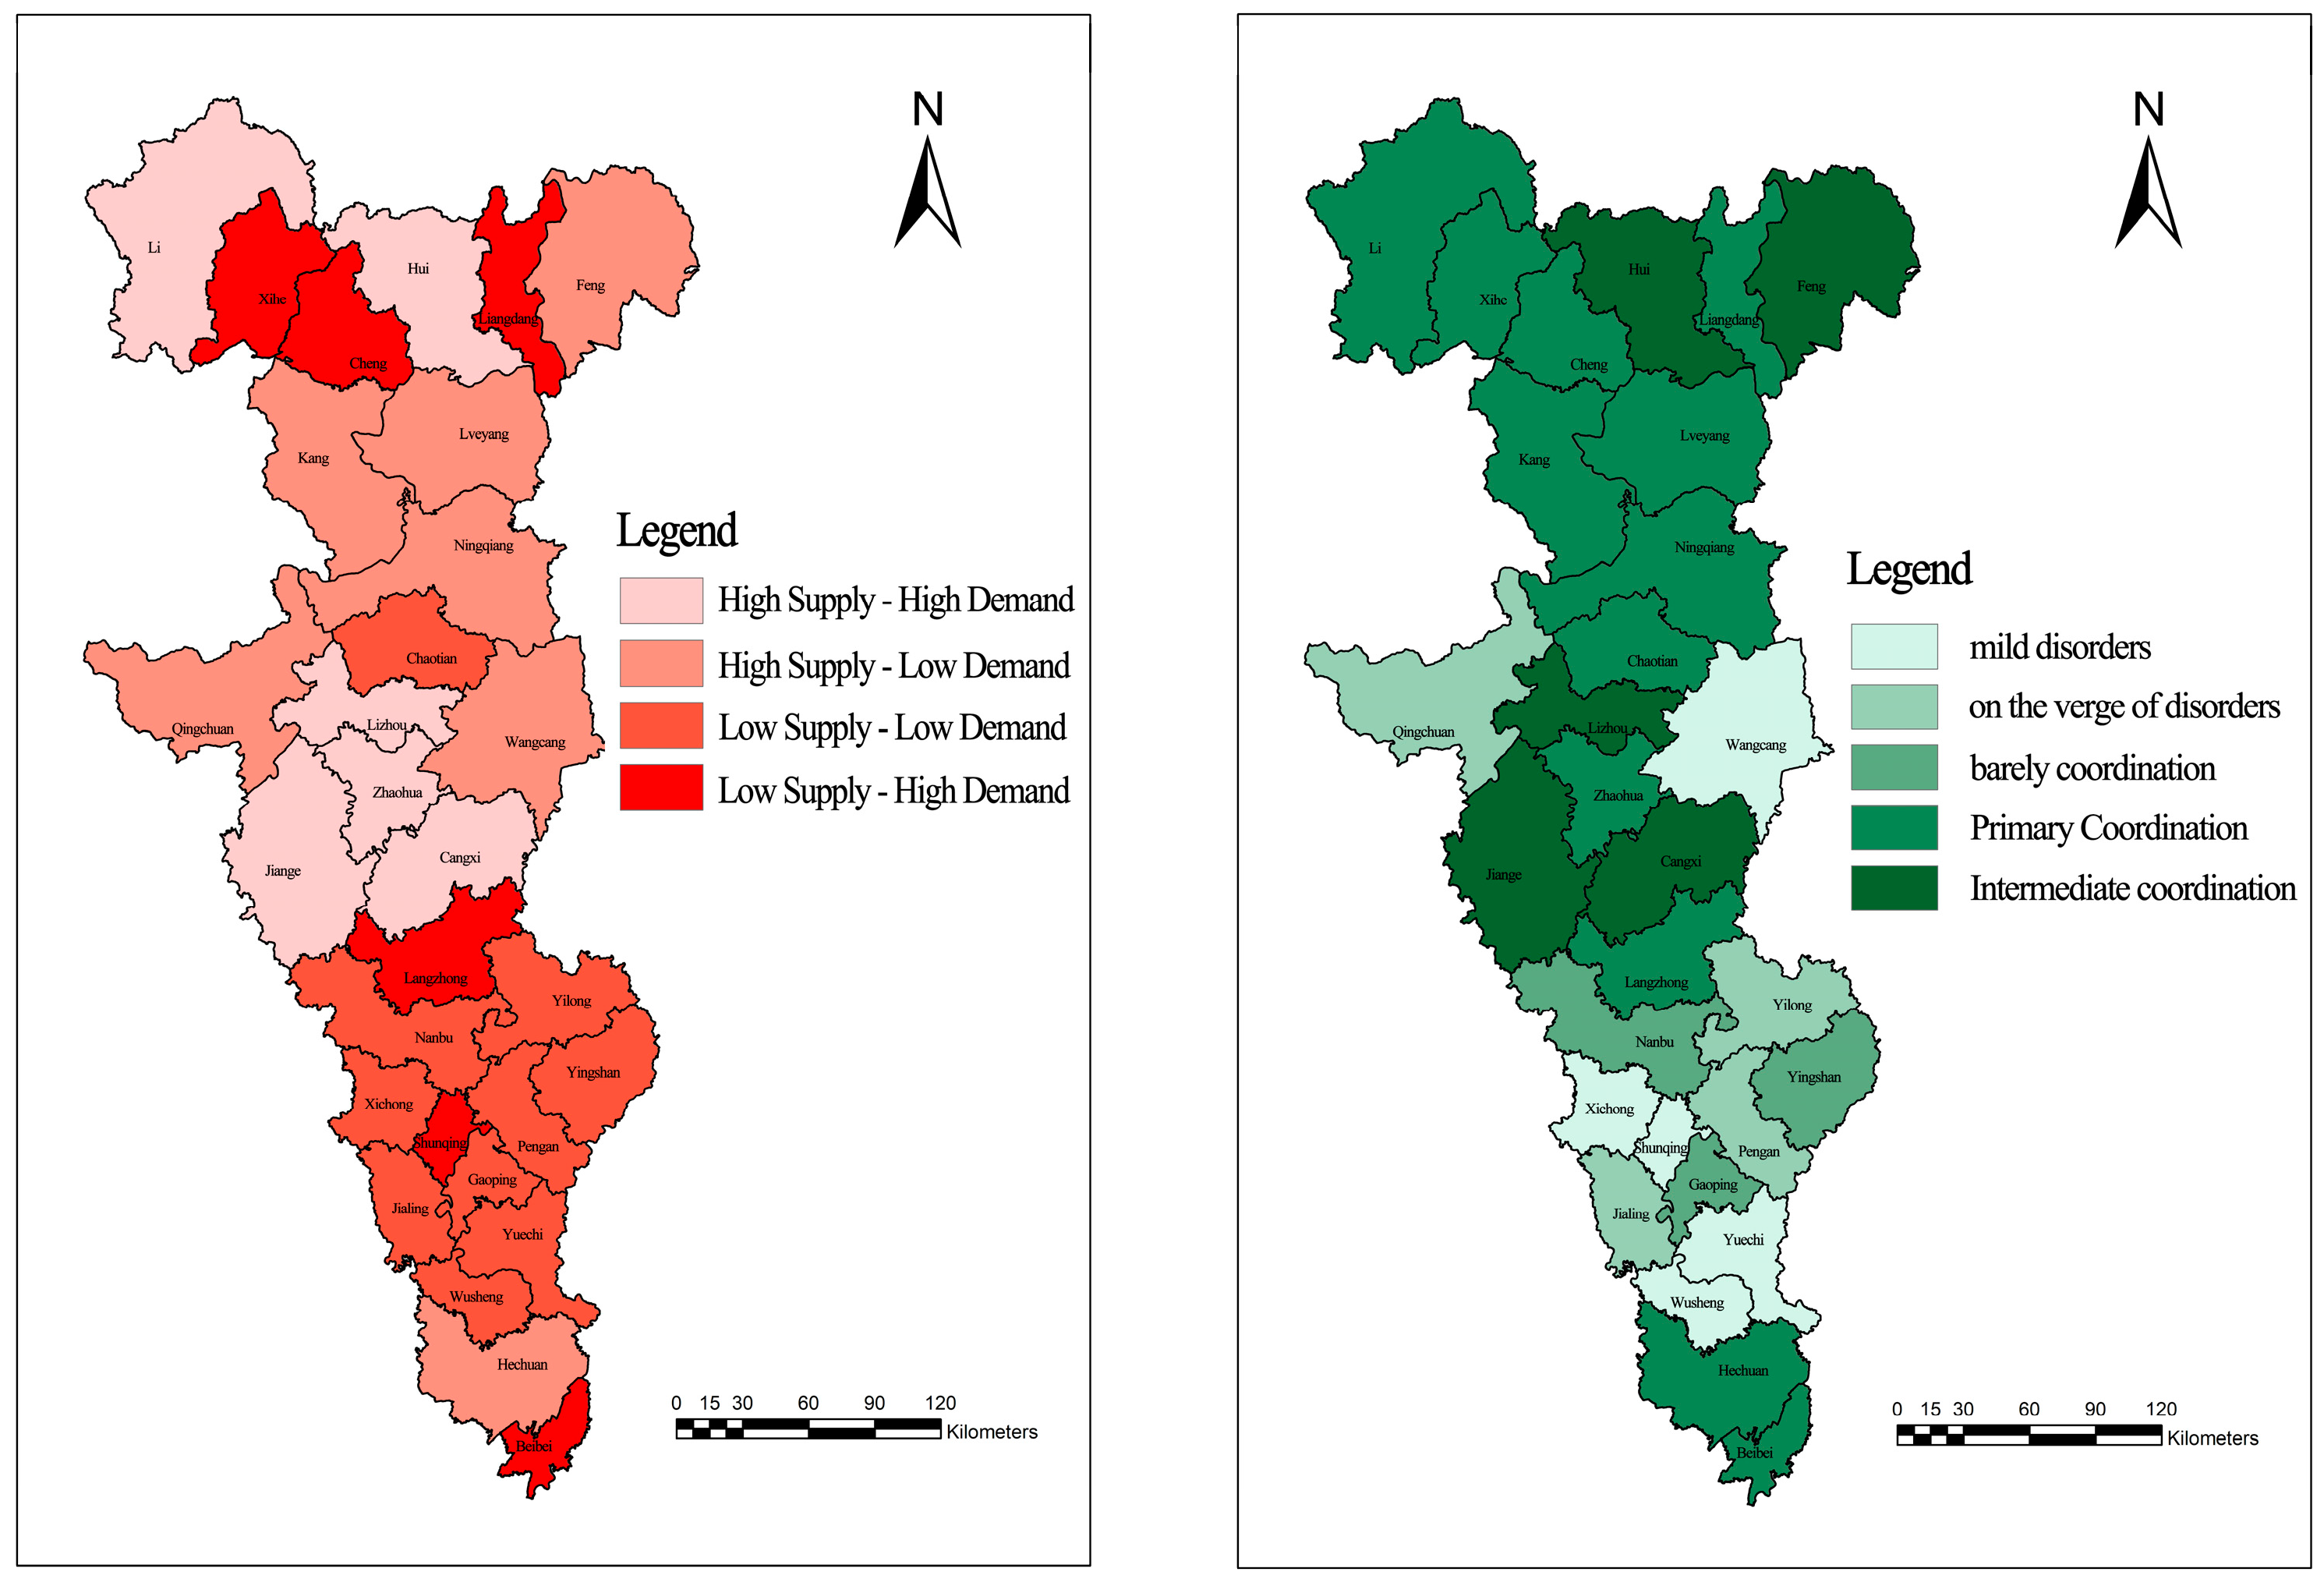
Figure 9.
(left): GI supply and demand matching spatial distribution; (right): GI coupling coordination stage spatial distribution.
- Supply-Deficit Type: This category included upstream counties such as Liangdang, Xihe, and Chengxian, as well as midstream and downstream counties like Langzhong, Shunqing, and Beibei. These areas exhibited high urbanization levels and advanced economic development but suffered from inadequate GI quality, making it challenging to meet ecological demand. These regions were identified as priority areas for urgent GI optimization and enhancement.
- Supply-Surplus Type: This type was primarily distributed in the upper reaches of the Jialing River Basin, including counties such as Fengxian and Qingchuan. These areas exhibited relatively low urban development levels but high GI quality, making them critical regions for ecological conservation and GI preservation.
- High-Level Balanced Type: This type was concentrated around Guangyuan City in Sichuan Province, where the GI supply–demand relationship was relatively stable. However, ecological performance needed further improvement to sustain long-term environmental stability.
- Low-Level Balanced Type: This type was mainly distributed in the agricultural production areas of the middle reaches of the basin. These counties demonstrated moderate GI supply and demand levels, requiring enhanced GI supply to address future socio-economic and environmental demands.
The overall GI supply–demand coordination degree in the Jialing River Basin exhibited a preliminary coordination state (Figure 9). Coordinated regions were primarily located in the upstream and downstream areas, particularly along the southern slopes of the Qinling Mountains and the Jianmen Mountain region, reflecting a relatively stable and sustainable GI supply–demand relationship. In contrast, transitional and imbalanced regions were concentrated in the middle reaches of the Jialing River Basin. These included densely populated and socio-economically developed counties such as Shunqing and Wusheng in the eastern Sichuan hilly plain, where demand significantly exceeded supply. Additionally, sparsely populated upstream mountainous and ecological functional zones, such as Qingchuan and Wangcang counties, also experienced imbalances due to low population density and extensive ecological land cover, resulting in a mismatch between ecological supply and social demand.
4. Discussion: Determination of GI Optimization Zoning and Formulation of Improvement Strategies in the Jialing River Basin
Based on the above analysis and considering the geographic, climatic, and socio-economic heterogeneity of the Jialing River Basin, the study area was divided into five optimization zones at the county level, focusing on GI restoration, conservation, and monitoring. Priority measures were implemented in GI network restoration and rehabilitation zones, where proactive ecological restoration policies were adopted to expand GI coverage, optimize spatial configurations, and enhance functional performance. For management and conservation zones, stricter protection and control measures were enacted to mitigate further ecological degradation. In enhancement zones, long-term dynamic monitoring systems were established to enable real-time adjustments to ecological strategies (Figure 10).
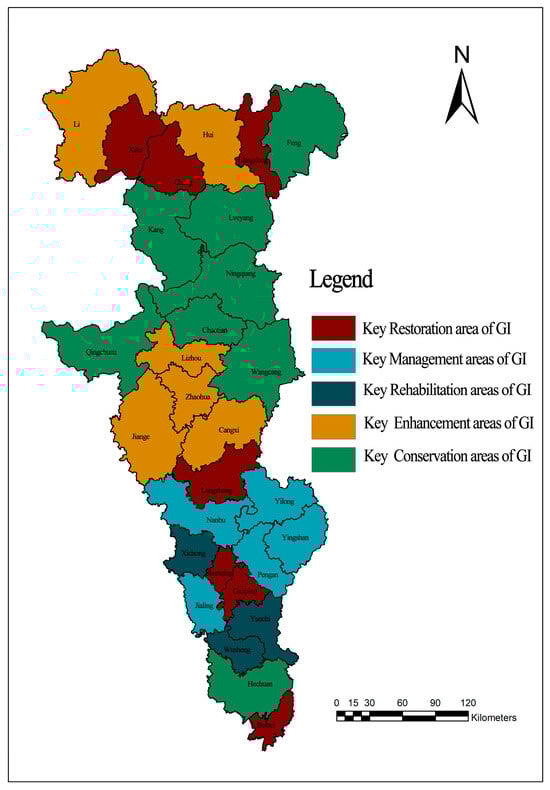
Figure 10.
GI optimization regionalization.
4.1. Key GI Network Restoration Area
The key GI network restoration area refers to counties with supply-deficit GI types (low supply–high demand). These areas have relatively low GI coverage, fragmented structures, and limited functional service efficiency. The overall GI supply capacity in these regions cannot meet the demands of regional development, resulting in significant supply–demand tensions that require prioritized optimization measures.
Spatially, these areas in the Jialing River Basin show a discontinuous distribution, highlighting the complexity of the GI supply–demand relationship. They include the Hui-cheng and Xi-li Basin areas (Xihe, Cheng, and Liangdang County), located at the intersection of the southern slopes of the Qinling Mountains and the eastern extension of the Minshan Mountain Range. These regions are core agricultural and pastoral development zones in the upper Jialing River Basin, also prone to severe soil erosion. Additionally, midstream and downstream areas characterized by low mountainous and hilly terrain with high urbanization, socio-economic development, and dense populations (Langzhong County, Shunqing District, Gaoping District, and Beibei District) are also included.
Given the social development demands, population pressure, and the necessity of maintaining the national farmland protection baseline to ensure food security, large-scale expansion of ecological sources in these areas is limited. Therefore, efforts should focus on restoring the spatial network of sources and corridors to enhance ecosystem service performance [65] (Figure 11).

Figure 11.
Restoring the spatial network of sources and corridors.
First, the identification of GI core patches and strategic points should be strengthened, alongside the planning and construction of corridor networks. Damaged core patches should be restored, and degraded ecosystems with lost self-regeneration capabilities should be reconstructed. Ecological corridor networks linking terrestrial and aquatic systems should be maintained, and corridors fragmented by transportation infrastructure and urban development should be restored. Second, given the small and scattered forest-grass patches, the potential for integration between patches should be fully considered. Efforts should be made to enhance cultural and recreational tourism systems. Finally, in areas with slopes less than 25°, terracing should be implemented. Based on landscape types and their effects on slope runoff and soil erosion, landscape types in inter-slope areas should be gradually diversified to increase ecological resilience and overall landscape functionality.
4.2. Key GI Network Management Zones
The key GI network management area refers to counties in a low-level balance or transitional stage of GI supply and demand. These areas are characterized by limited GI coverage and low functional service quality. They are mainly distributed in the middle reaches of the Jialing River Basin, along the southern edge of the Micang Mountains and the transitional zone between the low mountains and hills of central Sichuan. The landscape is dominated by low mountains and hills, with agricultural land being the primary land use. This area serves as a major agricultural production base in eastern Sichuan, including Yilong County, Yingshan County, Nanbu County, Peng’an County, and Jialing District.
Management strategies should prioritize the strict protection of existing GI core patches and corridors, especially critical ecological areas such as water sources, wildlife habitats, and wetland reserves, to prevent agricultural expansion from encroaching on the GI network. Engineering measures such as terracing should be implemented to restore natural vegetation, including trees, shrubs, and grasses, thereby enhancing ecological functions. Industrial and mining enterprises should be strictly regulated, while urban and rural development should be guided toward intensive and efficient land use. Environmental quality baselines and upper limits for resource utilization should be enforced as binding constraints to maintain ecological integrity.
4.3. Key GI Network Rehabilitation Zones
The key GI network rehabilitation area refers to counties experiencing low-level balance or imbalanced stages of GI supply and demand. These counties are primarily located in the middle reaches of the Jialing River Basin, within the hilly areas of the eastern Sichuan Basin. The region features relatively flat terrain, a dense river network, and agriculture as the dominant industry, while its socio-economic development remains relatively underdeveloped. Representative counties include Xichong County, Yuechi County, and Wusheng County. The primary objective for this area is GI network rehabilitation. Key measures should include establishing field shelterbelts and riparian buffer zones to control soil erosion on sloping farmland and mitigate rocky desertification. Ecologically sensitive patches with high restoration potential should be prioritized for targeted management. Specific actions should include reforestation through mountain closure, land remediation projects, and strengthening the recovery of natural vegetation to maintain ecosystem integrity and enhance ecological resilience.
4.4. Key GI Network Enhancement Zones
The key GI network enhancement area refers to counties in a high-level balance and coordinated stage of GI supply and demand. These areas are characterized by a strong ecological foundation, high forest coverage, and extensive river and reservoir areas. At the same time, they exhibit high levels of urban-rural development, socio-economic progress, and relatively high population density. This area is mainly distributed in the middle reaches of the Jialing River Basin, covering the Jianmen and Dalan mountain ranges in northern Sichuan (including Lizhou District, Zhaohua District, Jiange County, and Cangxi County), as well as the Hui-cheng and Li-cheng Basins in the upper reaches (including Lixian and Huixian Counties).
Although GI supply and demand are relatively balanced in these regions, future social development may cause potential imbalances. Therefore, the core strategy for this area is enhancement. On the basis of ecological protection, efforts should be made to optimize the composition and functionality of existing GI elements. Ecological technologies should be applied to strengthen the resilience of forest, grassland, and water patches against environmental disturbances, ensuring ecological integrity and improving ecological network connectivity and habitat quality. Additionally, the construction of tourism attractions, scenic spots, and greenway recreation systems should be strengthened to maximize GI’s cultural and ecological service functions, aligning with increasing socio-economic and cultural demands. Land development should be strictly regulated through zoning-based conservation policies to prevent uncontrolled urban expansion and avoid large-scale development projects that could disrupt the original ecosystem.
4.5. Key GI Network Conservation Zones
The key GI network conservation area includes counties classified as supply-surplus regions. These areas have a well-preserved ecological environment with high vegetation coverage, serving as important water source conservation zones and biodiversity protection areas. They function as critical ecological barriers in the upper and middle reaches of the Jialing River Basin. Due to low population density and urbanization rates, the demand for ecosystem services is minimal. This area mainly covers the southern slopes of the Qinling Mountains, the Bashan Mountain Range, the Micang Mountains, and the Longmen Mountain Range, including Feng County, Lueyang County, Qingchuan County, and Wangcang County.
The primary strategy for this area is ecological conservation and the maintenance of ecosystem service functions. Measures such as mountain closure for reforestation and strict ecological protection should be implemented to minimize anthropogenic disturbances. Based on current conditions and development needs, farmland should be converted back to forests and grasslands. An ecological zoning system should be established to identify critical GI conservation areas, accompanied by graded protection strategies to prevent network fragmentation caused by development activities. Ecological filtering and buffer functions at the edges of GI source areas should be strengthened. For example, wetlands should be established in wildfire-prone areas, while firebreaks should be constructed in downwind zones to reduce the impact of natural disasters.
5. Conclusions and Prospect
Against the backdrop of China’s ecological environmental protection not yet being fully decoupled from economic development, GI (Green Infrastructure) serves as a tool for achieving green development and smart growth. It has significant application value and academic importance in territorial spatial planning, as it can reveal the supporting capacity of GI in enhancing the quality of basin ecological service functions and maintaining basin ecological security, as well as the pathways for optimization and regulation. This study focuses on exploring the methods of matching GI supply and demand at the basin scale, constructing a GI supply indicator system from three dimensions: element composition, structural status, and functional services, and a GI demand indicator system from three economic dimensions. By analyzing the matching relationships and coupling degrees of GI supply and demand levels in various counties within the basin, the study proposes targeted adjustments to the GI network structure, providing a reference for ecological zoning management and the formulation of ecological compensation policies in basin territorial spatial planning. The main conclusions of the study are as follows:
The spatial distribution pattern of GI supply and demand in the Jialing River Basin exhibits significant heterogeneity. Areas with high GI supply are primarily located in the upper reaches of the basin, covering the southern slopes of the Qinling Mountains, the Bashan Mountains, the Micang Mountains, and the Longmen Mountain Range. In contrast, areas with high GI demand are mainly concentrated in intermontane basins in the upper reaches and in counties with higher urbanization rates, better transportation infrastructure, and more advanced socio-economic development in the middle and lower reaches.
The spatial matching of GI supply and demand can be classified into four types: high-level balanced type (high supply–high demand), supply-surplus type (high supply–low demand), low-level balanced type (low supply–low demand), and supply-deficit type (low supply–high demand). The overall coupling coordination degree of GI supply and demand in the counties of the Jialing River Basin is at a preliminary coordination stage, indicating the need for further optimization to improve the adaptability between GI supply and demand systems.
In terms of GI network optimization strategies, different approaches should be adopted based on specific spatial matching types: supply-deficit type (low supply–high demand): focus on restoration, emphasizing comprehensive improvement and network integrity enhancement. High-level balanced type (high supply–high demand): focus on enhancement, prioritizing the strengthening of ecological functions. Low-level balanced type (low supply–low demand): focus on management and control, emphasizing ecological remediation and restoration. Supply-surplus type (high supply–low demand): focus on conservation, prioritizing ecological preservation and protection.
The research framework and indicator system proposed in this study are applicable to watershed human settlements characterized by high urbanization rates and fragile ecosystems, particularly in regions prone to soil erosion and rocky desertification. To ensure the sustainability of forest ecosystems and socio-economic development within the basin, it is imperative to formulate targeted and efficient GI governance policies based on supply–demand matching. The supply–demand assessment and matching methodology constitutes an open research framework, allowing for the integration of new informational layers from diversified perspectives, such as GI network resilience and cultural ecosystem service metrics. Future research should integrate interdisciplinary approaches to deepen the theoretical understanding of GI supply–demand linkages, strengthen multi-scale analyses, and incorporate temporal dynamics. Additionally, as the study area spans multiple administrative jurisdictions, further discussions are needed to establish cross-jurisdictional collaboration mechanisms for implementing optimization measures and advancing policy enforcement.
Author Contributions
Conceptualization, M.F. and Y.L.; methodology, M.F.; software, M.F.; validation, M.F., Y.L., L.X. and T.Z.; formal analysis, M.F.; investigation, M.F.; resources, M.F.; data curation, M.F.; writing—original draft preparation, M.F.; writing—review and editing, M.F., Y.L., L.X. and T.Z.; visualization, M.F.; supervision, Y.L.; project administration, M.F.; funding acquisition, M.F. All authors have read and agreed to the published version of the manuscript.
Funding
The research was supported by Scientific Research Fund of Zhejiang Provincial Education Department (Grant No. Y202455682), National Natural Science Foundation of China (Grant No. 52478042) and Chongqing Social Science Planning Fund (2023NDYB83).
Data Availability Statement
The data sources are detailed in Section 2.1 of the paper. Additionally, the data can be obtained by contacting the corresponding author.
Acknowledgments
We appreciate the associate editors and the reviewers for their useful feedback that improved this paper.
Conflicts of Interest
The authors declare no conflicts of interest.
Abbreviations
The following abbreviations are used in this manuscript:
| GI | Green Infrastructure |
| MSPA | Morphological Spatial Pattern Analysis |
| In-VEST | Integrated Valuation of Ecosystem Services and Tradeoffs |
References
- Restrepo, J.D.; Bottaro, G.; Barci, L.; Beltrán, L.M.; Londoño-Behaine, M.; Masiero, M. Assessing the Impacts of Nature-Based Solutions on Ecosystem Services: A Water-Energy-Food-Ecosystems Nexus Approach in the Nima River Sub-Basin (Colombia). Forests 2024, 15, 1852. [Google Scholar] [CrossRef]
- Costanza, R.; De Groot, R.; Braat, L.; Kubiszewski, I.; Fioramonti, L.; Sutton, P.; Farber, S.; Grasso, M. Twenty years of ecosystem services: How far have we come and how far do we still need to go? Ecosyst. Serv. 2017, 28, 1–16. [Google Scholar]
- Li, M.; Xu, N.; Liu, F.; Tong, H.; Ding, N.; Dong, J.; Wang, M. Ecological Management Zoning Based on the Supply–Demand Relationship and Synergies of Urban Forest Ecosystem Services: A Case Study from Fuzhou, China. Forests 2025, 16, 17. [Google Scholar]
- Roces-Diaz, J.V.; Vayreda, J.; Banque-Casanovas, M.; Diaz-Varela, E.; Bonet, J.A.; Brotons, L.; de-Miguel, S.; Herrando, S.; Martinez-Vilalta, J. The spatial level of analysis affects the patterns of forest ecosystem services supply and their relationships. Sci. Total Environ. 2018, 626, 1270. [Google Scholar]
- Yue, W.Z.; Hou, L.; Xia, H.X.; Wei, J.X.; Lu, Y.P. Territorially ecological restoration zoning and optimization strategy in Guyuan City of Ningxia, China: Based on the balance of ecosystem service supply and demand. Chin. J. Appl. Ecol. 2022, 33, 149–158. [Google Scholar]
- Dong, X.Y.; Yi, W.X.; Yuan, P.; Song, Y.H. Optimization and trade-off framework for coupled green-grey infrastructure considering environmental performance. J. Environ. Manag. 2023, 329, 117041. [Google Scholar] [CrossRef]
- Islam, M.R.; Shahfahad Talukdar, S.; Rihan, M.; Rahman, A. Evaluating cooling effect of blue-green infrastructure on urban thermal environment in a metropolitan city: Using geospatial and machine learning techniques. Sustain. Cities Soc. 2024, 113, 105666. [Google Scholar] [CrossRef]
- Wu, H.W.; Kumar, P.; Cao, S.J. The role of roadside green infrastructure in improving air quality in and around elderly care centres in Nanjing, China. Atmos. Environ. 2024, 332, 120607. [Google Scholar] [CrossRef]
- Wang, Z.; Li, Z.; Wang, Y.; Zheng, X.; Deng, X. Building green infrastructure for mitigating urban flood risk in Beijing, China. Urban For. Urban Green. 2024, 93, 128218. [Google Scholar] [CrossRef]
- Chen, Y.; Wang, Y.; Liew, J.H.; Wang, P.L. Development of a methodological framework for evaluating biodiversity of built urban green infrastructures by practitioners. J. Clean. Prod. 2021, 303, 127009. [Google Scholar] [CrossRef]
- Kavehei, E.; Jenkins, G.A.; Adame, M.F.; Lemckert, C. Carbon sequestration potential for mitigating the carbon footprint of green stormwater infrastructure. Renew. Sustain. Energy Rev. 2018, 94, 1179–1191. [Google Scholar] [CrossRef]
- Shou, T.; Li, K.; Li, Y.; Ni, Y.; Lu, D.; Wei, J. How do contextual factors mediate and moderate the association between green infrastructure and respiratory health? A systematic review and meta-analysis. Urban For. Urban Green. 2024, 98, 128392. [Google Scholar] [CrossRef]
- Dipeolu, A.A.; Ibem, E.O.; Fadamiro, J.A. Influence of green infrastructure on sense of community in residents of Lagos Metropolis, Nigeria. J. Hum. Behav. Soc. Environ. 2020, 30, 743–759. [Google Scholar] [CrossRef]
- Lina, F.; Lorenza, N.; Fausto, M.; Alessandro, S.; Silvano, F. Supply and demand mismatch analysis to improve regulating ecosystem services in Mediterranean urban areas: Insights from four Italian Municipalities. Ecol. Indic. 2023, 155, 110928. [Google Scholar]
- Dobbs, C.; Kendal, D.; Nitschke, C.R. Multiple ecosystem services and disservices of the urban forest establishing their connections with landscape structure and sociodemographics. Ecol. Indic. 2014, 43, 44–55. [Google Scholar] [CrossRef]
- Grafius, D.R.; Corstanje, R.; Harris, J.A. Linking ecosystem services, urban form and green space configuration using multivariate landscape metric analysis. Landsc. Ecol. 2018, 33, 557–573. [Google Scholar] [CrossRef] [PubMed]
- Uuemaa, E.; Mander, Ü.; Marja, R. Trends in the use of landscape spatial metrics as landscape indicators: A review. Ecol. Indic. 2013, 28, 100–106. [Google Scholar] [CrossRef]
- Ojoyi, M.M.; Odindi, J.; Mutanga, O.; Abdel-Rahman, E.M. Analysing fragmentation in vulnerable biodiversity hotspots in Tanzania from 1975 to 2012 using remote sensing and fragstats. Nat. Conserv. 2016, 16, 19–37. [Google Scholar]
- Frazier, A.E.; Kedron, P. Landscape metrics: Past progress and future directions. Curr. Landsc. Ecol. Rep. 2017, 2, 63–72. [Google Scholar] [CrossRef]
- Nasehi, S.; Imanpour namin, A. Assessment of urban green space fragmentation using landscape metrics (case study: District 2, Tehran city). Model. Earth Syst. Environ. 2020, 6, 2405–2414. [Google Scholar] [CrossRef]
- Peng, J.; Yang, Y.; Xie, P.; Liu, Y.X. Zoning for the construction of green space ecological networks in Guangdong Province based on the supply and demand of ecosystem services. Acta Ecol. Sin. 2017, 37, 4562–4572. [Google Scholar]
- Liu, B.; Tian, Y.; Guo, M.; Tran, D.; Alwah, A.A.Q.; Xu, D. Evaluating the disparity between supply and demand of park green space using a multi-dimensional spatial equity evaluation framework. Cities 2021, 121, 103484. [Google Scholar]
- Rahman, K.M.A.; Zhang, D. Analyzing the level of accessibility of public urban green spaces to different socially vulnerable groups of people. Sustainability 2018, 10, 3917. [Google Scholar] [CrossRef]
- Zhou, Y.; Wu, X. Identification of priority areas for green stormwater infrastructure based on supply and demand evaluation of flood regulation service. Environ. Dev. 2023, 45, 100815. [Google Scholar]
- de Manuel, B.; FernandezMendez-Fernandez, L.; Pena, L.; Ametzaga-Arregi, I. A new indicator of the effectiveness of urban green infrastructure based on ecosystem services assessment. Basic Appl. Ecol. 2021, 53, 12–25. [Google Scholar] [CrossRef]
- Lin, Y.; Zhang, M.; Gan, M.; Huang, L.; Zhu, C.; Zheng, Q.; You, S.; Ye, Z.; Shahtahmassebi, A.; Li, Y.; et al. Fine identification of the supply–demand mismatches and matches of urban green space ecosystem services with a spatial filtering tool. J. Clean. Prod. 2022, 336, 130404. [Google Scholar]
- Li, M.H.; Wang, G.Y.; Li, H.Y.; Chen, T.; Tang, S. Identifying the optimization potential for urban GI by linking supply and demand of ecosystem services under multi-scenarios: A case study of Tianjin, China. Ecol. Indic. 2023, 154, 110570. [Google Scholar]
- Zhao, H.X.; Gu, B.J.; Wang, J.Q.; Fan, J.D.; Li, X. Characteristics of green infrastructure supply-demand adaptation relationship and its pattern in Nanjing City. Acta Ecol. Sin. 2024, 44, 463–475. [Google Scholar]
- Luo, C.; Yu, H.; Liu, Y.; Yang, W. Supply and demand assessment of physical activity services provided by urban green spaces: A case study of Chongqing, China. Urban For. Urban Green. 2024, 95, 128315. [Google Scholar]
- Xiao, H.B.; Sheng, S.; An, Q. Research on the Identification of Urban Green Infrastructure Supply-Demand Spatial Differentiation and Optimization Strategies: A Case Study on Jinan West New District. Chin. Landsc. Archit. 2019, 35, 65–69. [Google Scholar]
- Hegetschweiler, K.T.; de Vries, S.; Arnberger, A.; Bell, S.; Brennan, M.; Siter, N.; Olafsson, A.S.; Voigt, A.; Hunziker, M. Linking demand and supply factors in identifying cultural ecosystem services of urban green infrastructures: A review of European studies. Urban For. Urban Green. 2017, 21, 48–59. [Google Scholar]
- Ying, J.; Zhang, X.J.; Zhang, Y.Q.; Bilan, S. Green infrastructure: Systematic literature review. Econ. Res. Ekon. Istraživanja 2022, 35, 343–366. [Google Scholar]
- Luo, C.; Wang, F.M.; Li, G.G.; Yang, C.X. Identifying supply-demand spatial matches of cultural ecosystem services provided by urban parks in polycentric mountainous cities. Acta Ecol. Sin. 2024, 44, 5816–5827. [Google Scholar]
- Zhang, J.; Tan, P.Y. Assessment of spatial equity of urban park distribution from the perspective of supply-demand interactions. Urban For. Urban Green. 2023, 80, 127827. [Google Scholar]
- Burkhard, B.; Kandziora, M.; Hou, Y.; Müller, F. Ecosystem service potentials, flows and demands-concepts for spatial localisation, indication and quantification. Landsc. Online 2014, 34, 1–32. [Google Scholar] [CrossRef]
- Baró, F.; Palomo, I.; Zulian, G.; Vizcaino, P.; Haase, D.; Gómez-Baggethun, E. Mapping ecosystem service capacity, flow and demand for landscape and urban planning: A case study in the Barcelona metropolitan region. Land Use Policy 2016, 57, 405–417. [Google Scholar]
- Chen, J.; Jiang, B.; Bai, Y.; Xu, X.; Alatalo, J.M. Quantifying ecosystem services supply and demand shortfalls and mismatches for management optimisation. Sci. Total Environ. 2019, 650, 1426–1439. [Google Scholar]
- Chen, W.; Liu, H.; Wang, J. Construction and optimization of regional ecological security patterns based on MSPA-MCR-GA Model: A case study of Dongting Lake Basin in China. Ecol. Indic. 2024, 165, 112169. [Google Scholar]
- Wang, F.; Liu, Y.; He, J.S.; Hu, X.; Qin, Y.; Wang, L.Y. River basin habitats science: Framework and prospects. J. Nat. Resour. 2024, 39, 997–1007. [Google Scholar]
- Zhang, S.; Liu, Y.; Wang, T. How land use change contributes to reducing soil erosion in the Jialing River Basin, China. Agric. Water Manag. 2014, 133, 65–73. [Google Scholar]
- Wang, Y.H.; Li, C.L.; Wang, H.; Liang, B.M.; Lv, J.S. Research status and hot topics in the field of ecological environment of green infrastructure. Acta Ecol. Sin. 2022, 42, 2510–2521. [Google Scholar]
- Guo, W.; Jiao, X.; Zhou, H.; Zhu, Y.; Wang, H. Hydrologic regime alteration and influence factors in the Jialing River of the Yangtze River, China. Sci. Rep. 2022, 12, 11166. [Google Scholar]
- Liu, L.Y.; Bian, Z.Q.; Ding, S.Y. Effects of landscape spatial heterogeneity on the generation and provision of ecosystem services. Acta Ecol. Sin. 2018, 38, 6412–6421. [Google Scholar]
- Liu, Y.N.; Kong, L.Q.; Xiao, Y.; Zheng, H. Relationships between landscape pattern and ecosystem water purification service in the Yangtze River Basin. Acta Ecol. Sin. 2019, 39, 844–852. [Google Scholar]
- Wickham, J.D.; Riitters, K.H.; Wade, T.G.; Vogt, P. A national assessment of green infrastructure and change for the conterminous United States using morphological image processing. Landsc. Urban Plan. 2010, 94, 186–195. [Google Scholar]
- Soille, P.; Vogt, P. Morphological segmentation of binary patterns. Pattern Recognit. Lett. 2009, 30, 456–459. [Google Scholar]
- Wu, Z.; Zhang, S.; Liu, M.; Wu, Z.; Hu, X.; Lin, S. Impact of Forest Landscape Patterns on Ecological Quality in Coastal Cities of Fujian, China, from 2000 to 2020. Forests 2024, 15, 1925. [Google Scholar] [CrossRef]
- Wu, Z.F.; Hu, W.P.; Chen, J. Landscape ecological cluster analysis of typical area in Zhujiang Delta. Ecol. Environ. 2005, 14, 63–66. [Google Scholar]
- Xiang, Q.; Kan, A.; Yu, X.; Liu, F.; Huang, H.; Li, W.; Gao, R. Assessment of Topographic Effect on Habitat Quality in Mountainous Area Using InVEST Model. Land 2023, 12, 186. [Google Scholar] [CrossRef]
- Zhang, X.; Zhang, G.; Long, X.; Zhang, Q.; Liu, D.; Wu, H.; Li, S. Identifying the drivers of water yield ecosystem service: A case study in the Yangtze River Basin, China. Ecol. Indic. 2021, 132, 108304. [Google Scholar]
- Zhao, H.; Guo, B.; Wang, G. Spatial–Temporal Changes and Prediction of Carbon Storage in the Tibetan Plateau Based on PLUS-InVEST Model. Forests 2023, 14, 1352. [Google Scholar] [CrossRef]
- Xiao, Q.; Hu, D.; Xiao, Y. Assessing changes in soil conservation ecosystem services and causal factors in the Three Gorges Reservoir region of China. J. Clean. Prod. 2017, 163, S172–S180. [Google Scholar] [CrossRef]
- Peña, L.; Casado-Arzuaga, I.; Onaindia, M. Mapping recreation supply and demand using an ecological and a social evaluation approach. Ecosyst. Serv. 2015, 13, 108–118. [Google Scholar] [CrossRef]
- Zhu, W.; Huang, J.; Yang, S.; Liu, W.; Dai, Y.; Huang, G.; Lin, J. Spatiotemporal Evolution, Driving Mechanisms, and Zoning Optimization Pathways of Ecosystem Health in China. Forests 2024, 15, 1987. [Google Scholar] [CrossRef]
- Wang, J.Y.; Zhai, Z.Q.; Guo, G.Q.; Tao, T.Y. Study on water environmental carrying capacity evaluation in Taihu Lake Basin. China Environ. Sci. 2017, 5, 1979–1987. [Google Scholar]
- Lai, J.; Li, J.; Liu, L. Predicting Soil Erosion Using RUSLE and GeoSOS-FLUS Models: A Case Study in Kunming, China. Forests 2024, 15, 1039. [Google Scholar] [CrossRef]
- Liu, Y.; Wang, J.; Deng, X. Rocky land desertification and its driving forces in the karst areas of rural Guangxi, Southwest China. J. Mt. Sci. 2008, 5, 350–357. [Google Scholar] [CrossRef]
- Elmqvist, T.; Fragkias, M.; Goodness, J.; Güneralp, B.; Marcotullio, P.J.; McDonald, R.I.; Parnell, S.; Schewenius, M.; Sendstad, M.; Seto, K.C.; et al. Urbanization, Biodiversity and Ecosystem Services: Challenges and Opportunities: A Global Assessment; Springer Nature: Berlin/Heidelberg, Germany, 2013. [Google Scholar]
- McPhearson, T.; Hamstead, Z.A.; Kremer, P. Urban ecosystem services for resilience planning and management in New York City. Ambio 2014, 43, 502–515. [Google Scholar] [CrossRef]
- Mazziotta, M.; Pareto, A. Normalization methods for spatio-temporal analysis of environmental performance: Revisiting the Min–Max method. Environmetrics 2022, 33, e2730. [Google Scholar]
- Elliott, R.M.; Motzny, A.E.; Majd, S.; Chavez, F.J.; Laimer, D.; Orlove, B.S.; Culligan, P.J. Identifying linkages between urban green infrastructure and ecosystem services using an expert opinion methodology. Ambio 2020, 49, 569–583. [Google Scholar] [CrossRef]
- 62. Malekinezhad, H.; Sepehri, M.; Pham, Q.B.; Hosseini, S.Z.; Meshram, S.G.; Vojtek, M.; Vojteková, J. Application of entropy weighting method for urban flood hazard mapping. Acta Geophys. 2021, 69, 841–854. [Google Scholar] [CrossRef]
- Sun, Y.; Liu, S.; Shi, F.; An, Y.; Li, M.; Liu, Y. Spatio-temporal variations and coupling of human activity intensity and ecosystem services based on the four-quadrant model on the Qinghai-Tibet Plateau. Sci. Total Environ. 2020, 743, 140721. [Google Scholar]
- Aghajani, H.; Sarkari, F.; Borhani, M. Coupling coordination analysis between urbanization and ecology in Iran. Front. Urban Rural Plan. 2024, 2, 5. [Google Scholar]
- Feng, M.; Zhao, W.; Zhang, T. Construction and Optimization Strategy of County Ecological Infrastructure Network Based on MCR and Gravity Model—A Case Study of Langzhong County in Sichuan Province. Sustainability 2023, 15, 8478. [Google Scholar] [CrossRef]


Disclaimer/Publisher’s Note: The statements, opinions and data contained in all publications are solely those of the individual author(s) and contributor(s) and not of MDPI and/or the editor(s). MDPI and/or the editor(s) disclaim responsibility for any injury to people or property resulting from any ideas, methods, instructions or products referred to in the content. |
© 2025 by the authors. Licensee MDPI, Basel, Switzerland. This article is an open access article distributed under the terms and conditions of the Creative Commons Attribution (CC BY) license (https://creativecommons.org/licenses/by/4.0/).