Article

Variations in Leaf Photosynthesis and Its Limitations at Different Canopy Positions in Mature Camphor Trees

Shanghai Botanical Garden, Longwu Road 1111, Shanghai 200231, China
*
Author to whom correspondence should be addressed.
Forests 2025, 16(4), 581; https://doi.org/10.3390/f16040581
Submission received: 22 February 2025 / Revised: 18 March 2025 / Accepted: 25 March 2025 / Published: 27 March 2025

Abstract

:
Urban forests play important roles in carbon sequestration and climate change mitigation. However, their adaptive mechanisms and limitations on photosynthesis throughout the canopy are poorly understood. This study takes the most widely distributed 50-year-old camphor plantations (Cinnamomum camphora) in Shanghai as the research objects. We investigated the variations in leaf morphology and photosynthetic physiology and biochemistry at six different canopy positions during a summer and an autumn period. We discovered that on account of leaf nitrogen loss and water deficit, light-saturated photosynthesis (Amax) declined in upper sunlit leaves despite being exposed to high sunlight in the same fashion as stomatal and mesophyll conductance (gsw, gm), photochemical quenching coefficient and actual photochemical efficiency of PSII (ΦPSII, qP), and maximum rate of electron transport and carboxylation (Jmax, Vcmax) during the growing season. Although seasonal change had little effect on Amax, the relative importance of limitations varied temporally. Mesophyll and biochemical limitation were the major contributors to the decline in the Amax in upper sunlit leaves between summer and autumn, respectively. Our study highlights the constraints of carbon fixation capacity in dense stands of mature camphor trees and offers technical support for the accurate prediction of canopy photosynthesis and the enhancement of carbon sequestration management in urban forests.

Graphical Abstract

1. Introduction

The forest canopy, as the main place of photosynthesis, is the primary functional interface for matter and energy exchange between trees and the atmosphere [1]. In the canopy, light availability—which is affected by stand structure and foliage distribution—often differs more than 50-fold from the top of the canopy to the bottom [2]. Concomitantly, air and leaf temperatures, humidity, and vapor pressure deficits also vary dramatically along the canopy [3,4]. This environmental variability generates strong gradients in canopy leaf anatomical, morphological, and functional traits [5]. Thus, the distinct phenomenon of sun leaves and shade leaves is produced, driving leaf carbon gain dynamics in the whole tree [6]. Compared with leaves grown in shade, sun leaves have been found to have thicker palisade tissue, higher leaf mass per area (LMA) and area-based nitrogen content (Na), as well as greater rate of photosynthesis (An) [7,8], yet they also suffer more sun exposure stress due to excessive light absorption [9,10].
The scaling up of photosynthesis from leaves to the canopy is often simulated and performed using the biochemical model established by Farquhar et al. [11]. The initial optimality model (i.e., big leaf model) proposed that the photosynthetic capacity and N distribution is proportional to the light extinction coefficient in the canopy so that canopy carbon gain could be maximized [12,13]. Nevertheless, the actual N distribution in the canopy has been shown to be much less steep than the light gradient [14]. And also the photosynthetic rate usually levels off at 30%–50% of above-canopy light, implying a certain limit for high–light acclimation [15,16]. Peltoniemi et al. [17] developed a simple ‘toy’ two-leaf canopy model, which suggests that hydraulic constraints to water supply can explain shallow N gradients in the canopy. The hydraulic limitation theory states that the hydraulic conductance of the soil–leaf pathway is inversely related to the length of the water transport path. Thus, the sun leaves of the upper canopy have lower water potentials than the shaded ones of the lower canopy which may lead to lower N allocation in the upper leaves [18,19], but more N is partitioned to Calvin–Benson cycle enzymes to accelerate the photosynthetic capacity [20]. However, there is also evidence that plants can overcome this path-length limitation and can even construct superior water transport efficiency in sun branches at the top canopy as a plastic response of xylem anatomy to the light environment [21,22]. Since high photosynthetic capacity tends to be sustained by high stomatal conductance and high hydraulic conductance, the distribution optimization of hydraulic conductance and photosynthetic nitrogen within the canopy could achieve the maximization of tree primary production in the whole canopy [23]. As a matter of fact, better additional structural, chemical, and physiological constraints can be likewise used to introduce more reality into optimality models like LMA and gsw [17]. Whether these factors are included depends on their roles in the regulation of photosynthesis. But to date, there is very limited evidence on physiological and biochemical factors incorporated into canopy models of photosynthesis in urban forests of subtropical region.
Under saturated light, photosynthetic rates in terrestrial C3 plants are limited by CO2 diffusion resistance and by CO2 fixation velocity (i.e., biochemical limitaion), which are expressed by stomatal and mesophyll conductances (gs and gm), and by maximum rates of Ribulose-1,5-Bisphosphate (RuBP) carboxylation and regeneration in the Calvin cycle (Vcmax and Jmax), respectively [24,25]. Generally, gs and gm are found to be constrained by the leaf anatomical structure and biochemical factors, such as aquaporins and carbonic anhydrase [26,27], while Vcmax and Jmax are mainly associated with N concentration and the amount (and activity) of the relevant enzymes [28,29]. Any decrease in CO2 diffusion or utilization would lead to a direct reduction in the photosynthesis rate [24]. gs, gm, Vcmax, and Jmax vary temporally and spatially under the influence of species, leaf ontogeny, and environment conditions, e.g., light, CO2, temperature, as well as water and nutrition supply [26,30,31,32]. Thus, the relative importance of these photosynthetic limitations may be highly responsive to both the intra-canopy resource gradient and seasonal variability. Several studies have reported on limitations to carbon uptake throughout the canopy. For instance, in mature Eucalytus tereticornis trees, Crous et al. [33] found stronger electron transport and carboxylation limitations to photosynthesis in lower shading leaves, while Campany et al. [34] suggested that the lower An in shade leaves was primarily associated with reduced gm. It was further discovered that seasonal changes impacted the relative importance of limitations across the entire canopy. According to Cano et al. [35], moderate summer drought lowered An in upper and lower beech leaves and in lower oak leaves by reducing the gs and gm. These discrepancies may be determined by the degree of variability in biochemical demand and CO2 supply among canopy positions. The preceding studies, however, did not investigate how these inequalities throughout the canopy vary with the changing seasons, especially with regard to temperature and sunlight, and a lack of empirical data hinders us from interpreting their coupled effects on the diffusive and biochemical components.
Cinnamomum camphora is one of the most important urban tree species in the subtropical region of China and is commonly cultivated as dense pure plantations. Currently, its application frequency has been found to be as high as 80% in Shanghai [36]. However, very little is understood about the adaptive mechanisms that regulate photosynthesis in the canopy of C. camphora grown in the urban greenery. Here, we conducted a field study in monospecific camphor stands in a subtropical monsoon climate to assess the effects of canopy position on key leaf photosynthetic characteristics and associated functional traits at two times during the growing season. We further investigated the correlation of leaf photosynthetic capacity with resource partition and physiological and biochemical components, as well as the seasonal variability of quantitative limitations on photosynthesis along the canopy. Several questions were asked: Do photosynthetic traits increase as light increases in the canopy? Are there significant differences in photosynthetic physiology and biochemistry in the canopy between the two growing seasons? Which components significantly affect canopy photosynthesis? The present study aims to predict canopy photosynthesis more accurately using optimality-based models and guide the carbon sequestration management in urban forests.

2. Materials and Methods

2.1. Study Site

This study was conducted in the adult stand of C. camphora located at Shanghai Botanical Garden (81.86 hm2) in the central region of Shanghai (31°08′44.40″ N, 121°26′50.12″ E). The garden is characterized by various broad-leaved evergreen and deciduous plantations, and C. camphora is one of the main tree species, covering an area of around 4 hm2, with 774 individuals in total. The mean annual temperature is 17.8 °C, and the mean annual precipitation is 1660.8 mm. The soil is silty clay loamy sand with an average pH value of 7.7. The total organic matter, nitrogen, and phosphorous contents in the topsoil are 16.80, 2.67, and 1.05 g·kg−1, respectively. Two sample camphor plots, with an area of 100 m2 each and with trees spaced 2–3 m apart (dense stand), were established. Three approximately 50-year-old sample trees were selected in each plot, for a total of six study trees with a mean height of 17.9 m and a mean diameter at breast height of 40.5 cm.

2.2. Experimental Design

In accordance with canopy height, a three-storied bamboo platform with a height of about 14 m was built to provide access to the leaves of the three sample trees in each plot (Figure S1). Leaf–gas exchange measurements were performed during two measurement campaigns through the 2023 growing season, from 22 August to 7 September (summer) and from 17 October to 31 October (autumn). The same measurement protocol was followed during each campaign. Measurements were taken at three canopy layers: upper, corresponding to the outer edge of the canopy within three meters from the top; middle, corresponding to the mid-canopy (the halfway up the canopy, 11~12 m high); lower, corresponding to the lowest living branch (6~7 m high). At the same time, each layer within the canopy was divided into southern and northern faces, resulting in six distinct canopy positions, i.e., the southern and northern faces of the upper (US and UN), middle (MS and MN), and lower (LS and LN) layers. According to the developing locations of branches, the leaves located at the middle and lower layers were sampled on the secondary branches of the inner canopy, while the leaves at the upper layer were sampled on the branch apex. Fully expanded and undamaged current-year leaves were selected from the same branch for gas exchange measurements. Leaf–gas exchange and chlorophyll fluorescence were measured simultaneously on sunny days between 9:00 and 12:00 a.m. Over the two dates, we completed 60 An versus CO2 concentration in the intercellular air space (Ci) response curves (An/Ci curves) in total. On each date, we made four to six An/Ci curves at each canopy position. Following the gas exchange measurement on the first date, leaves attached to the same branch were collected, with one portion of leaves used to analyze the pigment concentration and the other to determine the carbon and nitrogen contents.

2.3. Environmental Measurements

Prior to gas exchange measurement on each date, the photosynthetic active radiation (PAR) incident on the selected leaves was measured with a handheld quantum sensor (Li-250A, LI-COR Inc., Lincoln, NE, USA) at each canopy position for the sample trees. PAR was performed on sunny days every two hours between 8:00 and 16:00. The daily PAR (PARsum) was calculated by the integral area of the diurnal light curves. Data on air temperature and precipitation were gathered by the microclimate station (DJ-6595A, DIANJIANG TECH Inc., Shanghai, China) located in the Shanghai Botanical Garden.

2.4. Gas Exchange and Chlorophyll Fluorescence Measurements

An/Ci curves were established from gas exchange measurements using an open gas exchange system (LI-6400XT and LI-6400-40, LI-COR Inc., Lincoln, NE, USA). The conditions inside the cuvette during the measurements were as follows: PAR of 1800 μmol·m−2·s−1 (saturating-light condition from previous trials, 90% red and 10% blue light), CO2 concentration of 400 μmol·mol−1, leaf temperature at prevailing levels (33–40 °C and 26–32 °C at two measurement times, respectively), relative humidity of 40%–60%, and air flow rate of 300 μmol·m−2·s−1. An/Ci curve measurements were initiated when An and gsw (stomatal conductance to H2O) had stabilized under these conditions (usually within 30min after clamping onto the leaf). A series of adjustments were made to the ambient CO2 concentration (Ca) inside the chamber: 400, 300, 250, 200, 150, 100, 50, 400, 600, 800, 1000, 1200, 1500, 1800 μmol·mol−1. The parameters were recorded when a steady state was reached for both gas exchange and chlorophyll fluorescence.
At each Ca step, chlorophyll fluorescence was measured simultaneously. Steady-state fluorescence (Fs) was recorded under actinic light of 1800 μmol·m−2·s−1 from light-emitting diodes and maximal fluorescence (Fm′) was recorded during a light-saturated pulse of ca. 8000 μmol·m−2·s−1 at 630 nm by the multiphase flash protocol. Far-red light of 5 μmol·m−2·s−1 was applied at 740 nm without actinic light to obtain minimal fluorescence in the light-adapted leaf (Fo′). The photochemical quenching coefficient of PSII (qP) and the actual photochemical efficiency of PSII (ΦPSII) were calculated according to the gas exchange system: qP = (Fm′ − Fs)/(Fm′ − Fo′), ΦPSII = (Fm′ − Fs)/Fm′. Electron transport rate (ETR) was calculated as ΦPSII × PAR × α × β, where α is the leaf absorbance (taken as 0.85) [37] and β is the distribution of light between PSI and PSII (taken as 0.5).
Finally, light-saturated gas exchange (Amax, gsw, and Ci) and chlorophyll fluorescence parameters (qP, ΦPSII, ETR) were determined at a Ca of 400 μmol·mol−1 and a PAR of 1800 μmol·m−2·s−1, which were used in the following calculations and analyses.

2.5. Estimation of Mesophyll Conductance and Biochemical Parameters

The maximum carboxylation rate (Vcmax(Ci)), potential maximum electron transport rate at saturating-light levels (Jmax(Ci)), and mitochondrial respiration rate in the light (Rday) were estimated based on An/Ci curves according to Farquhar et al. [11].
Mesophyll conductance (gm) was estimated by combining gas exchange and chlorophyll fluorescence measurements via the variable J method of Harley et al. [38], as follows:
g m = A n C i Γ * × E T R + 8 A n + R d a y E T R 4 A n + R d a y
where gm was judged to be reliable only when Ci ranged from 100 to 300 μmol·mol−1 [38]. Hence, the values of An, Ci, and ETR at Ca of 400 μmol·mol−1 were taken from the gas exchange and chlorophyll fluorescence measurements. Rday was calculated and derived for the An/Ci curve. Γ* represents the CO2 compensation point in the absence of Rday, taken from Bernacchi et al. [39]. The CO2 concentration at the site of carboxylation (Cc) was calculated following Fick’s law, which can be described as Cc = CiAn/gm. Therefore, using estimates of gm, An/Ci curves could be converted to An/Cc curves. The values of Vcmax(Cc) and Jmax(Cc) were calculated from An/Cc curves and then standardized to 25 °C using the temperature-dependent equation reported by Bernacchi et al. [40]. As the effects of temperature on gm are controversial—a positive effect was observed until 35 °C in Nicotiana while an obvious decline was observed from 26.9 °C to 40 °C in beech trees [30,35]—gm estimates were not scaled with temperature. Cc-based Vcmax and Jmax estimates at 25 °C were used in the subsequent analyses and comparisons. This method has stronger operability and higher reliability, which is conducive to the observation and analysis of multi-processing and multi-repetitive samples in our study.

2.6. Quantitative Limitation to the Light-Saturated Photosynthesis(Amax)

According to Grassi and Magnani [30], the contributions to the decreased Amax were partitioned into gsc (stomatal conductance to CO2), gm, and Vcmax. The photosynthesis limitations were determined as follows:
d A n A n = S L + M L + B L = l s × d g s c g s c + l m × d g m g m + l b × d V c m a x V c m a x
l s = g t o t / g s c × A n / C c g t o t + A n / C c
l m = g t o t / g m × A n / C c g t o t + A n / C c
l b = g t o t g t o t + A n / C c
where SL, ML, and BL are the contributions of gsc, gm, and Vcmax to dA/A, respectively. ls, lm, and lb are the corresponding relative limitations to photosynthesis, respectively. gsc is calculated as gsc = gsw/1.6. gtot is total conductance to CO2 between the leaf surface and carboxylation site (1/gtot = 1/gsc + 1/gm). ∂An/∂Cc was determined as the slope of An/Cc curve at Cc = 50–120 μmol·mol−1.
To investigate how the canopy position limits Amax between the two seasons, we compared the contributions of gsc, gm, and Vcmax to the reduced Amax (i.e., SL, ML, and BL). The maximum values of Amax, gsc, gm, and Vcmax were regarded as reference values, regardless of the season in which they occurred.

2.7. Concentration of Foliar Carbon, Nitrogen, and Photosynthetic Pigments

At each canopy position of sample trees in each plot, around 20 leaves were collected, scanned to measure surface area (cm2) using a leaf area meter (Scan Maker i800 plus, MICROTEK Inc., Shanghai, China), oven-dried at 80 °C for 48 h, and subsequently weighed to determine the leaf dry mass (g). Then, the leaf mass per area (LMA, g·m−2) was calculated. Afterward, the leaf samples were milled to assess the carbon (Cm, %) and nitrogen contents (Nm, %) using an organic element analyzer (Vario EL Cube, Elementar Inc., Hanau, Germany). Leaf nitrogen per area (Na, g·m−2) was calculated by using the leaf LMA.
Similarly, four leaves were collected, cut into small pieces with scissors (avoiding the main vein of the leaves), and soaked in 80% acetone for 48 h until whitened. The absorbance of the extract was measured at 470, 646, and 663 nm using an ultraviolet–visible spectrophotometer (L6S (765), INESA Inc., Shanghai, China) following Lichtenthaler and Wellburn [41]. The concentration of leaf chlorophyll a (Chla, mg·g−1), chlorophyll b (Chlb, mg·g−1), and carotenoid (Car, mg·g−1) were determined.

2.8. Statistical Analysis

All analyses and graphics were performed using SPSS18.0 and Origin Pro 9.1, respectively. Before analysis, Shapiro–Wilk’s and Levene’s tests were conducted to check normality and homogeneity. The variables that did not meet the assumption were log-transformed. Repeated measures analysis of variance with Duncan’s post hoc test were performed to test the effects of canopy position and date. The relationships among photosynthetic traits were assessed using linear regressions. Curve fitting analyses were performed to assess the correlation between PARsum and leaf physiological characteristics. Effects were considered significant at 0.05. All data were represented as mean ± SE (standard error).

3. Results

3.1. Growth Environment

Precipitation and air temperature varied significantly between the summer and autumn periods. The mean daily maximum temperature was 30.57 °C and 25.43 °C, and the total precipitation was 98.2 mm and 1.2 mm, respectively (Figure 1a). The first campaign experienced higher temperatures but more rainfall, which suggests that camphor trees did not suffer from summer drought stress.
The diurnal variations in PAR in the canopy of camphor trees were measured above the canopy and at each canopy position on typical sunny days (Figure S2). The maximal daily PAR (PARsum) throughout the canopy was observed on the southern side of the upper layer (US position, 29.94 mol·m−2·day−1 in summer and 22.49 mol·m−2·day−1 in autumn), accounting for 68.56% and 56.41% of above-canopy light (full light), respectively (Figure 1b). A close second was the southern side of the middle layer in summer (MS position, 16.05 mol·m−2·day−1 of PARsum; Figure 1b). Affected by solar elevation angle and crown profile, there was an obvious effect of seasonality on PARsum incident in leaves developing at the MS positions, where light availability was 7.32-fold higher in summer than in autumn, respectively. At other canopy positions, PARsum was relatively lower over both seasons (<10 mol·m−2·day−1; Figure 1b). Therefore, the leaves grown at the US position were considered upper sunlit leaves.

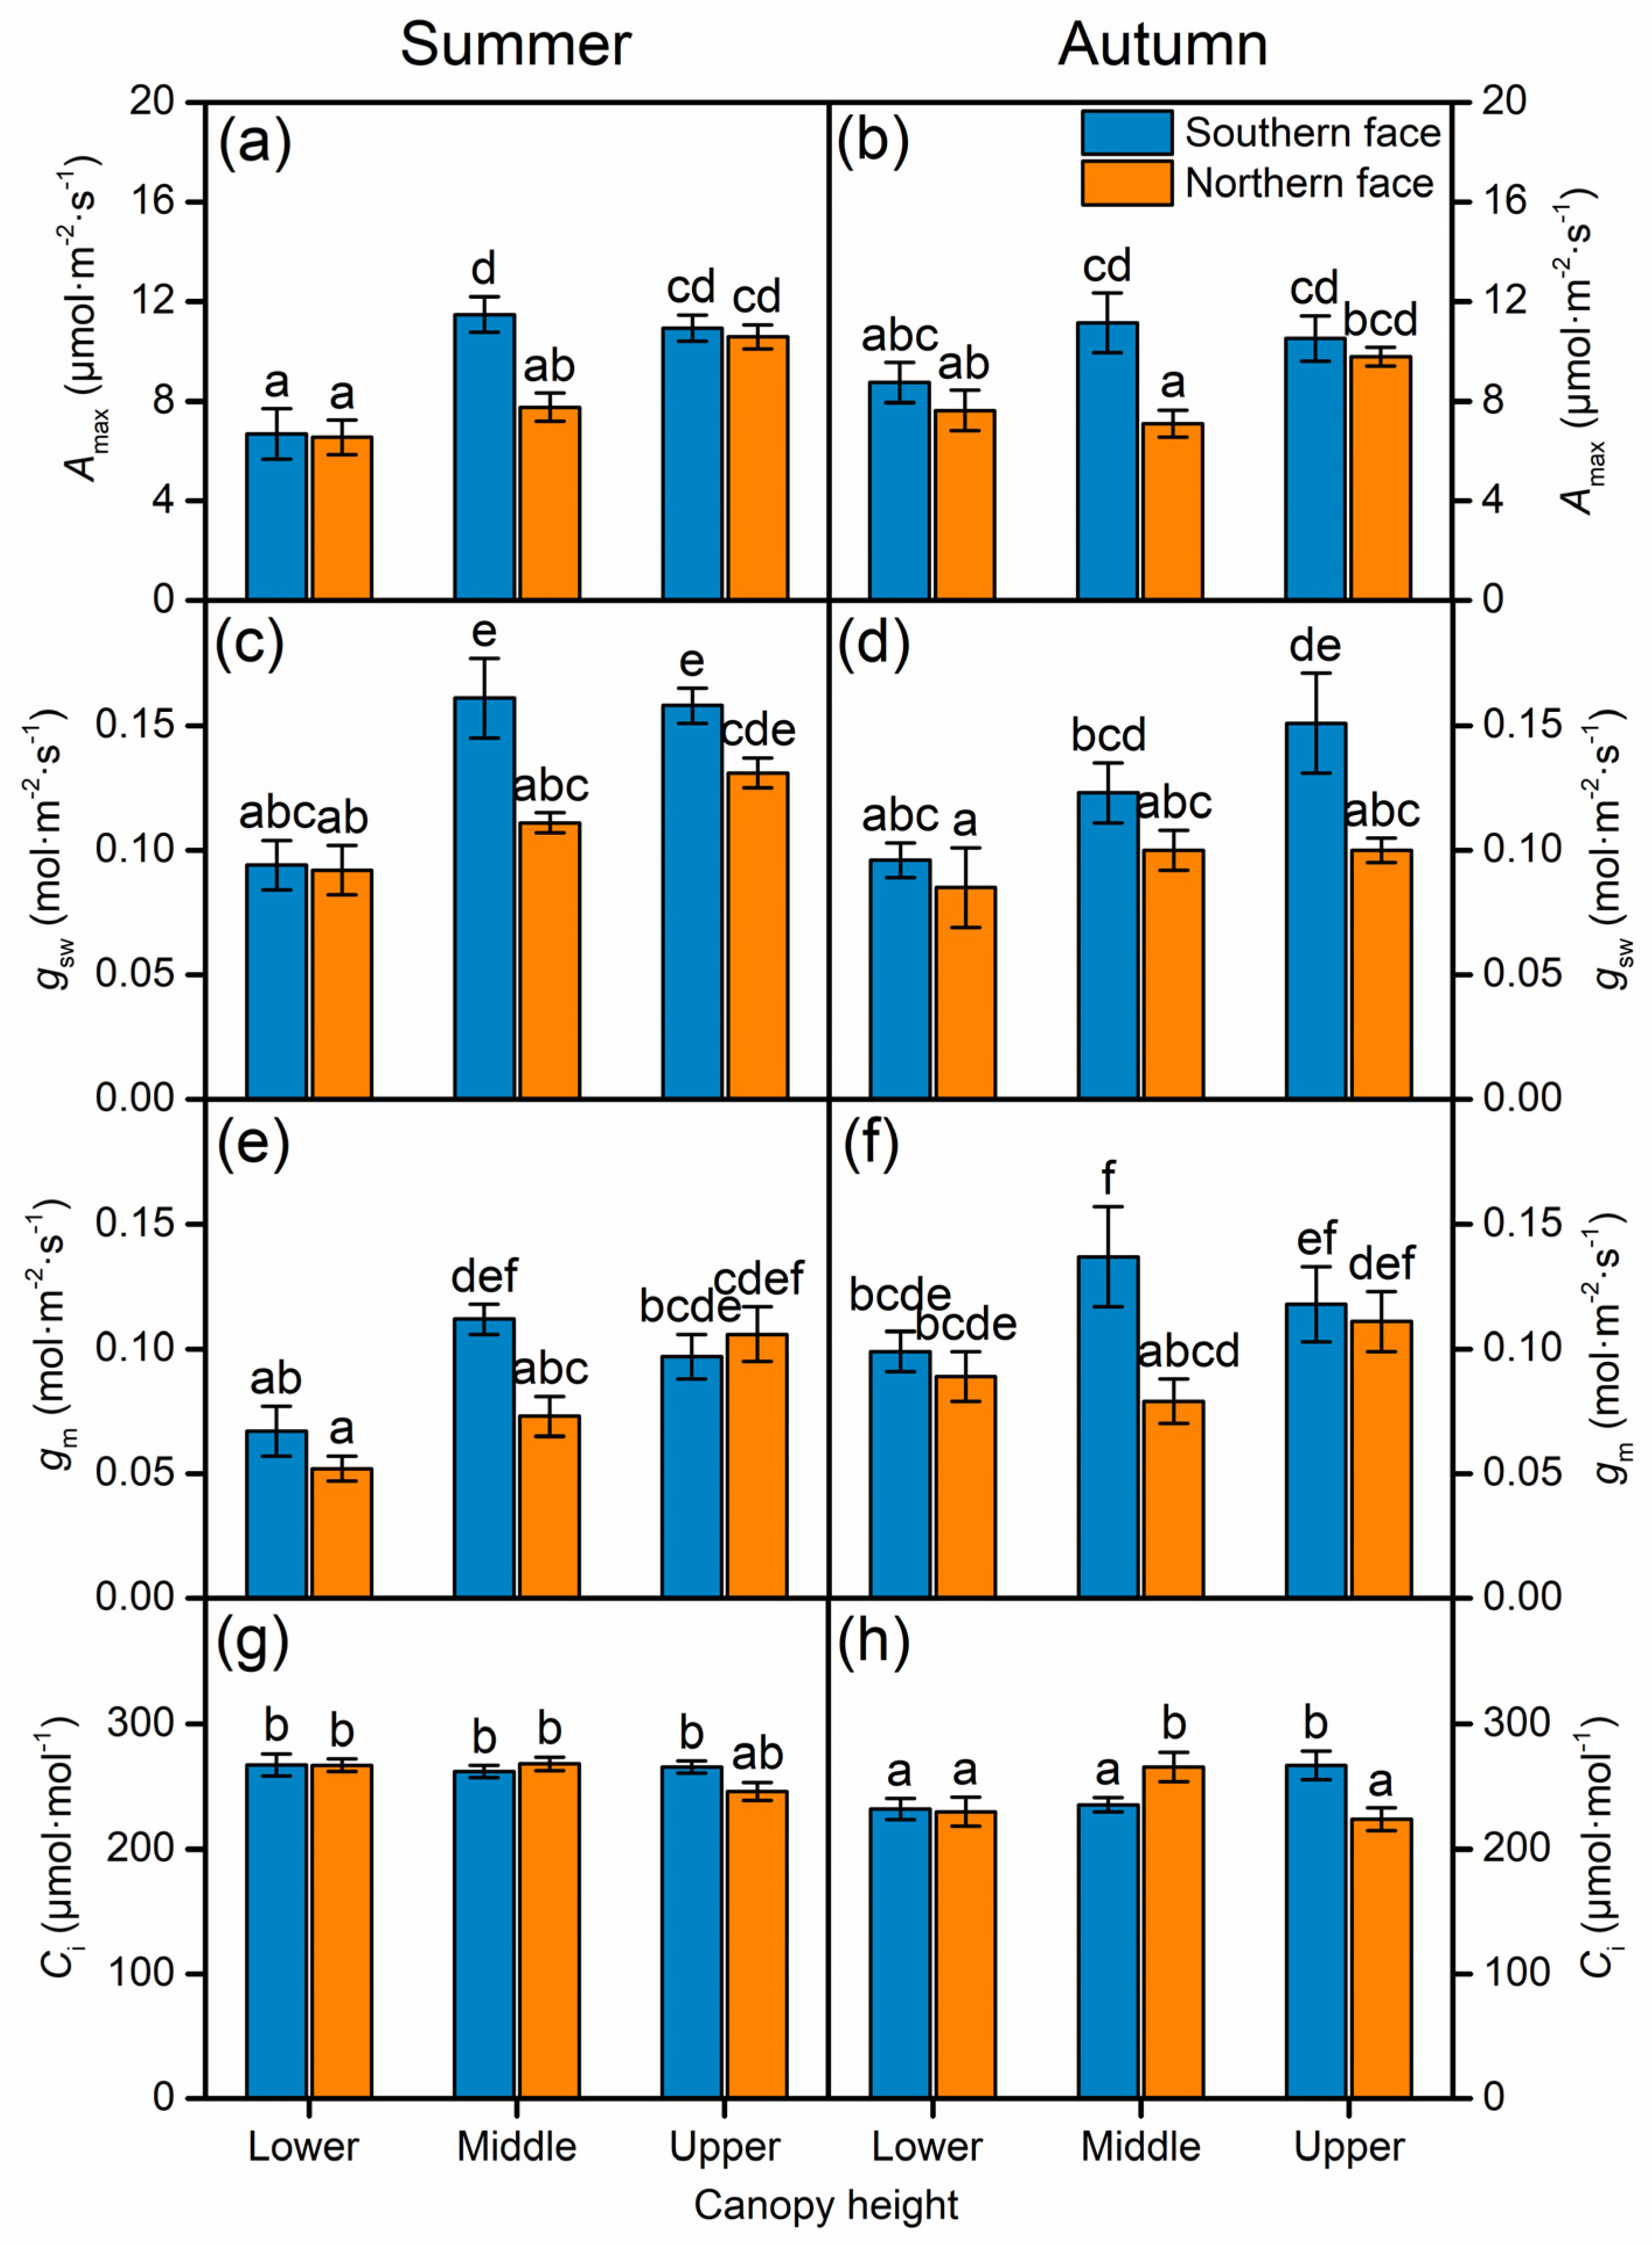
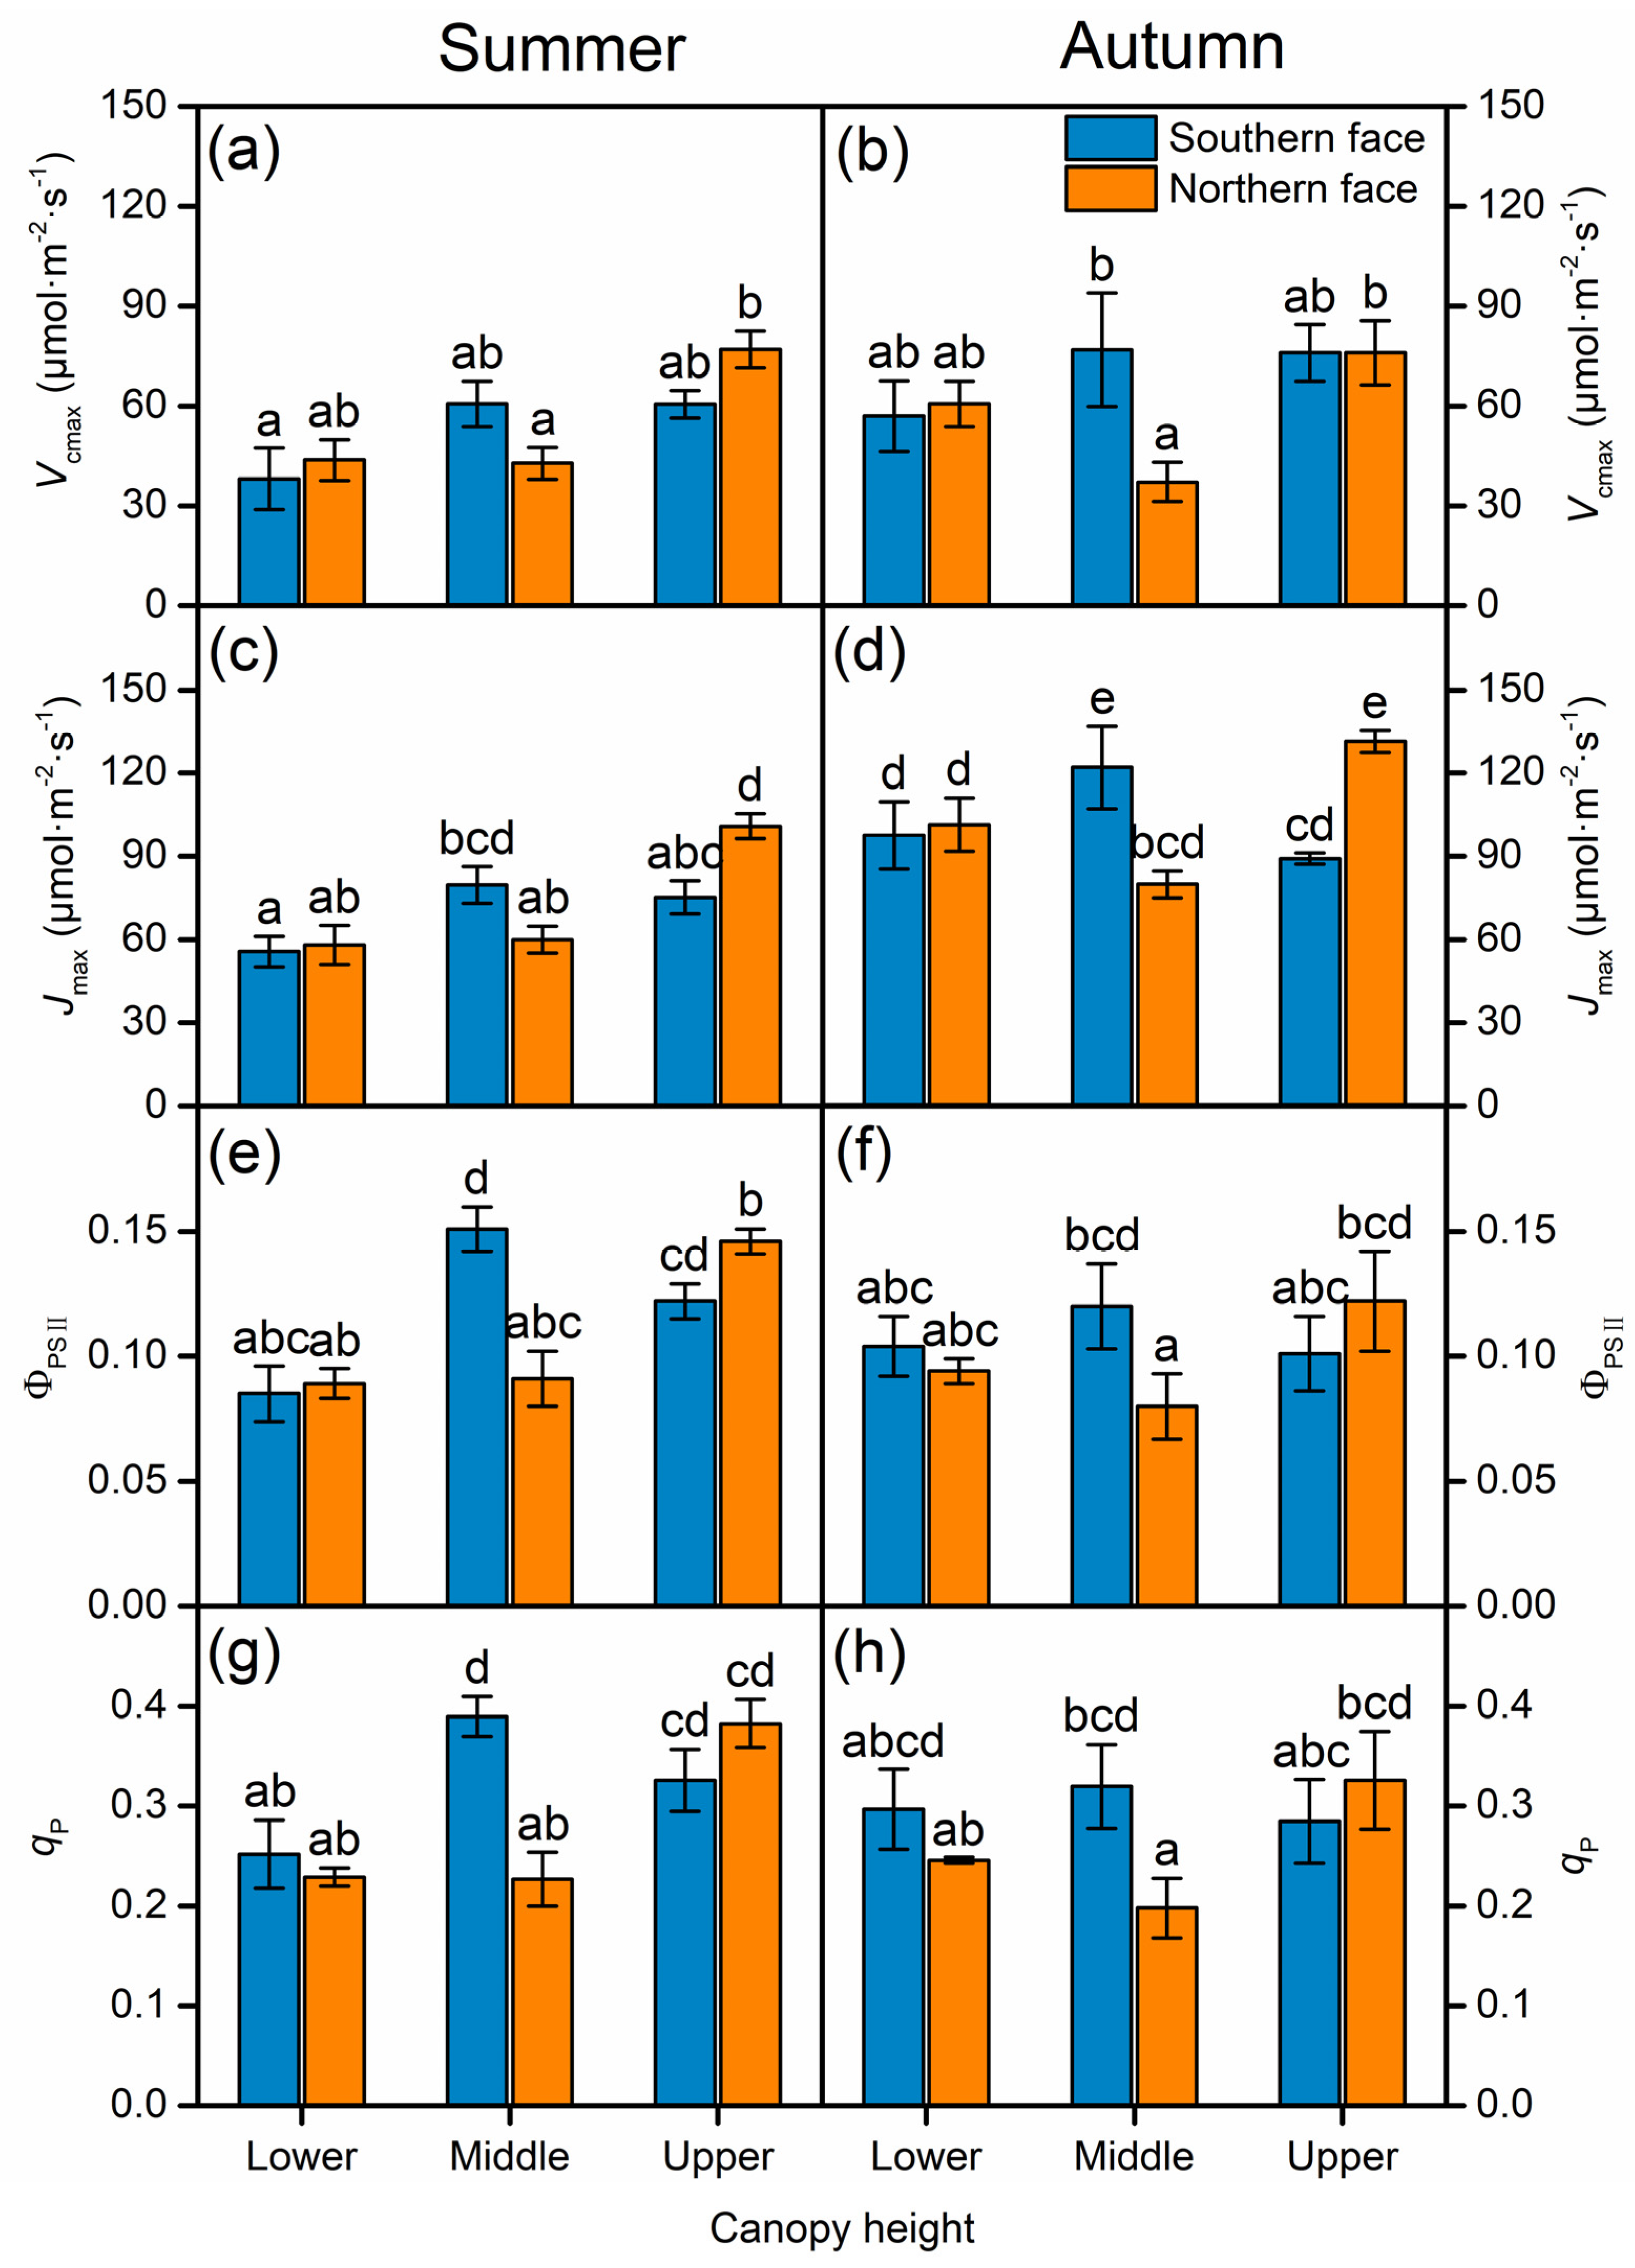
3.2. Effect of Canopy Position and Season on Leaf Photosynthetic Traits

Between the two campaigns, gsw, gm, Ci, and Jmax showed significant date effects (Table 1). Mean gsw and Ci were reduced by 12.32% and 7.84%, respectively, and mean gm and Jmax increased by 19.89% and 44.79%, respectively, from summer to autumn (Figure 2c–h and Figure 3c,d). Seasonal variation was more marked in the gsw of leaves grown in the MS position, in the gm at the lower layer, and in the Ci and Jmax in most positions except for US and MN positions, respectively (Figure 2c–h and Figure 3c,d). Other variables did not vary seasonally (Table 1). Meanwhile, no date effects were detected along with the fluctuation pattern of all photosynthetic traits throughout the canopy (Table 1).
Significant effects of both canopy height and orientation on the Amax, gsw, gm, and qP were observed across canopy positions, while the Vcmax, Jmax, and ΦPSII only exhibited prominent differences across canopy heights (Table 1). Accordingly, most leaf photosynthetic traits (except for gsw and Cc) showed significant interactive effects (Table 1). Contrasting two canopy orientations over two seasons, the Amax, gm, Vcmax, Jmax, ΦPSII, and qP all increased pronouncedly as height increased but only for the north-facing canopy. The south-facing leaves instead showed a tendency to decline at the upper layer relative to the middle layer (Figure 2a,b,e,f and Figure 3a–h). Nevertheless, this pattern only occurred for the gsw in summer, while the value increased significantly with height for both-side leaves in the autumn (Figure 2c,d). In summary, the highest photosynthetic traits were shown in leaves grown in the MS or UN position rather than the US position, which implies that the scaling of photosynthetic traits with the PARsum was not linear. In terms of the Ci, conspicuous increases of 16.03% and 15.44% from summer to autumn were shown in the US and MN positions, respectively, whereas no disparities existed among canopy positions at the first sampling (Figure 2g,h). In addition, no change was detected in the Cc across heights or orientations over the two campaigns (Table 1).
Figure 4 illustrates the PARsum responses of gas exchange and chlorophyll fluorescence parameters at the first measuring with higher light intensity. A quadratic polynomial was applied and well-fitted the Amax, gsw, gm, ΦPSII, and qP vs. PARsum correlation (R2 = 0.573, p = 0.022; R2 = 0.725, p = 0.003; R2 = 0.556, p = 0.026; R2 = 0.486, p = 0.049; R2 = 0.516, p = 0.038; Figure 4a–c), but it was not able to fit the relationships of Vcmax and Jmax with PARsum (p > 0.05; Figure 4d). Still, these photosynthetic traits all followed similar trends, that is, an initial increase within a certain range of PARsum and a decline after reaching the apex.
Figure 5 and Table S1 illustrate comparisons among canopy positions in other leaf functional traits. The LMA was positively related to the PARsum (R2 = 0.589, p = 0.018) and increased with height; hence, upper-canopy leaves showed a higher LMA than mid and lower leaves (Figure 5a). With regard to leaf stoichiometry, there were significant effects of height and height × orientation interaction on N content (including Nm and Na; Figure 5c,e). The Nm and Na both varied along the canopy in the same fashion as the gas exchange and chlorophyll fluorescence (i.e., there was a decline in the US position of the canopy), but only did the Nm show a significant quadratic correlation with the PARsum (R2 = 0.831, p < 0.001; Figure 5c). In contrast to the Nm, the Cm followed a shallower gradient throughout the canopy (only 0.91% of dispersion coefficient), though significant effects of canopy height and orientation were observed (Table S1). As a result, a significant quadratic correlation was also found between the ratio of Cm to Nm (C:N) and the PARsum (Figure 5f). As for pigment concentrations, chlorophyll (Chla+b) decreased markedly as canopy height increased, and they were lower in leaves growing on the southern face than on the northern face, similar to the variation in Car (Figure 5b,d). Finally, the PARsum had a significantly negative power relationships with Chla+b and Car (R2 = 0.648, p = 0.017; R2 = 0.662, p = 0.001). The gradual drop in the chlorophyll to carotenoid ratio (Chla+b:Car) was observed as canopy height increased on account of more dramatic changes in Chla+b, though there was no response to the PARsum (Table S1).

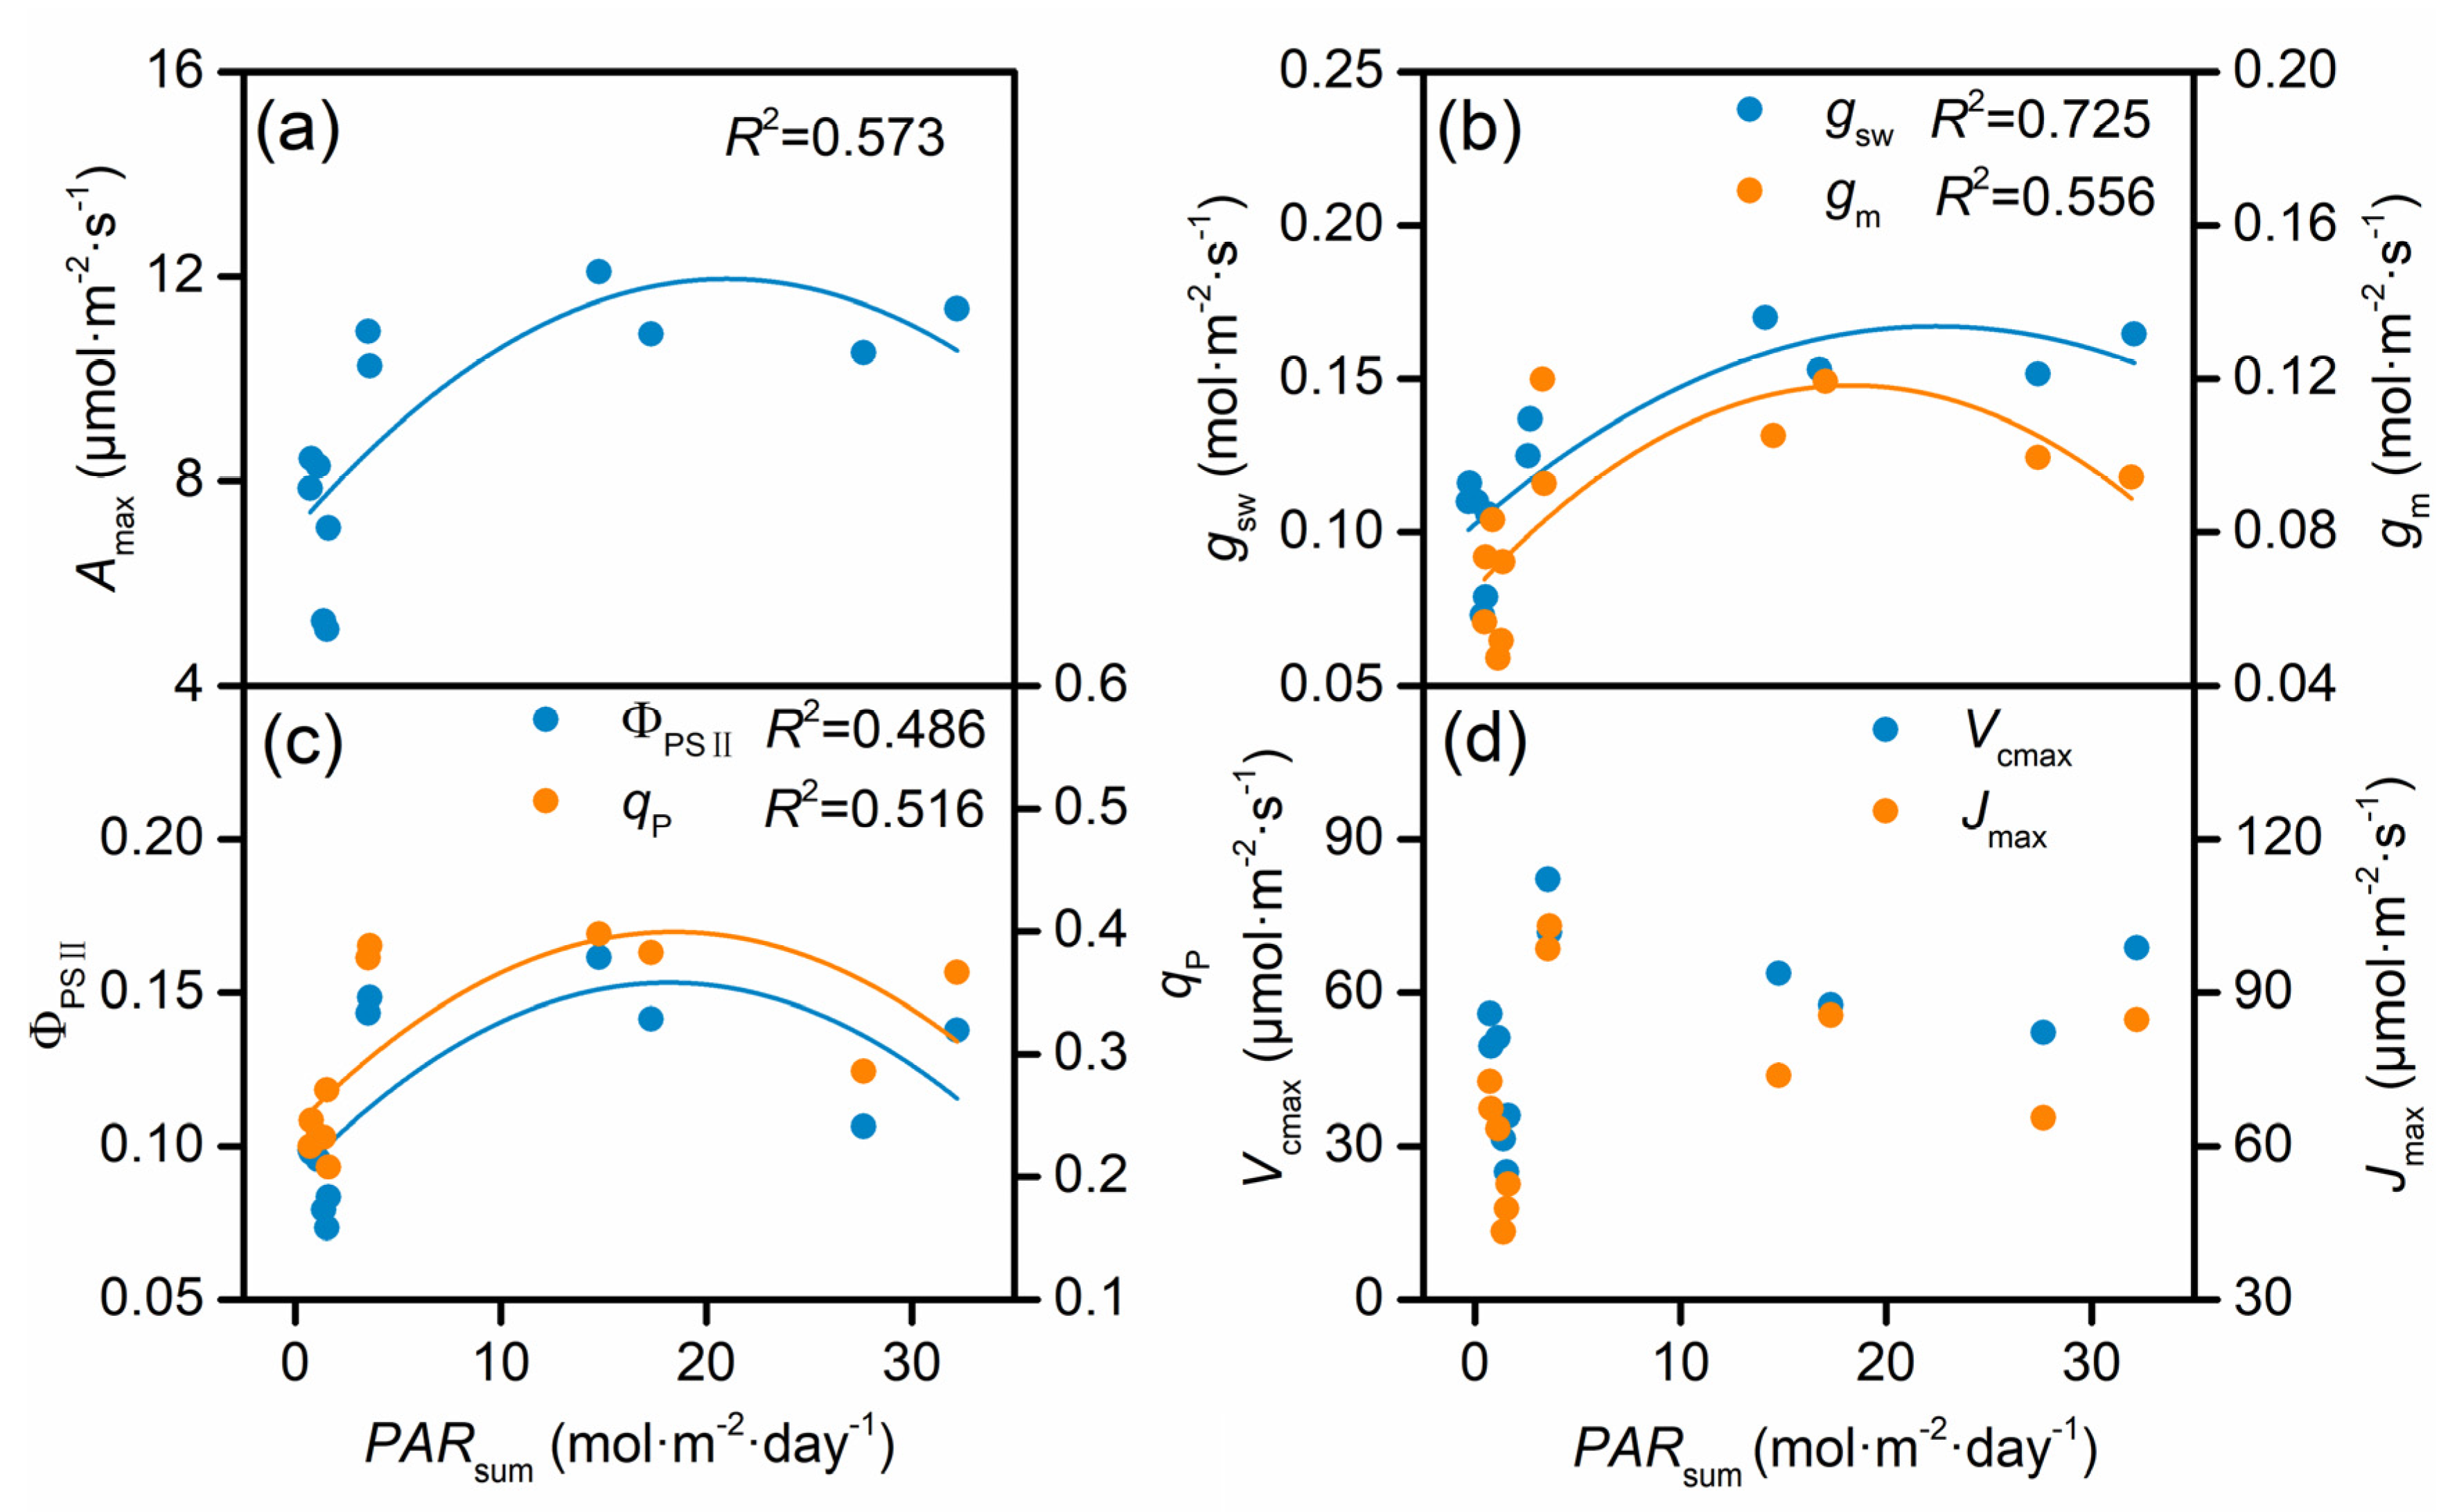
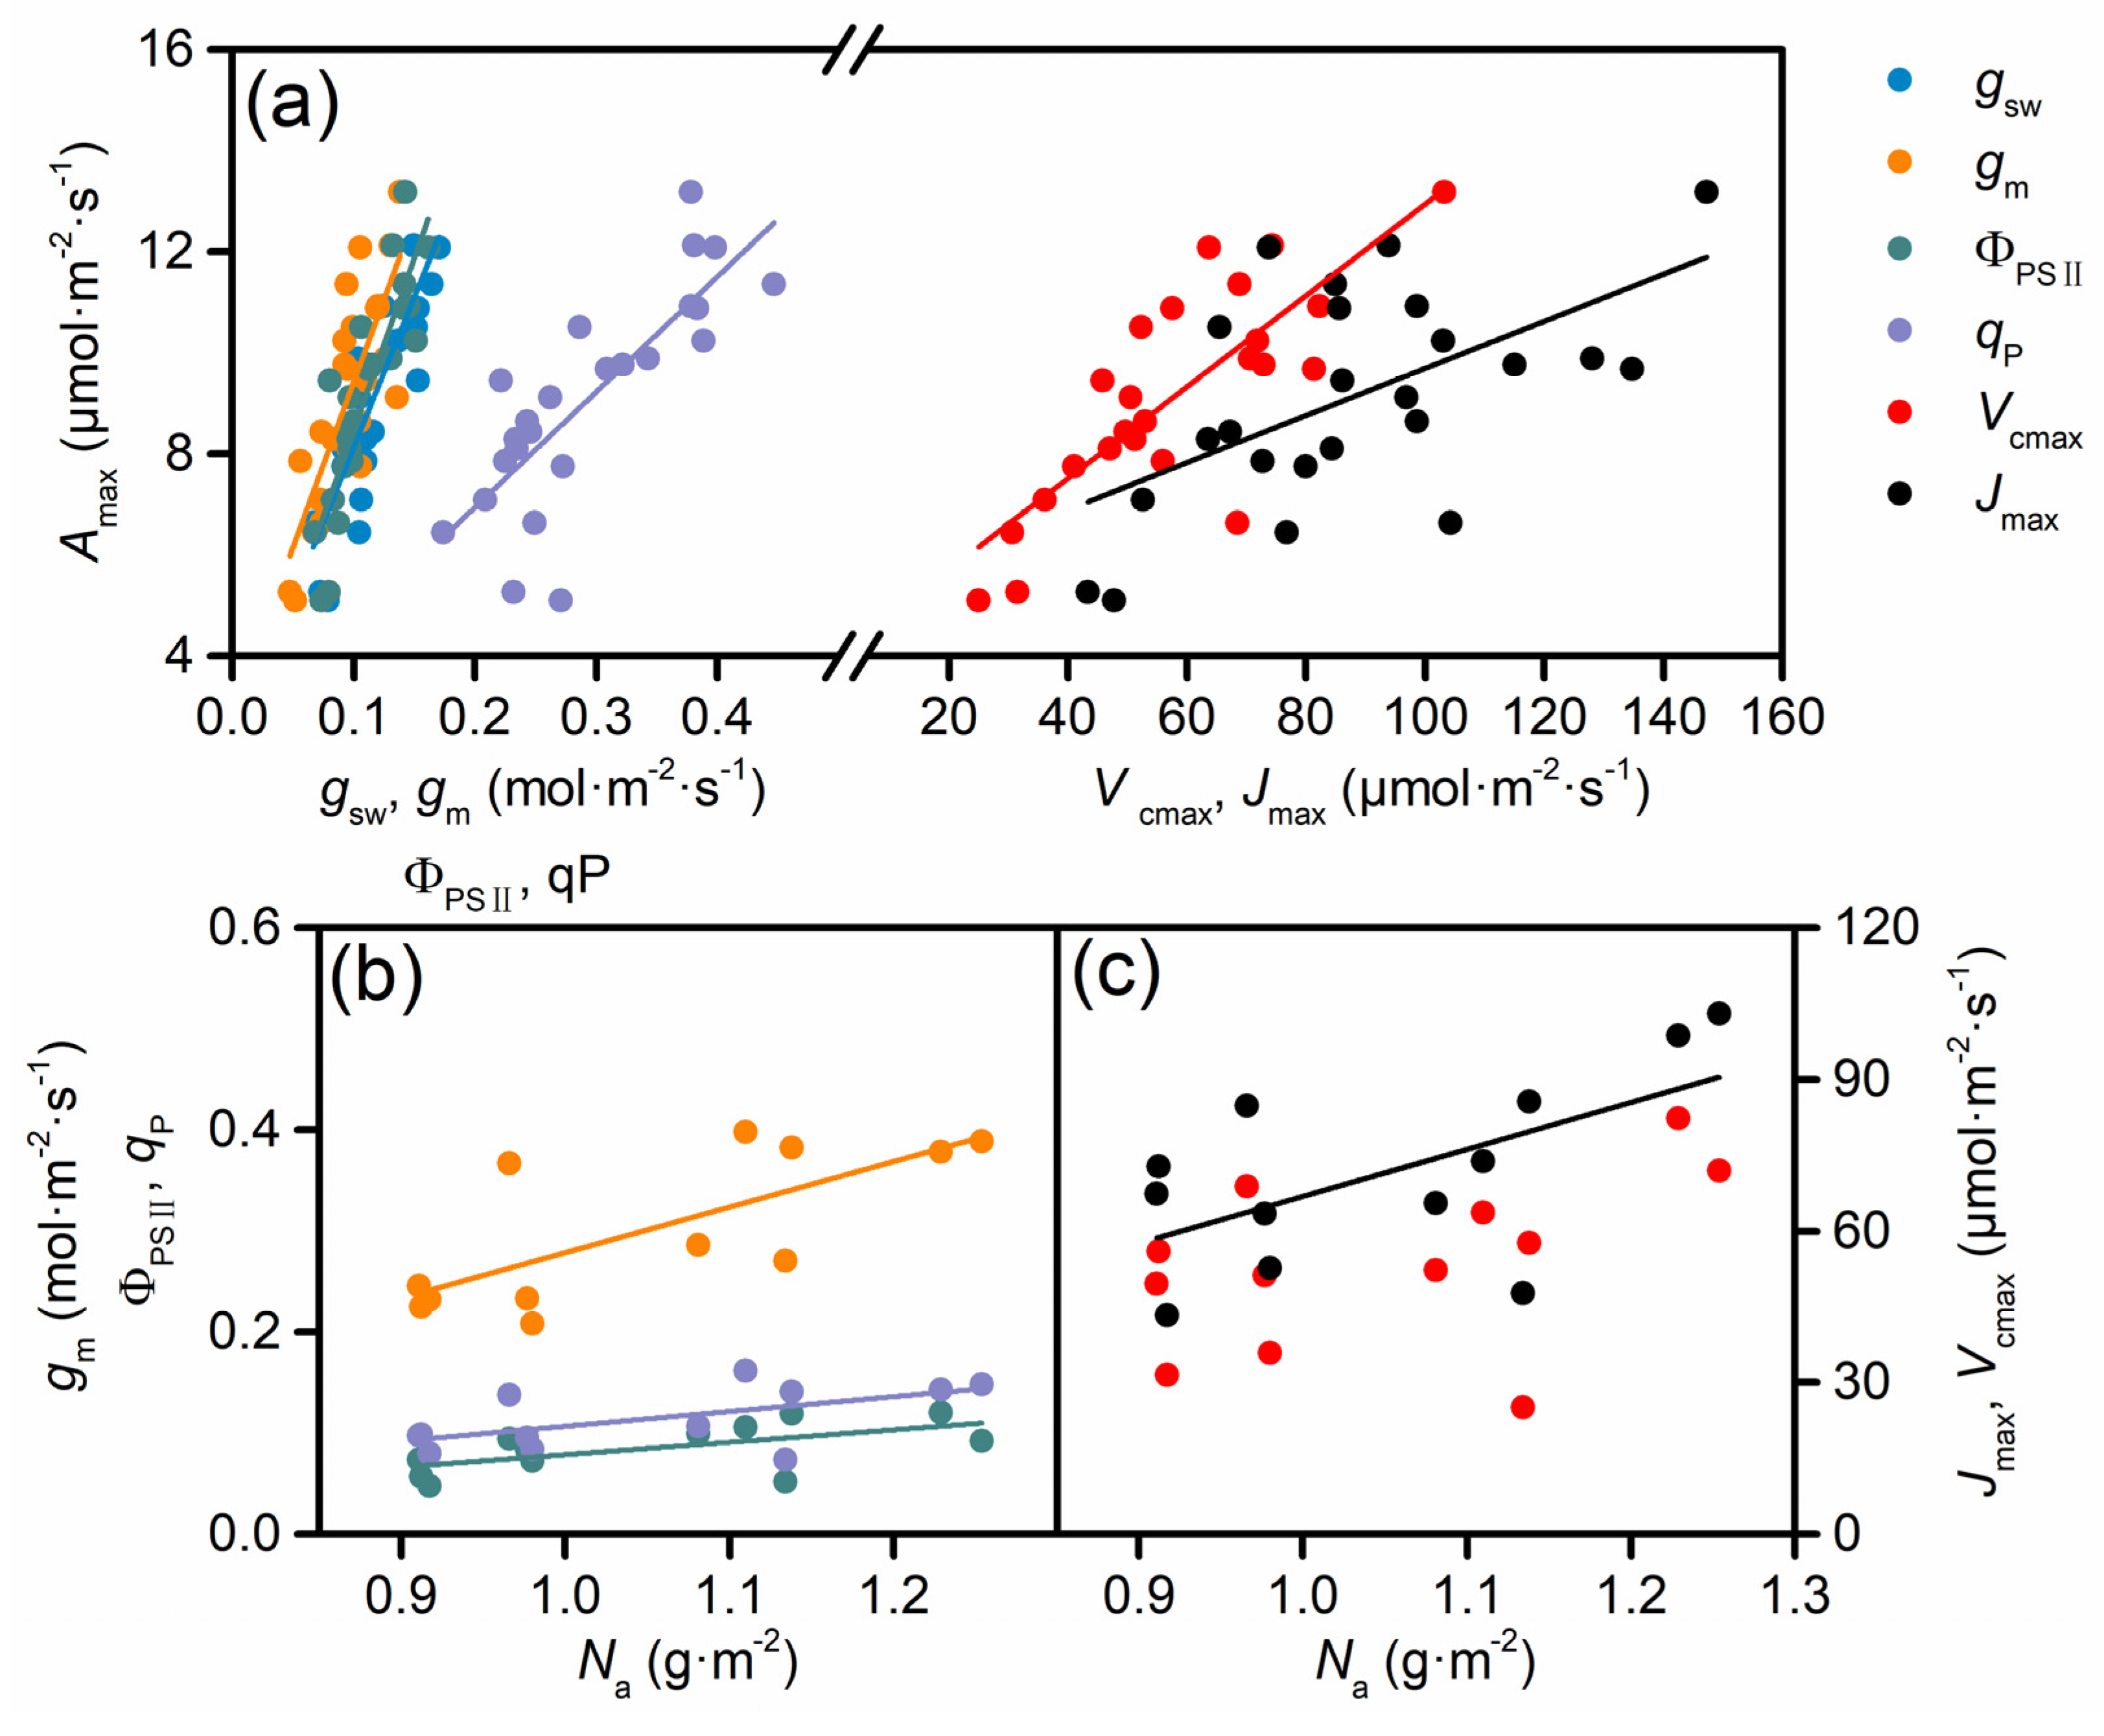
3.3. Correlations Among Amax and Other Photosynthetic Traits

Across canopy positions and sampling times, the Amax correlated significantly with the gsw, gm, Vcmax, Jmax, ΦPSII, and qP (R2 = 0.664, p < 0.001; R2 = 0.634, p < 0.001; R2 = 0.630, p < 0.001; R2 = 0.330, p = 0.001; R2 = 0.755, p < 0.001; R2 = 0.636, p < 0.001; Figure 6a). Meanwhile, the gm related negatively to the Ci-Cc drawdown and Chla+b (R2 = 0.278, p = 0.008; R2 = 0.519, p = 0.008; Figure S3a), and there was also a strong positive relationship between the Vcmax and the Jmax (R2 = 0.650, p < 0.001; Figure S3b). Additionally, the Na was positively associated with the gm, Jmax, ΦPSII, and qP (R2 = 0.369, p = 0.036; R2 = 0.364, p = 0.038; R2 = 0.346, p = 0.044; R2 = 0.545, p = 0.006; Figure 6b,c) but had no relationships with the Vcmax (p > 0.05; Figure 6c).

3.4. Quantitative Limitation to Photosynthesis Throughout the Canopy

Figure 7 presents the contribution of stomatal (SL), mesophyll (ML), and biochemical (BL) limitations to relative changes in the Amax throughout the canopy from August to October. MS position leaves reached the maximum Amax with the lowest total limitation, and upper leaves were close behind, limited to a certain extent by the photosynthetic process. The weaker light decreased photosynthesis to a greater extent. In summer, gm was the main contributor to photosynthetic limitations throughout the canopy, including for US position leaves (Figure 7a). But during the autumn period, the decline in the Amax was primarily triggered by stomatal and biochemical limitations due to the up-regulation in gm. BL explained the major relative changes in the Amax of upper sunlit leaves in particular (US position; Figure 7b).

4. Discussion

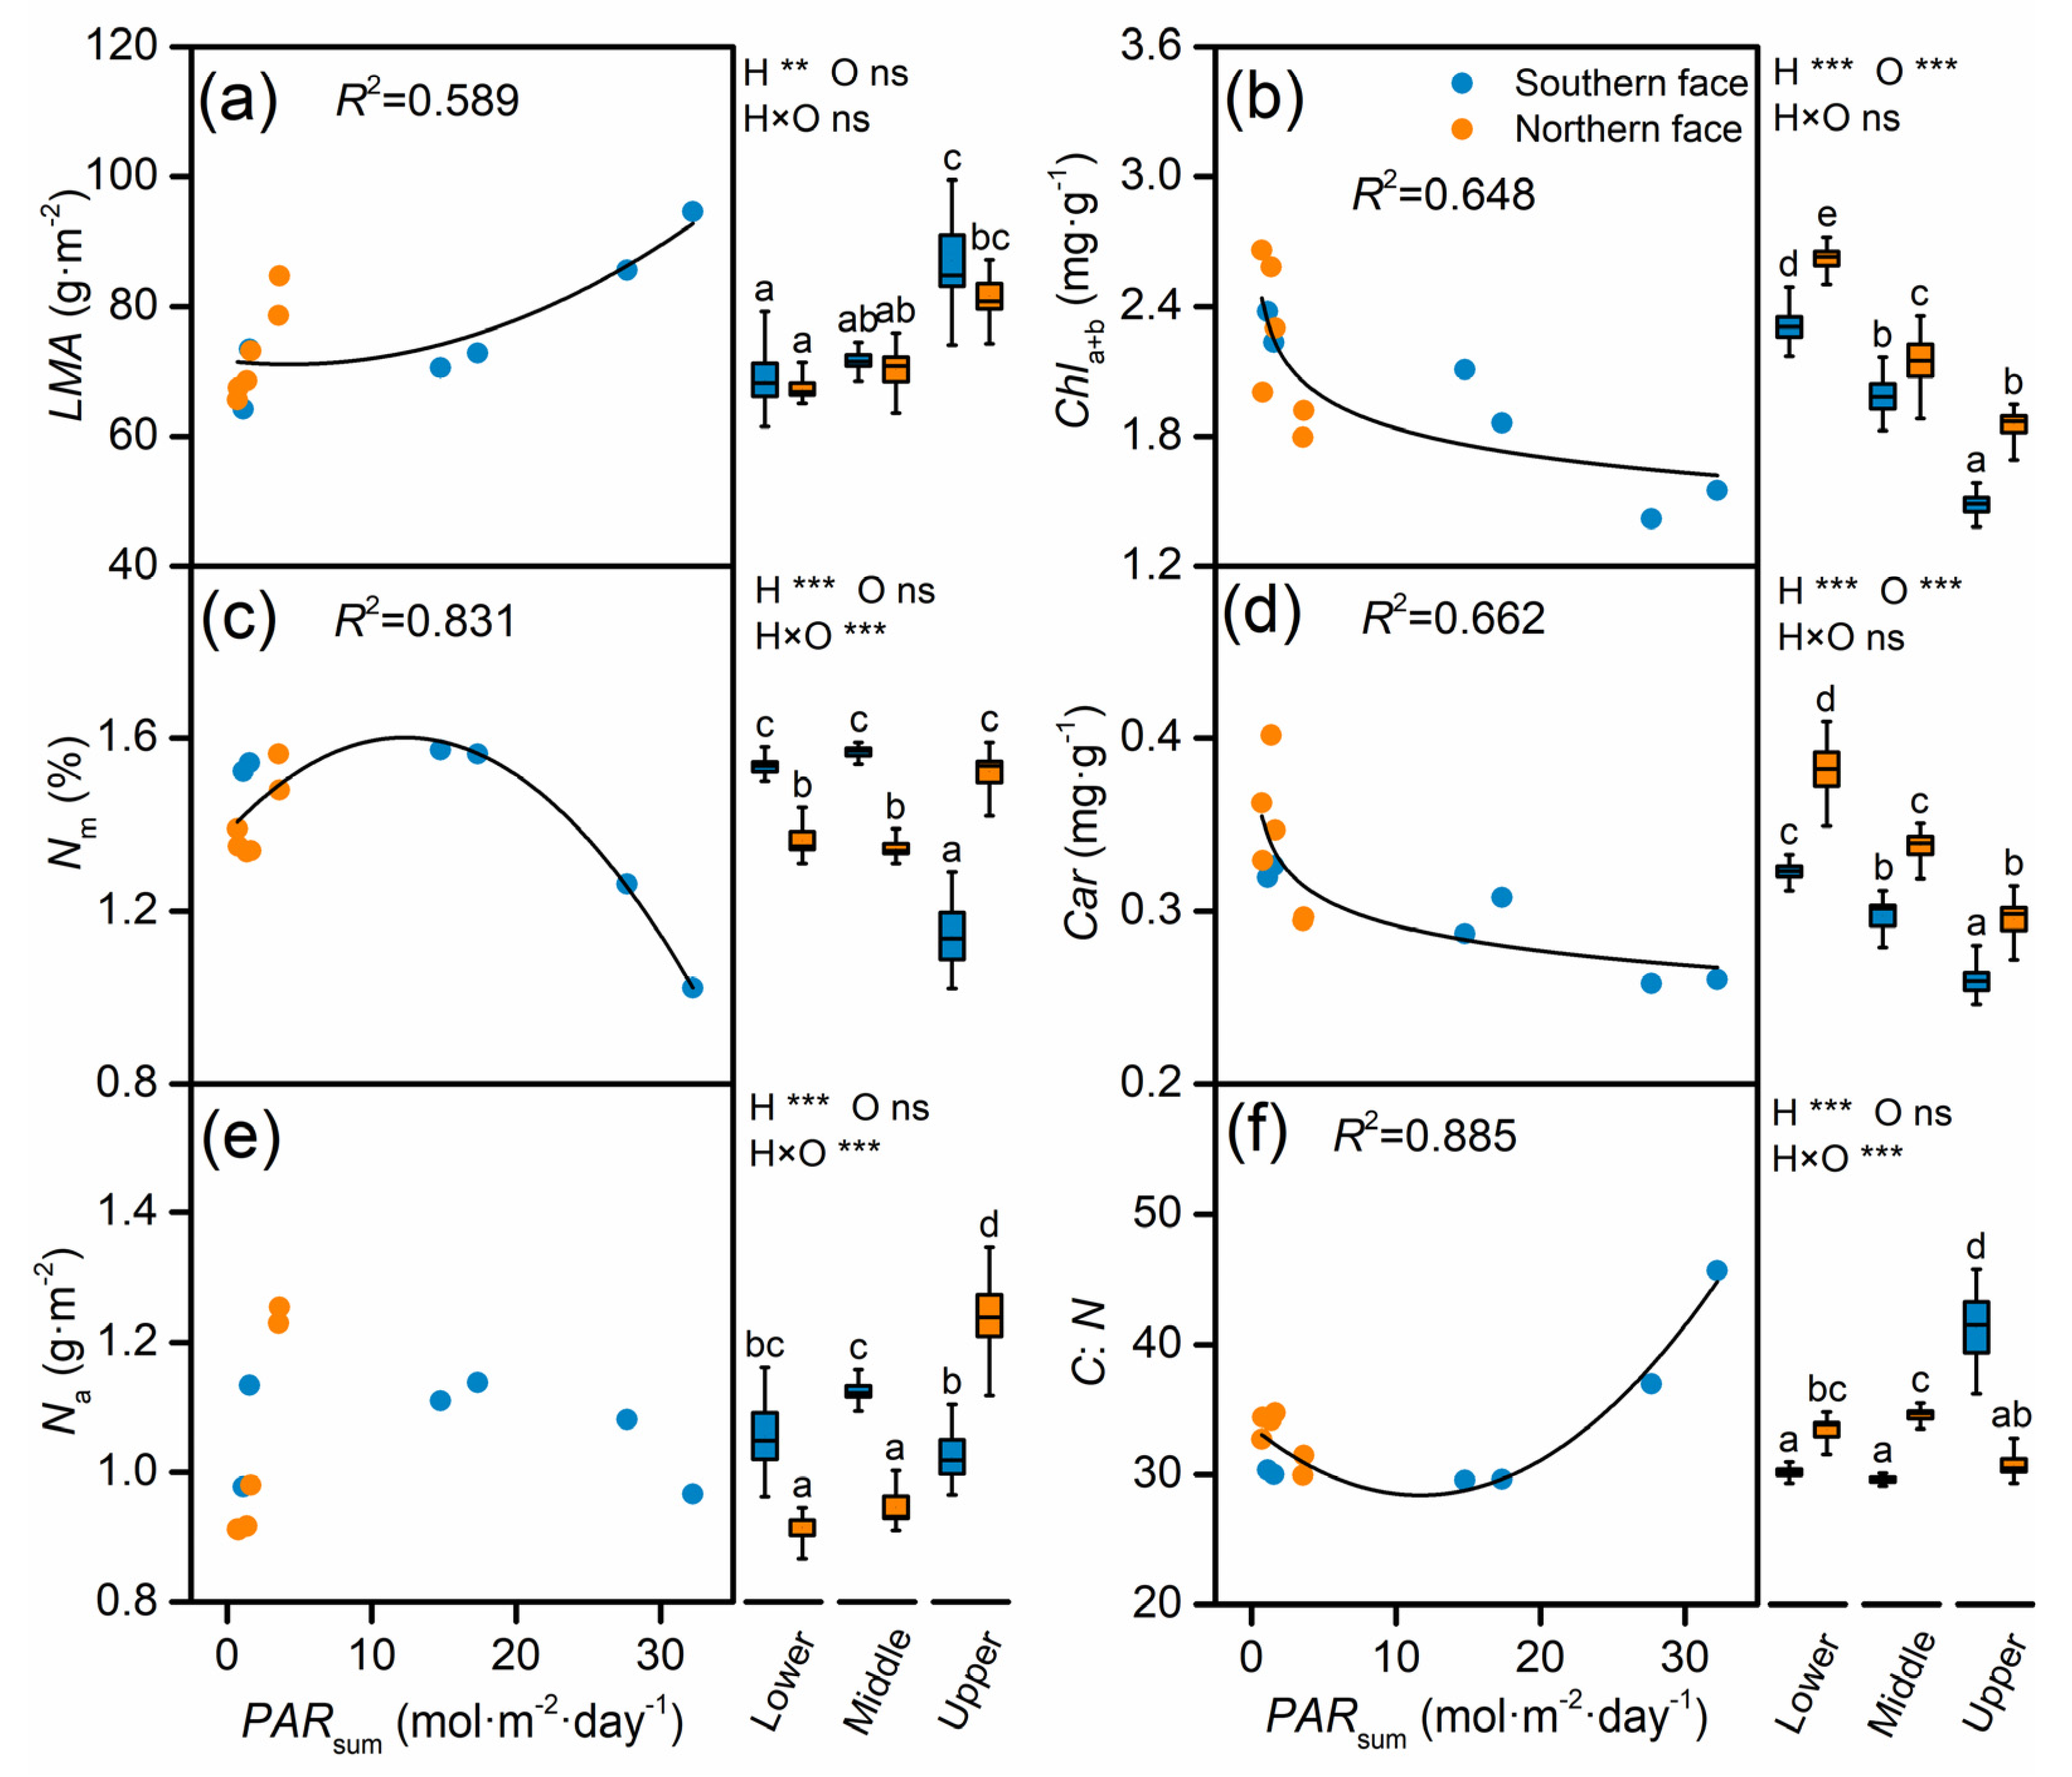
4.1. Foliar Physiological and Biochemical Traits Regulated by Light Availability

Our research investigated changes in leaf functional traits, such as the LMA, C and N contents, and pigment concentrations along the canopy of mature C. camphora. We found that the LMA was closely related to the amount of incident light, increasing significantly as canopy height increased, in accordance with previous research [35]. Conversely, the Nm was notably constrained in the sunlit leaves of the upper canopy and showed a substantial decline. While some studies suggested that the Nm remained constant regardless of spatial irradiance heterogeneity within the canopy [42], the leaves with higher LMA—as characterized by thicker, denser structures with more palisade layers—tended to ‘dilute’ the Nm. This reveals a greater investment in leaf structure (such as cell wall development) rather than in photosynthesis (such as prevention of mesophyll damage from intense light and enhancing leaf resilience), as supported by our observation of a higher C:N ratio in corresponding canopy position leaves [43,44]. In contrast, the Na did not respond to light, primarily due to a counteracted effect of variations in the LMA and Nm. It was contrary to the views of Kenichi [8] and Jin et al. [45], who found that leaf LMA increased and Nm remained unchanged with the canopy height in natural forests, leading to the positive correlation between light and Na. This discrepancy may be attributed to species–specific differences in canopy structure and nitrogen distribution acclimating to their respective environments. We also observed an apparent intra-canopy light gradient to which pigments were responding. In line with previous studies on forest-grown trees, irradiance had significantly negative relationships with Chla+b and Car [46], thus indicating that shaded leaves require more light capture to improve photosynthetic efficiency [47,48]. In the upper-canopy leaves that were exposed to high light, more Car was invested than Chla+b (resulting in lower Chla+b:Car) so as to dissipate excess light energy and to protect the photosynthetic machinery [49,50].
Photosynthetic physiological and biochemical characteristics strongly varied with the light gradient, which are predetermined to scale up from the bottom to the top of canopy [51,52]. Contrary to our expectation, however, we observed that the Amax peaked in the south-facing leaves of the mid canopy, and it failed to acclimate to high light as full as the LMA in the upper sunlit leaves. Other photosynthetic parameters, such as the gsw, gm, ΦPSII, qP, Vcmax, and Jmax, simultaneously exhibited similar patterns to the Amax, declining in leaves at the corresponding position, and had a positive linear correlation with the Amax along the light gradient. Most parameters showed quadratic correlations with light, whereas the Vcmax and Jmax did not follow this pattern, mainly because the maximum values in leaves occurred under lower light conditions to avoid photoinhibition [53]. The decrease in the gsw and gm reflects the limitation of CO2 diffusion resistance on the photosynthetic rate in leaves. Since the photosynthetic biochemistry acts as the core driver of photosynthesis, the reduced energy conversion and transport efficiency (i.e., ΦPSII, qP, and Jmax) and limited RuBisCO (RuBP carboxylase) amount and activity (i.e., Vcmax) would also weaken photosynthetic efficiency. The upper sunlit canopy, as the ‘engine’ of light capture, determines the level of the whole canopy productivity. Any slight decline in photosynthetic capacity can be gradually amplified through resource allocation imbalance and hormone signal disorder, ultimately manifested as decreased biomass accumulation and abnormal growth of the plant [5].

4.2. Strategies of Canopy Resource Allocation to Photosynthetic Traits

The photosynthetic progress needs to be supported by sufficient nutrients, and leaf nitrogen is assumed to be crucial for the regulation of synthesis and the activity of photosynthetic organs [54,55]. The amount of RuBisCO that predominantly determines the Vcmax accounts for a large fraction of the total N in leaves, while N is allocated to electron transport system including cytochrome f and coupling factor [56,57]. The Vcmax and Jmax are closely coordinated to ensure that the energy supply from light harvesting and electron transport meets the carboxylation demand [29]. Our data suggests that both the Vcmax and Jmax were constrained by N loss in the sunlit leaves of the upper canopy due to their simultaneous decreases, which resulted in reduced energy demand for the Calvin cycle, and paralleled descents in the ΦPSII and qP as a crucial protective strategy for the photosystem reaction center. Since the Jmax decreased more significantly than the Vcmax did, the lowered Jmax to Vcmax ratio displayed the imbalance between light-driven electron transport and RuBisCO carboxylation capacity, and contributed to avoiding photoinhibition under high light conditions [58]. However, we found a positive relationship of Na with the Jmax, ΦPSII, and qP, but not with the Vcmax. This may be due to intra-canopy gradients in other environmental conditions (not light availability) that also influence the Vcmax [4,59]. Furthermore, total N in leaves is also used for non-photosynthetic opponents (e.g., cell walls), which further complicates the relationship between N concentration and the Vcmax [60]. Additionally, total N likewise impacts the gm through the changes in anatomical structure and relative gene expression that regulate transmembrane transport [61,62,63], which concurs with our finding of a strong coupling between the Na and gm.
According to the hydraulic limitation hypothesis, as trees grow in stature, leaf water stress increases due to gravity and path-length resistance. Upper-canopy leaves are most suitable for absorbing sunlight, but they are also more prone to suffering from sun exposure, temperature, and wind stress especially in summer, exhibiting the greatest demand for water [42]. In our study, the upper sunlit leaves in camphor trees had a lower Amax and gsw compared with southern leaves of mid canopy, indicating that they are probably subject to a water deficit (i.e., the reduced leaf water potential) driven by both a high transpiration rate and insufficient water availability [17,27], as the gsw is regulated by hydraulic conductance [64]. Eventually, leaf growth and photosynthesis are restricted, even if the soil humidity is adequate [65]. The overgrowth in camphor tree height in overly dense stands (up to nearly 20 m high) intensifies the burden of hydraulic transport to upper leaves and accelerate water transpiration through stomata. In light of the trade-off between xylem hydraulic efficiency and safety, the sun leaves in the upper canopy could close stomata and mitigate the water loss to prevent cavitation or embolism of the branch xylem, albeit at the expense of reduced photosynthesis [65,66,67]. In conclusion, the concomitant decrease of the gsw and Nm in top canopy leaves reveals the optimal co-allocation of leaf nitrogen and hydraulic conductance in plant canopies, as the waste of excess nitrogen investment under the condition of hydraulic supply shortage can be avoided [17].

4.3. Effect of Season on Canopy Photosynthesis and Its Limitations

The seasonal effects on leaf photosynthetic traits can be highlighted through a comparison of the summer and autumn periods, which could be characterized as a modest growing season and a near-dormant season, respectively. The notable disparities were observed only in the gsw, gm, Ci, and Jmax, whereas the Amax remained unchanged. It was primarily due to no change in the CO2 supply in the carboxylation site (i.e., Cc) and the RuBisCO carboxylation rate that Calvin cycle was limited (i.e., Vcmax) in spite of the significant increase of the gm and Jmax. Many studies have documented a marked decrease in photosynthetic traits in woody species throughout the whole growing season due to leaf ontogeny and the severity of summer drought [35,53,68]. Our study, nonetheless, only focused on the current-year mature leaves of camphor trees, a broad-leaved evergreen species, which did not suffer from leaf senescence prior to defoliation nor from obvious summer drought from August to October. We therefore speculate that the seasonal fluctuations in the gsw, gm, Ci, and Jmax may be ascribed to the different rates (i.e., time scale) at which these photosynthetic traits acclimated to changes in the temperature and PAR, consistent with the findings of Yu et al. [60]. Actually, distinguishing between the contributions of leaf ontogenetic development and of climatic impacts at the seasonal scale remains a challenge because of their mutual dependence [69].
In our study, the gsw declined in camphor tree leaves as the air cooled, and this has also been reported by some researchers who have proposed that stomata close at lower temperatures to prevent water loss and energy consumption [70]. Because mid-canopy leaves are better protected from temperature and wind extremes and can transport water more effectively, some researchers have suggested that their increased gsw outperforms upper sunlit leaves, particularly when exposed to sunflecks [34,71]. This finding is corroborated by our results, where this phenomenon occurred during the summer period when apparent sunflecks persisted 2–4 h from mid-morning to noon each day (Figure S2). As the sunflecks diminished in autumn, due to the decreasing solar zenith angle, a corresponding stronger stomatal closure was observed. Our observations display the adaptability and sensitivity of stomata in camphor leaves to high-light conditions across a certain seasonal temperature range.
The gm is influenced by leaf anatomical traits (e.g., cell wall thickness and chloroplast surface area exposed to intercellular air space, Sc) and biochemical mechanisms (e.g., the quantity and activity of aquaporins, AQPs, and carbonic anhydrase, CA) [26]. AQPs, located in the chloroplast envelope and plasma membrane, facilitate CO2 diffusion into the stroma, whereas CA regulates pH value inside the chloroplast by interconversion between CO2 and HCO3 to enhance CO2 diffusion to the carboxylation site [72,73]. Previous studies suggest that the LMA increases gradually as season progresses, and a higher LMA could lead to an increased cell wall thickness and a reduced gm [74]. Instead, our study revealed the marked enhancement in gm from summer to autumn, indicating that membrane permeabilities and cytosol probably dominate the variation in gm [75,76]. Bernacchi [39] suggested that the gm gradually declined at temperatures over 35 °C in Nicotiana, whereas other researchers found the reduced gm from around 27–29 °C to 40 °C in tree species [77,78,79]. Although our measurements were conducted at a mean maximum air temperature of 30.38 °C in summer, many sampling leaves were subjected to leaf temperatures exceeding 35 °C inside the cuvette, which may generate the deactivation of AQPs and CA proteins and finally lead to the significant reduction in gm of canopy leaves. The lower leaves with thicker chloroplasts were more prone to the decline in CA activity [80], consistent with our finding of the negative link between gm and Chla+b (Figure S3a).
In terms of photosynthetic biochemical capacity, we found that only the Jmax was significantly suppressed along the camphor canopy profile in summer, whereas the Vcmax did not vary seasonally. It indicates that the electron transport chain is more sensitive to high temperatures, thereby causing ATP shortage and RuBP regeneration limitation. In other words, the Jmax is more susceptible to environmental changes than the Vcmax, as was also supported by Kumarathunge [81]. The value of Ci is determined by an equilibrium between the CO2 supply from the atmosphere and the CO2 demand in the chloroplast. Its dependence on the simultaneous changes in stomatal opening (e.g., gsw) and photosynthetic capacity (e.g., Jmax) thereby accounts for the differences observed between the two seasons.
Based on the observations above, a quantitative limitation analysis was conducted to assess the effects of canopy position and seasonal climate on stomatal (SL), mesophyll (ML), and biochemical limitations (BL) to the Amax in camphor trees. It was found that the limitation to photosynthesis decreased with within-canopy light intensity. However, the relative contributions were distinct between summer vs. autumn periods, though small differences were observed in the Amax. During the summer, characterized by higher temperatures, the gm was the main contributor to the reduction in the Amax of canopy leaves, whereas SL and BL became predominant when the weather grew cooler in autumn because of the rising gm. With regard to the decline in Amax of upper sunlit leaves, ML and BL could explain the main cause in summer and autumn, respectively. Bachofen et al. [4] reported stomatal limitation of photosynthesis in top European beech canopy leaves during spring, while Cano et al. [35] identified both the gs and gm as the key limitations during summer. Instead, Crous et al. [33] did not detect canopy differences in the gm and gs of mature eucalyptus leaves. It is possible that the differences in photosynthetic limitations along the canopy can be attributed to species-specific physiological responses to climate.

5. Conclusions

Here, we showed the significant effect that canopy position and season have on most of the leaf photosynthetic properties during the summer and autumn seasons in dense stands of mature camphor trees (Cinnamomum camphora). Different from the variations in the LMA and C content, the key gas exchange and chlorophyll fluorescence parameters increased along the canopy merely within a certain range of irradiance. In spite of being exposed to high light, the upper sunlit leaves exhibited a limited photosynthetic process (i.e., lower Amax, gsw, gm, qP, ΦPSII, Jmax and Vcmax), which was generated by nitrogen loss and water deficit. On the other hand, despite the significant differences in the gsw, Ci, gm, and Jmax between two seasons, the Amax did not respond to seasonality due to there being no variation in CO2 supply in the carboxylation site (Cc) and RuBisCO carboxylation rate that limits the Calvin cycle (Vcmax). From the perspective of quantitative limitation analysis, our findings highlight that mesophyll and biochemical limitation contribute the most to the Amax decrease in summer and autumn, respectively. It is recommended to conduct the moderate regulation and management of stand density for mature forests. These findings are vital for the accurate prediction of carbon sink capacity of urban vegetation in the region.

Supplementary Materials

The following supporting information can be downloaded at: https://www.mdpi.com/article/10.3390/f16040581/s1, Figure S1: Bamboo experimental platform established in Shanghai Botanical Garden; Figure S2: Diurnal variation in photosynthetic active radiation (PAR) across canopy positions between summer and autumn. US and UN, MS and MN, LS and LN represent the southern and northern faces at the upper, middle, and lower canopy layers, respectively. FL represents full light above the canopy; Figure S3: Linear regression relationships (a) between mesophlly conductance (gm) and the CO2 concentration difference from stomatal cavity to carboxylation site (Ci-Cc), chlorophyll content (Chla+b), and (b) between maximum carboxylation rate of RuBisCO at 25 °C (Vcmax) and potential maximum electron transport rate at 25 °C (Jmax) across canopy positions during summer and autumn seasons (or only during summer period); Table S1: Leaf morphology, stoichiometry and pigment across different canopy positions for mature C. camphor trees.

Author Contributions

Conceptualization, L.Z. and H.L.; methodology, L.Z. and H.L.; formal analysis, H.L.; data curation, H.L.; writing—original draft preparation, H.L.; writing—review and editing, H.L., L.Z. and W.Y.; visualization, H.L. and W.Y.; supervision, W.Y.; project administration, W.Y.; funding acquisition, W.Y. All authors have read and agreed to the published version of the manuscript.

Funding

The study has been funded by the Natural Science Foundation of Shanghai (22ZR1461000) and the National Natural Science Foundation of China (32471683, 31600352).

Data Availability Statement

The data that underlie this study are available upon request.

Acknowledgments

We thank Zhang Chao for helpful suggestions on the manuscript. Special thanks to Guo Jiankang for providing meteorological data. Finally, we thank Jiang Kai for English editing.

Conflicts of Interest

The authors declare no conflicts of interest.

References

  1. Ozanne, C.M.P.; Anhuf, D.; Boulter, S.L.; Keller, M.; Kitching, R.L.; Ko, C.; Meinzer, F.C.; Mitchell, A.W.; Nakashizuka, T.; Dias, P.L.S.; et al. Biodiversity meets the atmosphere: A global view of forest canopies. Science 2003, 301, 183–186. [Google Scholar] [CrossRef] [PubMed]
  2. Valladares, F. Light heterogeneity and plants: From ecophysiology to species coexistence and biodiversity. In Progress in Botany; Esser, K., Lüttge, U., Beyschlag, W., Hellwig, F., Eds.; Springer: Berlin/Heidelberg, Germany, 2003; pp. 439–471. [Google Scholar]
  3. Niinemets, Ü.; Anten, N.P.R. Packing the photosynthesis machinery: From leaf to canopy. In Photosynthesis in Silico; Laisk, A., Nedbal, L., Govindjee, Eds.; Springer: Berlin/Heidelberg, Germany, 2009; pp. 363–399. [Google Scholar]
  4. Bachofen, C.; D’Odorico, P.; Buchmann, N. Light and VPD gradients drive foliar nitrogen partitioning and photosynthesis in the canopy of European beech and silver fir. Oecologia 2020, 192, 323–339. [Google Scholar] [CrossRef] [PubMed]
  5. Niinemets, Ü. Photosynthesis and resource distribution through plant canopies. Plant Cell Environ. 2007, 30, 1052–1071. [Google Scholar] [CrossRef]
  6. Iio, A.; Fukasawa, H.; Nose, Y.; Kato, S.; Kakubari, Y. Vertical, horizontal and azimuthal variations in leaf photosynthetic characteristics within a Fagus crenata crown in relation to light acclimation. Tree Physiol. 2005, 25, 533–544. [Google Scholar] [CrossRef]
  7. Hanba, Y.T.; Kogami, H.; Terashima, I. The effect of growth irradiance on leaf anatomy and photosynthesis in Acer species differing in light demand. Plant Cell Environ. 2002, 25, 1021–1030. [Google Scholar] [CrossRef]
  8. Kenichi, Y. Irradiance heterogeneity within crown affects photosynthetic capacity and nitrogen distribution of leaves in Cedrela sinensis. Plant Cell Environ. 2010, 33, 750–758. [Google Scholar] [CrossRef]
  9. Thomas, S.C.; Winner, W.E. Photosynthetic differences between saplings and adult trees: An integration of field results by meta-analysis. Tree Physiol. 2002, 22, 117–127. [Google Scholar] [CrossRef]
  10. Valladares, F.; Pearcy, R.W. The functional ecology of shoot architecture in sun and shade plants of Heteromeles arbutifolia M. Roem., a Californian chaparral shrub. Oecologia 1998, 114, 1–10. [Google Scholar] [CrossRef]
  11. Farquhar, G.D.; von Caemmerer, S.; Berry, J.A. A biochemical model of photosynthetic CO2 assimilation in leaves of C3 species. Planta 1980, 149, 78–90. [Google Scholar] [CrossRef]
  12. Field, C. Allocating leaf nitrogen for the maximization of carbon gain: Leaf age as a control on the allocation program. Oecologia 1983, 56, 341–347. [Google Scholar] [CrossRef]
  13. Lloyd, J.; Wong, S.; Styles, J.M.; Batten, D.; Priddle, R.; Turnbull, C.; McConchie, C. Measuring and modelling whole-tree gas exchange. Funct. Plant Biol. 1995, 22, 987–1000. [Google Scholar] [CrossRef]
  14. Hirtreiter, J.N.; Potts, D.L. Canopy structure, photosynthetic capacity and nitrogen distribution in adjacent mixed and monospecific stands of Phragmites australis and Typha latifolia. Plant Ecol. 2012, 213, 821–829. [Google Scholar] [CrossRef]
  15. Niinemets, Ü.; Keenan, T.F.; Hallik, L. A worldwide analysis of within-canopy variations in leaf structural, chemical and physiological traits across plant functional types. New Phytol. 2015, 205, 973–993. [Google Scholar] [CrossRef]
  16. Niinemets, Ü. Variation in leaf photosynthetic capacity within plant canopies: Optimization, structural, and physiological constraints and inefficiencies. Photosyn Res. 2023, 158, 131–149. [Google Scholar] [CrossRef]
  17. Peltoniemi, M.S.; Duursma, R.A.; Medlyn, B.E. Co-optimal distribution of leaf nitrogen and hydraulic conductance in plant canopies. Tree Physiol. 2012, 32, 510–519. [Google Scholar] [CrossRef] [PubMed]
  18. Aasamaa, K.; Sõber, A.; Hartung, W.; Niinemets, Ü. Drought acclimation of two deciduous tree species of different layers in a temperate forest canopy. Trees 2004, 18, 93–101. [Google Scholar] [CrossRef]
  19. Sellin, A.; Õunapuu, E.; Kupper, P. Effects of light intensity and duration on leaf hydraulic conductance and distribution of resistance in shoots of silver birch (Betula pendula). Physiol. Plant. 2008, 134, 412–420. [Google Scholar] [CrossRef]
  20. Evans, J.R.; Poorter, H. Photosynthetic acclimation of plants to growth irradiance: The relative importance of specific leaf area and nitrogen partitioning in maximizing carbon gain. Plant Cell Environ. 2001, 24, 755–767. [Google Scholar] [CrossRef]
  21. Sellin, A.; Kupper, K. Effects of light availability versus hydraulic constraints on stomatal responses within a crown of silver birch. Oecoligia 2005, 142, 388–397. [Google Scholar] [CrossRef]
  22. Sellin, A.; Kupper, K. Effects of enhanced hydraulic supply for foliage on stomatal responses in little-leaf linden (Tilia cordata Mill). Eur. J. For. Res. 2007, 126, 241–251. [Google Scholar] [CrossRef]
  23. Niinemets, Ü. Optimization of foliage photosynthetic capacity in tree canopies: Towards identifying missing constraints. Tree Physiol. 2012, 32, 505–509. [Google Scholar] [CrossRef] [PubMed]
  24. Xiong, D.L.; Douthe, C.; Flexas, J. Differential coordination of stomatal conductance, mesophyll conductance and leaf hydraulic conductance in response to changing light across species: Coordination of CO2 diffusion and H2O transport inside leaves. Plant Cell Environ. 2017, 41, 436–450. [Google Scholar] [CrossRef] [PubMed]
  25. Ubierna, N.; Gandin, A.; Cousins, A. The response of mesophyll conductance to short-term variation in CO2 in the C4 plants Setaria viridis and Zea mays. J. Exp. Bot. 2018, 69, 1159–1170. [Google Scholar] [CrossRef] [PubMed]
  26. Flexas, J.; Ribas-Carbo, M.; Diaz-Espejo, A.; Galmés, J.; Medrano, H. Mesophyll conductance to CO2: Current knowledge and future prospects. Plant Cell Environ. 2008, 31, 602–621. [Google Scholar] [CrossRef]
  27. Li, S.L.; Tan, T.T.; Fan, Y.F.; Muhammad Ali, R.; Wang, Z.L.; Wang, B.B.; Zhang, J.W.; Tan, X.M.; Chen, P.; Iram, S.; et al. Responses of leaf stomatal and mesophyll conductance to abiotic stress factors. J. Integr. Agric. 2022, 21, 2787–2804. [Google Scholar] [CrossRef]
  28. Grassi, G.; Meir, P.; Cromer, R.; Tompkins, D.; Jarvis, P.G. Photosynthetic parameters in seedlings of Eucalyptus grandis as affected by rate of nitrogen supply. Plant Cell Environ. 2002, 25, 1677–1688. [Google Scholar] [CrossRef]
  29. Bachofen, C.; Hülsmann, L.; Revil, A.; Buchmann, N.; D’Odorico, P. Accounting for foliar gradients in Vcmax and Jmax improves estimates of net CO2 exchange of forests. Agric. For. Meteorol. 2022, 314, 108771. [Google Scholar] [CrossRef]
  30. Grassi, G.; Magnani, F. Stomatal, mesophyll conductance and biochemical limitations to photosynthesis as affected by drought and leaf ontogeny in ash and oak trees. Plant Cell Environ. 2005, 28, 834–849. [Google Scholar] [CrossRef]
  31. Walker, A.P.; Quaife, T.; van Bodegom, P.M.; de Kauwe, M.G.; Keenan, T.F.; Joiner, J.; Lomas, M.R.; MacBean, N.; Xu, C.; Yang, X.; et al. The impact of alternative trait-scaling hypotheses for the maximum photosynthetic carboxylation rate (Vcmax) on global gross primary production. New Phytol. 2017, 215, 1370–1386. [Google Scholar] [CrossRef]
  32. Guo, J.M.; Beverly, D.P.; Ewers, B.E.; Williams, D.G. Stomatal, mesophyll and biochemical limitations to photosynthesis and their relationship with leaf structure over an elevation gradient in two conifers. Photosyn Res. 2023, 157, 85–101. [Google Scholar] [CrossRef]
  33. Crous, K.Y.; Campany, C.; López, R.; Cano, F.J.; Ellsworth, D.S. Canopy position affects photosynthesis and anatomy in mature Eucalyptus trees in elevated CO2. Tree Physiol. 2020, 41, 206–222. [Google Scholar] [CrossRef]
  34. Campany, C.E.; Tjoelker, M.G.; von Caemmerer, S.; Duursma, R.A. Coupled response of stomatal and mesophyll conductance to light enhances photosynthesis of shade leaves under sunflecks. Plant Cell Environ. 2016, 39, 2762–2773. [Google Scholar] [CrossRef] [PubMed]
  35. Cano, F.J.; Sánchez-Gómez, D.; Rodríguez-Calcerrada, J.; Warren, C.R.; Gil, L.; Aranda, I. Effects of drought on mesophyll conductance and photosynthetic limitations at different tree canopy layers. Plant Cell Environ. 2013, 36, 1961–1980. [Google Scholar] [CrossRef]
  36. Zhong, J.J.; Li, X.M.; Wang, B.Y.; Xu, X.B.; Yan, W. Investigation and Analysis of the Woody Plants in Shanghai Parks. Chin. Landsc. Archit. 2019, 35, 123–127. (In Chinese) [Google Scholar] [CrossRef]
  37. Evans, J.R.; Loreto, F. Acquisition and diffusion of CO2 in higher plant leaves. In Photosynthesis: Physiology and Metabolism; Leegood, R.C., Sharkey, T.D., von Caemmerer, S., Eds.; Kluwer Academic: Dordrecht, The Netherland, 2000; pp. 321–351. [Google Scholar]
  38. Harley, P.C.; Loreto, F.; Dimarco, G.; Sharkey, T.D. Theoretical considerations when estimating the mesophyll conductance to CO2 flux by analysis of the response of photosynthesis to CO2. Plant Physiol. 1992, 98, 1429–1436. [Google Scholar] [CrossRef] [PubMed]
  39. Bernacchi, C.J.; Portis, A.R.; Nakano, H.; von Caemmerer, S.; Long, S.P. Temperature response of mesophyll conductance. Implications for the determination of Rubisco enzyme kinetics and for limitations to photosynthesis in vivo. Plant Physiol. 2002, 130, 1992–1998. [Google Scholar] [CrossRef]
  40. Bernacchi, C.J.; Pimentel, C.; Longi, S.P. In vivo temperature response functions of parameters required to model RuBP-limited photosynthesis. Plant Cell Environ. 2003, 26, 1419–1430. [Google Scholar] [CrossRef]
  41. Lichtenthaler, H.K.; Wellburn, A.R. Determinations of total carotenoids and chlorophylls a and b of leaf extracts in different solvents. Biochem. Soc. Trans. 1983, 11, 591–592. [Google Scholar] [CrossRef]
  42. Schmiege, S.C.; Griffin, K.L.; Boelman, N.T.; Vierling, L.A.; Bruner, S.G.; Min, E.; Maguire, A.J.; Jensen, J.; Eitel, J.U.H. Vertical gradients in photosynthetic physiology diverge at the latitudinal range extremes of white spruce. Plant Cell Environ. 2022, 46, 45–63. [Google Scholar] [CrossRef]
  43. Warren, C.R.; Adams, M.A. Evergreen trees do not maximize instantaneous photosynthesis. Trends Plant Sci. 2004, 9, 270–274. [Google Scholar] [CrossRef]
  44. González-Zurdo, P.; Escudero, A.; Babiano, J.; García-Ciudad, A.; Mediavilla, S. Costs of leaf reinforcement in response to winter cold in evergreen species. Tree Physiol. 2016, 36, 273–286. [Google Scholar] [CrossRef] [PubMed]
  45. Jin, D.; Cao, X.; Ma, K. Leaf functional traits vary with the adult height of plant species in forest communities. J. Plant Ecol. 2014, 7, 68–76. [Google Scholar] [CrossRef]
  46. Gardner, A.; Ellsworth, D.S.; Pritchard, J.; MacKenzie1, A.R. Are chlorophyll concentrations and nitrogen across the vertical canopy profile affected by elevated CO2 in mature Quercus trees? Trees 2022, 36, 1797–1809. [Google Scholar] [CrossRef]
  47. Sharwood, R.E.; Crous, K.Y.; Whitney, S.M.; Ellsworth, D.S.; Ghannoum, O. Linking photosynthesis and leaf N allocation under future elevated CO2 and climate warming in Eucalyptus globulus. J. Exp. Bot. 2017, 68, 1157–1167. [Google Scholar] [CrossRef]
  48. Lennon, A.M.; Lewis, V.R.; Farrell, A.D.; Umaharan, P. Photochemical responses to light in sun and shade leaves of Theobroma cacao L. (West African Amelonado). Sci. Hortic. 2021, 276, 109747. [Google Scholar] [CrossRef]
  49. Ruban, A.V. Evolution under the sun: Optimizing light harvesting in photosynthesis. J. Exp. Bot. 2015, 66, 7–23. [Google Scholar] [CrossRef]
  50. Magney, T.S.; Eitel, J.U.H.; Griffin, K.L.; Boelman, N.T.; Greaves, H.E.; Prager, C.M.; Logan, B.A.; Zheng, G.; Ma, L.; Fortin, E.A.; et al. LiDAR canopy radiation model reveals patterns of photosynthetic partitioning in an Arctic shrub. Agric. For. Meteorol. 2016, 221, 78–93. [Google Scholar] [CrossRef]
  51. Crous, K.Y.; Ellsworth, D.S. Canopy position affects photosynthetic adjustments to long-term elevated CO2 concentration (FACE) in aging needles in a mature Pinus taeda forest. Tree Physiol. 2004, 24, 961–970. [Google Scholar] [CrossRef] [PubMed]
  52. Rogers, A.; Medlyn, B.E.; Dukes, J.S.; Bonan, G.; von Caemmerer, S.; Dietze, M.C.; Zaehle, S. A roadmap for improving the representation of photosynthesis in Earth system models. New Phytol. 2017, 213, 22–42. [Google Scholar] [CrossRef]
  53. Bauerle, W.L.; McCullough, C.; Iversen, M.; Hazlett, M. Leaf age and position effects on quantum yield and photosynthetic capacity in Hemp crowns. Plants 2020, 9, 271. [Google Scholar] [CrossRef]
  54. Warren, J.M.; Jensen, A.M.; Medlyn, B.E.; Norby, R.J.; Tissue, D.T. Carbon dioxide stimulation of photosynthesis in Liquidambar styracifua is not sustained during a 12-year field experiment. AoB Plants 2015, 7, plu074. [Google Scholar] [CrossRef] [PubMed]
  55. Xiong, D.L.; Liu, X.; Liu, L.; Douthe, C.; Li, Y.; Peng, S.B.; Liang, H.J. Rapid responses of mesophyll conductance to changes of CO2 concentration, temperature and irradiance are affected by N supplements in rice. Plant Cell Environ. 2015, 38, 2541–2550. [Google Scholar] [CrossRef] [PubMed]
  56. Quebbeman, J.A.; Ramirez, J.A. Optimal allocation of leaf-level nitrogen: Implications for covariation of Vcmax and Jmax and photosynthetic downregulation. J. Geophys. Res. Biogeosci. 2016, 121, 2464–2475. [Google Scholar] [CrossRef]
  57. Rajsnerová, P.; Klem, K.; Holub, P.; Novotná, K.; Večeřová, K.; Kozáčiková, M.; Rivas-Ubach, A.; Sardans, J.; Marek, M.V.; Peñuelas, J.; et al. Morphological, biochemical and physiological traits of upper and lower canopy leaves of European beech tend to converge with increasing altitude. Tree Physiol. 2015, 35, 47–60. [Google Scholar] [CrossRef]
  58. Walker, A.P.; Beckerman, A.P.; Gu, L.; Kattge, J.; Cernusak, L.A.; Domingues, T.F.; Scales, J.C.; Wohlfahrt Georg Wullschleger, S.D.; Woodward, F.I. The relationship of leaf photosynthetic traits -Vcmax and Jmax- to leaf nitrogen, leaf phosphorus, and specific leaf area: A meta-analysis and modeling study. Ecol. Evol. 2014, 4, 3218–3235. [Google Scholar] [CrossRef]
  59. Buckley, T.N. Optimal carbon partitioning helps reconcile the apparent divergence between optimal and observed canopy profiles of photosynthetic capacity. New Phytol. 2021, 230, 2246–2260. [Google Scholar] [CrossRef]
  60. Yu, L.; Luo, X.; Croft, H.; Rogers, C.A.; Chen, J.M. Seasonal variation in the relationship between leaf chlorophyll content and photosynthetic capacity. Plant Cell Environ. 2024, 47, 3953–3965. [Google Scholar] [CrossRef]
  61. Bown, H.E.; Watt, M.S.; Mason, E.G.; Cliton, P.W.; Whitehead, D. The influence of nitrogen and phosphorus supply and genotype on mesophyll conductance limitations to photosynthesis in Pinus radiata. Tree Physiol. 2009, 29, 1143–1151. [Google Scholar] [CrossRef]
  62. Hacke, U.G.; Plavcová, L.; Almeida-Rodriguez, A.; King-Jones, S.; Zhou, W.; Cooke, J.E.K. Influence of nitrogen fertilization on xylem traits and aquaporin expression in stems of hybrid poplar. Tree Physiol. 2010, 30, 1016–1025. [Google Scholar] [CrossRef]
  63. Ligaba, A.; Katsuhara, M.; Shibasaka, M.; Djira, G. Abiotic stresses modulate expression of major intrinsic proteins in barley (Hordeum vulgare). C R. Biol. 2011, 334, 127–139. [Google Scholar] [CrossRef]
  64. Flexas, J.; Scoffoni, C.; Gago, J.; Sack, L. Leaf mesophyll conductance and leaf hydraulic conductance: An introduction to their measurement and coordination. J. Exp. Bot. 2013, 64, 3965–3981. [Google Scholar] [CrossRef]
  65. Ryan, M.J.; Yoder, B.J. Hydraulic limits to tree height and tree growth. BioSci. 1997, 47, 235–242. [Google Scholar] [CrossRef]
  66. Domec, J.C.; Lachenbruch, B.; Meinzer, F.C.; Woodruff, D.R.; Warren, J.M.; McCulloh, K.A. Maximum height in a conifer is associated with conflicting requirements for xylem design. Proc. Natl. Acad. Sci. USA 2008, 105, 12069–12074. [Google Scholar] [CrossRef]
  67. Givnish, T.J.; Wong, S.C.; Stuart-Williams, H.; Holloway-Phillips, M.; Farquhar, G.D. Determinants of maximum tree height in Eucalyptus species along a rainfall gradient in Victoria, Australia. Ecology 2014, 95, 2991–3007. [Google Scholar] [CrossRef]
  68. Wright, I.J.; Leishman, M.R.; Read, C.; Westoby, M. Gradients of light availability and leaf traits with leaf age and canopy position in 28 Australian shrubs and trees. Funct. Plant Biol. 2006, 33, 407–419. [Google Scholar] [CrossRef] [PubMed]
  69. Yamashita, N.; Koike, N.; Ishida, A. Leaf ontogenetic dependence of light acclimation in invasive and native subtropical trees of different successional status. Plant Cell Environ. 2002, 25, 1341–1356. [Google Scholar] [CrossRef]
  70. Urban, J.; Ingwers, M.; McGuire, M.A.; Teskey, R. Increase in leaf temperature opens stomata and decouples net photosynthesis from stomatal conductance in Pinus taeda and Populus deltoides×nigra. J. Exp. Bot. 2017, 68, 1757–1767. [Google Scholar] [CrossRef]
  71. Buckley, T.N.; Martorell, S.; Diaz-Espejo, A.; Tomàs, M.; Medrano, H. Is stomatal conductance optimized over both time and space in plant crowns? A field test in grapevine (Vitis vinifera). Plant Cell Environ. 2014, 37, 2707–2712. [Google Scholar] [CrossRef]
  72. Uehlein, N.; Sperling, H.; Heckwolf, M.; Kaldenhoff, R. The Arabidopsis aquaporin PIP1;2 rules cellular CO2 uptake. Plant Cell Environ. 2012, 35, 1077–1083. [Google Scholar] [CrossRef]
  73. Momayyezi, M.; Guy, R.D. Substantial role for carbonic anhydrase in latitudinal variation in mesophyll conductance of Populus trichocarpa Torr. & Gray. Plant Cell Environ. 2017, 40, 138–149. [Google Scholar] [CrossRef]
  74. Tomás, M.; Flexas, J.; Copolovici, L.; Galmés, J.; Hallik, L.; Medrano, H.; Ribas-Carbó, M.; Tosens, T.; Vislap, V.; Niinemets, Ü. Importance of leaf anatomy in determining mesophyll diffusion conductance to CO2 across species: Quantitative limitations and scaling up by models. J. Exp. Bot. 2013, 64, 2269–2281. [Google Scholar] [CrossRef] [PubMed]
  75. Boex-Fontvieille, E.; Jossier, M.; Davanture, M.; Zivy, M.; Hodges, M.; Tcherkez, G. Differential protein phosphorylation regulates chloroplast movement in response to strong light and darkness in Arabidopsis thaliana. Plant Mol. Biol. Rep. 2014, 32, 987–1001. [Google Scholar] [CrossRef]
  76. Ouyang, W.; Struik, P.; Yin, X.; Yang, J. Stomatal conductance, mesophyll conductance, and transpiration efficiency in relation to leaf anatomy in rice and wheat genotypes under drought. J. Exp. Bot. 2017, 68, 5191–5205. [Google Scholar] [CrossRef]
  77. Pons, T.L.; Welschen, R.A.M. Midday depression of net photosynthesis in the tropical rainforest tree Eperua grandiflora: Contributions of stomatal and internal conductances, respiration and Rubisco functioning. Tree Physiol. 2003, 23, 937–947. [Google Scholar] [CrossRef] [PubMed]
  78. Warren, C.R.; Dreyer, E. Temperature response of photosynthesis and internal conductance to CO2: Results from two independent approaches. J. Exp. Bot. 2006, 57, 3057–3067. [Google Scholar] [CrossRef] [PubMed]
  79. Montpied, P.; Granier, A.; Dreyer, E. Seasonal time-course of gradients of photosynthetic capacity and mesophyll conductance to CO2 across a beech (Fagus sylvatica L.) canopy. J. Exp. Bot. 2009, 60, 2407–2418. [Google Scholar] [CrossRef]
  80. Tosens, T.; Niinemets, Ü.; Vislap, V.; Eichelmann, H.; Castro Díez, P. Developmental changes in mesophyll diffusion conductance and photosynthetic capacity under different light and water availabilities in Populus tremula: How structure constrains function. Plant Cell Environ. 2012, 35, 839–856. [Google Scholar] [CrossRef]
  81. Kumarathunge, D.P.; Medlyn, B.E.; Drake, J.E.; Tjoelker, M.G.; Aspinwall, M.J.; Battaglia, M.; Cano, F.J.; Carter, K.R.; Cavaleri, M.A.; Cernusak, L.A.; et al. Acclimation and adaptation components of the temperature dependence of plant photosynthesis at the global scale. New Phytol. 2019, 222, 768–784. [Google Scholar] [CrossRef]
Figure 1. (a) Maximum air temperature (Tmax) and daily precipitation (P) during measurement dates from late August to November of 2023. (b) Daily photosynthetic active radiation (PARsum) across camphor canopy positions during two campaigns. US and UN, MS and MN, LS and LN represent the southern and northern faces at the upper, middle, and lower canopy layers, respectively. FL represents full light above the canopy.
Forests 16 00581 g001
Figure 2. Effects of canopy position and season on gas exchange parameters for mature C. camphora trees. (a,b) Light-saturated photosynthesis (Amax), (c,d) stomatal conductance (gsw), (e,f) mesophyll conductance (gm), and (g,h) CO2 concentration in the intercellular air spaces (Ci) are given as mean ± SE (n = 4–6). Letters represent a significant difference across canopy positions and seasons according to Duncan’s test (α = 0.05).
Forests 16 00581 g002
Figure 3. Effects of canopy position and season on biochemical traits for mature C. camphora trees. (a,b) Maximum carboxylation rate at 25 °C (Vcmax), (c,d) potential maximum electron transport rate at 25 °C (Jmax), (e,f) actual photochemical efficiency of PSII (ΦPSII), and (g,h) photochemical quenching coefficient of PSII (qP) are given as mean ± SE (n = 4–6). Letters represent a significant difference across canopy positions and seasons according to Duncan’s test (α = 0.05).
Forests 16 00581 g003
Figure 4. Correlations of daily photosynthetic active radiation (PARsum) with (a) light-saturated photosynthesis (Amax), (b) stomatal conductance (gsw), (b) mesophyll conductance (gm), (c) actual photochemical efficiency of PSII (ΦPSII), (c) photochemical quenching coefficient of PSII (qP) throughout the camphor tree canopy, (d) maximum carboxylation rate at 25 °C (Vcmax), and (d) potential maximum electron transport rate at 25 °C (Jmax). Regression lines are only shown for significant relationships (p < 0.05). Blue circles indicate Amax, gsw, ΦPSII, and Vcmax of canopy leaves, and orange circles indicate gm, qP, and Jmax.
Forests 16 00581 g004
Figure 5. Correlations of daily photosynthetic active radiation (PARsum) with (a) leaf dry mass per area (LMA), (b) chlorophyll concentration (Chla+b), (c,e) mass- (Nm) and area-based (Na) nitrogen content, (d) carotenoid concentration (Car), and (f) ratio of Cm to Nm (C:N) throughout the camphor tree canopy. Blue and orange circles represent the southern and northern faces of the canopy, respectively. Regression lines are only shown for significant relationships (p < 0.05). The boxplots of the leaf traits are included on the right side of the scatter subplots, and both share the same Y-axis. Lowercase letters represent a significant difference across canopy heights and orientations according to Duncan’s test (α = 0.05). Capital letters represent canopy height (H), orientation (O), and their interaction (H × O), whose significance is noted as ns p > 0.05, ** p < 0.01, and *** p < 0.001. All values are mean ± SE (n = 6).
Forests 16 00581 g005
Figure 6. Linear regression relationships (a) between light-saturated photosynthesis (Amax) and stomatal conductance (gsw), mesophyll conductance (gm), actual photochemical efficiency of PSII (ΦPSII) and photochemical quenching coefficient of PSII (qP), maximum carboxylation rate at 25 °C (Vcmax), potential maximum electron transport rate at 25 °C (Jmax). (b,c) Between nitrogen content on an area basis (Na) and ΦPSII, qP, gm, Vcmax, and Jmax across canopy positions during the summer and autumn seasons (or only during summer period). Regression lines are only shown for significant relationships (p < 0.05).
Forests 16 00581 g006
Figure 7. Quantitative limitation to light-saturated photosynthesis (Amax) among canopy positions during summer (a) and autumn (b). US and UN, MS and MN, LS and LN represent the southern and northern faces at the upper, middle, and lower canopy layers, respectively. SL, ML, and BL represent the contribution of stomatal, mesophyll, and biochemical limitations, respectively.
Forests 16 00581 g007
Table 1. F statistics from full-factorial mixed effect ANOVA for a main effect and interactions of canopy position and season on photosynthetic physiology and biochemistry. Variables analyzed were: light-saturated photosynthesis (Amax), stomatal conductance (gsw), mesophyll conductance (gm), CO2 concentration in the intercellular air spaces (Ci), CO2 concentration at the site of carboxylation (Cc), maximum carboxylation rate at 25 °C (Vcmax), potential maximum electron transport rate at 25 °C (Jmax), actual photochemical efficiency of PSII (ΦPSII), and photochemical quenching coefficient of PSII (qP).
DateCanopy HeightCanopy OrientationH × OD × H × O
Amax0.0711.73 ***13.53 **6.06 **0.32
gsw6.41 *10.34 **12.94 **1.741.98
gm13.23 **5.78 *8.29 **3.91 *1.13
Ci10.55 **2.750.2714.60 ***1.22
Cc0.500.650.493.250.83
Ci-Cc15.08 **0.280.010.041.63
Vcmax0.604.81 *0.5411.39 ***0.14
Jmax45.81 ***9.19 **0.0625.65 ***0.49
ΦPSII4.114.93 *2.3710.15 **1.79
qP2.955.23 *4.48 *8.03 **1.62
Significance is noted as * p < 0.05, ** p < 0.01, and *** p < 0.001 in the table. H, O, and D represent canopy height, canopy orientation, and measuring date, respectively.
Disclaimer/Publisher’s Note: The statements, opinions and data contained in all publications are solely those of the individual author(s) and contributor(s) and not of MDPI and/or the editor(s). MDPI and/or the editor(s) disclaim responsibility for any injury to people or property resulting from any ideas, methods, instructions or products referred to in the content.

