Article

Genome-Wide Identification of Phenylacetaldehyde Reductase Genes and Molecular Docking Simulation Study of OePAR1 in Olives

1
State Key Laboratory of Tree Genetics and Breeding, Research Institute of Forestry, Chinese Academy of Forestry, Beijing 100091, China
2
Collaborative Innovation Center of Sustainable Forestry in Southern China, Nanjing Forestry University, Nanjing 210037, China
3
Key Laboratory of Tree Breeding and Cultivation, National Forestry and Grassland Administration, Research Institute of Forestry, Chinese Academy of Forestry, Beijing 100091, China
*
Author to whom correspondence should be addressed.
Forests 2025, 16(4), 630; https://doi.org/10.3390/f16040630
Submission received: 22 February 2025 / Revised: 26 March 2025 / Accepted: 31 March 2025 / Published: 3 April 2025
(This article belongs to the Section Genetics and Molecular Biology)

Abstract

:
Hydroxytyrosol is a natural phenolic compound found in olives. Phenylacetaldehyde reductase (PAR) is a key enzyme in the final step of the hydroxytyrosol biosynthesis pathway in olives. However, genome-wide studies on the PAR gene family in olives have not been reported. In this study, 21 genes were identified through a genome-wide analysis. Phylogenetic analysis classified these genes into three subgroups: PAR, CCR (Cinnamoyl-CoA reductase), and DFR (Dihydroflavonol 4-reductase). Expression pattern analysis suggested that genes within these subfamilies may play crucial roles in the biosynthesis of polyphenols, lignin, and anthocyanins, respectively. Three-dimensional structural modeling and molecular docking of the OePAR1 revealed that hydrogen bonds, hydrophobic interactions, and π–π stacking interactions collectively influence the affinity between PAR and its substrates. Residues at the active site form hydrogen bonds, with variations contributing to substrate specificity. The substrate with the strongest affinity for OePAR1 was identified as 3,4-dihydroxyphenylacetaldehyde (3, 4-DHPAA), with a binding energy of −4.98 kcal/mol, in agreement with previous enzymatic activity validation. Subcellular localization studies revealed that OePAR1 is localized to the chloroplast. This study provides essential insights into the biological functions of OePARs in olives and lays the groundwork for enhancing olive oil quality through genetic engineering.

1. Introduction

The olive (Olea europaea L.) is an important woody oilseed crop widely distributed in the Mediterranean region. Olive oil, extracted from the fruit of the olive tree, is not only a key component of the Mediterranean diet but also enjoys a prominent reputation in international markets, often referred to as the “queen of vegetable oils”. [1,2]. Olive oil is abundant in unsaturated fatty acids and contains a variety of bioactive compounds, including Oleacein, oleuropein, squalene, and hydroxytyrosol [3]. Oleuropein is the predominant secoiridoid glycoside in olives and is considered a key component in high-quality olive oil. Its characteristic bitter and pungent flavors are essential in defining the overall flavor profile of olive oil [4]. Moreover, oleuropein exhibits a broad spectrum of bioactive properties, including anti-inflammatory, antiviral, blood glucose-regulating, antioxidant, and antihypertensive effects [5,6]. Hydroxytyrosol is a significant phenolic compound generated during the metabolism of oleuropein. Recent studies have elucidated the biosynthetic pathways leading to the production of tyrosol and hydroxytyrosol (Figure S1), and have identified the key enzymes involved in these pathways [7,8]. Furthermore, the functions of enzymes involved in hydroxytyrosol biosynthesis, such as tyrosine/dopa decarboxylase (TyDC), monoamine oxidase (MAO), and phenylacetaldehyde reductase (PAR), have been validated for enzymatic activity through in vitro studies [9,10,11,12].
PAR is a member of the short-chain dehydrogenase/reductase (SDR) superfamily, one of the largest and most ancient protein superfamilies. Despite the substantial sequence diversity among its members, the SDR superfamily shares common structural characteristics, including the conserved Rossmann-fold three-dimensional structure, an NADP cofactor-binding motif at the N-terminus, and the catalytic residue motif “YXXXK” within the active site [13,14]. Researchers have classified the SDR family into five distinct types: “classical”, “extended”, “divergent”, “atypical”, and “unknown” [15]. NCBI domain alignment revealed that the PAR proteins contain the “FR_SDR_e” conserved domain, which is classified under the “extended” type of the SDR gene family. In addition to the characteristic features of the SDR family, the “FR_SDR_e” domain contains approximately 100 non-conserved amino acid residues at the C-terminus [16]. PARs are crucial aldehyde reductases involved in the synthesis of volatile compounds, catalyzing the reduction of phenylacetaldehyde (PAA) to phenylethanol. 2-Phenylethanol is a key volatile compound that contributes to the aroma and flavor of ripe tomatoes and plays a vital role in the fragrance of various flowers. LePAR1 and LePAR2 in Lycopersicon esculentum have been identified as enzymes responsible for converting 2-phenylacetaldehyde to 2-phenylethanol. The role of these enzymes in regulating plant volatile aroma compounds was further confirmed by expressing the corresponding genes in Petunia hybrida [10]. Chen et al. [11] identified a PAR gene in Rosa × damascena and found that rose-PAR shares 77% and 75% sequence identity with LePAR1 and LePAR2, respectively. Functional validation demonstrated that rose-PAR preferentially utilizes NADPH as a cofactor to catalyze the conversion of phenylacetaldehyde to phenylethanol. Additionally, rose-PAR is expressed at higher levels in petals than in sepals and leaves, suggesting its pivotal role in regulating the fragrance of roses [11]. Furthermore, salidroside is a bioactive tyrosine-derived phenolic compound found in medicinal plants of the Rhodiola genus. In the biosynthetic pathway of salidroside, PARs play a crucial role in catalyzing the conversion of 4-hydroxyphenylacetaldehyde (4-HPAA) to tyrosol. Two PAR proteins, Rr4HPAR1 and Rr4HPAR2, were identified in Rhodiola rosea, exhibiting 76% and 58% sequence identity with LePAR1, respectively. Expression of both enzymes in Escherichia coli showed that, in the presence of NADPH as a cofactor, both enzymes catalyze the reduction of phenylacetaldehyde to phenylethanol, with Rr4HPAR1 displaying higher enzymatic activity [9]. Computer simulation tools provide critical support for protein engineering research. Through molecular docking and related computational approaches, researchers can efficiently screen protein variants in silico, significantly enhancing R&D efficiency. These computational methodologies enable the reliable prediction of protein structural and functional characteristics, allowing scientists to preliminarily evaluate design outcomes prior to wet-lab experimentation, thereby reducing unnecessary experimental attempts. In fields such as biomedicine and industrial enzyme development, computer simulations have become an indispensable research methodology [17].
In the final step of the hydroxytyrosol biosynthetic pathway in Olea europaea, phenylacetaldehyde reductases serve as key enzymes, catalyzing the conversion of 3,4-DHPAA to hydroxytyrosol. However, a comprehensive genome-wide identification of the PAR gene in olive has not yet been fully validated. To address this knowledge gap, a systematic investigation of PAR genes is essential for elucidating their evolutionary patterns and regulatory mechanisms, which may ultimately contribute to improving olive oil quality through targeted genetic approaches.

2. Materials and Methods

2.1. Identification and Physicochemical Property Analysis of Gene Family Members

In this study, members of the PAR gene family were identified using the high-quality olive genome (CRA003087), which was obtained through Oxford Nanopore third-generation sequencing and Hi-C technology (CNCB, https://bigd.big.ac.cn/, accessed on 5 January 2024) [8]. A total of 7 PAR sequences from four species were downloaded from the NCBI database, including LePAR1 (ABR15768.1) and LePAR2 (ABR15769.1) from Lycopersicon esculentum, Rr4HPAR1 (AUI41113) and Rr4HPAR2 (AUI41114) from Rhodiola rosea, PtPAR1 (QBL52487.1) and PtPAR2 (QBL52486.1) from Populus trichocarpa, and rose-PAR (BAG13450.2) from Rosa × damascena. A local blastp search using seven PAR protein sequences as queries was conducted with default parameters. A HMM model was built using seven PAR sequences and iterated five times with default parameters for all other settings. The olive protein database was searched using HMMER 3.0 with an E-value cutoff of 1 × 10⁻⁵ and default settings. The union of sequences obtained from both methods was selected, and duplicate sequences were removed. Conserved protein domains of the candidate sequences were identified using online tools such as SMART (http://smart.emblheidelberg.de/, accessed on 5 January 2024), NCBI-CDD (https://www.ncbi.nlm.nih.gov, accessed on 5 January 2024), and InterPro (http://www.ebi.ac.uk/interpro/, accessed on 5 January 2024). Physicochemical properties were analyzed using ProtParam (https://www.expasy.org/resources, accessed on 5 January 2024). Subcellular localization of the genes was predicted using WoLF PSORT (https://wolfpsort.hgc.jp/, accessed on 5 January 2024), and transmembrane domain analysis was performed using TMHMM-2.0 (https://services.healthtech.dtu.dk/, accessed on 5 January 2024).

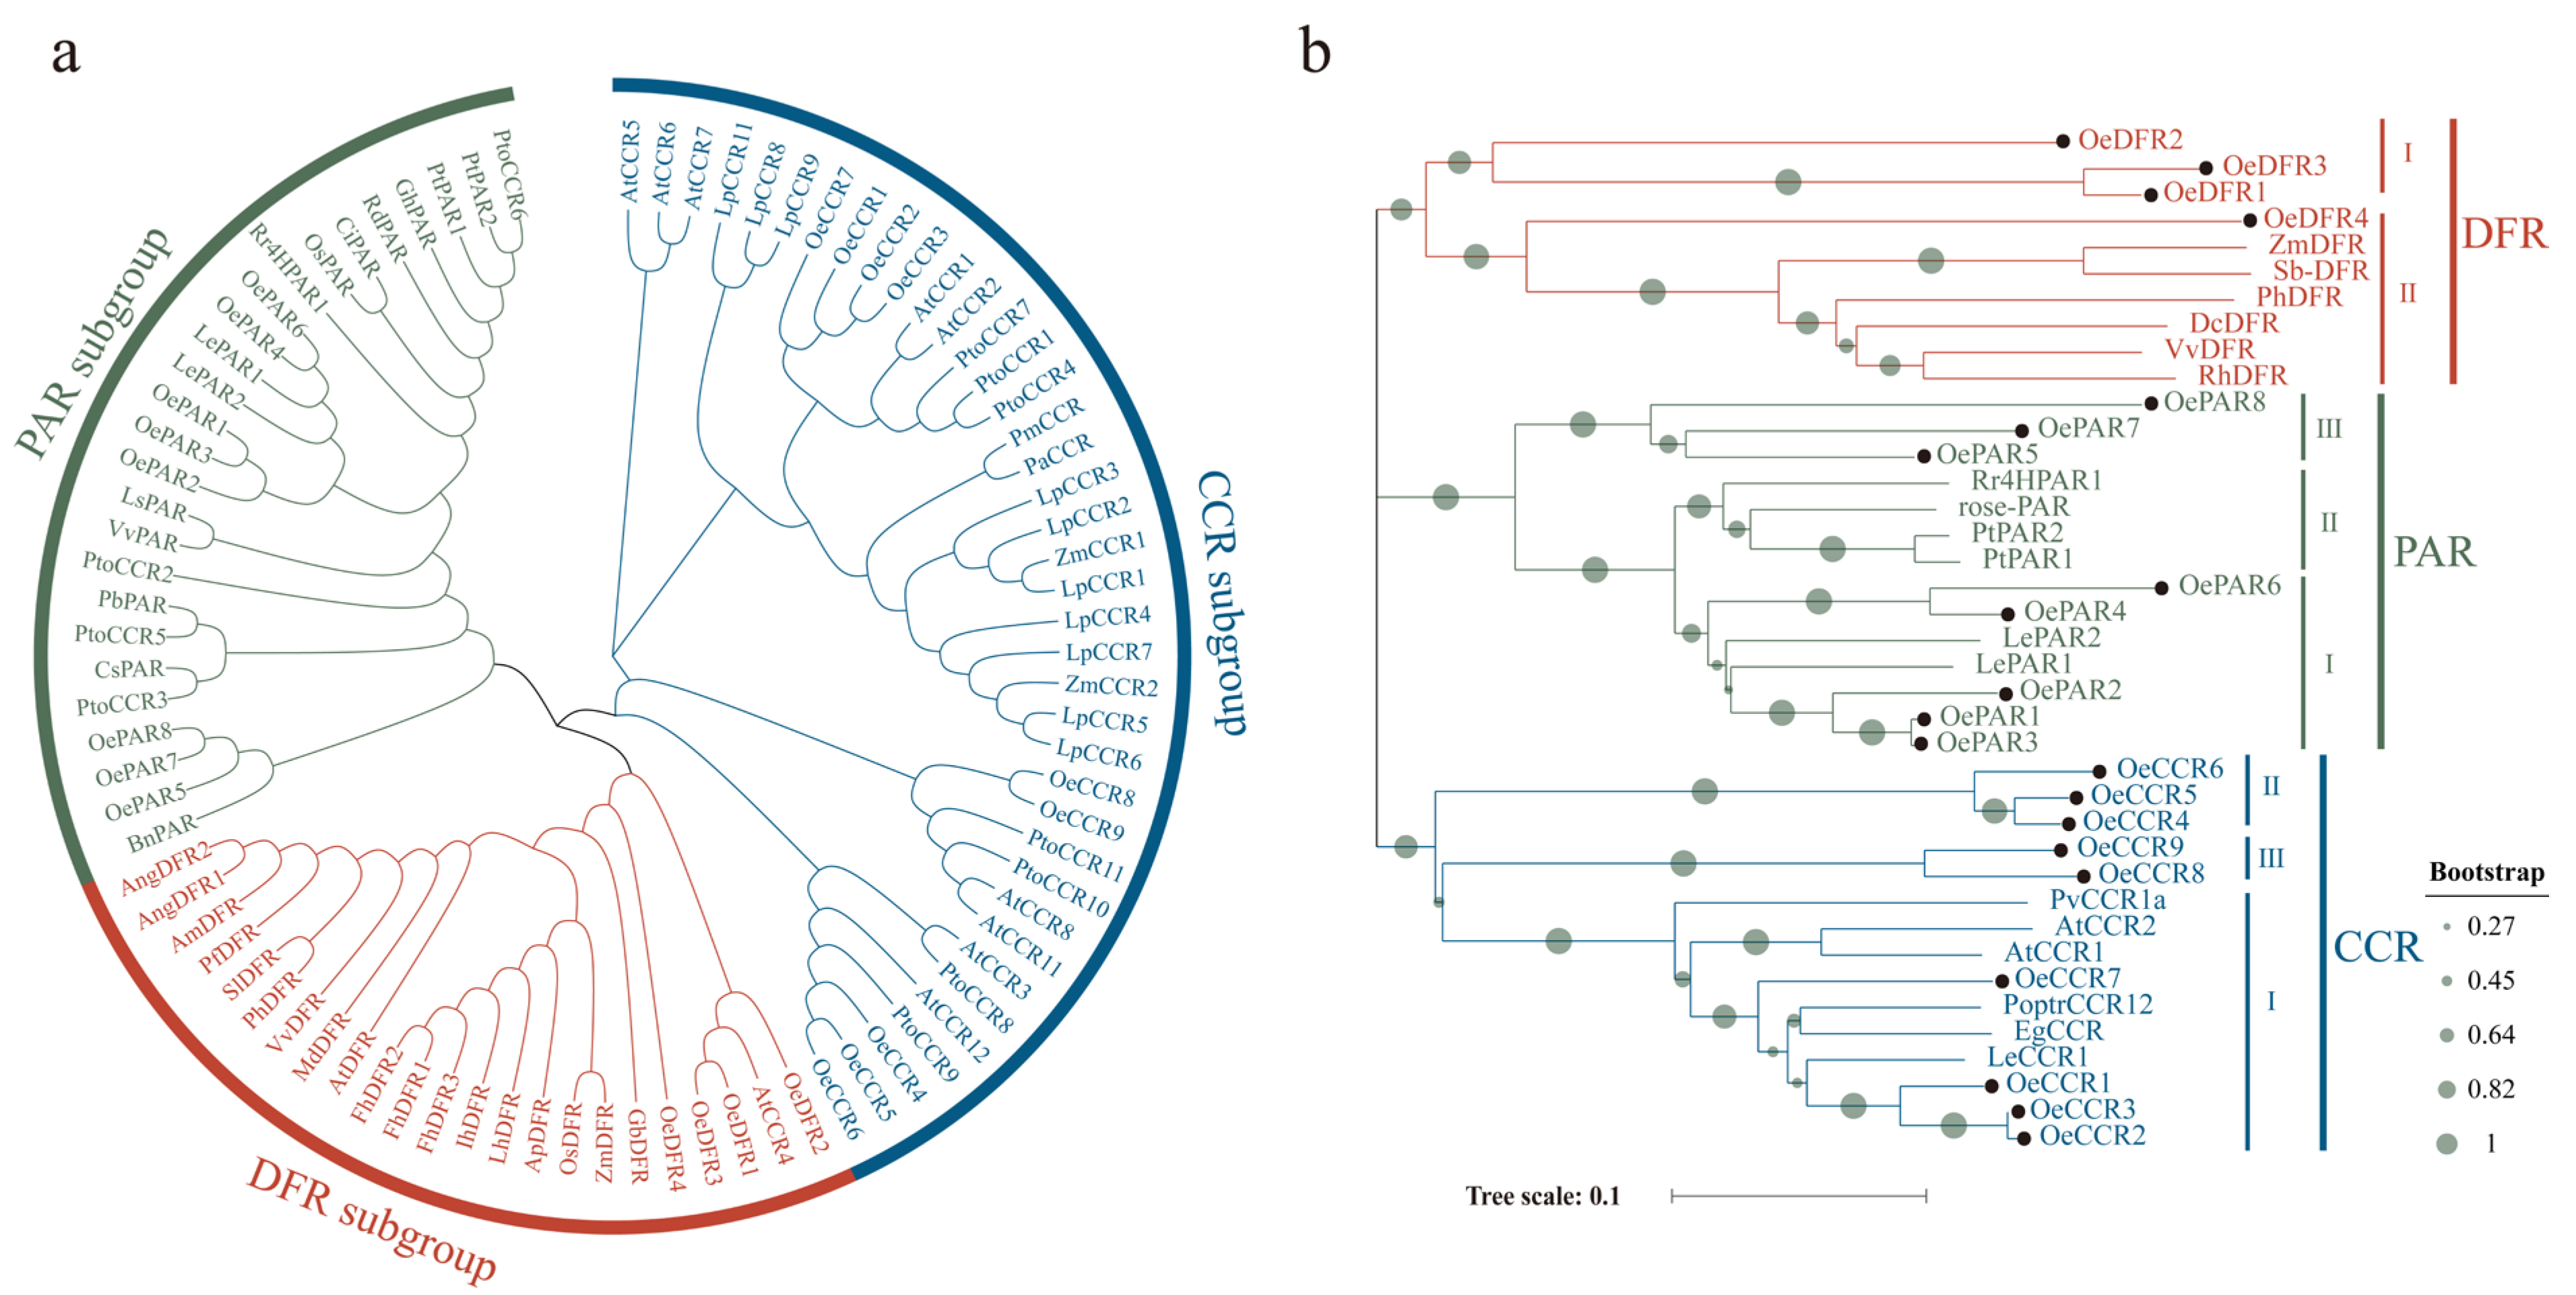
2.2. Phylogenetic Analysis

PAR protein sequences from Lycopersicon esculentum, Populus trichocarpa, Rhodiola rosea, and Rosa × damascena were aligned with DFR protein sequences from Zea mays, Vitis vinifera, Petunia hybrida, etc., and CCR protein sequences from Arabidopsis thaliana, Populus trichocarpa, Lolium perenne, etc., using the ClustalW program in MEGA11.0 [18], all parameters were set to default. A multiple sequence alignment was performed, followed by the construction of a phylogenetic tree using the Neighbor-Joining (NJ) method with the p-distance model, pairwise deletion, and a bootstrap value of 1000 repetitions. The phylogenetic tree was visualized and enhanced using the online tool ChiPlot (https://www.chiplot.online/tvbot.html, accessed on 5 January 2024) [19]. The following protein sequences were used to construct the functional phylogenetic tree: LePAR1, LePAR2, PtPAR1, PtPAR2, Rr4HPAR1, rose-PAR, EgCCR (O04877), AtCCR1 (AAG46037), AtCCR2 (AAG53687), LeCCR1 (AAY41879.1), PoptrCCR12 (CAA12276.1), PvCCR1a (ACZ74581.1), ZmDFR (P51108.1), DcDFR (P51104.1), VvDFR (P51110.1), SbDFR (P93776), PhDFR (P14720.2), and RhDFR (BAA12723.1).

2.3. Conserved Motif and Gene Structure Analysis

The MEME program (https://meme-suite.org/, accessed on 12 January 2024) was used to analyze the conserved domains of the gene family members’ sequences [20], with the maximum number of motifs set to 15; the Gene structure display server (GSDS, https://gsds.gao-lab.org/, accessed on 12 January 2024) was used to analyze the gene structures of the gene family members’ sequences [21].

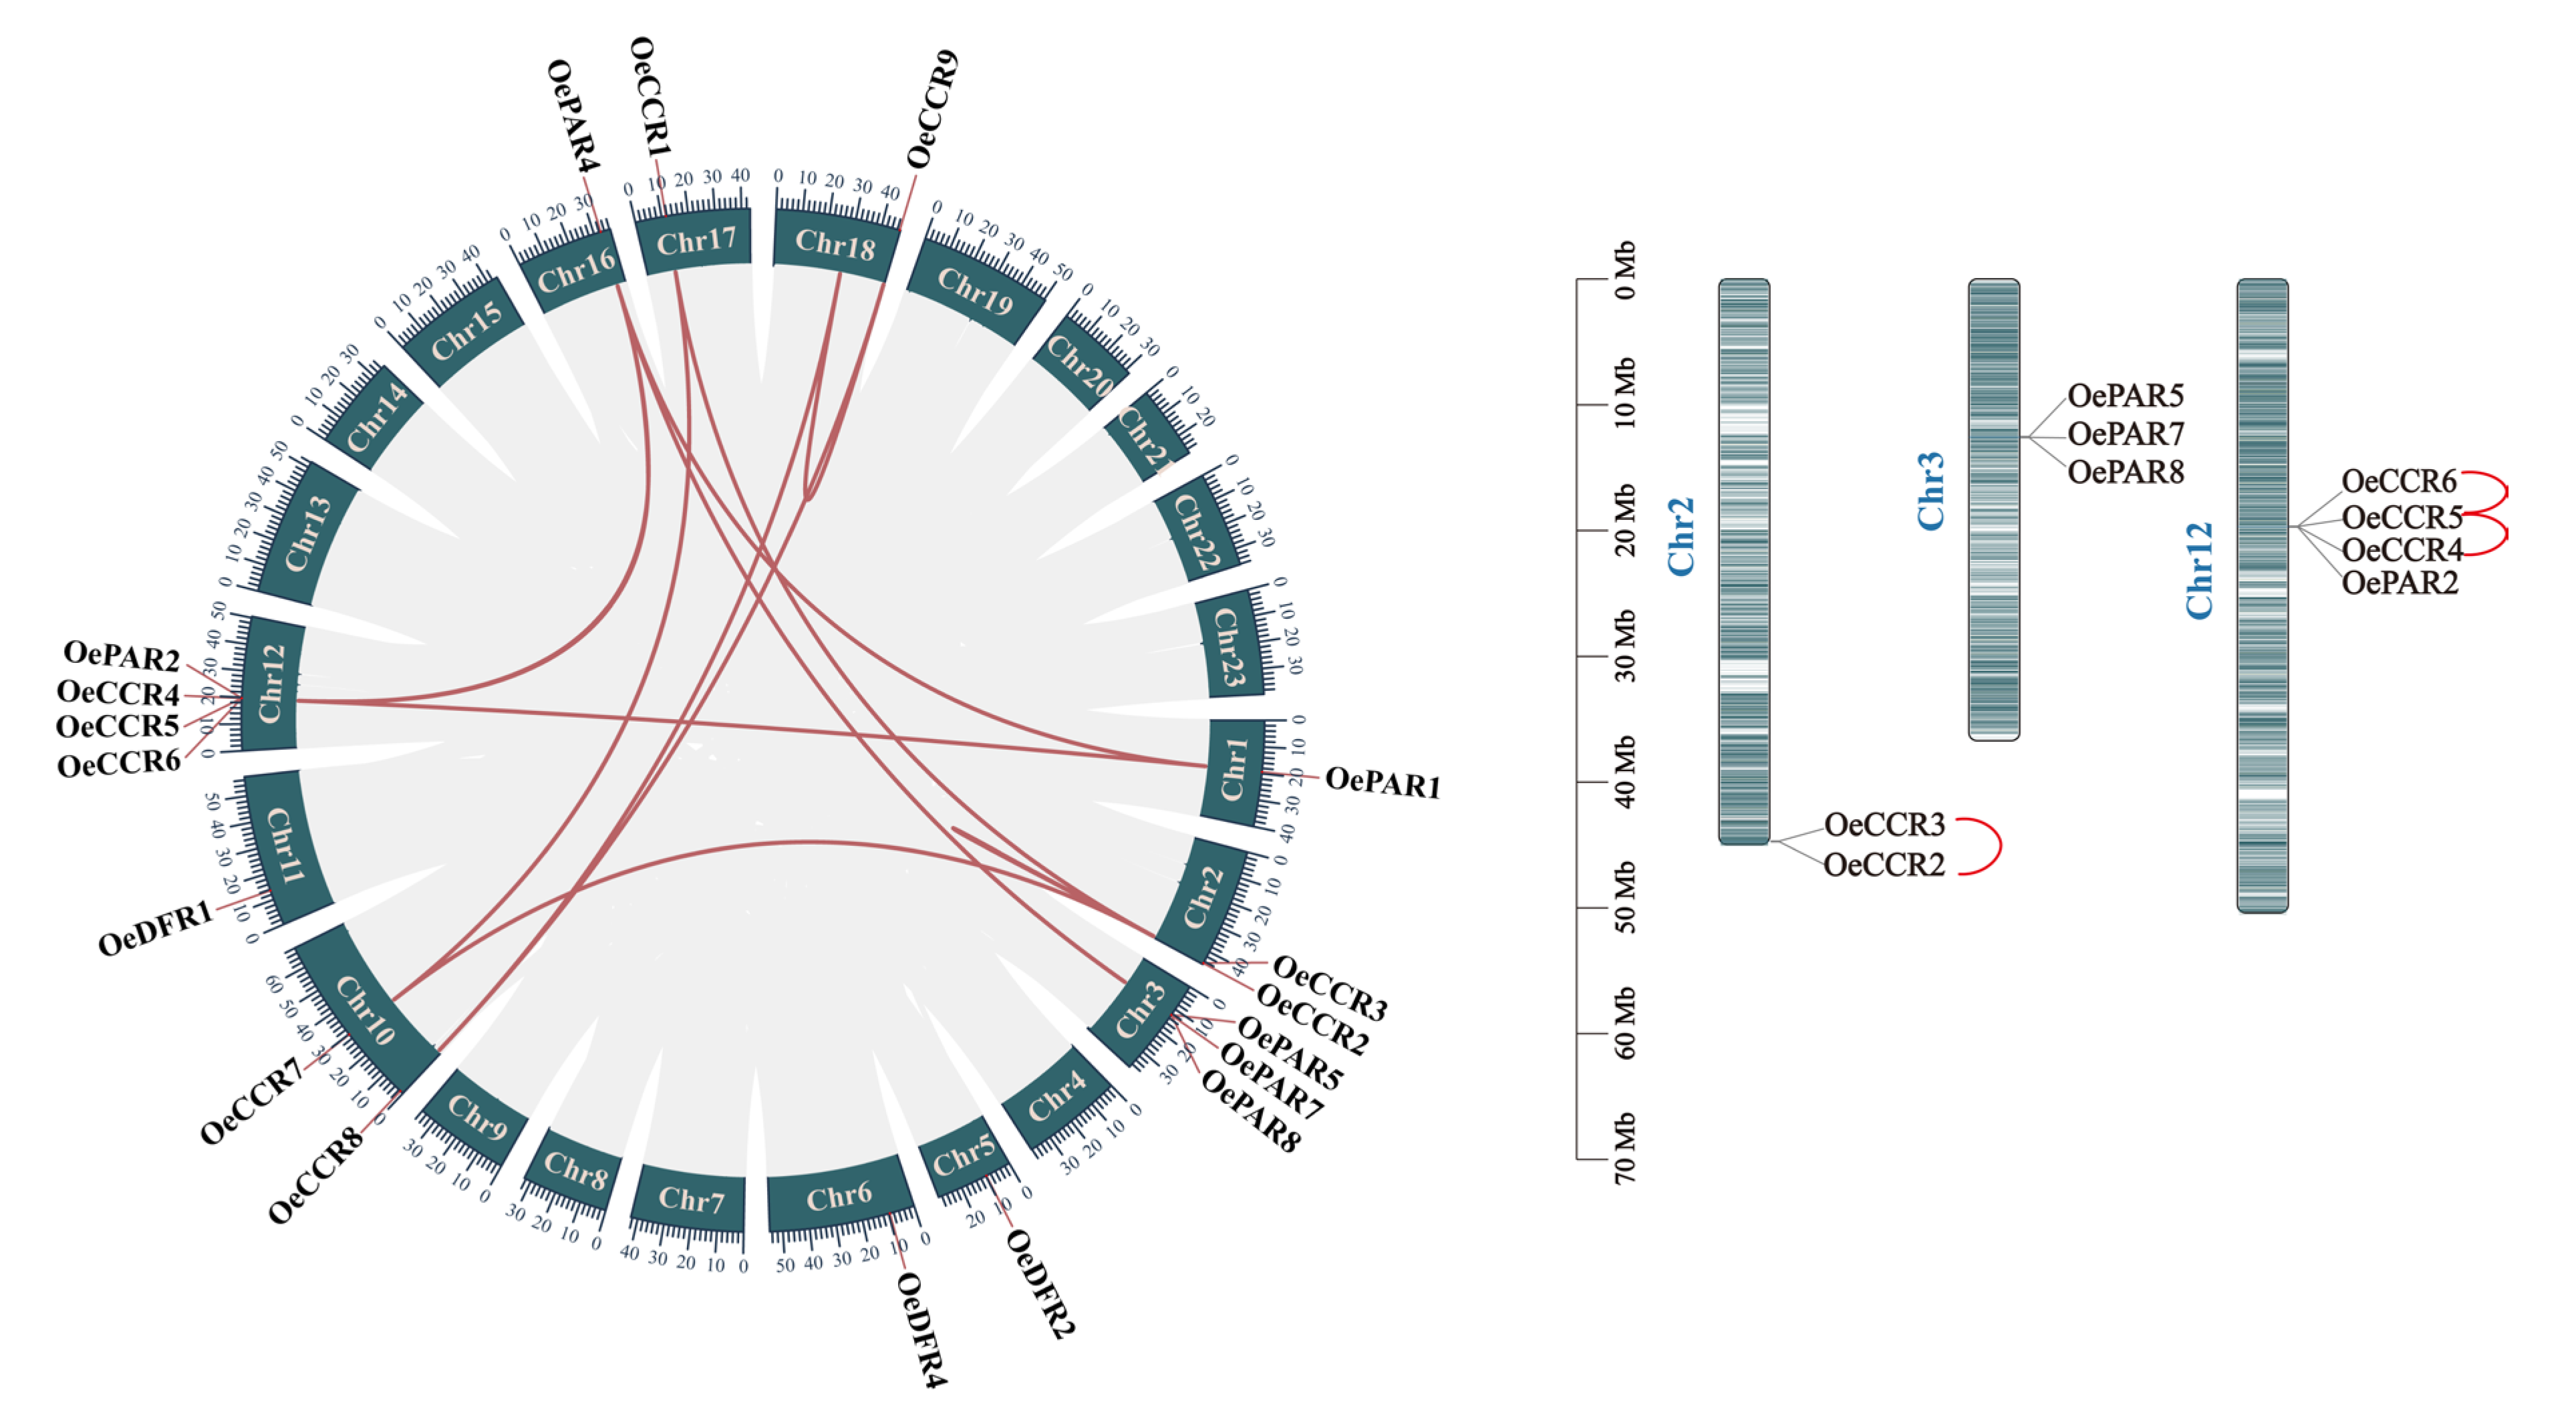
2.4. Chromosomal Localization and Duplication Event Analysis

Chromosomal gene location information was extracted from the olive genome GFF file (CRA003087) using TBtools-II v2.142. Tandem duplication and segmental duplication events were analyzed using the one-step McscanX program in TBtools-II v2.142 [22].

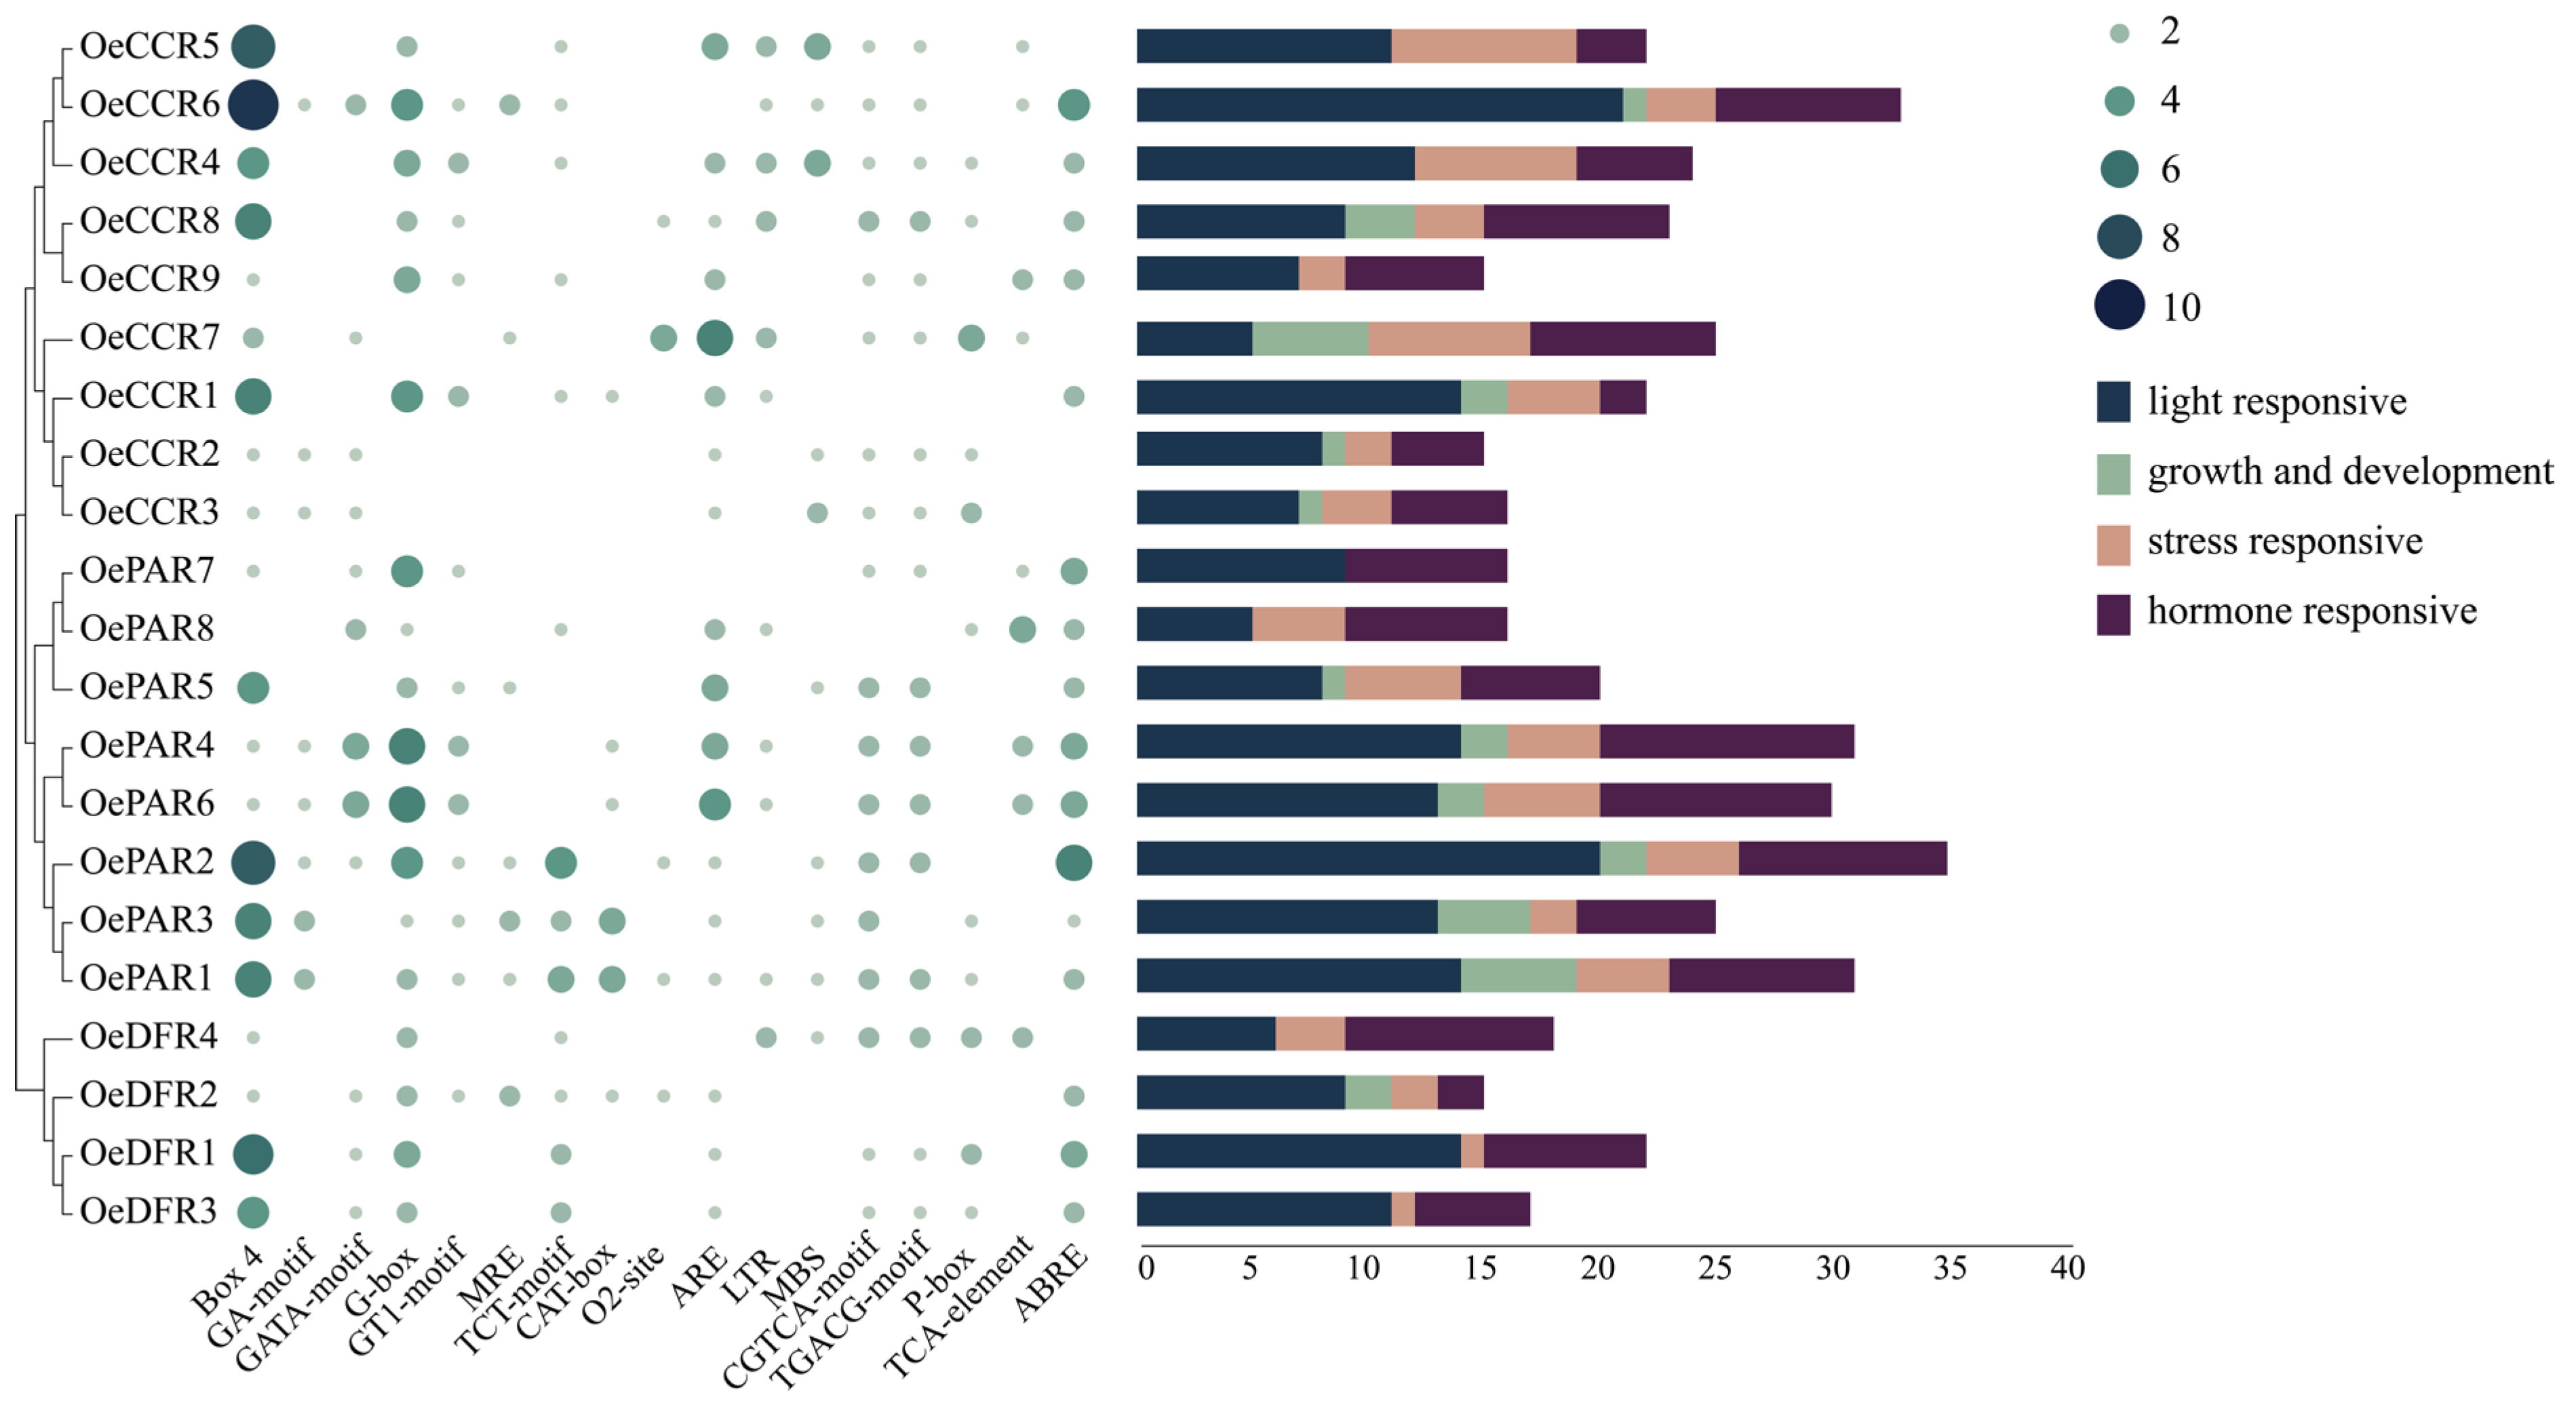
2.5. Promoter cis-Acting Elements Analysis

The DNA sequences of the 21 gene family members, spanning 2000 base pairs upstream of the start codon, were extracted from the olive genome file using TBtools-II v2.142. The cis-acting elements in the promoters were analyzed using the plantCARE tool (http://bioinformatics.psb.ugent.be/webtools/plantcare/html/, accessed on 9 January 2024) [23].

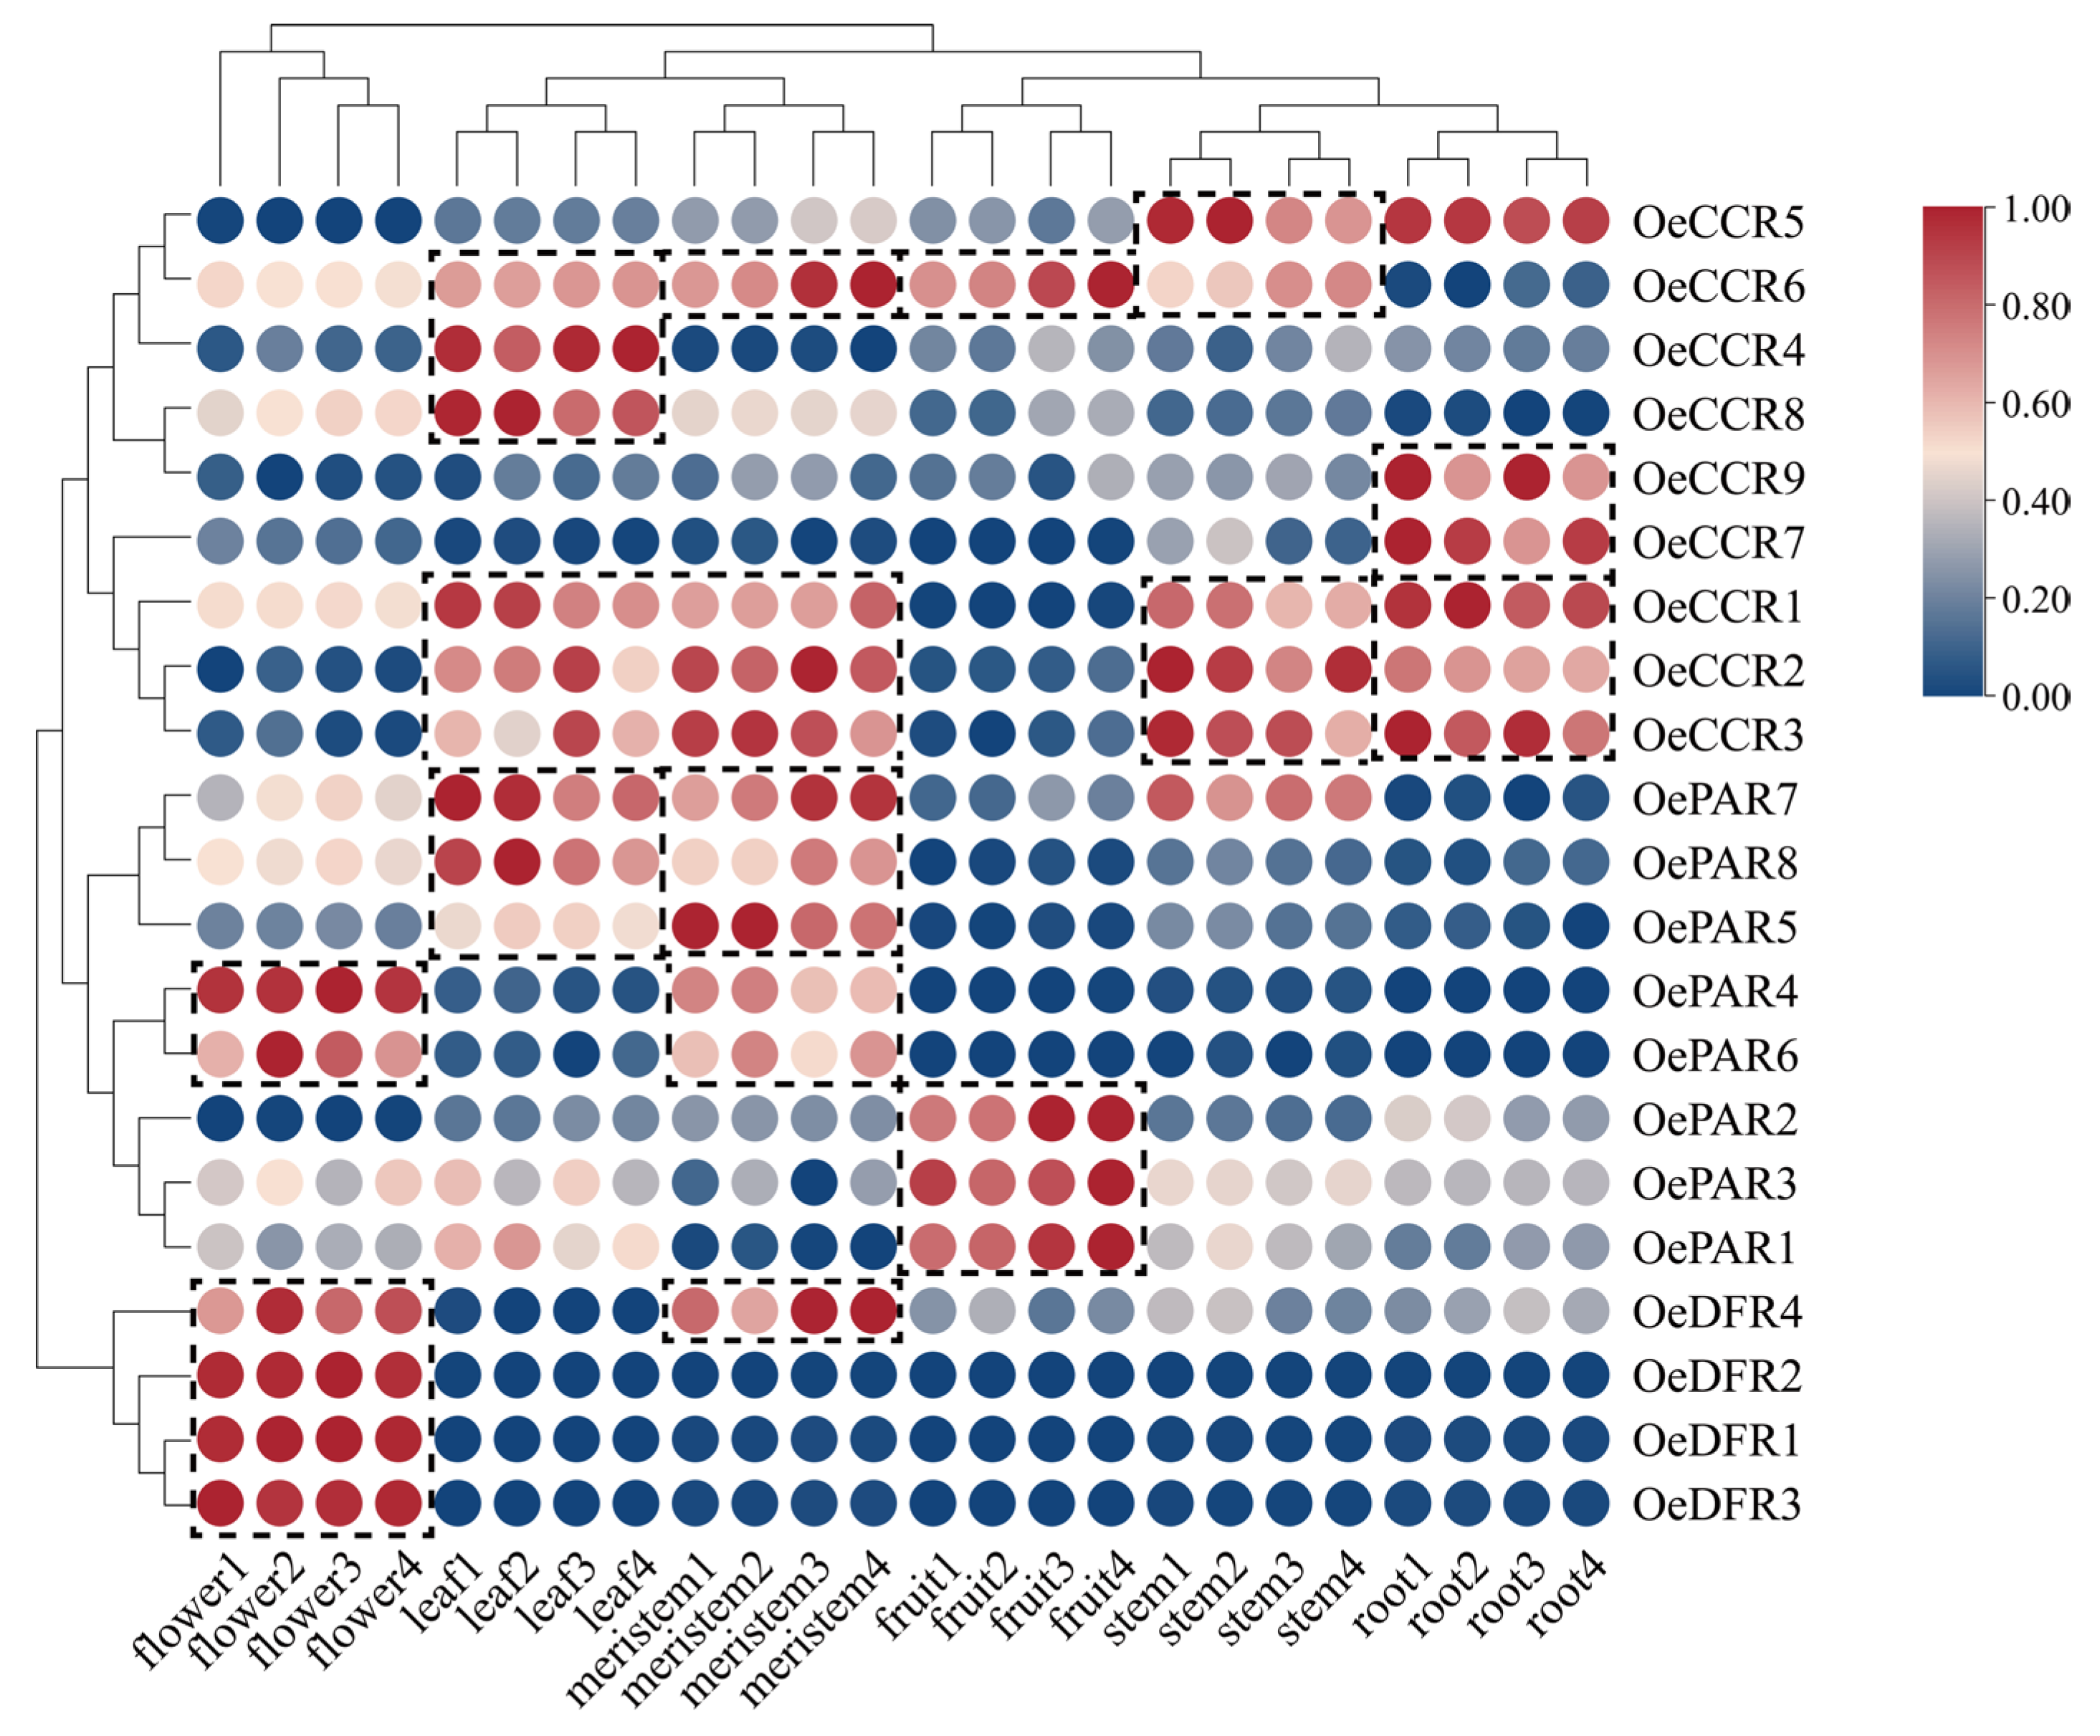
2.6. Expression Pattern Analysis

To explore the expression patterns of the 21 gene family members in different tissues, raw RNA-seq data in FASTQ format were obtained from the EBI-ENA database (https://www.ebi.ac.uk/ena/browser/home, accessed on 19 January 2024) under the accession number PRJNA590386, which include data for root, stem, leaf, flower, fruit, and meristem tissues. The high-quality paired-end reads filtered by Trimmomatic were aligned to the reference genome using HISAT2. Gene expression levels were quantified as FPKM (fragments per kilobase of transcript per million mapped reads) using StringTie [24,25,26,27,28]. The FPKM values for the 21 gene family members were then calculated and analyzed. Expression heatmaps were generated using TBtools-II v2.142 [22]. The expression levels of the 21 proteins were independently normalized to the (0, 1) closed interval through linear transformation using the ‘zero-one’ normalization method in TBtools-II v2.142

2.7. Three-Dimensional Structure Modeling and Molecular Docking of OePAR1

The 3D structure of the OePAR1 protein was predicted using AlphaFold3 through the online platform (https://golgi.sandbox.google.com/about, accessed on 5 February 2024) [29]. The quality of the model was evaluated using the Ramachandran Plot tool (https://www.ebi.ac.uk/thornton-srv/databases/pdbsum/Generate.html, accessed on 5 February 2024). The 3D structures of the substrates, PAA, 4-HPAA, and 3,4-DHPAA, were retrieved from the PubChem database (https://pubchem.ncbi.nlm.nih.gov/, accessed on 5 February 2024), and the structures were converted from SDF format to PDBQT format using OpenBabel. Molecular docking studies were performed using AutoDock V4.2.6. The OePAR1 macromolecule was preprocessed, and grid generation was conducted using AutoDock Tools (ADT), which involved removing water molecules, adding hydrogen atoms, and calculating Gasteiger charges. The docking grid was prepared with the Autogrid program, ensuring the grid center covered the entire active site cavity of OePAR1 to allow sufficient space for the substrates’ translation and rotation. During the docking procedure, the Genetic Algorithm (GA) was employed to identify the optimal binding conformation between OePAR1 and the substrates, with 100 independent runs performed and other parameters set to default. The binding interactions, including hydrogen bonds, were visualized and analyzed using PyMOL-V3.1. Additionally, the interactions between OePAR1 and the substrates were further examined using the Protein-Ligand Interaction Profiler (PLIP) (https://plip-tool.biotec.tu-dresden.de/plip-web/plip/index, accessed on 10 February 2024).

2.8. Subcellular Localization of OePAR1

A transient expression system in Arabidopsis thaliana protoplasts was utilized to elucidate the subcellular localization of OePAR1 in vivo [30]. Protoplasts were enzymatically isolated from mesophyll cells of Arabidopsis thaliana Col-0. The coding sequence (CDS) of OePAR1 was cloned into the BamHI-linearized ProkII-eGFP vector to construct ProkII-PAR1-eGFP. Plasmid DNA was introduced into protoplasts via PEG-mediated transformation. Transfected protoplasts were incubated at 22 °C in darkness for 20 min, followed by 14 h incubation under dark conditions. Subcellular localization was analyzed using a Leica LSM880 confocal laser scanning microscope.

3. Results

3.1. Identification and Physicochemical Property Analysis of Gene Family Members

By combining the results from the local BLAST and the HMM model, and removing duplicate sequences, a total of 42 candidate sequences were identified. After manually screening for conserved domains, 21 homologous sequences were selected. These 21 sequences were confirmed in the NCBI-CDD database to contain the “FR_SDR_e” domain, a signature domain of the SDR gene family. Previous studies have demonstrated that the SDR superfamily is classified into five types: “atypical”, “classical”, “extended”, “divergent”, and “unknown”. SDR108E belongs to the “extended” type of the SDR superfamily, with representative enzymes such as Dihydroflavonol 4-reductase (DFR), Anthocyanidin reductase (ANR), Cinnamoyl-CoA reductase (CCR), Phenylacetaldehyde reductase (PAR), and Eutypine reductase. Further phylogenetic analysis was conducted by comparing the 21 identified sequences with functionally validated SDR108E family-related enzymes from other species. This analysis classified the 21 sequences into three subgroups: CCR, PAR, and DFR. Based on these classifications, the sequences were named as follows: OePAR1-OePAR8, OeCCR1-OeCCR9, and OeDFR1-OeDFR4. The physicochemical property analysis (Table S1) revealed that the amino acid length of the 21 sequences ranged from 263 residues (OePAR7) to 354 residues (OeDFR4), with the molecular weight of the proteins ranging from 29.2 kDa (OePAR7) to 38.95 kDa (OeDFR4), and an average molecular weight of 34.71 kDa. The theoretical isoelectric point (pI) varied from 5.30 (OePAR7) to 8.30 (OeDFR3), with an average pI of 6.40. Predictions from the TMHMM-2.0 online tool indicated that none of the 21 protein sequences contained transmembrane domains, suggesting that these proteins likely do not possess typical membrane-associated functions, such as cell signaling, substance transport, or cell recognition (Figure S2).

3.2. Phylogenetic Analysis

To investigate the evolutionary relationship of OePAR and OePAR-like sequences, a phylogenetic tree (Figure 1a) was constructed using PAR, CCR, and DFR sequences from multiple species, along with the 21 identified olive sequences. In the PAR subgroup, OePAR1, OePAR2, OePAR3, OePAR4, and OePAR6 clustered with LePAR1 and LePAR2 from Lycopersicon esculentum, while OePAR5, OePAR7, and OePAR8 clustered with BnPAR from Brassica napus, suggesting a closer evolutionary relationship between OePARs and the PAR genes of Lycopersicon esculentum and Brassica napus. Furthermore, the PAR subgroup also included PtoCCR2, PtoCCR3, PtoCCR5, and PtoCCR6 from Populus trichocarpa, suggesting that these CCR genes may possess PAR-like functions. In the CCR subgroup, OeCCRs clustered with CCR sequences from Arabidopsis thaliana and Populus trichocarpa, forming three distinct clusters. However, the CCR sequences from gymnosperms and monocots formed a separate cluster. This indicates that the CCR genes in olive are more closely related to the CCR genes from Arabidopsis thaliana and Populus trichocarpa, suggesting a shared evolutionary lineage within these species. In the DFR subgroup, OeDFR1, OeDFR2, and OeDFR3 clustered with AtCCR4 from Arabidopsis thaliana, suggesting that AtCCR4 may exhibit DFR-like functions. Additionally, these four genes form an independent branch in the evolutionary history of DFR genes, indicating potential functional diversification. OeDFR4, in contrast to the other OeDFRs, shows a closer evolutionary relationship with sequences from various species, suggesting a distinct functional role within the DFR family.
To further investigate the functions of OePARs and OePAR-like sequences, a functional tree was constructed, including the 21 identified olive sequences along with known functional PARs, DFRs, and CCRs (Figure 1b). In the PAR subgroup, OePARs clustered with PARs from other species into three distinct branches. Class I includes OePAR1, OePAR2, OePAR3, OePAR4, and OePAR6, while Class III contains OePAR5, OePAR7, and OePAR8. Notably, Class II does not include any olive PAR genes, suggesting functional divergence within the OePAR family. OePAR1, OePAR2, and OePAR3 in Class I clustered with LePAR. Previous studies [10] have shown that LePAR catalyzes the reduction of phenylacetaldehyde to 2-phenylethanol, suggesting that OePAR1, OePAR2, and OePAR3 may play similar catalytic roles in the hydroxytyrosol biosynthesis pathway in olives. In the CCR subgroup, OeCCRs and known functional CCRs were divided into three branches. Class II and Class III include only OeCCRs, suggesting functional differentiation among these OeCCRs. In Class I, OeCCR1, OeCCR2, and OeCCR3 clustered with the LeCCR1, indicating that the homologous genes in olive and tomato share more functional similarities. In the DFR subgroup, OeDFRs and DFRs from other species were divided into two branches. Class I includes only OeDFR1, OeDFR2, and OeDFR3, suggesting functional differentiation among these three genes. In Class II, OeDFR4 clusters with known functional DFRs but forms a distinct group, indicating that while OeDFR4 may possess DFR activity, its functional characteristics differ from those of other DFRs.

3.3. Conserved Motif and Gene Structure Analysis

Using MEME, the conserved motifs of 21 protein sequences were analyzed, revealing a total of 15 motifs (Figure 2). The protein sequences of each family member contained between 8 and 14 motifs. Motif 5 was present in all sequences, and its identification in the NCBI-CDD database confirmed that it is part of the “FR_SDR” domain, highlighting its high conservation across evolutionary stages. Notably, motifs 14 and 15 are unique to the OeCCR subgroup and are located at the 5′-N terminus, suggesting that these N-terminal motifs may be associated with specific functions in OeCCR proteins. Additionally, motif 12 is present in most CCR and PAR sequences but absent in the DFR subgroup, indicating that motif 12 may play a role in shared functions of CCR and PAR proteins. The remaining motifs are widely distributed across the 21 sequences, suggesting that these motifs are highly conserved and have been stably maintained throughout evolution.
Gene structure, particularly the arrangement of exons and introns, plays a critical role in regulating gene function. The gene structures of the 21 family members were analyzed using GSDS 2.0, revealing a conserved pattern of exon–intron organization (Figure 2). The number of exons across this gene family ranged from four to seven. Specifically, the PAR subgroup exhibited five to six exons, the DFR subgroup six to seven exons, and the CCR subgroup four to seven exons. This variation in exon number may reflect functional differentiation among the subgroups throughout evolutionary history.

3.4. Chromosomal Localization and Duplication Event Analysis

Chromosomal location information for the 21 target genes was obtained by uploading the olive genome and its annotation files to the Gene Location Visualizer in TBtools (Figure 3). The results show that the 21 genes are located on 11 chromosomes: PAR genes on chromosomes 1, 3, 12, and 16; DFR genes on chromosomes 5, 6, and 11; and CCR genes on chromosomes 2, 10, 12, 17, and 18.
Gene duplication is a fundamental mechanism in genome evolution and serves as a major driving force in the diversification and adaptation of species [31]. In plants, segmental duplication and tandem duplication are the primary mechanisms driving gene family expansion [32]. The synteny analysis of the olive genome identified 13 pairs of gene duplication events within this gene family, including 3 tandem duplications (OeCCR2 and OeCCR3, OeCCR4 and OeCCR5, and OeCCR5 and OeCCR6) (Figure 3). The sequence identities of the three protein pairs, determined through multiple sequence alignment, are 89.52%, 88.47%, and 83.81%, respectively, suggesting a high degree of evolutionary conservation. Notably, OePAR5, OePAR7, and OePAR8 on chromosome 3, along with OePAR2, OeCCR4, OeCCR5, and OeCCR6 on chromosome 12, are positioned adjacent to each other on the same chromosomes. These genes are clustered together in the functional phylogenetic tree, suggesting a potential shared evolutionary origin. The remaining 10 pairs of duplicated genes are segmental duplications, indicating that the expansion of this gene family predominantly occurs through segmental duplications. To further explore the evolutionary patterns of this gene family, the Ka/Ks ratio was calculated. The Ka/Ks values ranged from 0.11 to 1.04, with an average value of 0.31 (Table 1). The generally low Ka/Ks ratios observed in the olive gene family suggest that purifying selection has likely played a dominant role in its evolutionary process.

3.5. Promoter cis-Acting Elements Analysis

To gain further insights into the transcriptional regulatory mechanisms, the promoter cis-elements of the 21 gene family members were analyzed using the PlantCARE database. The identified cis-elements were classified into four categories based on their functions: light-responsive elements, plant growth and development-related elements, stress-responsive elements, and hormone-responsive elements. The bubble plot clearly illustrates that the Box 4, G-box, ARE, and ABRE elements are widely distributed across the 21 gene family members (Figure 4). The high frequency of these cis-elements suggests that they may play central regulatory roles in their respective biological processes. Overall, light-responsive and hormone-responsive elements are the most prevalent, accounting for 48.8% and 28.9%, respectively. Stress-responsive elements represent a smaller proportion at 15.7%, while plant growth and development-related elements make up the least, at only 6.6%. These distribution patterns suggest that the 21 genes may be particularly involved in light signaling and hormone regulation. No plant growth and development elements were predicted in OePAR8, OeCCR4, OeCCR5, OeCCR9, OeDFR1, OeDFR3, and OeDFR4, indicating that these genes may primarily respond to external environmental cues rather than being directly involved in fundamental plant growth and development processes. Additionally, no growth and development or stress-responsive elements were predicted in OePAR7, suggesting that this gene may not play a role in these regulatory pathways.

3.6. Expression Pattern Analysis

To further explore the functions of the gene family, we conducted a systematic analysis of gene expression patterns in six different tissues of olive (flower, leaf, meristem, fruit, stem, and root). The results indicated that the 21 genes exhibited different expression patterns across the tissues, with certain genes showing high expression levels in specific tissues. Figure 5 illustrates that the expression levels of genes in the OePARs subgroup can be grouped into three distinct patterns. OePAR1, OePAR2, and OePAR3 exhibit high expression levels in the fruit; OePAR4 and OePAR6 are highly expressed in flowers, with relatively higher expression in the meristem; OePAR5, OePAR7, and OePAR8 show elevated expression in leaves and the meristem, with OePAR7 also displaying high expression in stems. Based on phylogenetic analysis, OePAR1, OePAR2, and OePAR3 cluster with LePAR1 and LePAR2 from Lycopersicon esculentum [10], suggesting that these three genes may be pivotal in the synthesis of hydroxytyrosol in olive fruit. In the OeCCRs subgroup, OeCCR1, OeCCR2, and OeCCR3 show high expression levels in roots, stems, leaves, and meristematic tissues. OeCCR4 is predominantly expressed in leaves, while OeCCR5 exhibits high expression in both stems and roots. OeCCR6 shows relatively high expression in leaves, meristems, fruits, and stems. OeCCR7 and OeCCR9 are exclusively expressed in roots, and OeCCR8 is specifically expressed in leaves. Given that CCR genes are key players in the lignin biosynthesis pathway [33], the clustering of OeCCR1, OeCCR2, OeCCR3, and OeCCR7 with LeCCR1 [34], EgCCR [35] and PoptrCCR12 [36] in the phylogenetic tree suggests that these genes may be major contributors to lignin biosynthesis in olives. In the OeDFRs subgroup, OeDFR1 to OeDFR4 are all highly expressed in flowers. DFR is a key enzyme in the anthocyanin biosynthesis pathway and is primarily expressed in the petals. Therefore, it is speculated that OeDFR1 to OeDFR4 may be involved in the anthocyanin biosynthesis pathway in olives.

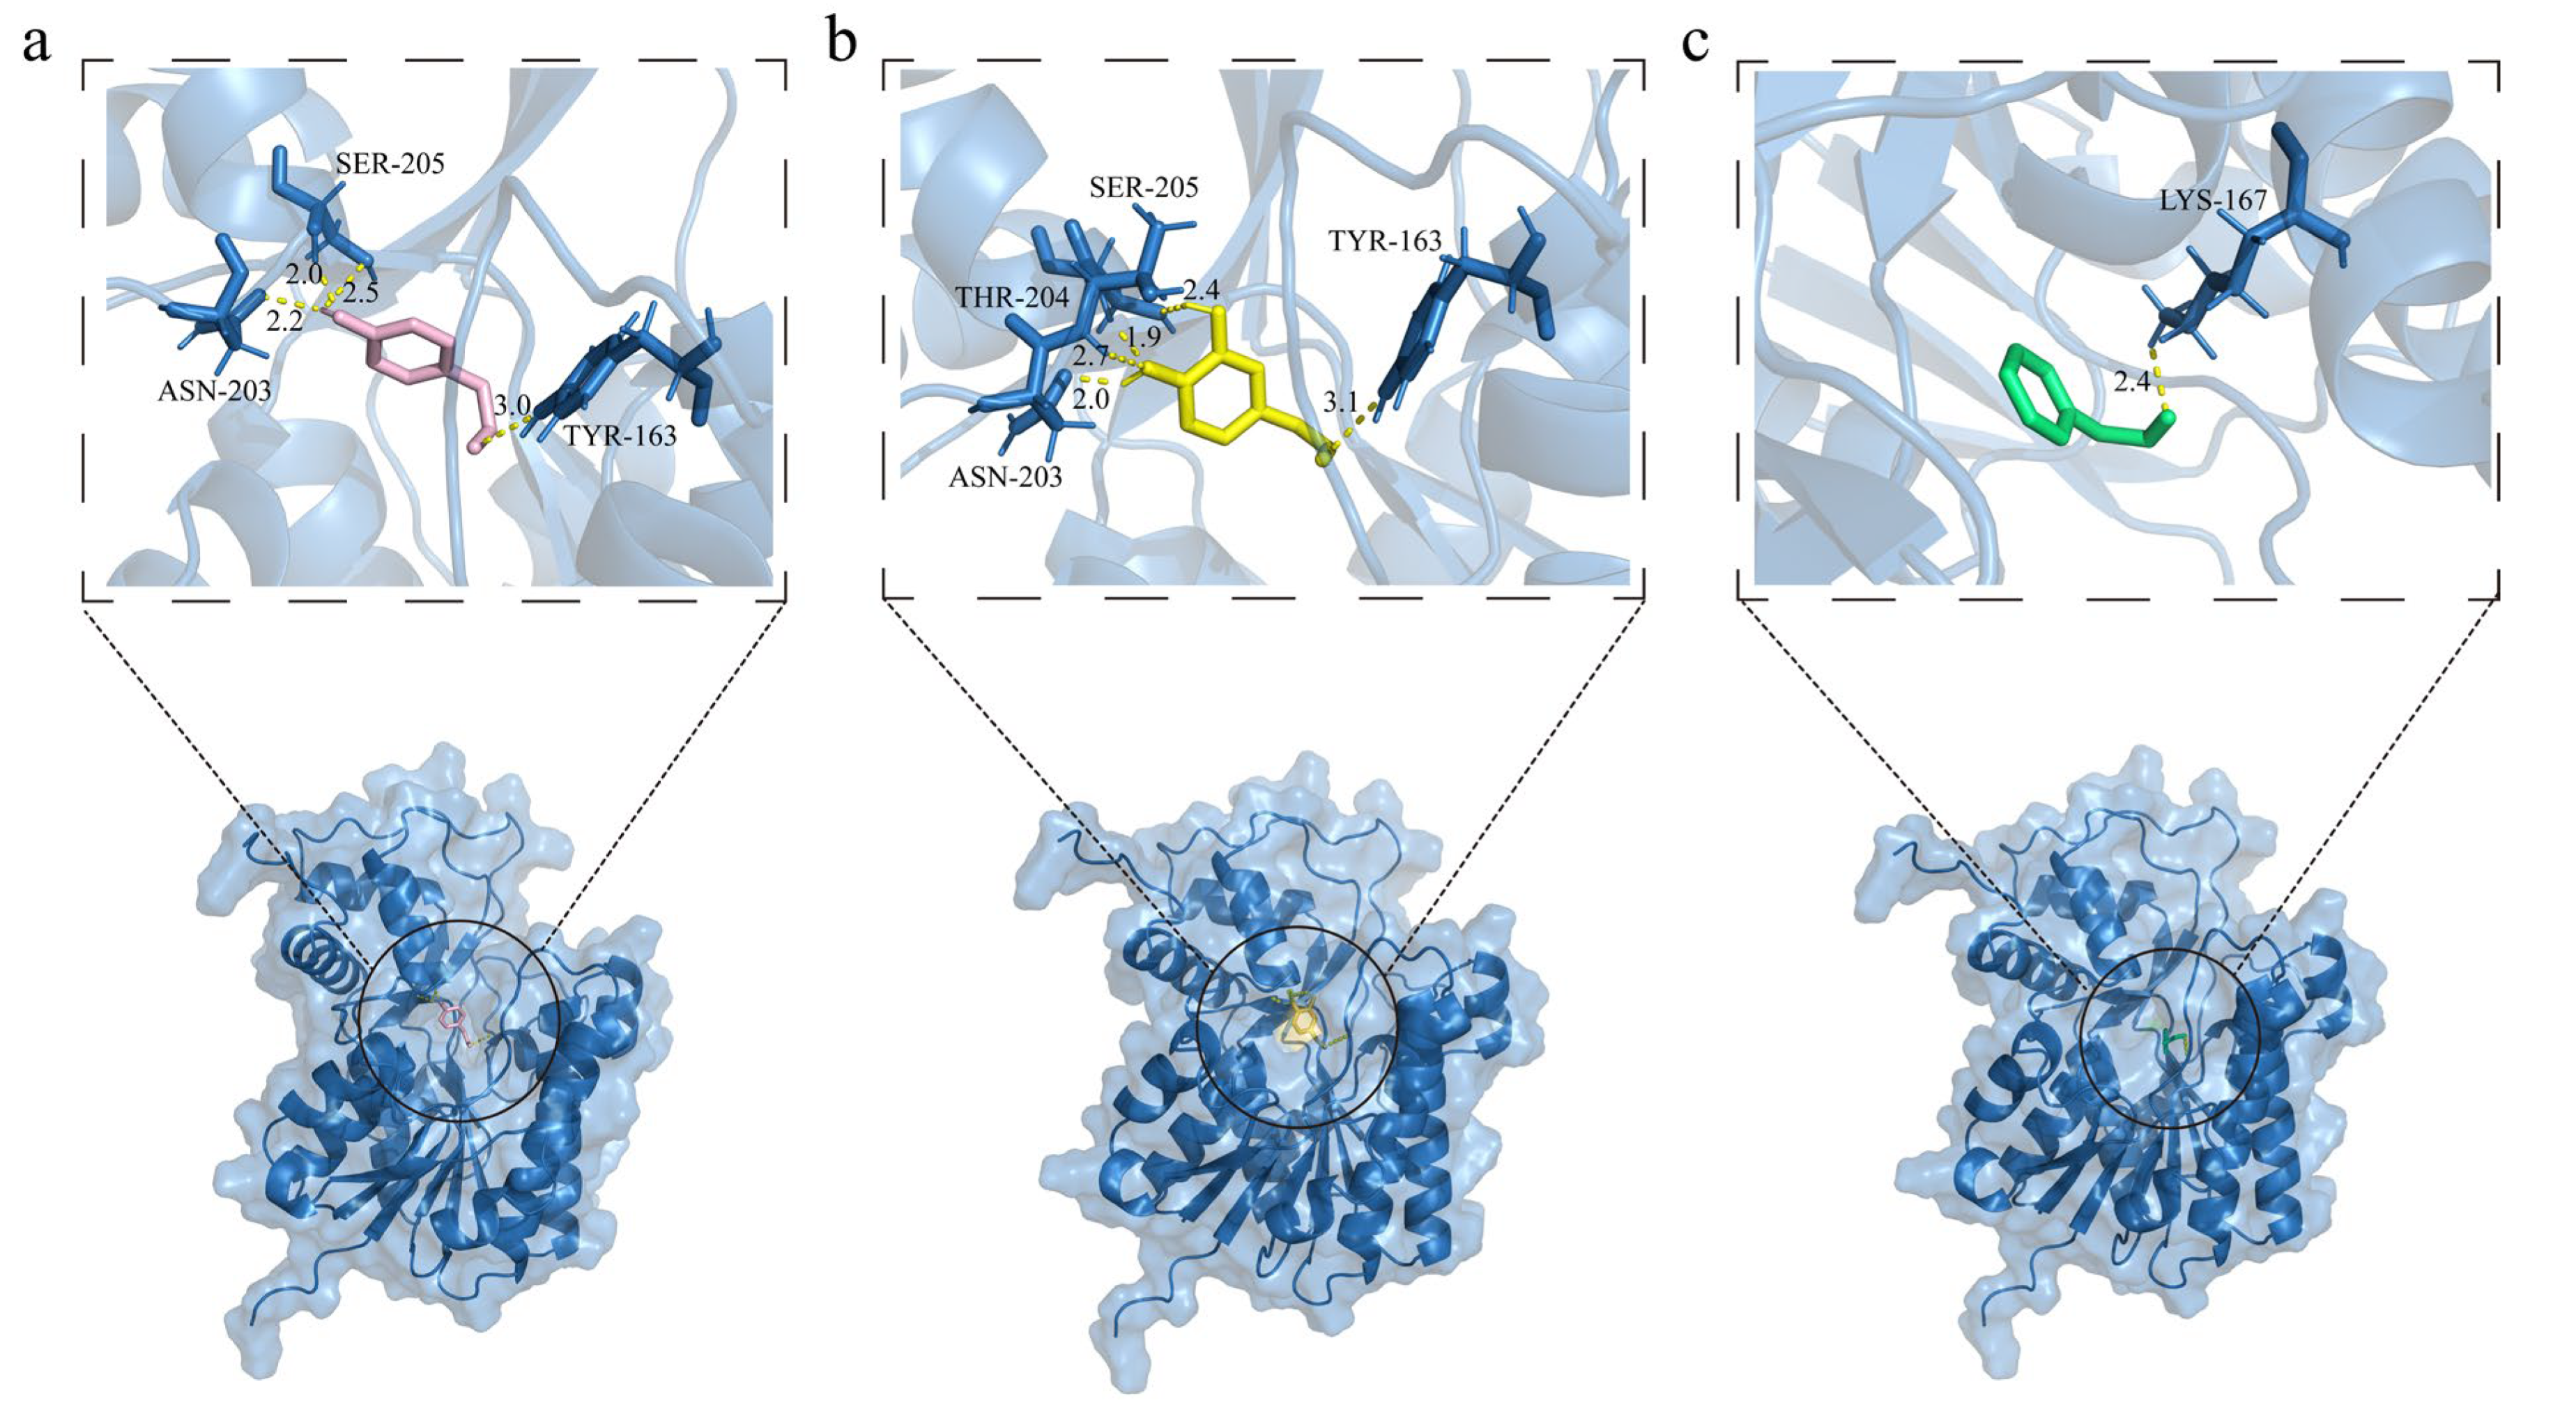
3.7. Three-Dimensional Structure Modeling of OePAR1 and Molecular Docking with Different Substrates

In this study, the three-dimensional structure of OePAR1 and 11 proteins was predicted with high accuracy using AlphaFold3, and the structure was visualized using PyMOL (Figure S3). The reliability of the 3D model was validated through a Ramachandran plot (Figure 6a). The Ramachandran plot analysis showed that 92.8% of the residues are in the favored region, 7.2% slightly deviate from the ideal angles but remain within the acceptable range, and no residues are found in the disallowed region. The average G-Factor of 0.14 indicates a high degree of structural geometric quality. The confidence of the model was further assessed using the predicted local distance difference test (PLDDT) score, with higher values reflecting greater confidence. Figure 6b presents the 3D spatial structure of OePAR1, with the majority of the structure depicted in light blue, indicating high overall model confidence. Figure 6c shows the secondary structural features of OePAR1, comprising 14 α-helices and 12 β-strands, with the light brown regions representing unordered coil structures.
In this study, the identity between OePAR1 and the previously reported heterologously expressed olive gene OePAR1.1 [37] was found to be 100% (Figure S4), confirming the reliability of the docking analysis. To investigate the structural basis of substrate recognition, molecular docking of OePAR1 with PAA, 4-HPAA, and 3,4-DHPAA was conducted using AutoDock V4.2.6, and the lowest-energy binding poses were selected for mechanistic analysis (Figure 7). Structural analysis revealed that the catalytic pocket of OePAR1 contains a conserved TYR residue positioned to potentially act as a catalytic base, alongside a hydrophobic cavity formed by VAL residues that may stabilize the aromatic moieties of substrates. The results indicated that all three substrates formed hydrogen bonds with OePAR1. The hydrogen bonds, their respective distances, and the amino acid residues involved in the hydrogen bonding interactions are shown in Figure 7. Further analysis using the Protein-Ligand Interaction Profiler (Table 2) revealed that all three substrates interact with OePAR1 through hydrogen bonding and hydrophobic interactions. Notably, 4-HPAA formed a π–π stacking interaction with OePAR1. Specifically, 3,4-DHPAA and 4-HPAA both engaged TYR, ASN, and SER residues in their hydrogen bonding interactions with OePAR1, while hydrophobic interactions were observed with VAL. The binding energy is a crucial factor in evaluating the interaction between enzymes and substrates, with lower values indicating stronger binding affinity. Among the three substrates, 3,4-DHPAA exhibited the lowest binding energy (−4.98 kcal/mol), suggesting the highest affinity for OePAR1. In contrast, PAA showed the weakest binding affinity, with a binding energy of −3.01 kcal/mol. These predicted results are in line with previous kinetic studies on PAA in the hydroxylated tyrosol biosynthetic pathway [37], further supporting the conclusions drawn in this study.

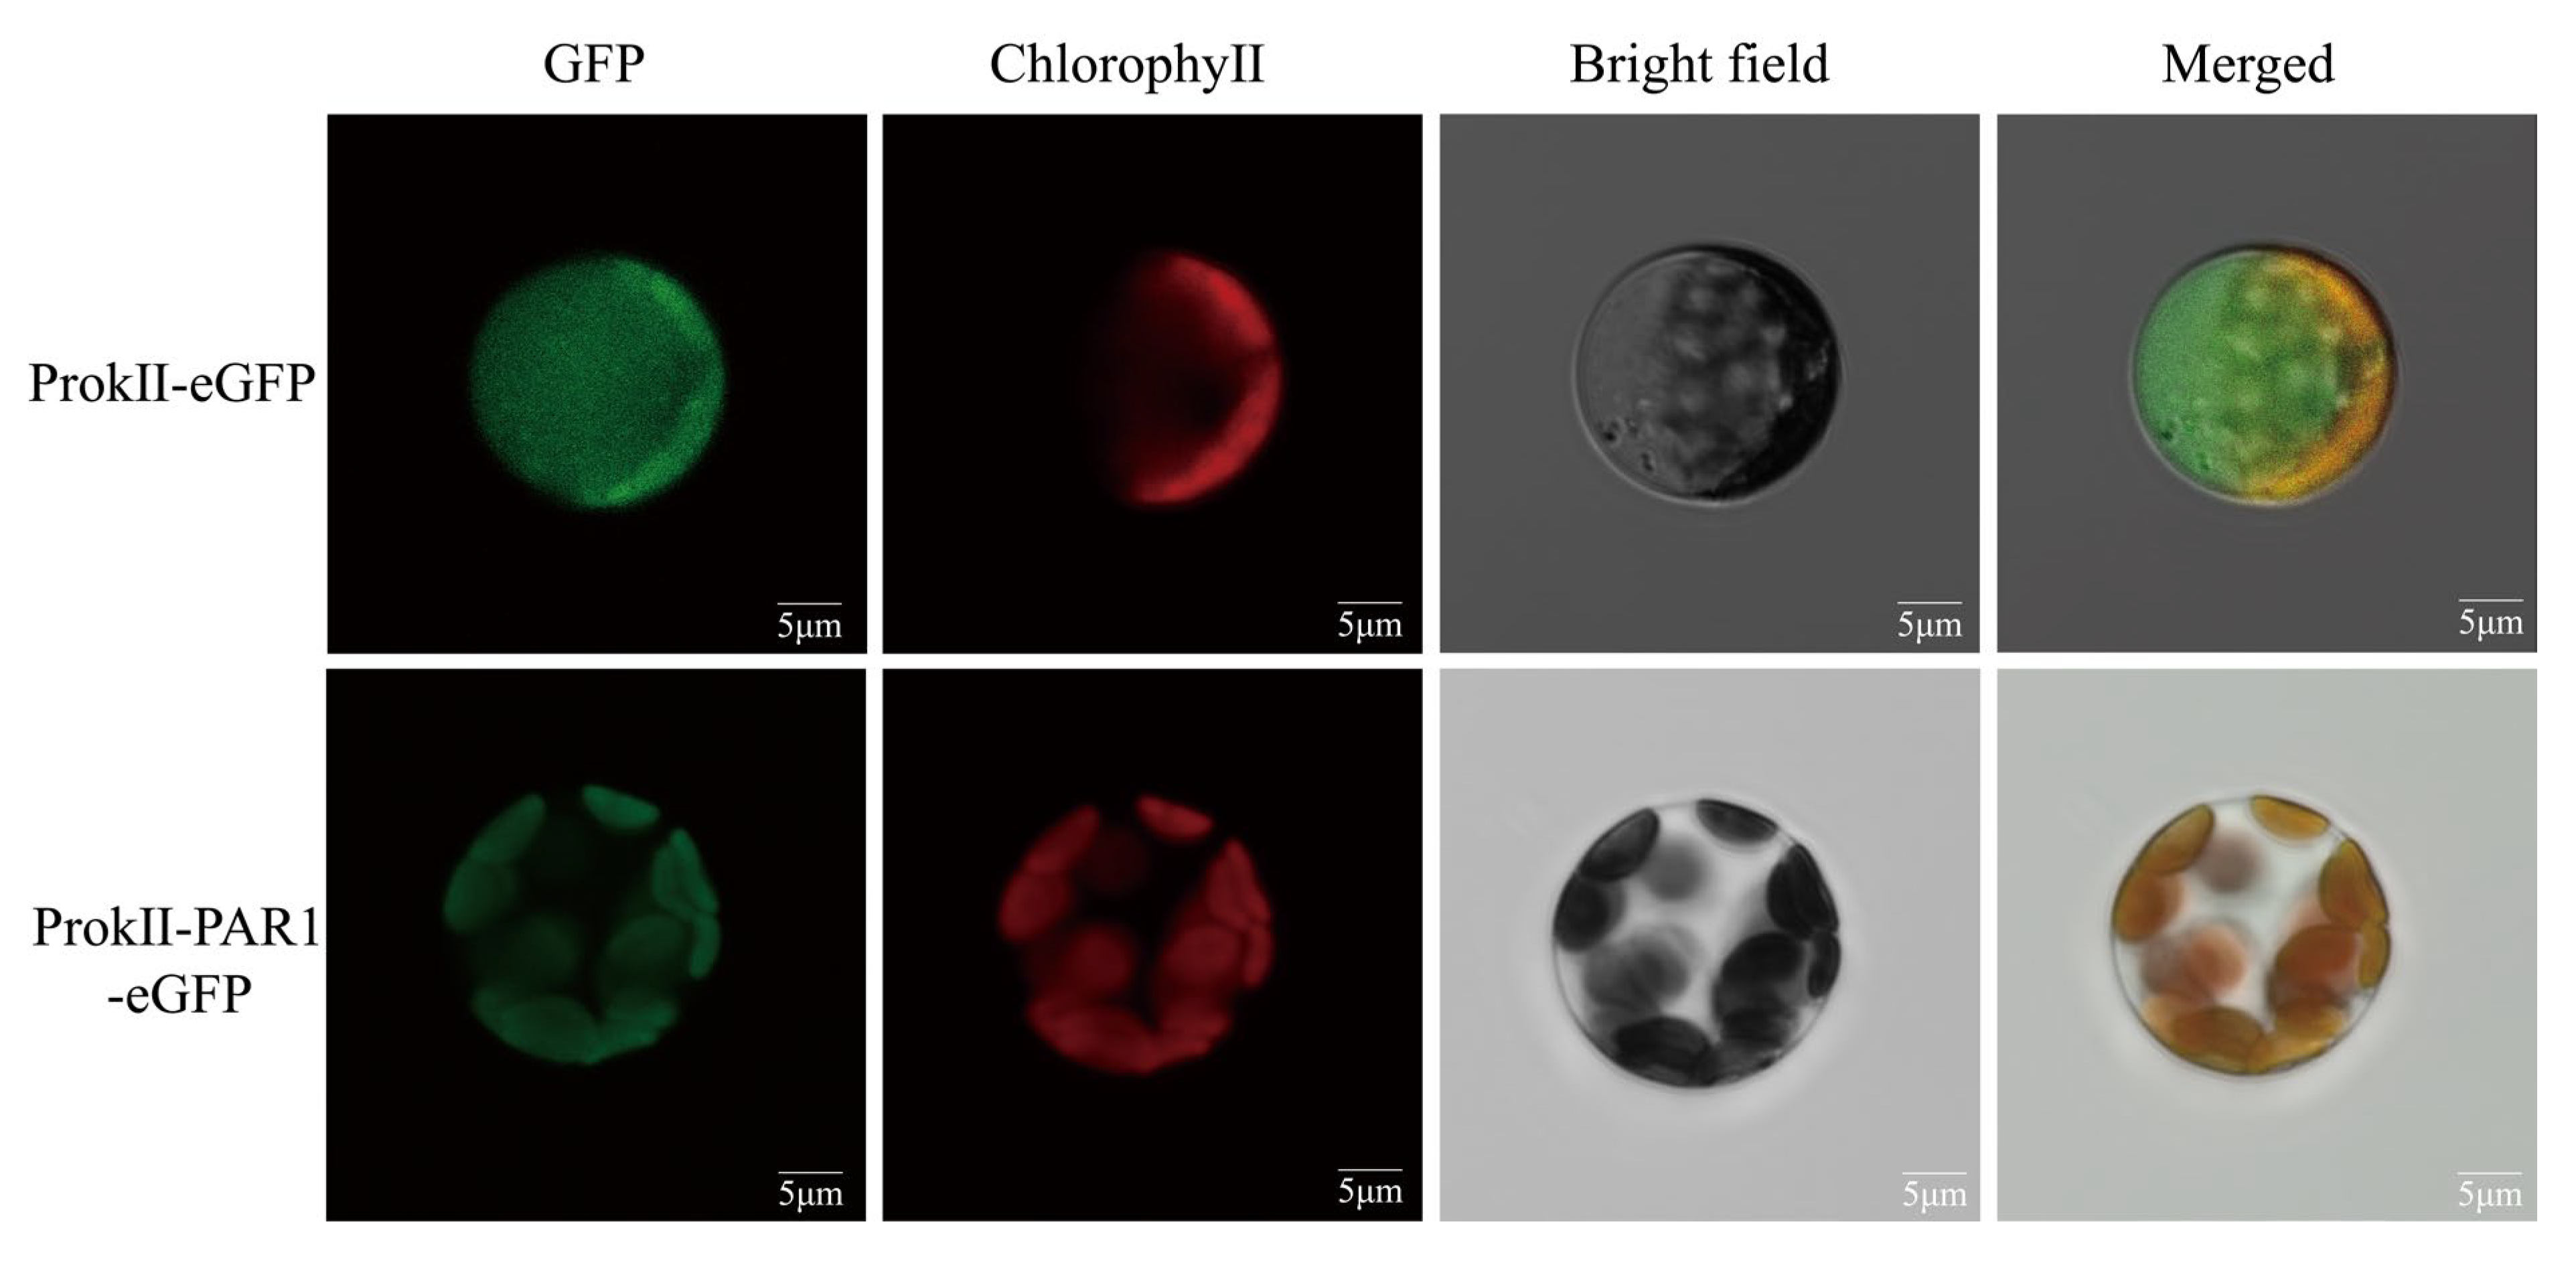
3.8. Subcellular Localization of OePAR1

Subcellular localization prediction using the WoLF PSORT tool indicated that OePAR1 is localized to the chloroplast. To further confirm its in vivo localization, an expression vector encoding OePAR1 fused to an eGFP fluorescent tag was constructed and transfected into Arabidopsis thaliana protoplasts, along with a control vector. Confocal microscopy analysis showed that the fluorescence signal of OePAR1 strongly colocalized with the auto-fluorescence of chloroplasts, thereby confirming its predominant localization to the chloroplast (Figure 8).

4. Discussion

In this study, 21 OePAR and OePAR-like genes were identified in olives. A search of the NCBI conserved domain database revealed that all 21 members of this gene family contain the “FR_SDR_e” domain. Additionally, each member of the family possesses typical NADP binding sites, active sites, and substrate binding sites characteristic of reductases. These features are consistent with those identified in previous studies on PAR [9,10,11]. Based on phylogenetic analysis, the 21 members were further categorized into three subgroups: PAR, DFR, and CCR (Figure 1b). Previous studies [15] have indicated that SDR108E belongs to the extended SDR superfamily, which encompasses PAR, DFR, and CCR enzymes. This supports the conclusion of the present study that all 21 sequences are classified within the SDR108E superfamily. Furthermore, the division of this gene family into three distinct groups on the phylogenetic tree suggests that PAR and PAR-like proteins have undergone functional differentiation during evolution.
In the functional phylogenetic tree of the PAR subgroup (Figure 1b), OePAR1, OePAR2, and OePAR3 cluster with LePAR1, suggesting that these three OePAR proteins may share similar functions with LePAR1. Previous studies have shown that LePAR1 belongs to the SDR family and preferentially catalyzes the reduction of phenylacetaldehyde when benzaldehyde, cinnamaldehyde, and phenylacetaldehyde are used as substrates. Enzyme activity assays conducted on wild-type Petunia hybrida flowers have demonstrated that LePAR1 leads to high concentrations of phenylacetaldehyde and low concentrations of phenylethanol, highlighting its role in the metabolic pathway of phenylacetaldehyde reduction [10]. Based on this, it can be inferred that OePAR1, OePAR2, and OePAR3 are likely involved in similar biological functions in Olea europaea, regulating the levels of phenylacetaldehyde and phenylethanol. In the CCR subgroup, OeCCR1, OeCCR2, and OeCCR3 cluster with LeCCR. Previous studies have shown that RNA interference (RNAi) suppression of the LeCCR in Lycopersicon esculentum led to the accumulation of more soluble phenolic compounds in the stems and leaves of transgenic plants, accompanied by a significant reduction in lignin content [34]. This observation suggests that LeCCR plays a key role in the lignin biosynthesis pathway in Lycopersicon esculentum. Therefore, it is hypothesized that OeCCR1, OeCCR2, and OeCCR3 may similarly play a crucial role in the lignin biosynthesis pathway in Olea europaea. In the DFR subgroup, only OeDFR4 shows a close phylogenetic relationship with known functional DFR proteins. DFR is a key enzyme in the anthocyanin biosynthesis pathway, and its function has been validated in previous studies. For instance, Luan et al. demonstrated that PsMYB44, a transcription factor from Paeonia suffruticosa, directly binds to the promoter region of the PsDFR gene, inhibiting DFR activity and thereby suppressing anthocyanin biosynthesis [38]. Ruan et al.’s study on the CsDFRa and CsDFRc genes in Camellia sinensis demonstrated that the expression of these genes in the Arabidopsis thaliana DFR mutant could restore the purple coloration of the petiole and seed coat, thereby confirming their involvement in anthocyanin biosynthesis [39]. These findings suggest that OeDFR4 may play a role in the anthocyanin biosynthesis pathway in olives.
As shown in Figure 2, the 21 members display a high degree of consistency in their motif patterns, suggesting that these sequences have remained conserved throughout evolution, which may indicate functional similarities. Ka/Ks analysis further supports that purifying selection likely played a significant role in the evolution of this gene family. Collinearity analysis also reveals that the expansion of this gene family is predominantly driven by segmental duplication. Gene family members may undergo functional diversification following segmental duplication, leading to the emergence of distinct functions. For example, in Glycine max, the WRKY transcription factor family expanded through segmental duplication events and subsequently underwent functional divergence under selective pressure [40]. This process of diversification may be a key factor contributing to the formation of the three functional subgroups—PAR, CCR, and DFR—within this gene family.
The further analysis of the cis-regulatory elements within this gene family revealed that Box 4 and G-box, both light-responsive elements, were the most abundant and widely distributed (Figure 4). The high frequency of these light-responsive elements suggests that this gene family may play a significant role in physiological processes associated with photosynthesis, light regulation, or responses to light stress [41,42,43]. Genes enriched with light-responsive elements are often linked to the synthesis of secondary metabolites, particularly flavonoids and anthocyanins. For instance, a study by Zhang et al. demonstrated that bHLH transcription factors in Camellia sinensis interact with light signaling transduction factors, thereby indirectly promoting the accumulation of anthocyanins. This suggests a potential regulatory network in which light-responsive elements contribute to the biosynthesis of these important secondary metabolites [44]. Furthermore, shading treatments in Prunus tomentosa led to a significant reduction in total anthocyanin content, highlighting the critical role of light conditions in regulating anthocyanin accumulation. This finding underscores the importance of light as a key environmental factor influencing the biosynthesis of anthocyanins in plants [45]. The bar chart in Figure 4 illustrates that the number of stress-responsive and hormone-responsive elements is also relatively high in this gene family, suggesting that these genes may be involved in stress and hormone response pathways. Previous studies have demonstrated that stress and hormone signaling play crucial roles in regulating the accumulation of metabolites within plant secondary metabolic pathways, further supporting the potential functional roles of these genes in responding to environmental and physiological stimuli [46]. PAR, CCR, and DFR are key enzymes involved in the biosynthesis of polyphenolic compounds [47], organic polymers [48] and anthocyanins [49], respectively. These enzymes play pivotal roles in the regulation of their respective metabolic pathways, contributing to the synthesis of important secondary metabolites in plants. The enrichment of light-responsive elements, stress-responsive elements, and hormone-responsive elements in the gene family suggests that these genes may be regulated by cis-acting elements in their promoters. This regulatory network likely contributes to the synthesis of polyphenols and flavonoids, linking environmental factors such as light and stress conditions to the regulation of key metabolic pathways in plant secondary metabolism.
In the analysis of gene expression patterns (Figure 5), we observed that genes from the three subgroups—PAR, CCR, and DFR—are specifically highly expressed in certain organs, indicating potential tissue-specific roles in olives. This organ-specific expression may reflect their involvement in distinct physiological processes or metabolic pathways within different plant tissues. Rao et al. employed a combination of metabolomic analysis, PacBio Iso-seq, and Illumina RNA-seq transcriptomics to investigate the relationship between metabolites and gene expression in olive fruits at harvest. Their study revealed that PAR genes play a significant role in the biosynthesis of hydroxytyrosol [47]. In this study, OePAR1, OePAR2, and OePAR3 were highly expressed in the fruit, suggesting that these three PAR genes are involved in the biosynthesis of hydroxytyrosol and play a crucial role in determining oil quality. In the CCR subgroup, OeCCR1, OeCCR2, OeCCR3, OeCCR5, OeCCR6, OeCCR7, and OeCCR9 exhibited high expression levels in the roots and stems. Previous studies have shown that lignin content is positively correlated with plant resistance to lodging, and CCR enzymes are key components in the lignin biosynthesis pathway. These enzymes primarily catalyze the conversion of cinnamoyl-CoA compounds into cinnamaldehyde derivatives, which are then incorporated into lignin monomers [33,50]. This suggests that the high expression levels of OeCCRs in the roots and stems play a critical role in xylem development, providing structural support and enhancing stress resistance in olives. In the DFR subgroup, all four OeDFRs exhibit high expression levels in the petals of olives. DFR is a crucial enzyme in the flavonoid biosynthesis pathway, primarily involved in the synthesis of anthocyanins and proanthocyanidins [51]. Thus, the four OeDFRs in olives are likely involved in the key steps of flavonoid biosynthesis in the petals. Based on the combined results of phylogenetic tree analysis and expression pattern analysis, the three subgroups—PAR, CCR, and DFR—play distinct roles in plant metabolism, collectively contributing to the plant’s adaptation to environmental conditions and enhancing its stress resistance. Further investigation into the regulatory mechanisms underlying the expression of these genes could not only improve disease and stress resistance in olives but also aid in the development of olive varieties with enhanced nutritional and commercial value.
In the docking study of OePAR1 with the three substrates, 3,4-DHPAA exhibited the lowest binding free energy (−4.98 kcal/mol), indicating the strongest affinity between this substrate and OePAR1 at the bioinformatics level. This enhanced binding affinity may be attributed to the multiple hydroxyl groups in its molecular structure, which likely facilitate the formation of more hydrogen bonds with the enzyme, thereby strengthening the interaction between the substrate and OePAR1 [52]. Rosario et al. cloned the OePAR1.1 and OePAR1.2 genes from olives and expressed them in Escherichia coli. Their study revealed that the recombinant OePARs exhibited high substrate specificity for 3,4-DHPAA, while no phenylethanol production was detected when 4-HPAA was used as the substrate [37]. The consistency between this experiment and the molecular docking results presented in this study confirms the reliability and accuracy of the docking predictions. These findings establish a solid theoretical basis for future research on the expression patterns and functional roles of OePAR1 in olives.

5. Conclusions

In this study, 21 OePAR and OePAR-likes genes were identified in olives through local BLAST alignment. A phylogenetic tree was constructed, classifying these genes into three subgroups: PAR, CCR, and DFR. Comprehensive analyses were performed on the physicochemical properties, structural features, cis-acting elements, evolutionary relationships, and expression patterns of these genes. Molecular docking analysis of OePAR1 with three substrates revealed the strongest binding affinity with 3,4-DHPAA. Subcellular localization studies revealed that OePAR1 is localized to the chloroplast. This study provides a detailed analysis of the OePAR gene family, using the key enzyme PAR in the final step of the hydroxytyrosol biosynthesis pathway as a reference. These findings offer a solid foundation for further investigations into the molecular mechanisms underlying olive metabolism.

Supplementary Materials

The following supporting information can be downloaded at: https://www.mdpi.com/article/10.3390/f16040630/s1, Table S1: Predicted physicochemical properties of OePARs, OeCCRs and OeDFRs; Table S2: Accession numbers of genes used for phylogenetic analysis; Figure S1: Hydroxytyrosol biosynthesis pathway; Figure S2: TMHMM result of 21 proteins; Figure S3: The prediction of the three-dimensional structures of 12 proteins; Figure S4: The alignment of the protein sequences of OePAR1.1 and OePAR1.

Author Contributions

G.R. planned and designed the research; Y.F., Q.C., S.L., Y.L., G.Y., C.W. and Q.L. designed and performed the experiments; Y.F. analyzed the data and wrote the original manuscript; G.R. and J.Z. oversaw and managed the research activity and reviewed the manuscript. All authors have read and agreed to the published version of the manuscript.

Funding

This work was supported by Fundamental Research Funds of CAF (CAFYBB2023PA005-2, CAFYBB2021QC001) and National Natural Science Foundation of China (32371837).

Data Availability Statement

The original contributions presented in this study are included in the article/Supplementary Material. Further inquiries can be directed to the corresponding author.

Conflicts of Interest

The authors declare no conflicts of interest.

References

  1. Unver, T.; Wu, Z.; Sterck, L.; Turktas, M.; Lohaus, R.; Li, Z.; Yang, M.; He, L.; Deng, T.; Escalante, F.J.; et al. Genome of wild olive and the evolution of oil biosynthesis. Proc. Natl. Acad. Sci. USA 2017, 114, E9413–E9422. [Google Scholar] [PubMed]
  2. Gullón, P.; Gullón, B.; Astray, G.; Carpena, M.; Fraga-Corral, M.; Prieto, M.A.; Simal-Gandara, J. Valorization of by-products from olive oil industry and added-value applications for innovative functional foods. Food Res. Int. 2020, 137, 109683. [Google Scholar] [PubMed]
  3. Tripoli, E.; Giammanco, M.; Tabacchi, G.; Di Majo, D.; Giammanco, S.; La Guardia, M. The phenolic compounds of olive oil: Structure, biological activity and beneficial effects on human health. Nutr. Res. Rev. 2005, 18, 98–112. [Google Scholar] [CrossRef] [PubMed]
  4. Alagna, F.; Geu-Flores, F.; Kries, H.; Panara, F.; Baldoni, L.; O’Connor, S.E.; Osbourn, A. Identification and Characterization of the Iridoid Synthase Involved in Oleuropein Biosynthesis in Olive (Olea europaea) Fruits. J. Biol. Chem. 2016, 291, 5542–5554. [Google Scholar] [CrossRef]
  5. Raederstorff, D. Antioxidant activity of olive polyphenols in humans: A review. Int. J. Vitam. Nutr. Res. 2009, 79, 152–165. [Google Scholar]
  6. Guodong, R.; Jianguo, Z.; Xiaoxia, L.; Ying, L. Identification of putative genes for polyphenol biosynthesis in olive fruits and leaves using full-length transcriptome sequencing. Food Chem. 2019, 300, 125246. [Google Scholar]
  7. Sánchez, R.; García-Vico, L.; Sanz, C.; Pérez, A.G. An Aromatic Aldehyde Synthase Controls the Synthesis of Hydroxytyrosol Derivatives Present in Virgin Olive Oil. Antioxidants 2019, 8, 352. [Google Scholar] [CrossRef]
  8. Rao, G.; Zhang, J.; Liu, X.; Lin, C.; Xin, H.; Xue, L.; Wang, C. De novo assembly of a new Olea europaea genome accession using nanopore sequencing. Hortic. Res. 2021, 8, 64. [Google Scholar]
  9. Torrens-Spence, M.P.; Pluskal, T.; Li, F.S.; Carballo, V.; Weng, J.K. Complete Pathway Elucidation and Heterologous Reconstitution of Rhodiola Salidroside Biosynthesis. Mol. Plant 2018, 11, 205–217. [Google Scholar]
  10. Tieman, D.M.; Loucas, H.M.; Kim, J.Y.; Clark, D.G.; Klee, H.J. Tomato phenylacetaldehyde reductases catalyze the last step in the synthesis of the aroma volatile 2-phenylethanol. Phytochemistry 2007, 68, 2660–2669. [Google Scholar]
  11. Chen, X.M.; Kobayashi, H.; Sakai, M.; Hirata, H.; Asai, T.; Ohnishi, T.; Baldermann, S.; Watanabe, N. Functional characterization of rose phenylacetaldehyde reductase (PAR), an enzyme involved in the biosynthesis of the scent compound 2-phenylethanol. J. Plant Physiol. 2011, 168, 88–95. [Google Scholar] [CrossRef] [PubMed]
  12. Cui, Q.; Liu, Q.; Fan, Y.; Wang, C.; Li, Y.; Li, S.; Zhang, J.; Rao, G. Functional differentiation of olive PLP_deC genes: Insights into metabolite biosynthesis and genetic improvement at the whole-genome level. Plant Cell Rep. 2024, 43, 127. [Google Scholar] [PubMed]
  13. Filling, C.; Filling, C.; Berndt, K.D.; Benach, J.; Knapp, S.; Prozorovski, T.; Nordling, E.; Ladenstein, R.; Jörnvall, H.; Oppermann, U. Critical residues for structure and catalysis in short-chain dehydrogenases/reductases. J. Biol. Chem. 2002, 277, 25677–25684. [Google Scholar]
  14. Kavanagh, K.L.; Jörnvall, H.; Persson, B.; Oppermann, U. Medium- and short-chain dehydrogenase/reductase gene and protein families: The SDR superfamily: Functional and structural diversity within a family of metabolic and regulatory enzymes. Cell Mol. Life Sci. 2008, 65, 3895–3906. [Google Scholar]
  15. Moummou, H.; Kallberg, Y.; Tonfack, L.B.; Persson, B.; van der Rest, B. The plant short-chain dehydrogenase (SDR) superfamily: Genome-wide inventory and diversification patterns. BMC Plant Biol. 2012, 12, 219. [Google Scholar]
  16. Ladenstein, R.; Winberg, J.O.; Benach, J. Medium- and short-chain dehydrogenase/reductase gene and protein families: Structure-function relationships in short-chain alcohol dehydrogenases. Cell Mol. Life Sci. 2008, 65, 3918–3935. [Google Scholar]
  17. Kim, J.S.; Patel, S.K.S.; Tiwari, M.K.; Lai, C.; Kumar, A.; Kim, Y.S.; Kalia, V.C.; Lee, J.K. Phe-140 Determines the Catalytic Efficiency of Arylacetonitrilase from Alcaligenes faecalis. Int. J. Mol. Sci. 2020, 21, 7859. [Google Scholar] [CrossRef]
  18. Kumar, S.; Stecher, G.; Tamura, K. MEGA7: Molecular Evolutionary Genetics Analysis Version 7.0 for Bigger Datasets. Mol. Biol. Evol. 2016, 33, 1870–1874. [Google Scholar]
  19. Xie, J.; Chen, Y.; Cai, G.; Cai, R.; Hu, Z.; Wang, H. Tree Visualization By One Table (tvBOT): A web application for visualizing, modifying and annotating phylogenetic trees. Nucleic Acids Res. 2023, 51, W587–W592. [Google Scholar]
  20. Bailey, T.L.; Johnson, J.; Grant, C.E.; Noble, W.S. The MEME Suite. Nucleic Acids Res. 2015, 43, W39–W49. [Google Scholar]
  21. Hu, B.; Jin, J.; Guo, A.Y.; Zhang, H.; Luo, J.; Gao, G. GSDS 2.0: An upgraded gene feature visualization server. Bioinformatics 2015, 31, 1296–1297. [Google Scholar] [CrossRef] [PubMed]
  22. Chen, C.; Chen, H.; Zhang, Y.; Thomas, H.R.; Frank, M.H.; He, Y.; Xia, R. TBtools: An Integrative Toolkit Developed for Interactive Analyses of Big Biological Data. Mol. Plant 2020, 13, 1194–1202. [Google Scholar] [CrossRef] [PubMed]
  23. Lescot, M.; Déhais, P.; Thijs, G.; Marchal, K.; Moreau, Y.; Van de Peer, Y.; Rouzé, P.; Rombauts, S. PlantCARE, a database of plant cis-acting regulatory elements and a portal to tools for in silico analysis of promoter sequences. Nucleic Acids Res. 2002, 30, 325–327. [Google Scholar] [CrossRef]
  24. Wang, C.; Xue, L.; Cui, Q.; Liu, Q.; Zhang, J.; Rao, G. Genome-wide identification of the cytochrome P450 superfamily in Olea europaea helps elucidate the synthesis pathway of oleuropein to improve the quality of olive oil. Sci. Hortic. 2022, 304, 111291. [Google Scholar] [CrossRef]
  25. Li, H.; Handsaker, B.; Wysoker, A.; Fennell, T.; Ruan, J.; Homer, N.; Marth, G.; Abecasis, G.; Durbin, R.; 1000 Genome Project Data Processing Subgroup. The Sequence Alignment/Map format and SAMtools. Bioinformatics 2009, 25, 2078–2079. [Google Scholar] [CrossRef]
  26. Bolger, A.M.; Lohse, M.; Usadel, B. Trimmomatic: A flexible trimmer for Illumina sequence data. Bioinformatics 2014, 30, 2114–2120. [Google Scholar] [CrossRef]
  27. Sirén, J.; Välimäki, N.; Mäkinen, V. Indexing Graphs for Path Queries with Applications in Genome Research. IEEE/ACM Trans. Comput. Biol. Bioinform. 2014, 11, 375–388. [Google Scholar] [CrossRef]
  28. Pertea, M.; Pertea, G.M.; Antonescu, C.M.; Chang, T.C.; Mendell, J.T.; Salzberg, S.L. StringTie enables improved reconstruction of a transcriptome from RNA-seq reads. Nat. Biotechnol. 2015, 33, 290–295. [Google Scholar] [CrossRef]
  29. Abramson, J.; Adler, J.; Dunger, J.; Evans, R.; Green, T.; Pritzel, A.; Ronneberger, O.; Willmore, L.; Ballard, A.J.; Bambrick, J. Accurate structure prediction of biomolecular interactions with AlphaFold 3. Nature 2024, 630, 493–500. [Google Scholar] [CrossRef]
  30. Xiaoxia, L.; Zhang, J.; Jinkai, S.; Ying, L.; Guodong, R. The Salix SmSPR1 Involved in Light-Regulated Cell Expansion by Modulating Microtubule Arrangement. Front. Cell Dev. Biol. 2019, 7, 309. [Google Scholar] [CrossRef]
  31. Moore, R.C.; Purugganan, M.D. The early stages of duplicate gene evolution. Proc. Natl. Acad. Sci. USA 2003, 100, 15682–15687. [Google Scholar] [CrossRef] [PubMed]
  32. Cannon, S.B.; Mitra, A.; Baumgarten, A.; Young, N.D.; May, G. The roles of segmental and tandem gene duplication in the evolution of large gene families in Arabidopsis thaliana. BMC Plant Biol. 2004, 4, 10. [Google Scholar] [CrossRef] [PubMed]
  33. Liu, Q.; Luo, L.; Zheng, L. Lignins: Biosynthesis and Biological Functions in Plants. Int. J. Mol. Sci. 2018, 19, 335. [Google Scholar] [CrossRef] [PubMed]
  34. van der Rest, B.; Danoun, S.; Boudet, A.M.; Rochange, S.F. Down-regulation of cinnamoyl-CoA reductase in tomato (Solanum lycopersicum L.) induces dramatic changes in soluble phenolic pools. J. Exp. Bot. 2006, 57, 1399–1411. [Google Scholar] [CrossRef]
  35. Chao, N.; Li, N.; Qi, Q.; Li, S.; Lv, T.; Jiang, X.N.; Gai, Y. Characterization of the cinnamoyl-CoA reductase (CCR) gene family in Populus tomentosa reveals the enzymatic active sites and evolution of CCR. Planta 2017, 245, 61–75. [Google Scholar] [CrossRef]
  36. Barakat, A.; Yassin, N.B.; Park, J.S.; Choi, A.; Herr, J.; Carlson, J.E. Comparative and phylogenomic analyses of cinnamoyl-CoA reductase and cinnamoyl-CoA-reductase-like gene family in land plants. Plant Sci. 2011, 181, 249–257. [Google Scholar] [CrossRef]
  37. Sánchez, R.; Bahamonde, C.; Sanz, C.; Pérez, A.G. Identification and Functional Characterization of Genes Encoding Phenylacetaldehyde Reductases That Catalyze the Last Step in the Biosynthesis of Hydroxytyrosol in Olive. Plants 2021, 10, 1268. [Google Scholar] [CrossRef]
  38. Luan, Y.; Chen, Z.; Tang, Y.; Sun, J.; Meng, J.; Tao, J.; Zhao, D. Tree peony PsMYB44 negatively regulates petal blotch distribution by inhibiting dihydroflavonol-4-reductase gene expression. Ann. Bot. 2023, 131, 323–334. [Google Scholar] [CrossRef]
  39. Ruan, H.; Shi, X.; Gao, L.; Rashid, A.; Li, Y.; Lei, T.; Dai, X.; Xia, T.; Wang, Y. Functional analysis of the dihydroflavonol 4-reductase family of Camellia sinensis: Exploiting key amino acids to reconstruct reduction activity. Hortic. Res. 2022, 9, uhac098. [Google Scholar] [CrossRef]
  40. Yin, G.; Xu, H.; Xiao, S.; Qin, Y.; Li, Y.; Yan, Y.; Hu, Y. The large soybean (Glycine max) WRKY TF family expanded by segmental duplication events and subsequent divergent selection among subgroups. BMC Plant Biol. 2013, 13, 148. [Google Scholar] [CrossRef]
  41. Liu, L.; Xu, W.; Hu, X.; Liu, H.; Lin, Y. W-box and G-box elements play important roles in early senescence of rice flag leaf. Sci. Rep. 2016, 6, 20881. [Google Scholar]
  42. Müller, M.; Niesar, M.; Berens, I.; Gailing, O. Genotyping by sequencing reveals lack of local genetic structure between two German Ips typographus L. populations. For. Res. 2022, 2, 1. [Google Scholar]
  43. Li, J.; Terzaghi, W.; Gong, Y.; Li, C.; Ling, J.J.; Fan, Y.; Qin, N.; Gong, X.; Zhu, D.; Deng, X.W. Modulation of BIN2 kinase activity by HY5 controls hypocotyl elongation in the light. Nat. Commun. 2020, 11, 1592. [Google Scholar] [PubMed]
  44. Zhang, K.; Lin, C.; Chen, B.; Lin, Y.; Su, H.; Du, Y.; Zhang, H.; Zhou, H.; Ji, R.; Zhang, L. A light responsive transcription factor CsbHLH89 positively regulatesanthocyanidin synthesis in tea (Camellia sinensis). Sci. Hortic. 2023, 327, 112784. [Google Scholar] [CrossRef]
  45. Zhang, Y.; Chen, C.; Cui, Y.; Du, Q.; Tang, W.; Yang, W.; Kou, G.; Tang, W.; Chen, H.; Gong, R. Potential regulatory genes of light induced anthocyanin accumulation in sweet cherry identified by combining transcriptome and metabolome analysis. Front. Plant Sci. 2023, 14, 1238624. [Google Scholar]
  46. Zagoskina, N.V.; Zubova, M.Y.; Nechaeva, T.L.; Kazantseva, V.V.; Goncharuk, E.A.; Katanskaya, V.M.; Baranova, E.N.; Aksenova, M.A. Polyphenols in Plants: Structure, Biosynthesis, Abiotic Stress Regulation, and Practical Applications (Review). Int. J. Mol. Sci. 2023, 24, 13874. [Google Scholar] [CrossRef]
  47. Rao, G.; Zhang, J.; Liu, X.; Li, X.; Wang, C. Combined Metabolome and Transcriptome Profiling Reveal Optimal Harvest Strategy Model Based on Different Production Purposes in Olive. Foods 2021, 10, 360. [Google Scholar] [CrossRef]
  48. Sun, N.; Hu, J.; Li, C.; Wang, X.; Gai, Y.; Jiang, X. Fusion gene 4CL-CCR promotes lignification in tobacco suspension cells. Plant Cell Rep. 2023, 42, 939–952. [Google Scholar]
  49. Xiao, W.; Liu, A.; Lai, W.; Wang, J.; Li, X.; Zha, Y.; Zhao, B.; Chen, X.; Yu, H. Combined transcriptome and metabolome analysis revealed the molecular mechanisms of fruit skin coloration in pink strawberry. Front. Plant Sci. 2024, 15, 1486892. [Google Scholar] [CrossRef]
  50. Anterola, A.M.; Lewis, N.G. Trends in lignin modification: A comprehensive analysis of the effects of genetic manipulations/mutations on lignification and vascular integrity. Phytochemistry 2002, 61, 221–294. [Google Scholar]
  51. Petit, P.; Granier, T.; d’Estaintot, B.L.; Manigand, C.; Bathany, K.; Schmitter, J.M.; Lauvergeat, V.; Hamdi, S.; Gallois, B. Crystal structure of grape dihydroflavonol 4-reductase, a key enzyme in flavonoid biosynthesis. J. Mol. Biol. 2007, 368, 1345–1357. [Google Scholar]
  52. Jose, S.; Gupta, M.; Sharma, U.; Quintero-Saumeth, J.; Dwivedi, M. Potential of phytocompounds from Brassica oleracea targeting S2-domain of SARS-CoV-2 spike glycoproteins: Structural and molecular insights. J. Mol. Struct. 2022, 1254, 132369. [Google Scholar]
Figure 1. (a) A phylogenetic tree was constructed using PAR, CCR, and DFR protein sequences from olive and other species. Ap, Agapanthus praecox; Ang, Angelonia angustifolia; Am, Antirrhinum majus; At, Arabidopsis thaliana; Bn, Brassica napus; Cs, Cannabis sativa; Ci, Carya illinoinensis; Fh, Freesia hybrida; Gb, Ginkgo biloba; Gh, Gossypium hirsutum; Ih, Iris × hollandica; Ls, Lactuca sativa; Lh, Lilium hybrid; Lp, Lolium perenne; Le, Lycopersicon esculentum; Md, Malus domestica; Os, Oryza sativa; Pf, Perilla frutescens; Ph, Petunia hybrida; Pa, Picea abies; Pm, Pinus massoniana; Pto, Populus tomentosa; Pt, Populus trichocarpa; Pb, Pyrus×bretschneideri; Rr4H, Rhodiola rosea; rose, Rosa×damascena; Sl, Solanum lycopersicum; Vv, Vitis vinifera; Zm, Zea mays. (b) A functional phylogenetic tree was constructed using 21 sequences and functionally validated PARs, CCRs, and DFRs from other species. Dc, Dianthus caryophyllus; Eg, Eucalyptus gunnii; Pv, Panicum virgatum; Rh, Rosa hybrida; Sb, Sorghum bicolor. Accession numbers are given in Table S2.
Forests 16 00630 g001
Figure 2. Exon–intron structure and conserved motifs of OePARs, OeCCRs, and OeDFRs.
Forests 16 00630 g002
Figure 3. Chromosomal localization and duplication events. The red lines indicate collinear relationships among family members (Left). Darker regions indicate higher gene density along the chromosome (Right).
Forests 16 00630 g003
Figure 4. Cis-acting element analysis of OePARs, OeCCRs, and OeDFRs genes. The size of the points varies from small to large, and the color intensity ranges from light to dark, reflecting the quantity from low to high. In the bar chart, different colors represent the number of cis-regulatory elements of each category in each gene. The x-axis represents the number of cis-acting elements.
Forests 16 00630 g004
Figure 5. Expression heatmap of OePARs, OeCCRs, and OeDFRs in different tissues.
Forests 16 00630 g005
Figure 6. (a) Based on the Ramachandran plot, the quality of the OePAR1 protein model was assessed. The x-axis (Φ, phi) represents the dihedral angle describing rotation of the peptide plane relative to the preceding amino acid residue. The y-axis (Ψ, psi) represents the dihedral angle describing rotation of the peptide plane relative to the subsequent amino acid residue. The lettered regions in the diagram indicate: A, core alpha; a, allowed alpha; ~a, generous alpha; B, core beta; b, allowed beta; ~b, generous beta; L, core left-handed alpha; l, allowed left-hand alpha; ~l, generous left-handed alpha; p, allowed epsilon; ~p, generous epsilon. (b) The three-dimensional structure of OePAR1 predicted by AlphaFold 3 is shown in the figure. Four colors represent different confidence levels: light blue indicates high confidence regions with pLDDT values greater than 90; cyan indicates moderate confidence regions with pLDDT values between 70 and 90; yellow indicates low confidence regions with pLDDT values between 50 and 70; and red indicates extremely low confidence regions with pLDDT values below 50. (c) The secondary structure of the OePAR1 model displayed in PyMOL is shown. Cyan represents α-helices, purple represents β-strands, and light brown represents random coil regions.
Forests 16 00630 g006
Figure 7. Molecular docking of the OePAR1 model with three substrates was performed and visualized. In each panel, the blue part represents the OePAR1 enzyme, while the yellow dashed lines indicate hydrogen bonds. The residues involved in the hydrogen bonding interactions and the corresponding hydrogen bond distances are shown in black text. In panel (a), the pink part represents 4-HPAA, in panel (b), the yellow part represents 3,4-DHPAA, and in panel (c), the green part represents PAA.
Forests 16 00630 g007
Figure 8. Subcellular localization of OePAR1. The first column shows the eGFP channel, the second column shows chlorophyll autofluorescence, the third column shows the bright field, and the fourth column shows an overlay of the three fluorescence channels. The first row shows the results of protoplasts transformed with the empty vector ProkII-eGFP, while the second row shows the results of protoplasts transformed with the ProkII-PAR1-eGFP expression vector containing OePAR1.
Forests 16 00630 g008
Table 1. Ka/Ks analysis of gene duplication pairs.
seq1seq2KaKsKa/Ks
OeDFR1OeDFR35.61 × 10−25.38 × 10−21.04
OeCCR3OeCCR21.37 × 10−21.60 × 10−20.86
OePAR1OePAR31.33 × 10−34.35 × 10−30.31
OePAR5OePAR40.291.110.26
OeCCR8OeCCR98.19 × 10−20.310.26
OeCCR6OePAR40.502.070.24
OeCCR5OeCCR64.73 × 10−20.250.19
OeCCR3OeCCR15.35 × 10−20.310.17
OeCCR4OeCCR52.47 × 10−20.150.17
OePAR1OePAR40.151.060.14
OePAR4OePAR30.151.060.14
OeCCR3OeCCR79.70 × 10−20.820.12
OeCCR7OeCCR18.71 × 10−20.790.11
Table 2. Two-dimensional structures of three substrates, amino acids involved in interactions, and estimated binding energies.
CompoundStructure 2DChemical FormulaH Bond ResiduesHydrophobic Interaction
Residues
π-Stacking ResiduesBinding Affinity (kcal/mol)
3,4-DHPAAForests 16 00630 i001C8H8O3TYR-163
ASN-203
THR-204
SER-205
ILE-17
PRO-190
VAL-193
-−4.98
4-HPAAForests 16 00630 i002C8H8O2TYR-163
ASN-203
SER-205
VAL-193PHE-88−3.59
PAAForests 16 00630 i003C8H8OLYS-167ILE-17
THR-126
PRO-190
-−3.01
Disclaimer/Publisher’s Note: The statements, opinions and data contained in all publications are solely those of the individual author(s) and contributor(s) and not of MDPI and/or the editor(s). MDPI and/or the editor(s) disclaim responsibility for any injury to people or property resulting from any ideas, methods, instructions or products referred to in the content.

