Article

Exploration of Suitable Spectral Bands and Indices for Forest Fire Severity Evaluation Using ZY-1 Hyperspectral Data

1
Institute of Forest Resource Information Techniques, Chinese Academy of Forestry, Beijing 100091, China
2
Key Laboratory of Forestry Remote Sensing and Information System, National Forestry and Grassland Administration, Beijing 100091, China
*
Author to whom correspondence should be addressed.
Forests 2025, 16(4), 640; https://doi.org/10.3390/f16040640
Submission received: 26 February 2025 / Revised: 27 March 2025 / Accepted: 3 April 2025 / Published: 7 April 2025
(This article belongs to the Section Natural Hazards and Risk Management)

Abstract

:
Satellite remote sensing has been widely recognized as an effective tool for estimating fire severity. Existing indies predominantly rely on broad-spectrum multispectral data, limiting the ability to elucidate the intricate relationship between fire severity and spectral response. To address this challenge, the optimal spectral bands and indices for fire severity assessment were explored using ZY-1 hyperspectral data, which captured pre- and post-fire conditions of a forest fire site in Yuxi City, Yunnan Province, China. Separability contrast and threshold segmentation methods were applied to perform a sensitivity analysis on the original spectral bands and constructed indices derived from surface reflectance of the post-fire image and the pre- and post-fire image combination, respectively. The findings indicate the following: (1) The spectral bands of the post-fire image exhibited superior spectral separability and classification capabilities compared to the pre- and post-fire difference image, with the highest forest fire severity classification accuracy of 78.99% achieved at the 800 nm central wavelength. (2) The difference of normalized difference index category for the pre- and post-fire image combination outperformed the vegetation indices of the post-fire image and the other vegetation indices using the pre- and post-fire image combination, with the highest forest fire severity classification accuracy of 83.39% achieved with the combination of 2048 nm and 1106 nm central wavelength. (3) Unburned areas exhibited strong separability, facilitating effective segmentation, but burned areas showed poor separability between fire severities, particularly between low and moderate–high severity, which remains the primary limitation in fire severity assessment. In conclusion, this study advances the understanding of fire severity and spectral response by leveraging the narrow-band advantages. It aims to enhance the accuracy of satellite-based fire severity estimation, offering valuable technical guidance and theoretical insights for assessing forest fire impacts and vegetation recovery.

1. Introduction

Fire severity refers to the extent of impact and damage caused by fire disturbances on forest ecosystem vegetation, soil nutrients, and soil physical and chemical properties [1,2]. It serves as a crucial indicator for assessing the severity of fire disturbances [3]. Accurately quantifying forest fire severity is essential for understanding the response mechanisms of terrestrial ecosystems to fire disturbances. This is particularly significant for post-fire damage assessment, ecological restoration, and nutrient cycling studies. As a result, fire severity has become an emerging focus in fire ecology research [4,5,6].
Fire severity estimation is commonly performed using ground surveys and remote sensing monitoring techniques. Ground-based methods, such as the Composite Burn Index (CBI), have become a widely accepted standard for field surveys and loss assessments conducted by the U.S. Forest Service [7]. To improve the applicability and accuracy of such methods, other scholars have proposed variations, such as Geometrically Structured Composite Burn Index (GeoCBI), Weighted Composite Burn Index (WCBI), and Burn Severity Index (BSI) [8,9]. Additionally, Fire Severity Index (FSI) based on field data, quantifies fire severity based on the biomass of different components of burned areas [10]. In terms of remote sensing, common indices are predominantly derived from shortwave infrared (SWIR) and near-infrared (NIR) bands due to their distinct biophysical sensitivities. SWIR reflects canopy water content, while NIR is indicative of leaf area and photosynthetic pigment concentrations—both of which undergo significant alterations following fire events [11,12]. Indices that incorporate both spectral ranges, such as the Normalized Burn Ratio (NBR) and its derivatives—the delta Normalized Burn Ratio (dNBR), the relative delta Normalized Burn Ratio (RdNBR), and the Relativized Burn Ratio (RBR)—have been extensively applied to evaluate fire severity, particularly for quantitative assessments at landscape and regional scales [11,13,14,15]. Indices constructed using visible–near-infrared (VNIR) bands, such as the Normalized Difference Vegetation Index (NDVI), the Global Environmental Monitoring Index (GEMI), and the Excess Green Index (EGI) have also been employed in fire impact assessments across different global regions [13,16,17]. However, their effectiveness is generally inferior to that of the NBR series [18,19]. Moreover, mid-infrared (MIR) bands, which are capable of penetrating smoke and capturing thermal anomalies, have been incorporated into indices such as the SWIR-MIR index (SMI) for real-time fire intensity assessments during active burning [11]. Long-wave infrared (LWIR) bands, which provide direct measurements of surface temperature dynamics, have further been utilized in composite indices such as the pre- and post-fire land surface temperature and enhanced vegetation index (deltaLST/EVI), enhancing fire severity estimation across varying vegetation cover types and densities [20,21,22]. Nonetheless, the applicability of these thermally derived indices remains context-dependent and may exhibit limitations under certain conditions [18,23].
While ground-based methods can provide relatively accurate assessments by establishing relevant standards, they are time-consuming and labor-intensive, making them inefficient for large-scale applications [24,25]. Additionally, the absence of pre-fire baseline comparisons renders fire severity classification highly susceptible to investigator subjectivity [26,27,28]. In contrast, remote sensing methods have gradually become a key direction of development in fire severity research [4,6,29]. Numerous studies have demonstrated the effectiveness of using medium-high resolution multispectral satellite images combined with spectral indices for fire severity estimation [14,18,30], including images from Landsat-7/8 [31,32,33], Sentinel-2 [34,35], and GF-1 [36]. Additionally, there has been research on using manned [37,38] and unmanned aerial vehicles (UAVs) [39] equipped with hyperspectral images for fire severity assessment. However, current satellite-based fire severity quantification research primarily relies on multispectral images [12,25], whose broad spectral bands limit its ability to capture detailed wavelength information [40], making it difficult to accurately analyze fine-scale variations in fire severity with respect to wavelength. This limitation directly impacts the precision and stability of fire severity quantification, thereby constraining the practical application of satellite remote sensing for fire severity estimation. This issue becomes particularly pronounced when dealing with complex fire environments, such as mountainous regions, or when addressing multi-scale application demands. Thus, the use of data with higher spectral resolution to clarify the fire severity-spectral response mechanism is crucial for enhancing the potential of satellite remote sensing in precise fire severity estimation [41].
This study focused on the burned area of a forest fire that occurred on 11 April 2023, in Yuxi City, Yunnan Province, China. The data from ZY-1 hyperspectral data (ZY1E/F AHSI) was selected for analysis, with images captured pre-fire (6 February 2023, 12:07) and post-fire (21 April 2023, 11:53). Using spectral separability contrast and threshold segmentation methods, the sensitivity of fire severity estimation was analyzed for both the post-fire image and the pre- and post-fire image combination. The study investigated the relationship between changes in surface spectra and fire severity, systematically evaluating the ability of spectral bands and indices to identify fire severity. The aim is to provide technical guidance and theoretical references for the development of new fire severity estimation models, ultimately contributing to more accurate assessments of forest fire damage and vegetation recovery in mountainous regions.

2. Materials and Methods

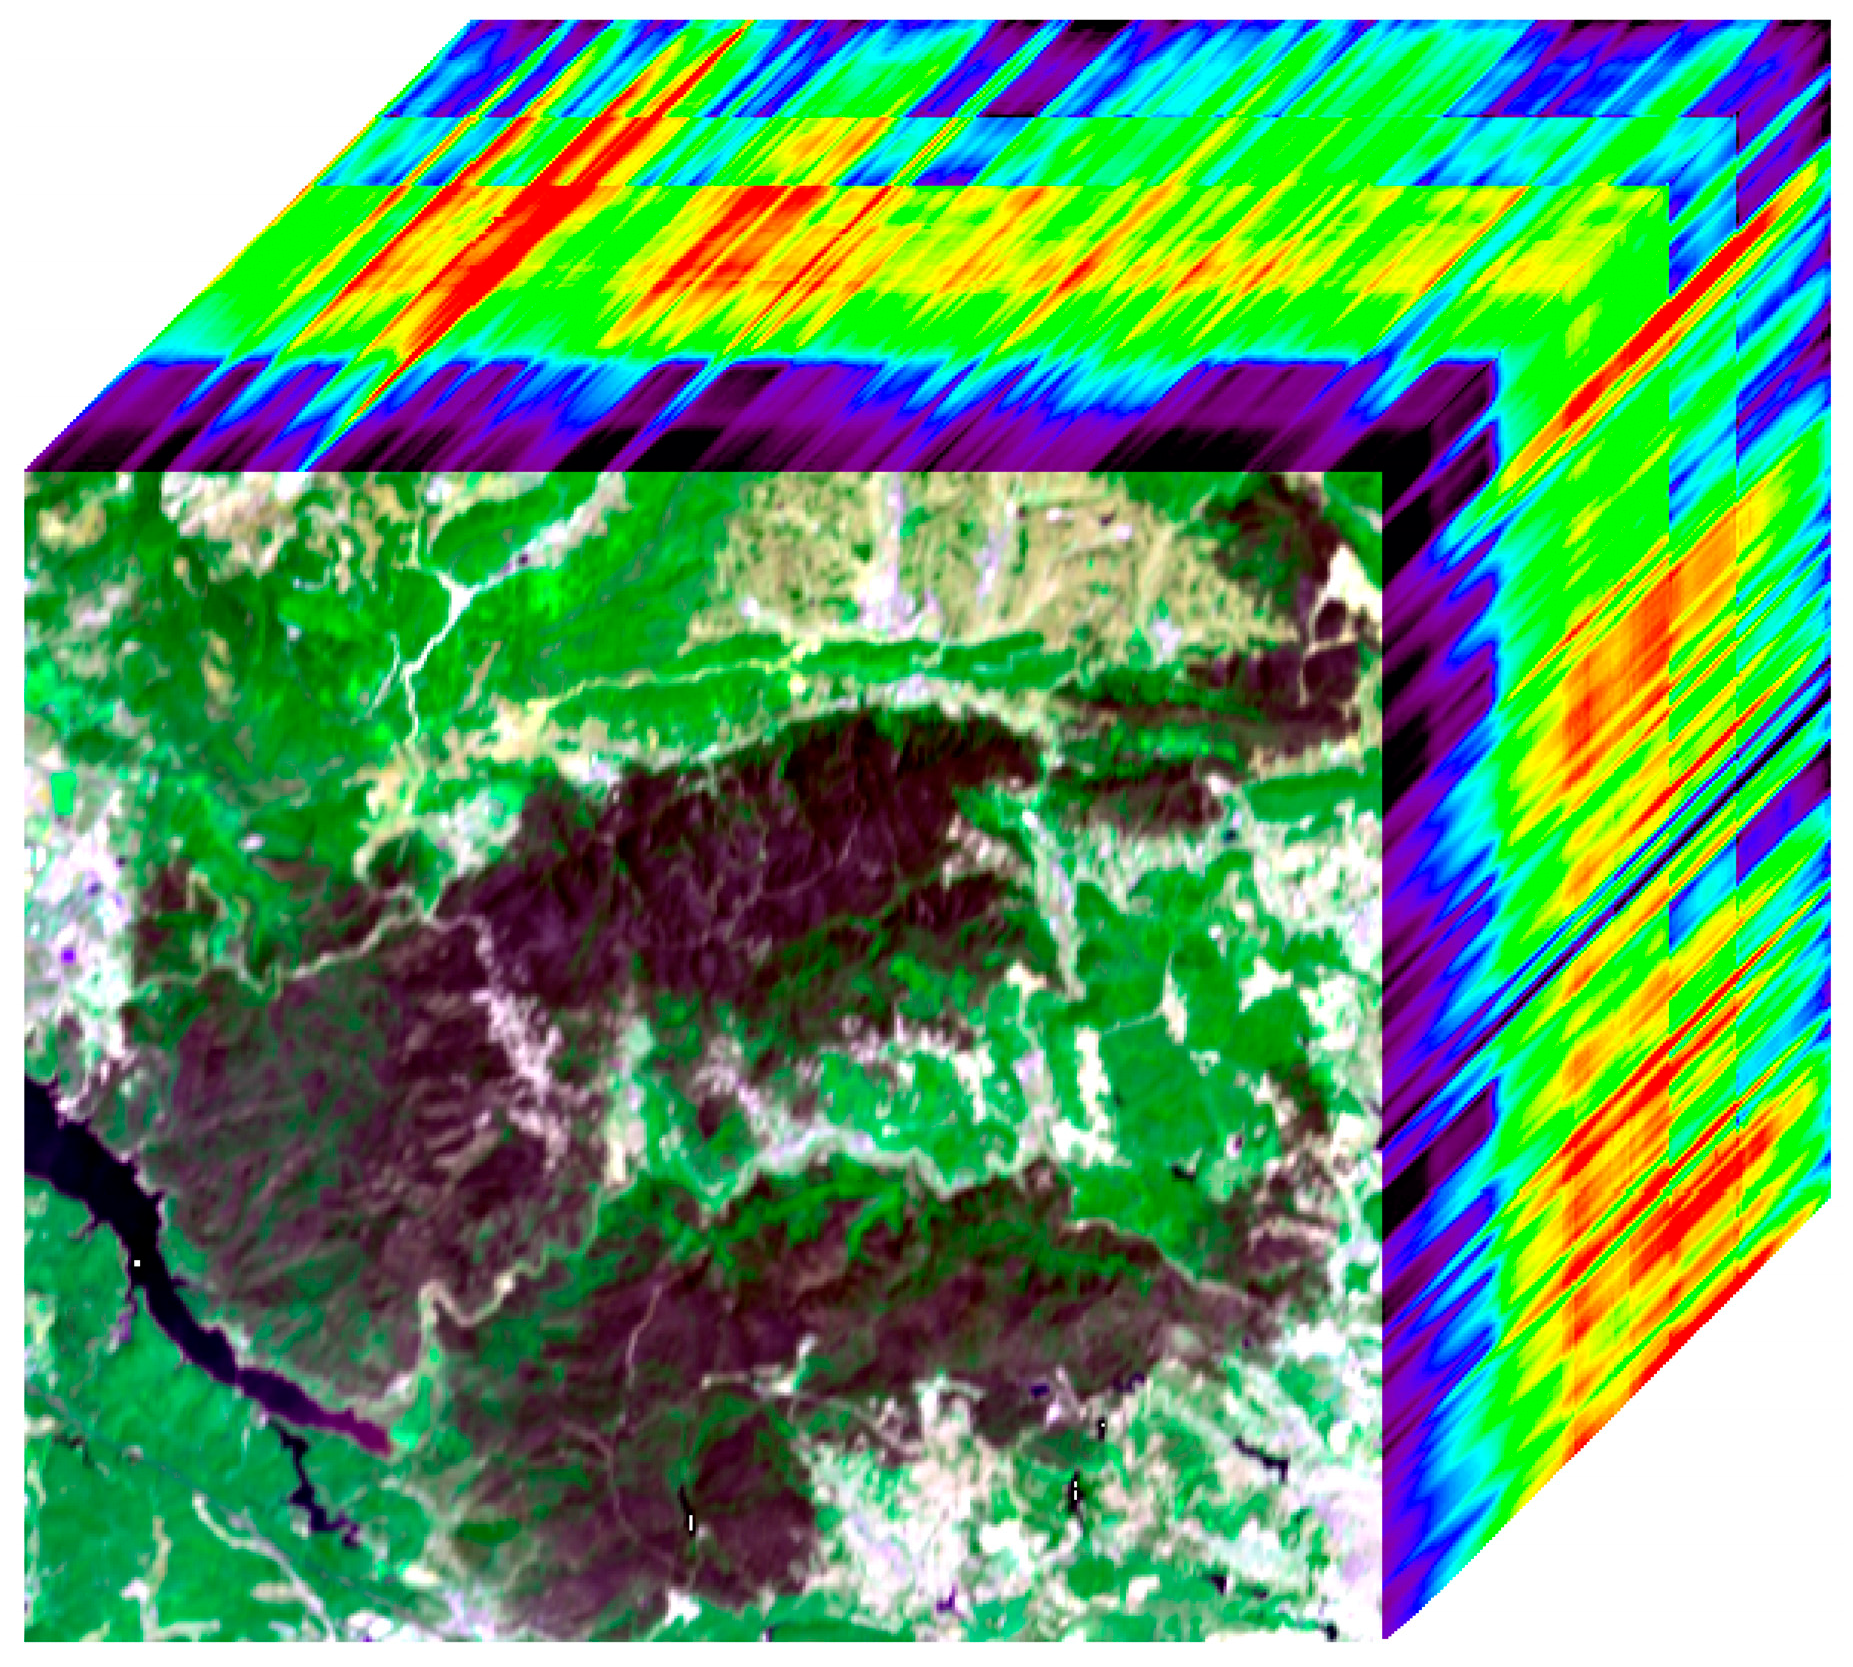
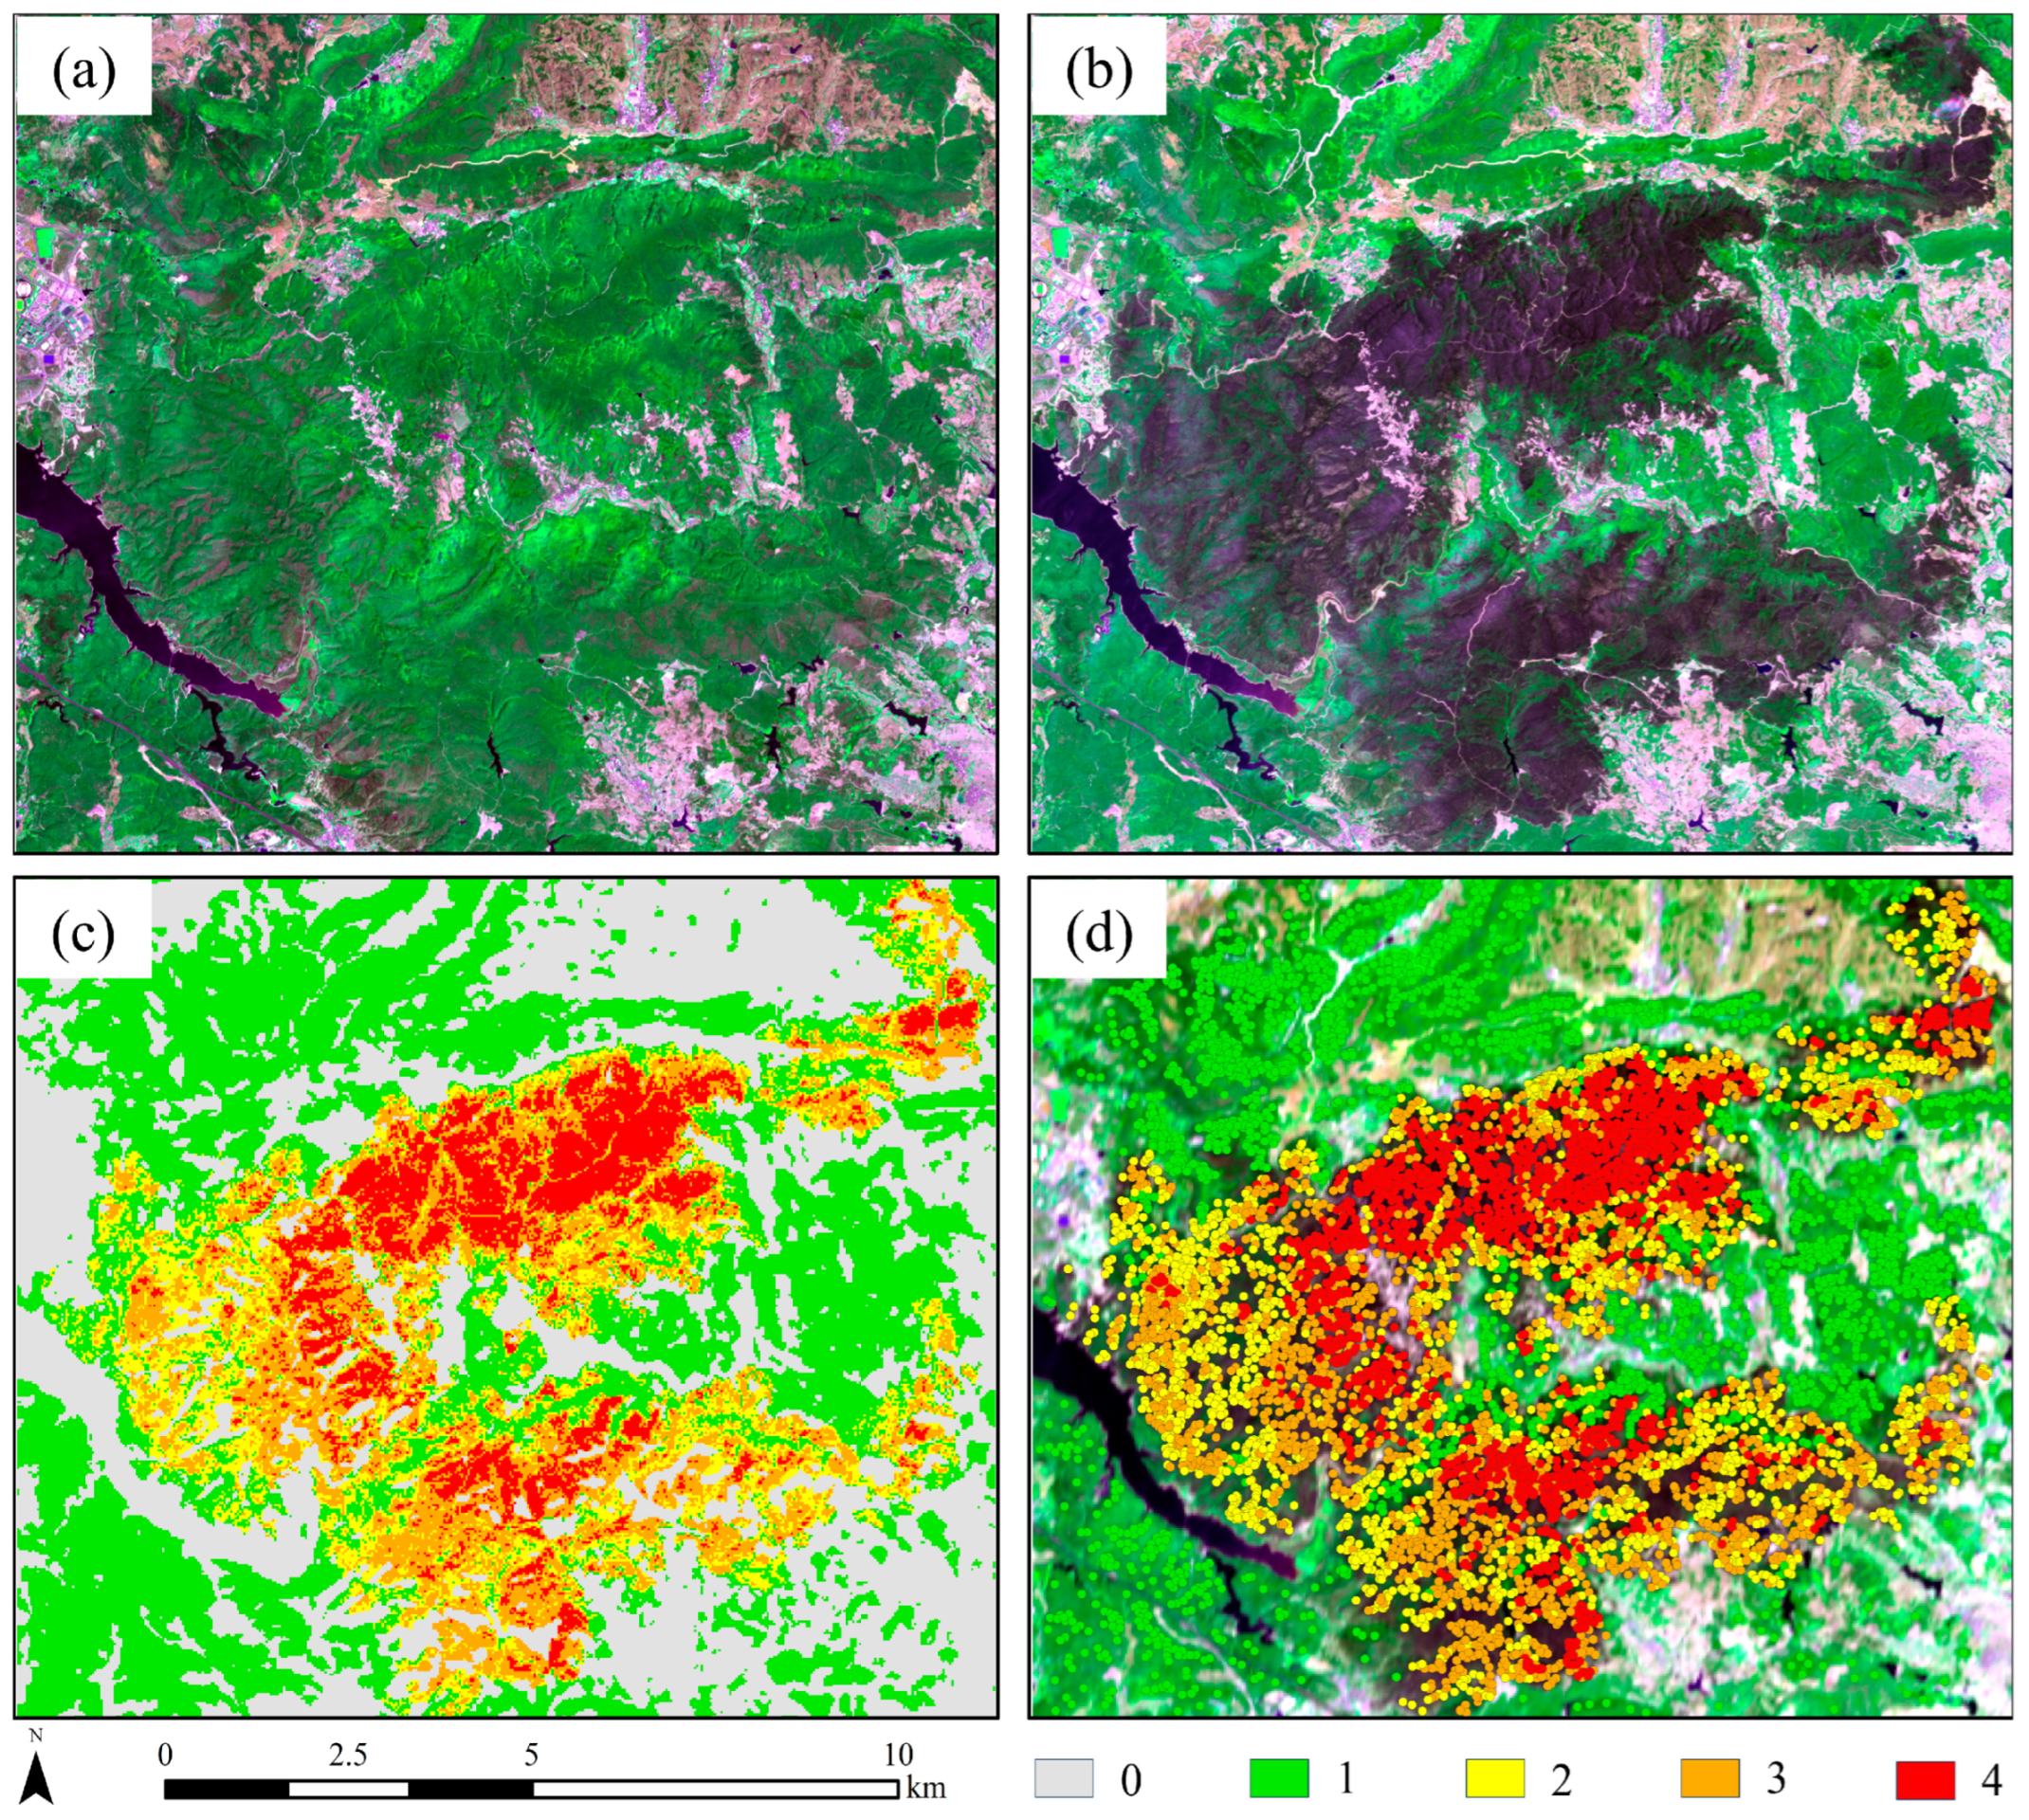
2.1. Study Area and Data Sources

The study area is located in Yuxi City, Yunnan Province, China, between 23°19′–24°53′ N and 101°16′–103°09′ E. This area belongs tothe Southwest Forest Region, the second largest natural forest region in China. The terrain is mostly mountainous with steep slopes, complex topography, and limited accessibility. The region, with distinct dry and wet seasons and a predominantly dry climate, is also characterized by a variety of combustible materials and fire sources, making it a frequent and severely affected area for forest fires in China. The forest fire ignited at 15:27 on 11 April 2023, with the ignition point located in Hekou Village, Jiuxi Town, Jiangchuan District, Yuxi City. It was caused by the human practice of burning crop residues in the fields. The open flames were extinguished at 21:55 on 15 April, and the fire lasted for over four days. The burned area lies to the west of Yuxi City, bordered by Jiangchuan District to the southeast. The Dongbing River traverses through the entire region, with villages built along the mountainsides and scattered residential areas. The vegetation in the area consists primarily of a mixed forest of pine and broadleaf trees, dominated by Yunnan pine. This area is a typical wildland–urban interface, where fire prevention and control are both urgent and critical. The study of fire severity estimation holds significant practical implications for fire management in this region. The location of the study area is shown in Figure 1.
The hyperspectral images were provided by the China Centre for Resources Satellite Data and Application (https://data.cresda.cn/, accessed 20 December 2023). The ZY1-02D satellite was successfully launched on 12 September 2019 and carries visible–near-infrared and hyperspectral cameras that can effectively capture 9-band multispectral data with a 115 km swath width, as well as 166-band hyperspectral data with a 60 km swath width. The spatial resolution for the panchromatic band is up to 2.5 m, 10 m for multispectral, and 30 m for hyperspectral. The ZY1-02E satellite, launched on 26 December 2021, builds on the payloads of the ZY1-02D, adding a thermal infrared camera to capture 115 km wide, 16 m spatial resolution thermal infrared data. Both satellites operate in a sun-synchronous orbit in a coordinated phase arrangement, forming a dual-satellite network that significantly improves data acquisition efficiency and timeliness. The spectral range of the hyperspectral payloads on both the ZY1-02D and ZY1-02E satellites spans from 396 nm to 2485 nm, covering the visible (396 nm–700 nm), near-infrared (700 nm–1300 nm), and shortwave infrared (1300 nm–2485 nm) regions [42]. The hyperspectral data corresponding to the ZY1-02D satellite is designated as ZY1E, while the ZY1-02E satellite is designated as ZY1F. The pre- and post-fire image correspond to ZY1F and ZY1E, respectively. The spectral resolution in the visible–near-infrared range (396 nm–1032 nm) is 8 nm, and in the near-infrared to shortwave infrared range (1032 nm–2485 nm), is 16 nm. Sentinel-2 multispectral data (Sentinel-2 MSI L2A) with a 10 m spatial resolution was selected to estimate fire severity as verification data. The images were obtained from Google Earth Engine (https://code.earthengine.google.com/, accessed 9 January 2024). Figure 2 shows the hyperspectral data cube image covering the burned area on 21 April 2023. The false-color image on the rectangular surface was synthesized using Band 33, Band 53, and Band 20 from the hyperspectral data, and the profile consists of 166 spectral bands.

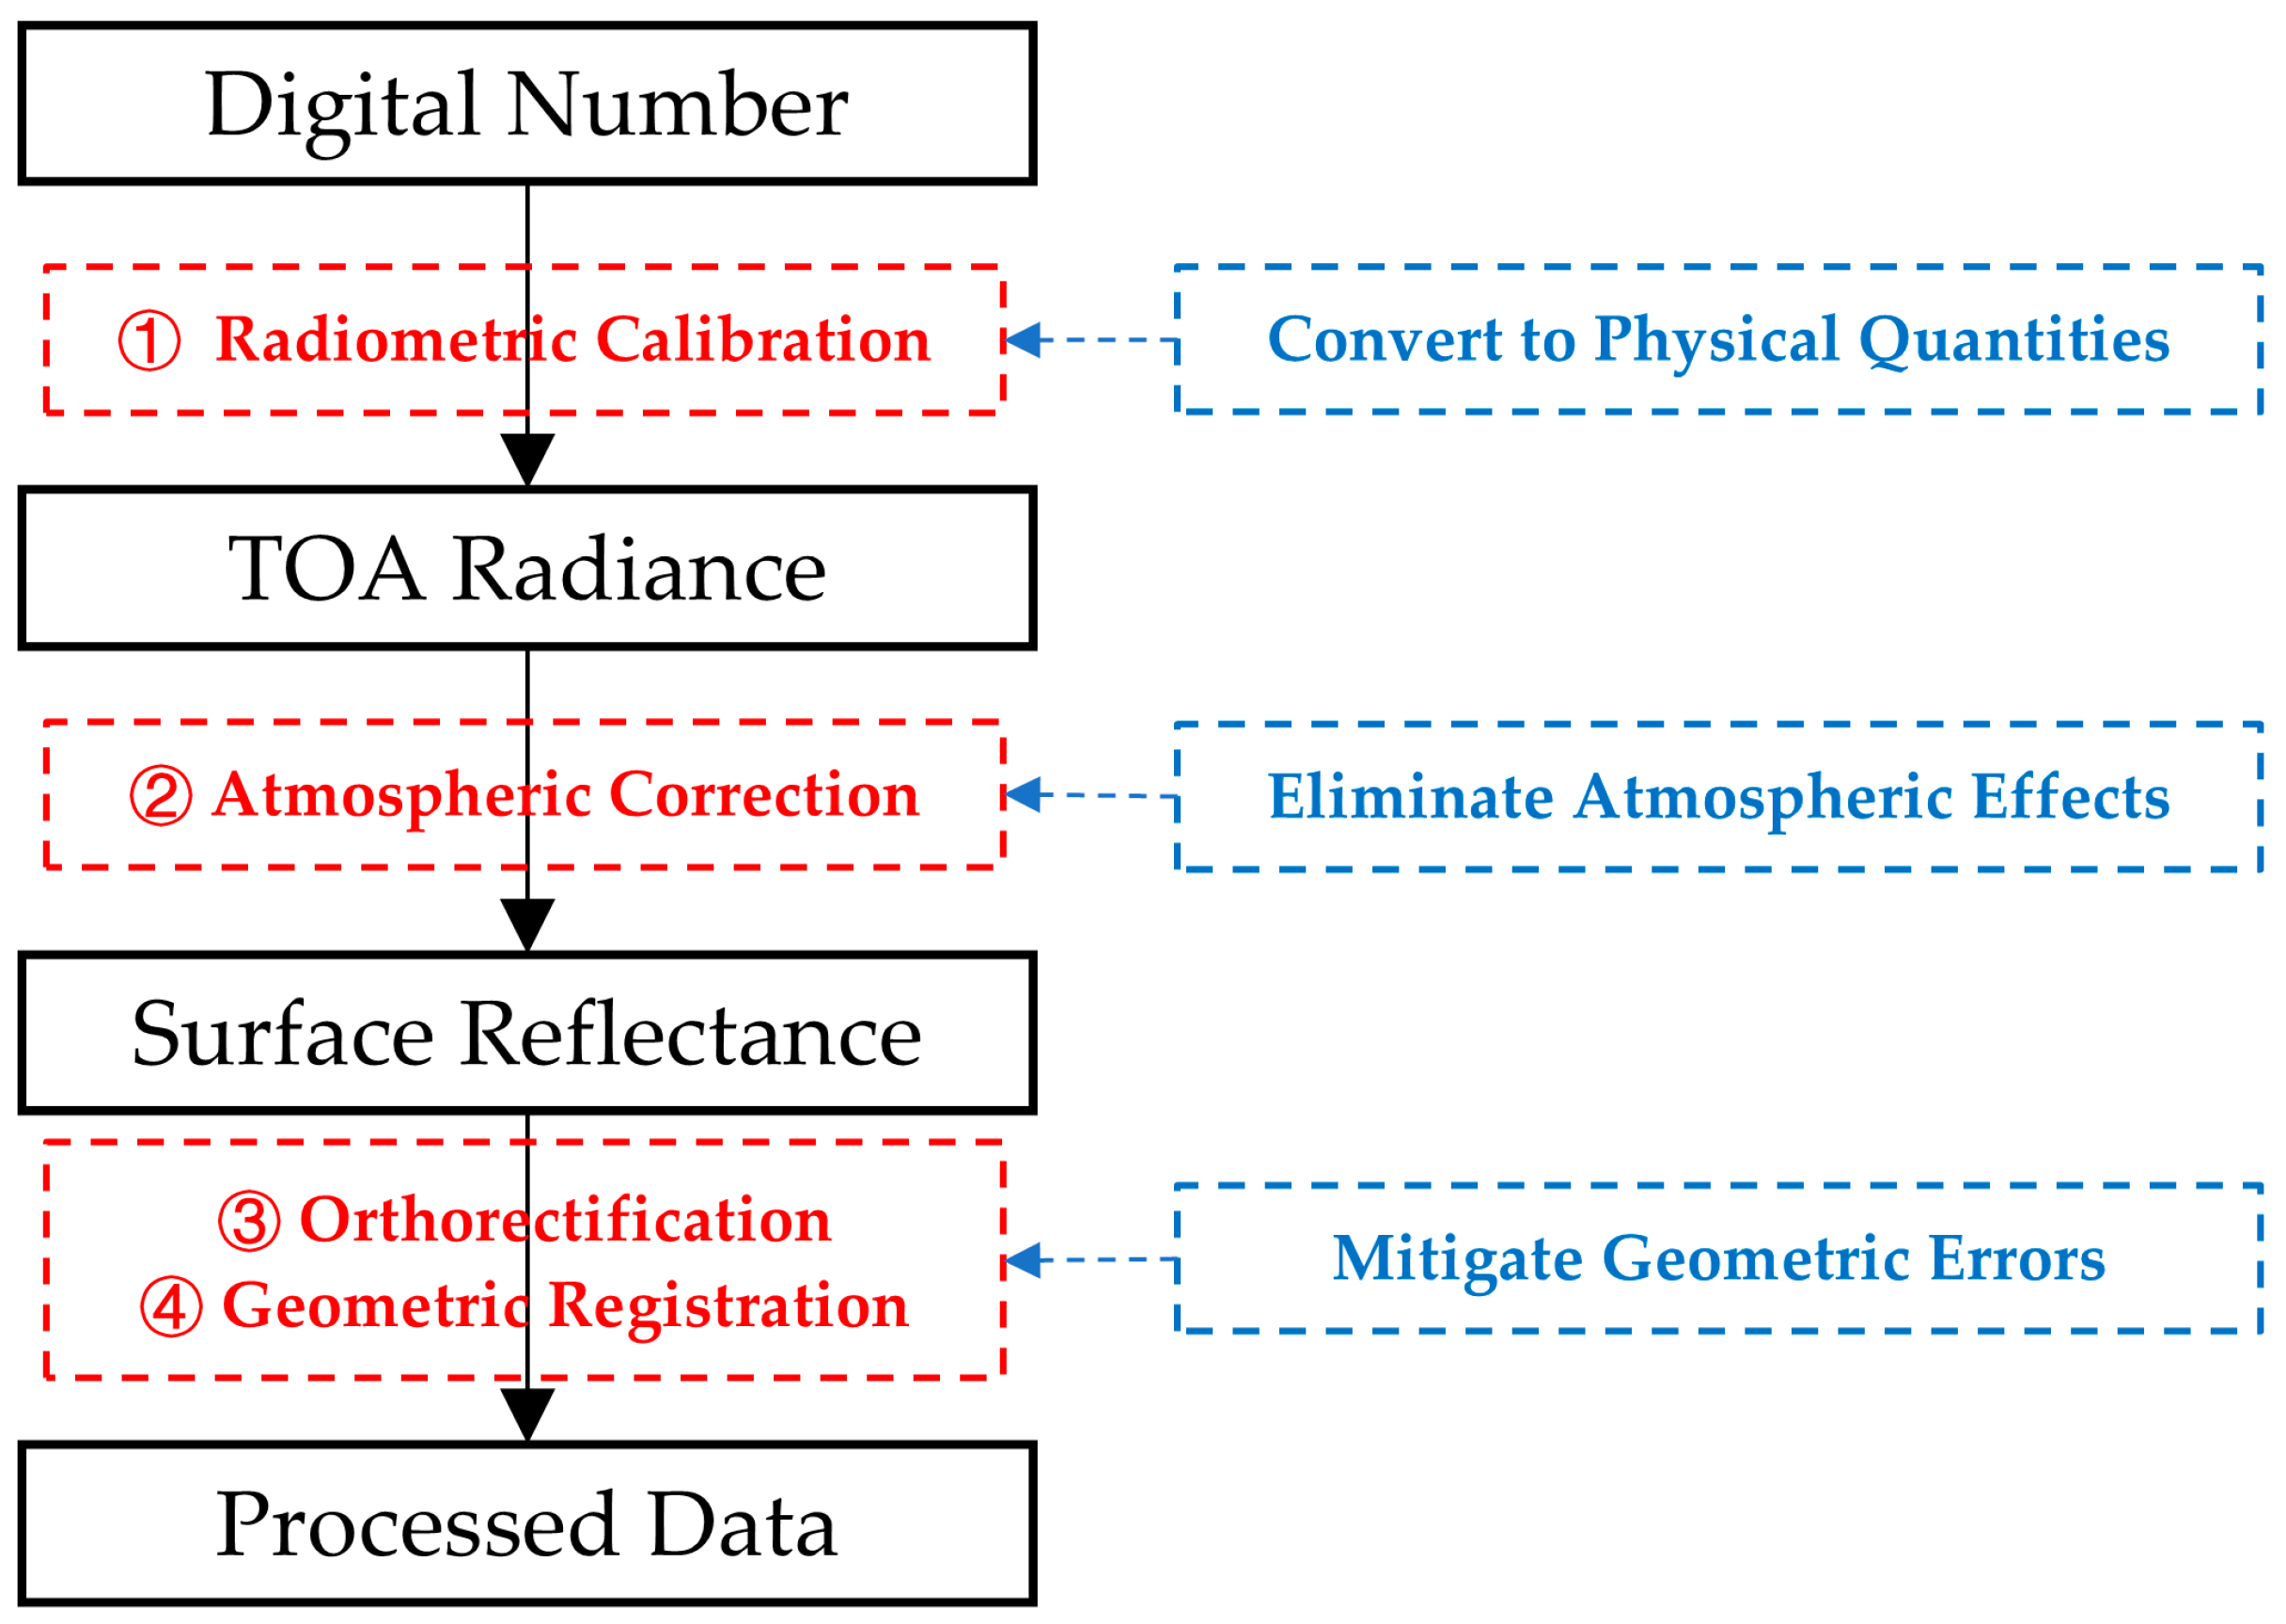
2.2. Data Processing and Sample Selection

The selected ZY1E/F AHSI images were preprocessed, including radiometric calibration, atmospheric correction, orthorectification, and geometric registration. The acquired raw data consists of digital number (DN) values, which lack intrinsic physical significance. Therefore, radiometric calibration was first conducted to convert DN values into top-of-atmosphere (TOA) radiance, as defined by Equation (1), using the calibration coefficients provided by the China Centre for Resources Satellite Data and Application. Atmospheric correction was applied to derive surface reflectance, as detailed in Equations (2) and (3) [43,44,45,46]. The correction was performed using the FLAASH atmospheric correction module in ENVI 5.6.2, based on the MODTRAN radiative transfer model, to account for atmospheric scattering and absorption effects. Considering the influence of atmospheric composition and sensor characteristics, 11 spectral bands severely affected by atmospheric absorption, 4 bands exhibiting anomalous negative values, and 3 bands with spectral overlap were excluded, resulting in a refined dataset comprising 148 spectral bands. Despite these corrections, residual geometric distortions remained due to sensor attitude variations and terrain-induced parallax, potentially affecting the spatial accuracy of fire severity assessments. To mitigate these effects, orthorectification was conducted using 30 m ASTER GDEM V2 data, aligning the imagery with an orthogonal projection and accurately geolocating each pixel. Finally, to facilitate direct comparison with fire severity validation data derived from Sentinel-2 MSI imagery, geometric registration was carried out using a relative registration method, with the pre-fire image as the reference for registering the post-fire image. The overall geometric registration error (RMSE) was less than 1 pixel. The detailed data preprocessing workflow is illustrated in Figure 3.
L = G λ × D N + O λ
L = ( A ρ 1 ρ e S ) + ( B ρ e 1 ρ e S ) + L α
ρ = ( L L α ) ( 1 ρ e S ) B ρ e A
In Equation (1), L is the atmospheric upper boundary radiance (in units of W⋅m−2⋅sr−1⋅μm−1), and G λ and O λ are the gain coefficient and the offset of different wavelengths ( λ ), respectively. In Equations (2) and (3), ρ represents the surface reflectance. All other parameters are automatically calculated by the MODTRAN model and the header file of the data, such as ρ e , is the average surface reflectance of the surrounding pixels. S is the atmospheric hemispherical reflectance. L α is the atmospheric path radiance. A and B are two coefficients that depend on atmospheric conditions and geometric factors.
Pre-fire (11 April 2023, 11:51) and post-fire (21 April 2023, 11:51) Sentinel-2 MSI images were used, with non-vegetated areas masked out. The dNBR for the vegetated areas before and after the fire was calculated. The dNBR values were classified according to previous studies [7,47], where a dNBR value below 0.299 indicated an unburned area (coded as 1), a value between 0.300 and 0.499 indicated a light severity area (coded as 2), a value between 0.500 and 0.799 indicated a moderate severity area (coded as 3), and a value above 0.800 indicated a high severity area (coded as 4). Other areas were coded as 0. Visual interpretation was performed to ensure the authenticity and validity of the classification, which was then used as the ground truth for fire severity in this study. Based on this, sample points were evenly selected from different fire severities to ensure representativeness, with no fewer than 2000 pixels per class, serving as the spectral analysis samples for subsequent analysis. The data for validation and sample used in this study are shown in Figure 4.

2.3. Methods

2.3.1. Separability Calculation

Separability (M) is a commonly used statistic for quantitatively evaluating the separation of spectral bands and indices in classification tasks for specific categories [48]. It has been widely applied in forest fire monitoring [30,49] and other fields [50,51]. The calculation formula is shown in Equation (4):
M = | μ b μ a | σ b + σ a
In Equation (4), μ b and μ a represent the mean values of samples for different fire severity categories, while σ b and σ a are the corresponding standard deviations. Generally, a larger value of M indicates better separability between categories. If M < 1, it suggests poor separability, while M ≥ 1 indicates good separability.

2.3.2. Index Construction

To assess the ability of different indices in identifying fire severity, the band composition of the ZY1E/F AHSI was considered, and an exhaustive method was used for index construction. The vegetation index (VI) construction rules followed those of Difference Vegetation Index (DVI), Ratio Vegetation Index (RVI), and Normalized Difference Vegetation Index (NDVI), respectively, creating a difference index (DI) category, ratio index (RI) category, and normalized difference index (NDI) category. The pre-fire and post-fire index differences were calculated for each index, denoted as dDI, dRI, and dNDI. In total, there were 10,878 indices for each category, amounting to 65,268 indices. The formulas for all indices are presented in Equations (5)–(8).
D I = b 2 b 1
R I = b 2 b 1
N D I = b 2 b 1 b 2 + b 1
d V I = V I p o s t f i r e V I p r e f i r e
In Equations (5) to (7), b1 and b2 represent different bands of the ZY1E/F AHSI, with b2 having a wavelength greater than b1. In Equation (8), dVI denotes the difference in index values before and after the fire for each index, where V I p r e f i r e and V I p o s t f i r e represent the index values before and after the fire, respectively.

2.3.3. Evaluation Methods

To effectively evaluate the fire severity classification capabilities of different bands and indices, they were all pre-processed using normalization. The workflow for determining fire severity classification thresholds is outlined in detail below.
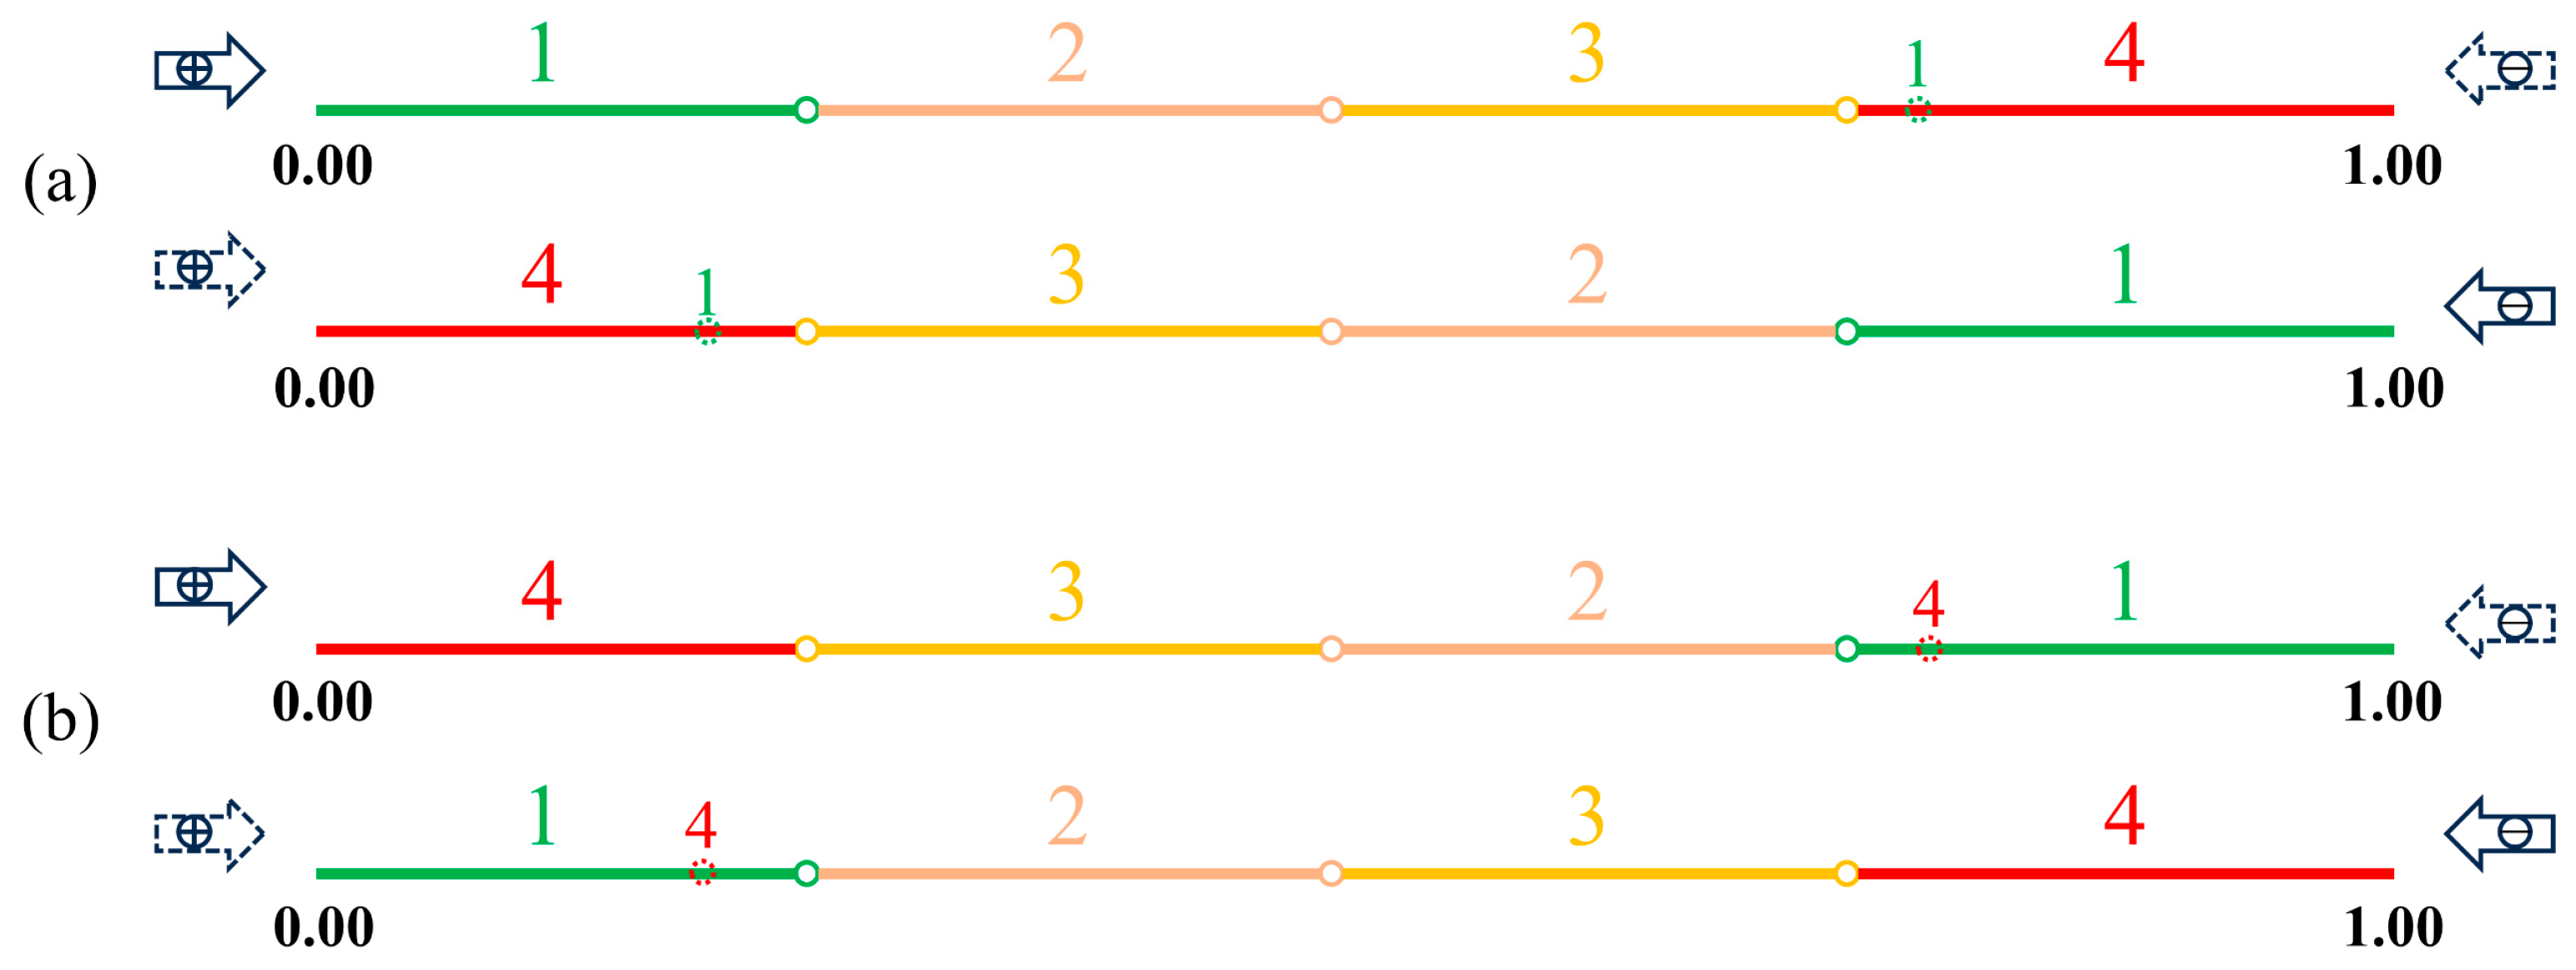
  • Search method: The fixed step search method.
  • Operational parameters: Step size (fixed at 0.01 prior to the search) and search direction (determined during the search as increasing (+) or decreasing (−)).
  • Evaluation Metric: F-Score (the F1_Score for the target class in the validation data (Single F1_Score, SF1) was used during the search, and the Weighted F1_Score (WF1), representing the weighted average of the F1_Score for multiple fire severity categories in the validation data, was used as the evaluation standard after completion of the search.)
  • Process Description: The severity levels were assessed in both ascending (1–4) and descending (4–1) orders. The initial thresholds were set to increase (0.00–1.00) for ascending and decrease (1.00–0.00) for descending. First, the ascending order thresholds were determined by a bidirectional search, identifying the optimal segmentation threshold for level 1. The subsequent search direction was adjusted accordingly (increasing or decreasing). Based on threshold a, the optimal segmentation threshold b for level 2 was determined, and further adjustments along the same direction were made to identify threshold c for level 3. The image was then segmented into four categories (1, 2, 3, and 4) using thresholds a, b, and c, respectively. The same process was applied for the descending order. The final classification result was based on the best evaluation from both processes.
The search process is illustrated in Figure 5, and the evaluation metric calculation formulas are presented in Equations (9)–(11).
F _ S c o r e = α 2 + 1 × P × R α 2 × ( P + R )
S F 1 i = 2 × P i × R i P i + R i
W F 1 = i = 1 n N i × S F 1 i i = 1 n N i
Equation (9) represents the general formula for F _ S c o r e , where P and R denote precision and recall, respectively. In Equations (10) and (11), Pi and Ri represent the precision and recall for each individual category, respectively. S F 1 i is the harmonic mean of both precision and recall for each individual category, used as the evaluation metric during the search process (α = 1). Ni refers to the total number of pixels for each fire severity category. WF1 is the weighted average F1_Score across all categories, used as the comprehensive evaluation metric upon completion of the search.

3. Results and Discussion

Using spectral bands and indices of the preprocessed pre-fire and post-fire ZY1E/F AHSI images, a comprehensive evaluation of fire severity estimation capabilities was carried out step by step. First, spectral values at the same locations of pre- and post-fire samples of different fire severities were extracted. The mean spectral values for each band were then calculated and plotted as spectral curves. A visual qualitative comparison was made between the spectral values and their variations in the post-fire image and the pre- and post-fire image combination. Next, corresponding index values at the same locations were extracted. The separability was calculated using the sample means and standard deviations of both spectra and indices, and quantitative comparisons of the fire severity classification capabilities were conducted. Finally, the fixed-step threshold search method was applied to segment spectral bands and indices of the pre- and post-fire images. Quantitative analysis of the classification ability for different fire severities was performed based on classification accuracy metrics.

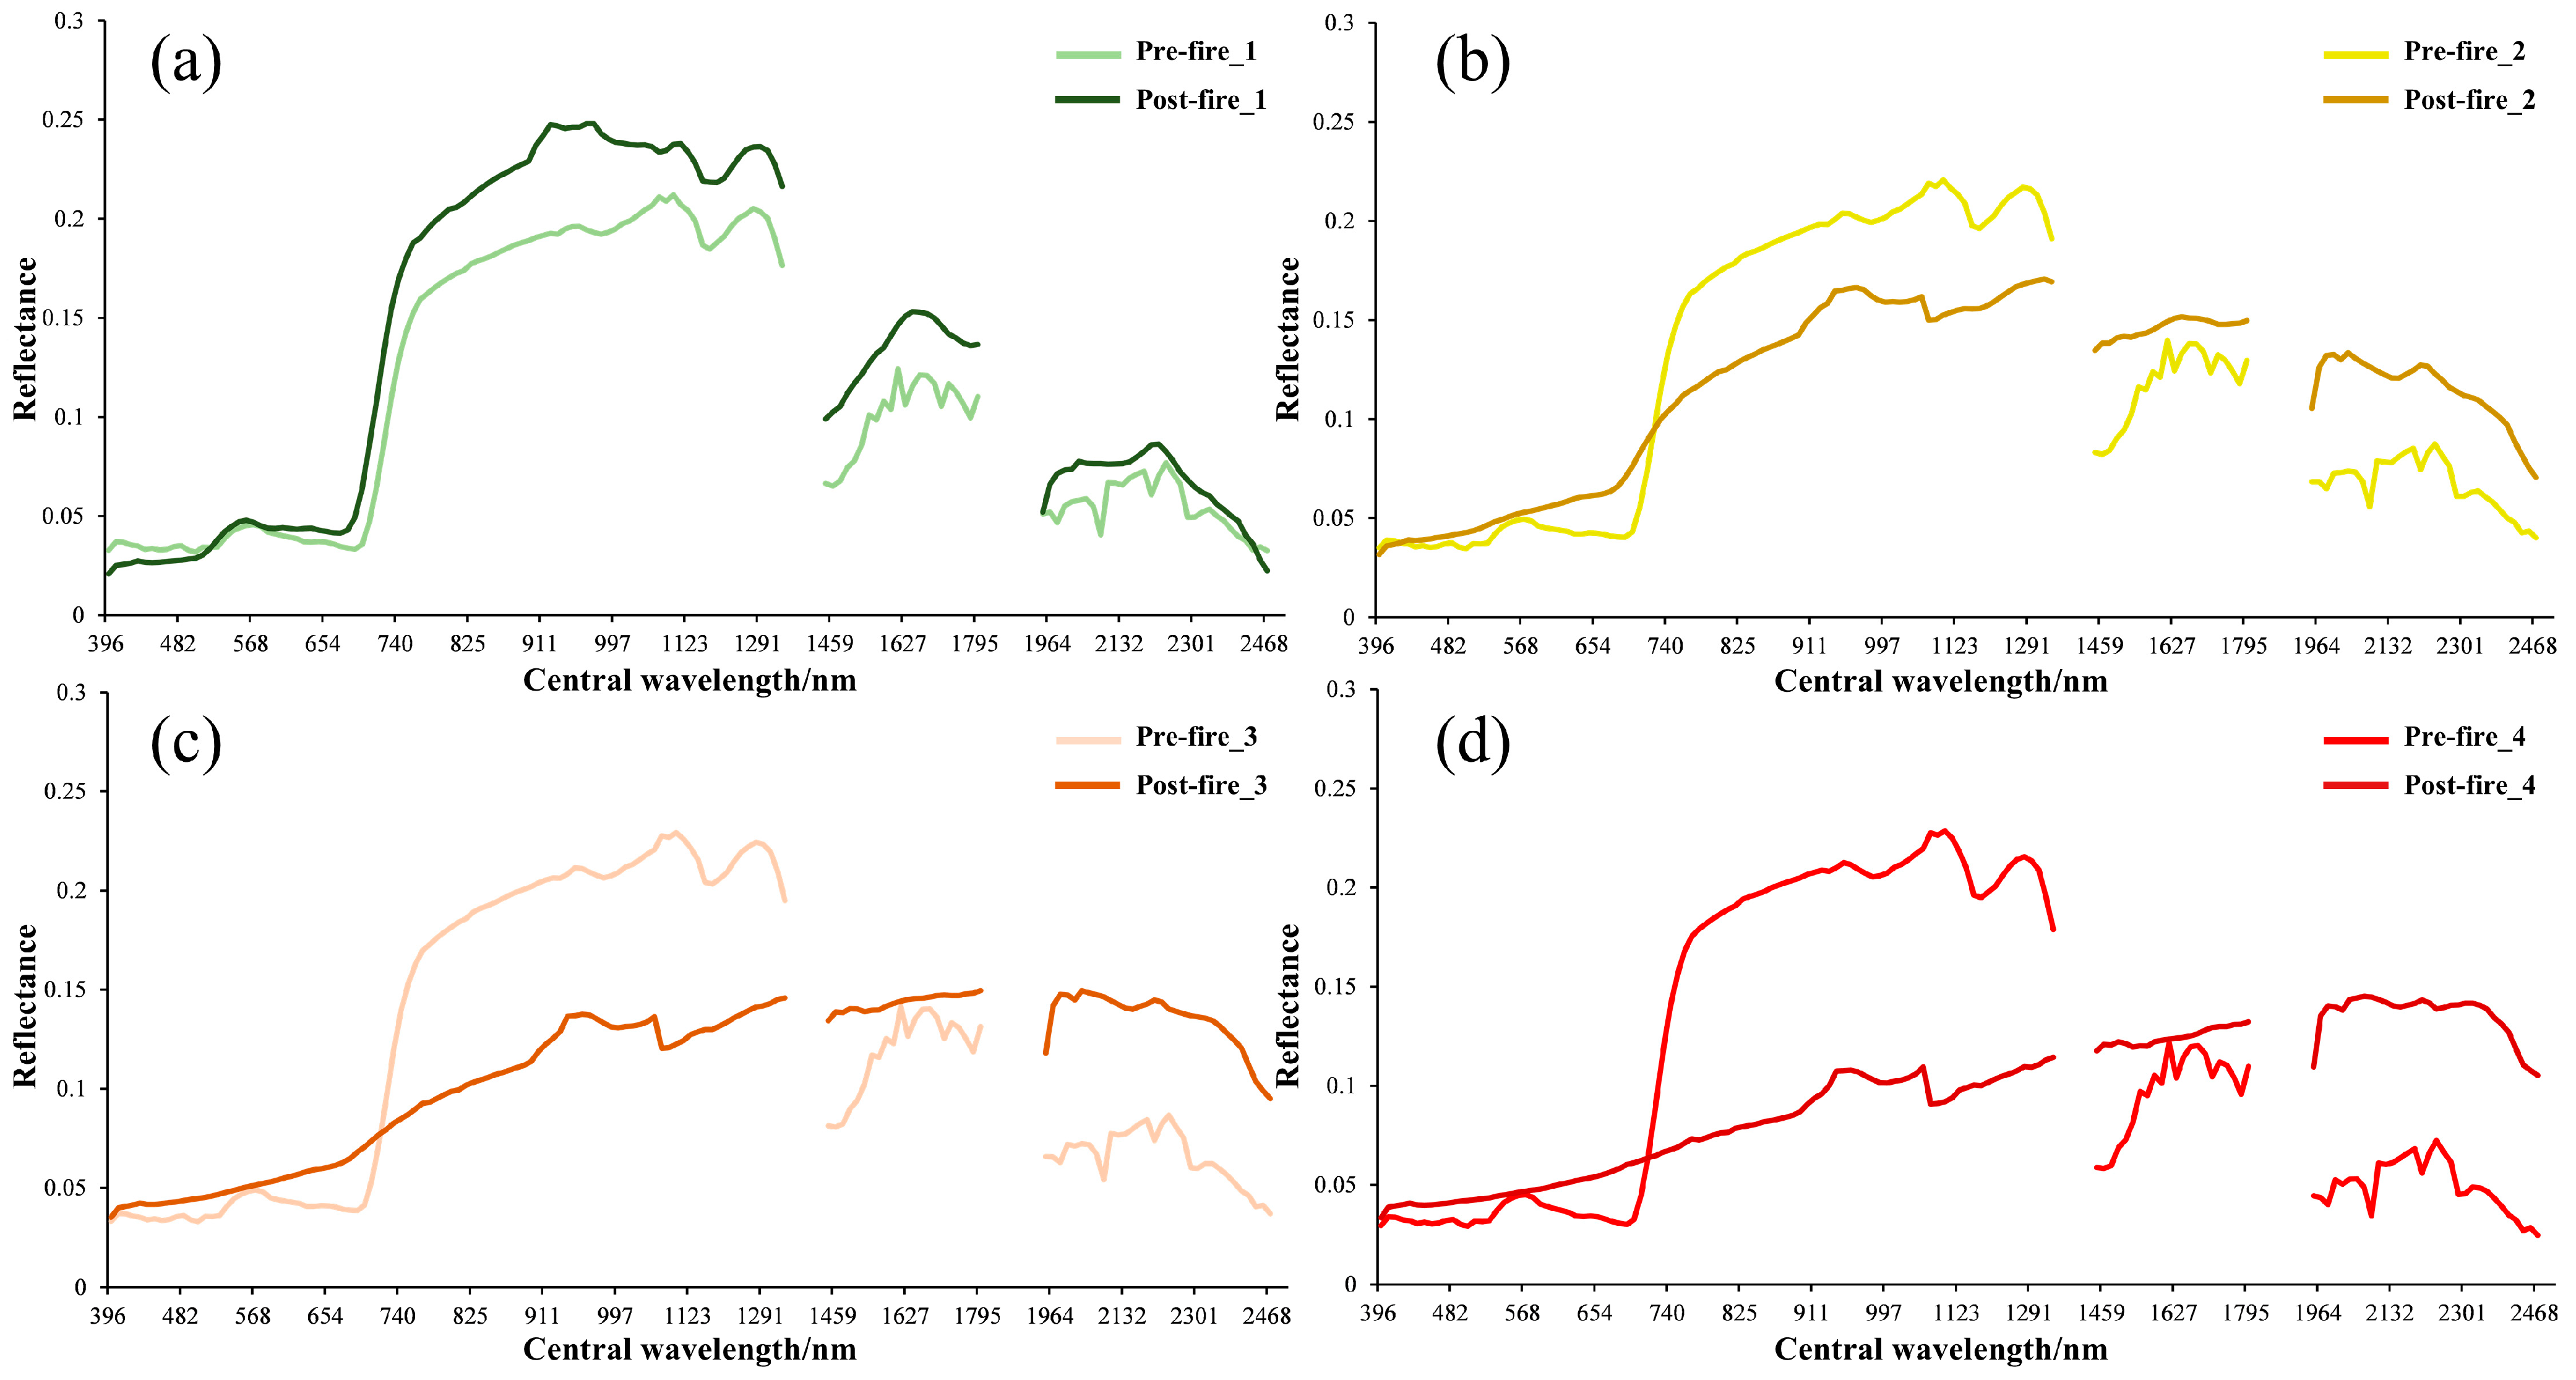
3.1. Comparison of Spectral Curves for Different Fire Severities

As shown in Figure 6, the comparison of spectral curves for different fire severities in the post-fire image reveals that, in terms of mean values, a clear separation exists between different fire severities in the near-infrared range (740 nm–1341 nm). However, spectral overlap was observed in the visible–near-infrared range (396 nm–714 nm), the shortwave infrared range (1442 nm–1779 nm), and the range (1947 nm–2468 nm), with the reflectance peaks of the unburned areas in the first two spectral ranges extending into the burned areas, leading to smaller differences. In terms of spectral trends, the spectral curve of unburned areas closely followed the typical vegetation spectral variation pattern. In the visible range, a reflectance peak was observed in the green band (560 nm) due to chlorophyll pigments, and absorption valleys were present in the blue band (480 nm) and red band (660 nm). In the near-infrared range, a reflectance peak was observed between 740 nm and 1341 nm due to internal cellular structures of the leaves. In the shortwave infrared range, reflectance peaks occurred at 1644 nm and 2199 nm due to the leaf moisture content. In contrast, the spectral patterns of burned vegetation were disrupted by fire disturbance, with varying degrees of damage to the typical vegetation spectral variation. No distinct peaks or valleys were observed in the visible range for the burned areas. The reflectance peak in the near-infrared range was reduced, the slope between the red and near-infrared bands was flattened, and there was some increase in the shortwave infrared range. In summary, the greatest difference in mean spectral values for different fire severities was observed in the near-infrared to shortwave infrared range (740 nm–1341 nm). The most noticeable spectral variation trend occurred in the red to near-infrared range (679 nm–757 nm).
As shown in Figure 7, the spectral curve comparison of different fire severities in the pre and post-fire images reveals that the mean spectral values and variation trends for different fire severity areas before the fire are similar, generally following the typical vegetation spectral change pattern. Except for the unburned areas, where the mean spectral values increase in the green to shortwave infrared range (516 nm–2417 nm, excluding the removed bands), the spectral mean values in the burned areas decreased across different fire severity levels. Specifically, the spectral mean values in the visible to near-infrared range (396 nm–714 nm) were higher after the fire, while those in the near-infrared to shortwave infrared range (722 nm–2468 nm) were higher before the fire. The greater the fire severity, the more pronounced the decrease in spectral mean values. The most significant differences in both spectral mean values and trends between the pre- and post-fire images occurred in the near-infrared range (757 nm–1341 nm). Moreover, the spectral mean values of unburned areas were relatively higher after the fire, likely due to the increased chlorophyll content in vegetation during the growing season, which enhances reflectance in the green to near-infrared range (516 nm–740 nm). In the near-infrared to shortwave infrared range (740 nm–1341 nm), the difference was caused by variations in the internal cell structure of newly grown leaves compared to older leaves, leading to multiple reflection differences. In the shortwave infrared range (1341 nm–2468 nm), the decrease in surface albedo due to the ash released by the burning of forests and grass led to an increased downward radiation, which raises surface temperatures, accelerates plant transpiration, and reduces the leaf’s total water content.

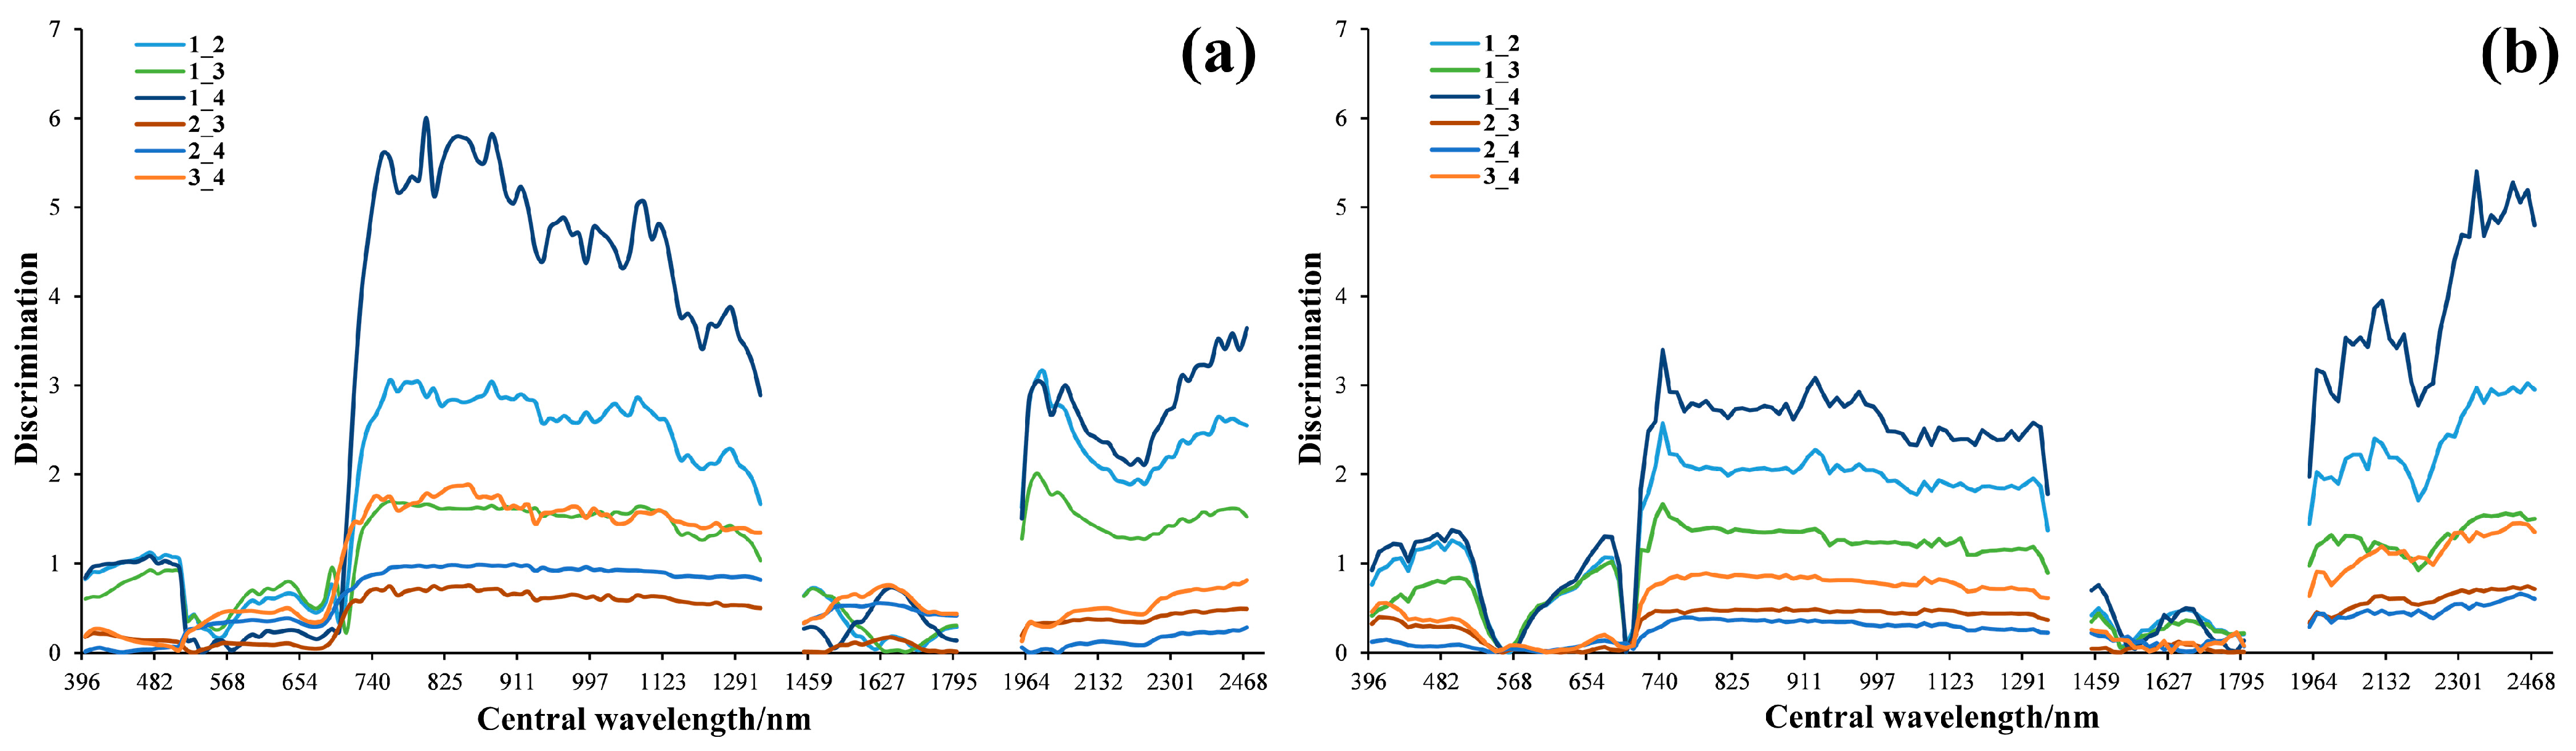
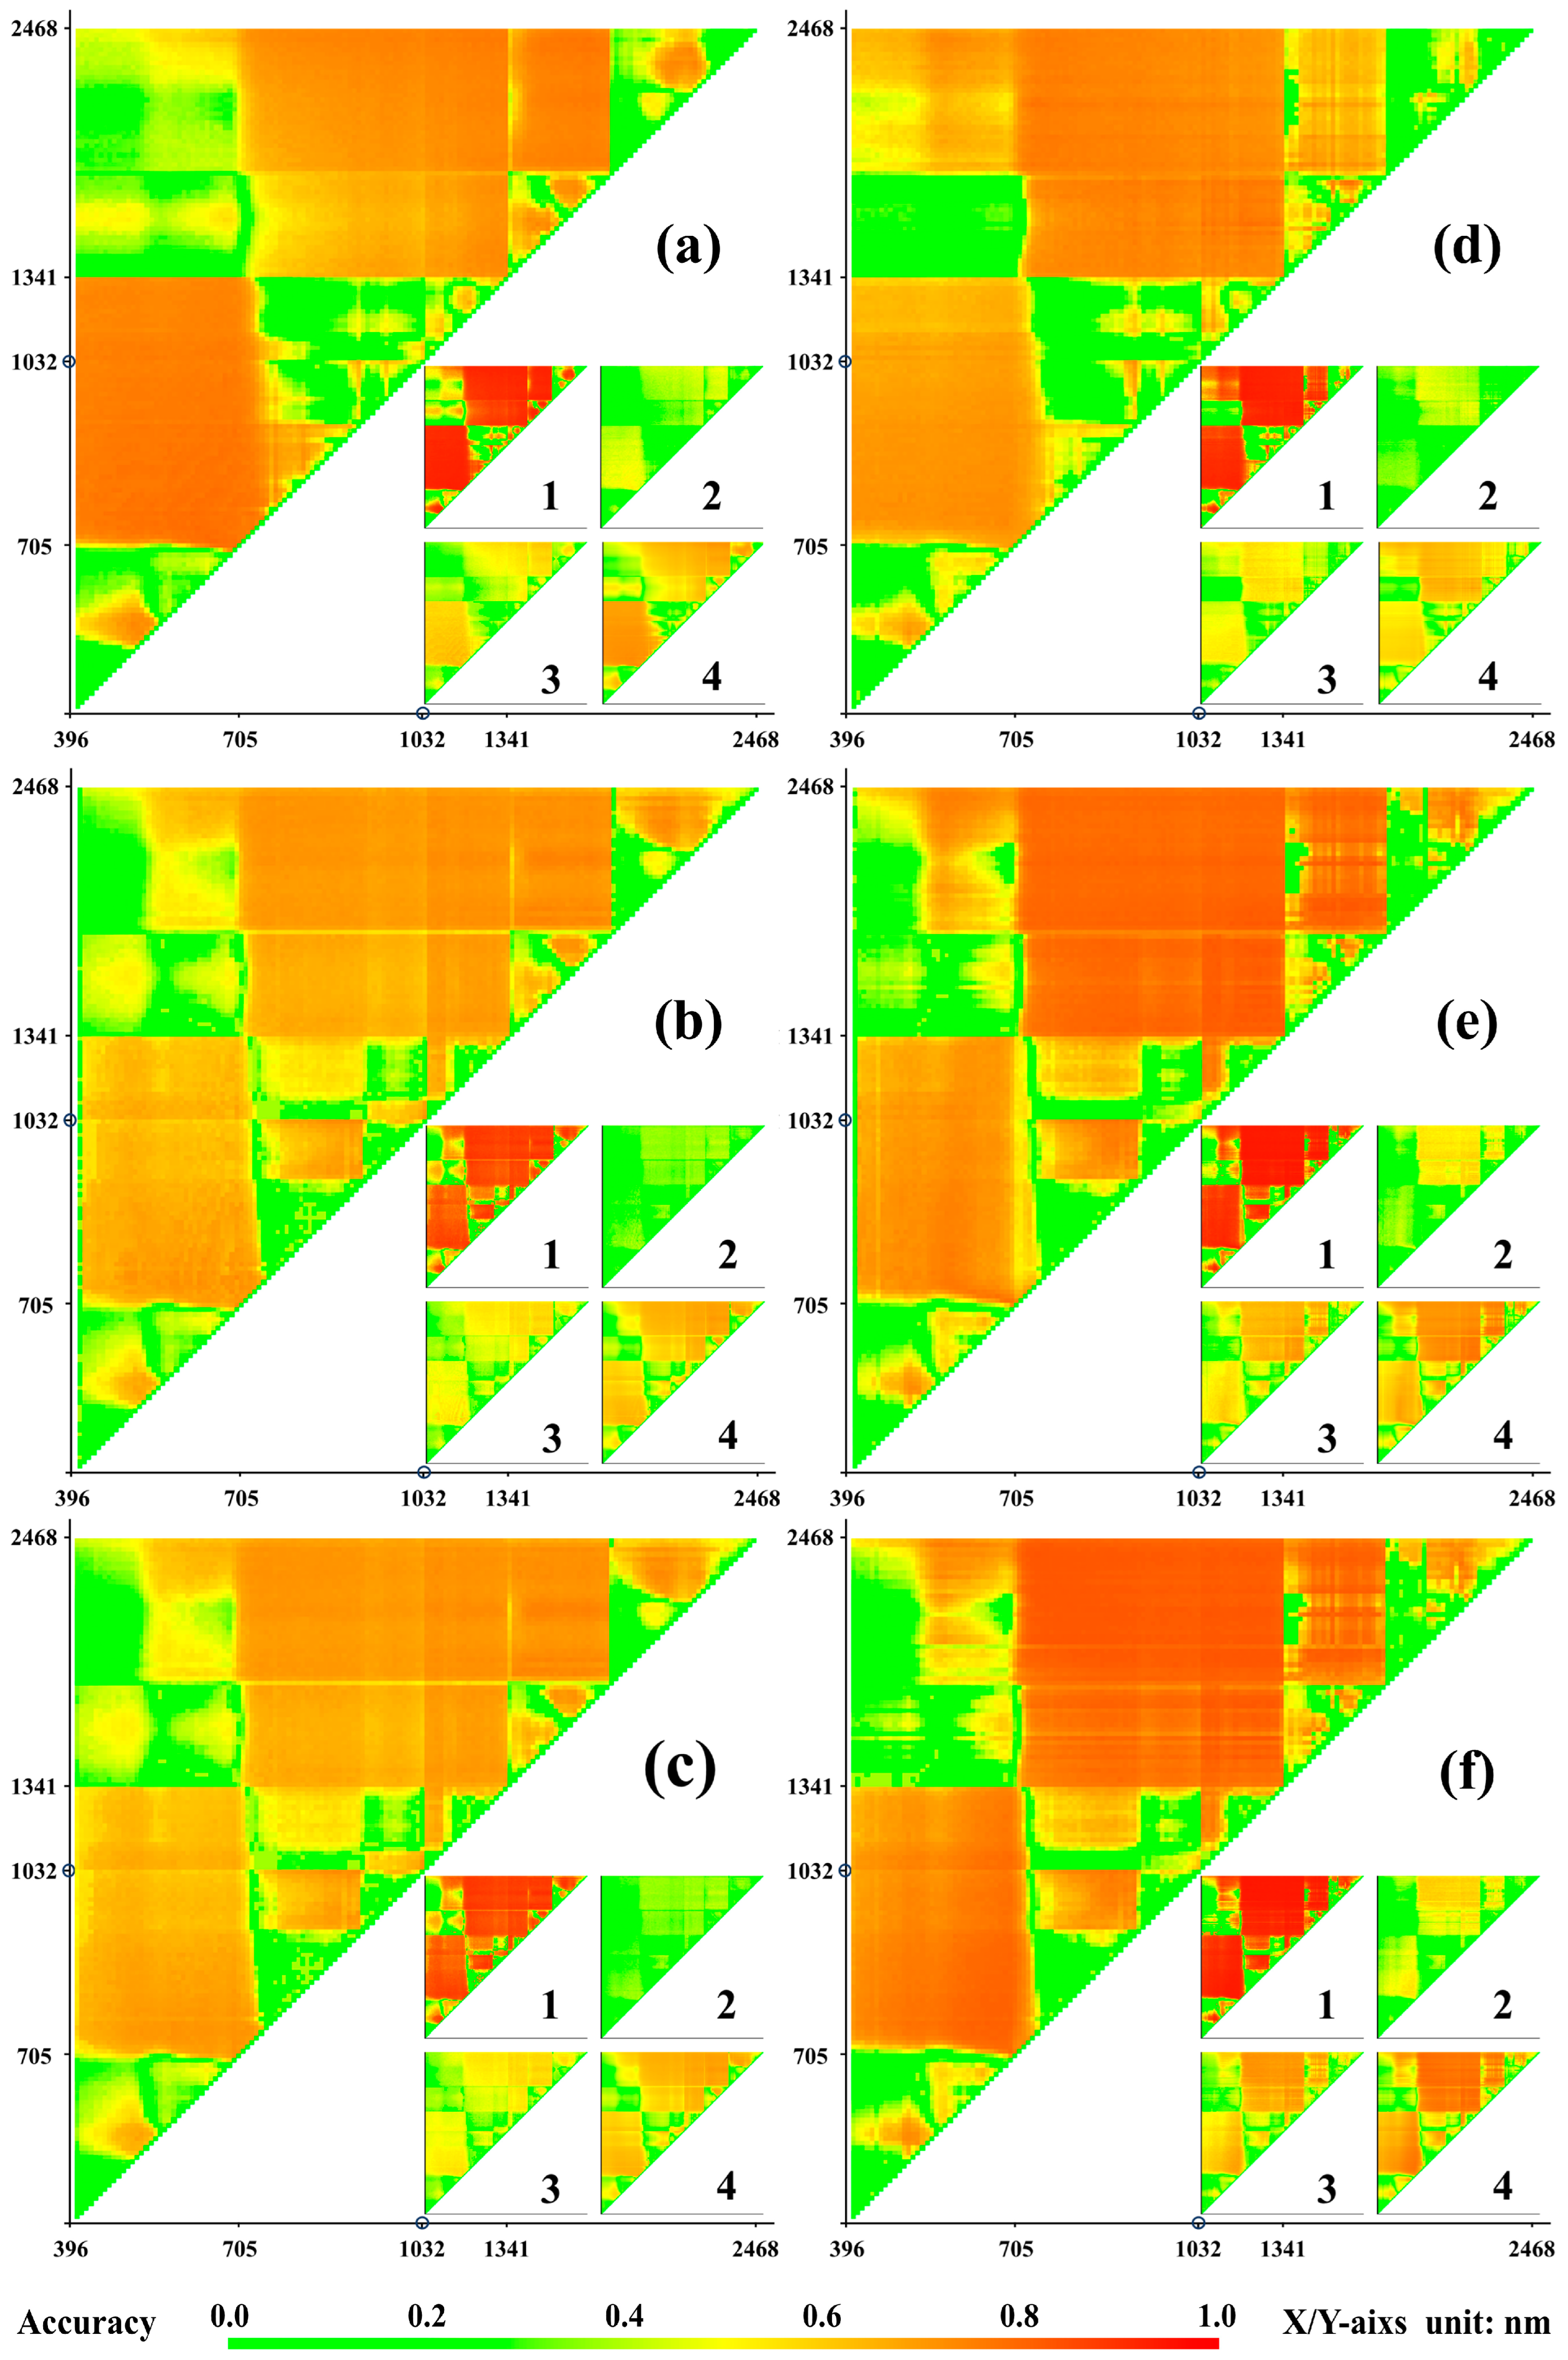
3.2. Comparison of Spectral Separability for Different Fire Severities

From Figure 8, the spectral separability between different fire severities exhibits a similar trend in both the post-fire image and the pre- and post-fire difference image. Both datasets exhibited higher spectral separability in the near-infrared to short-wave infrared range (705 nm–1341 nm), followed by the short-wave infrared range (1964 nm–2468 nm). Other spectral ranges showed relatively lower separability. Overall, the spectral separability in the post-fire image was higher than in the pre- and post-fire difference image. Both the post-fire image and the pre- and post-fire difference image, the spectral separability between unburned and burned areas of different fire severities was notably higher in the near-infrared to short-wave infrared range (705 nm–1341 nm) and the short-wave infrared range (1964 nm–2468 nm), but the spectral separability between different fire severities was relatively lower. Among the severities, moderate- and high-severity areas showed higher spectral separability in the near-infrared to short-wave infrared range (705 nm–1341 nm) in the post-fire image, and in the short-wave infrared range (1964 nm–2468 nm) in the pre- and post-fire difference image.

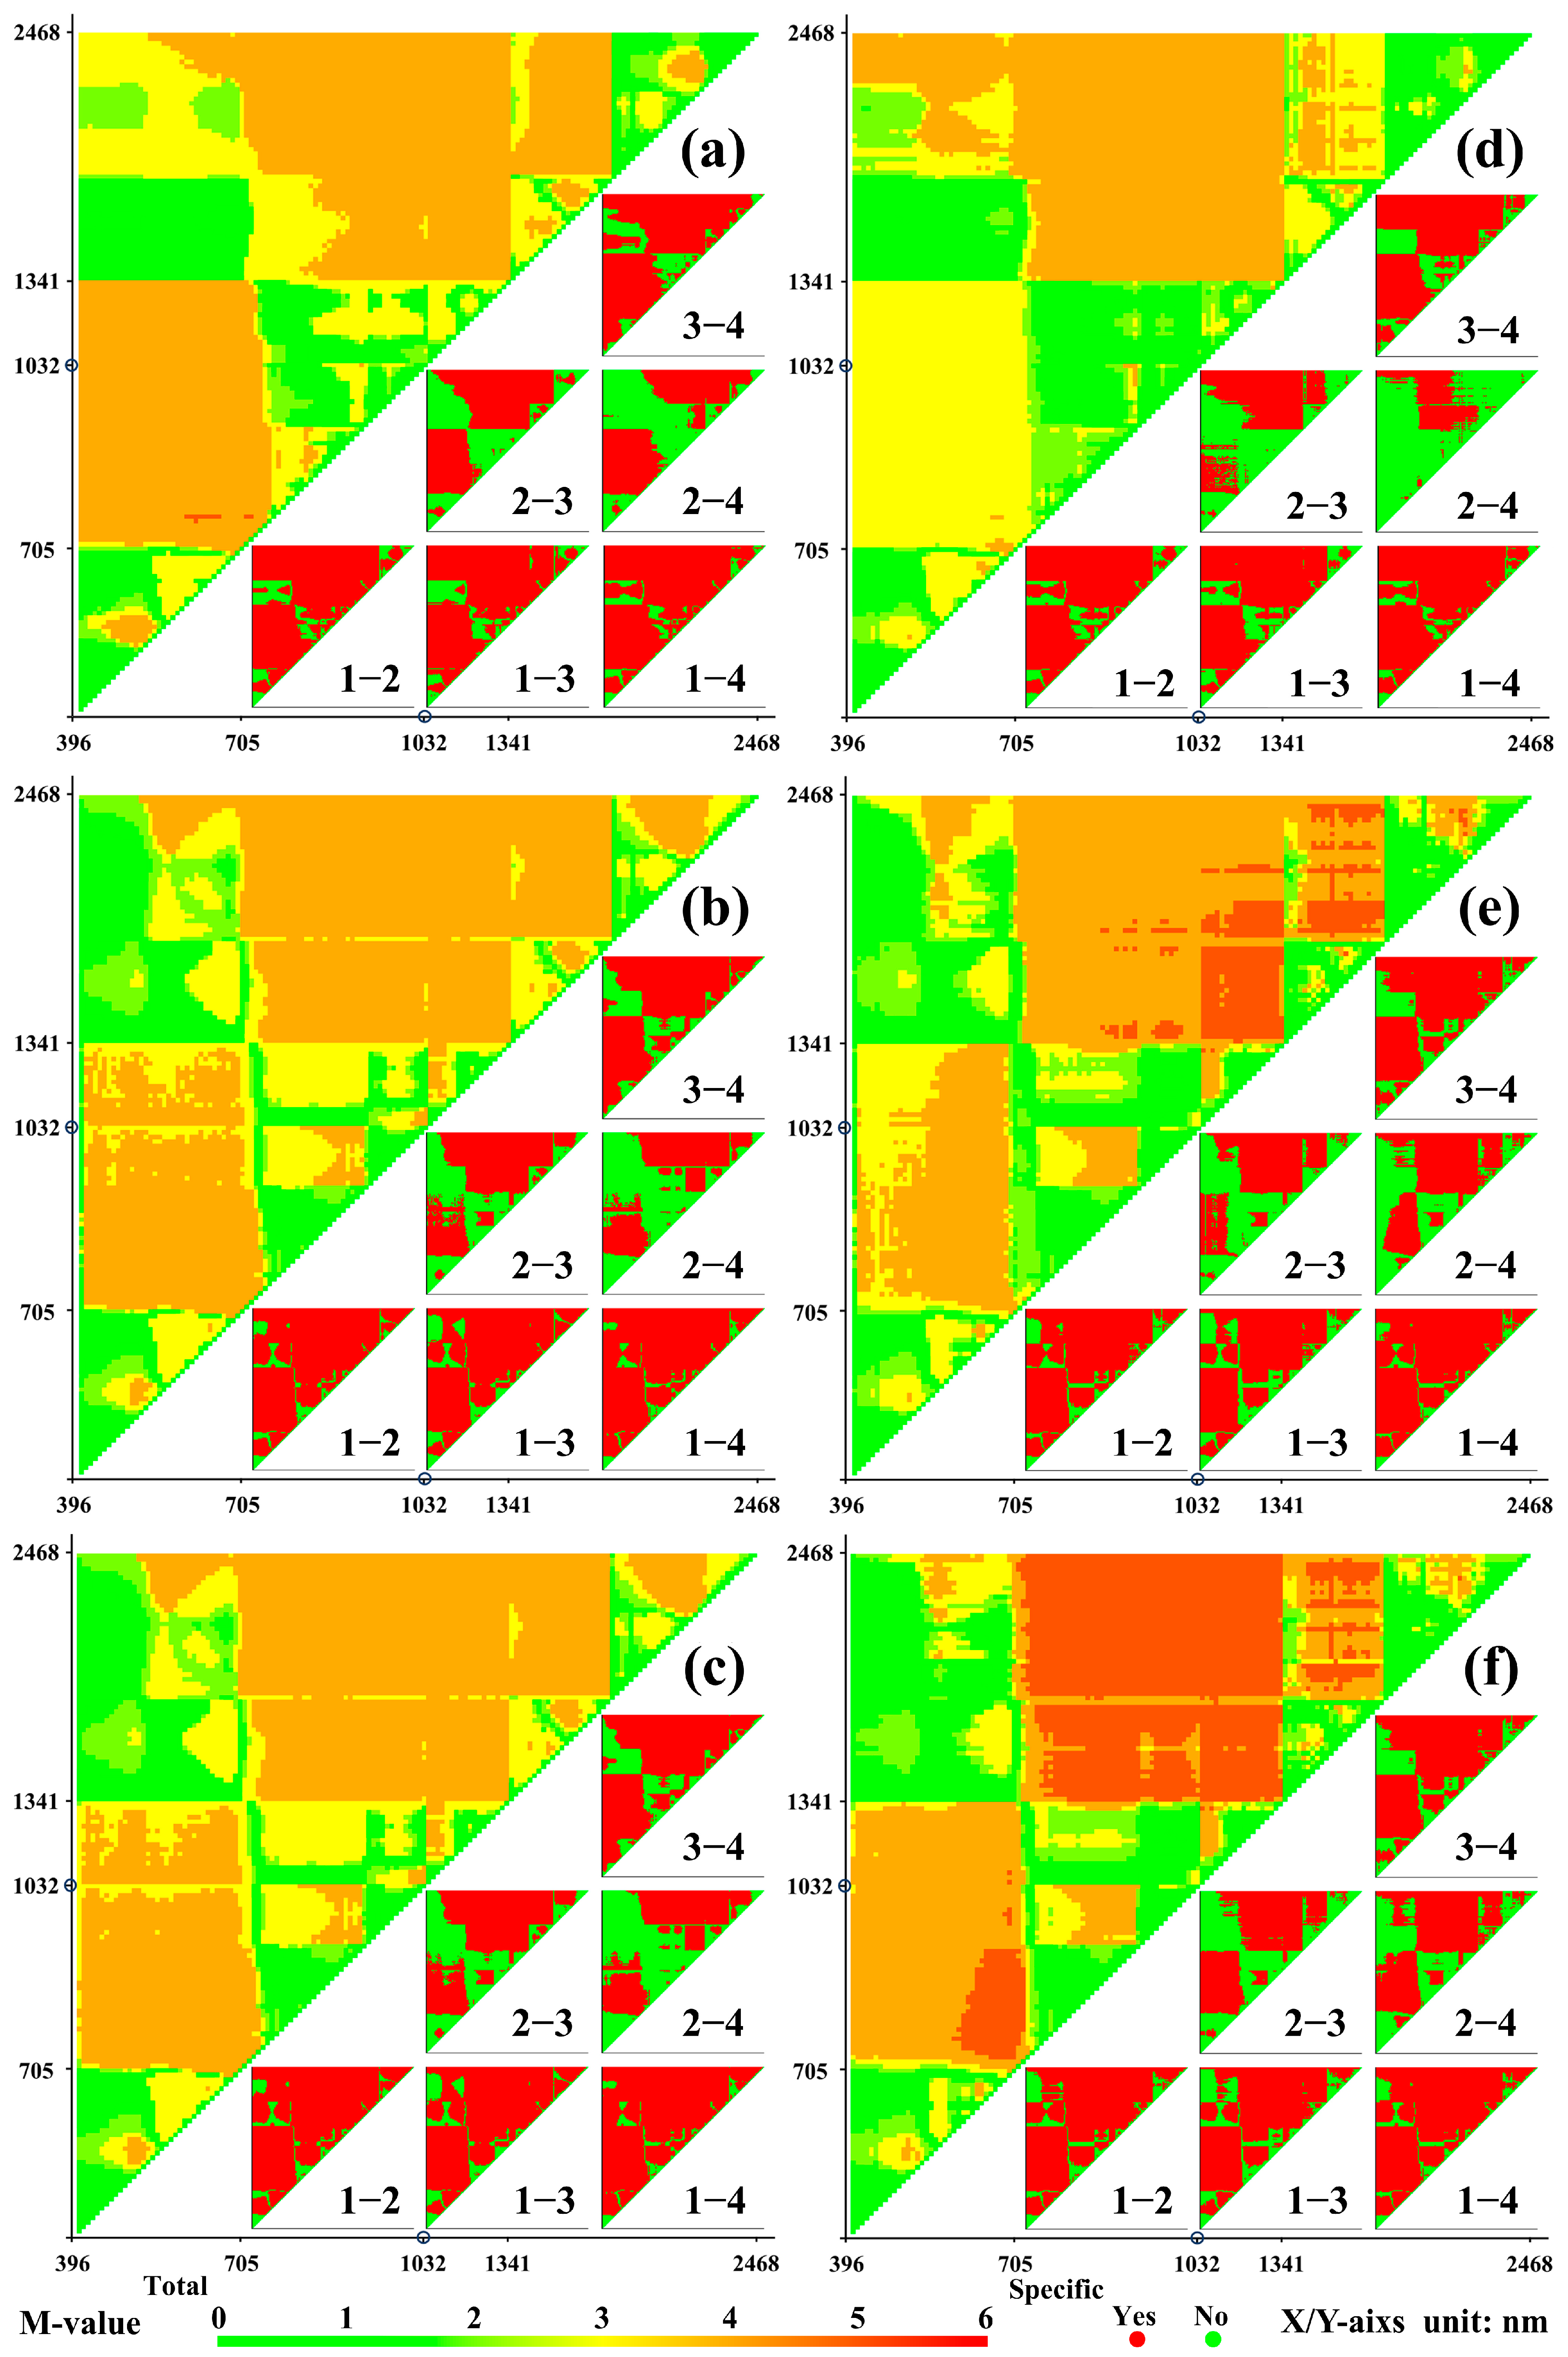
3.3. Comparison of Spectral Index Separability for Different Fire Severities

From Figure 9, the comparison of spectral index separability for different fire severities based on the post-fire image shows that the highest separability (M > 3) for the three VIs was primarily concentrated in the near-infrared to shortwave infrared region (705 nm–1341 nm) and the visible to near-infrared region (396 nm–740 nm), the shortwave infrared region (1341 nm–2468 nm) combined with the visible–near-infrared–shortwave infrared region (560 nm–1341 nm), and the shortwave infrared region (1784 nm–2468 nm) combined with the shortwave infrared region (1341 nm–1784 nm). For the pre- and post-fire image combination, the regions of high separability (M > 3) for the three dVIs were generally similar to those in the post-fire image. And there was a notable decrease in separability for the dDI category, a slight decrease for the dRI category, and an increase in separability for the dNDI category. Specifically, the dNDI category showed higher separability, particularly in the shortwave infrared region (1341 nm–2468 nm) combined with the visible–near-infrared–shortwave infrared region (560 nm–1341 nm), where large areas exhibit high separability (M = 5). The distinction between unburned and burned areas was clear, with varying levels of separability between different fire severities in the burned areas. Notably, the separability between light and moderate–high severity was relatively low. In summary, the dNDI category derived from the pre- and post-fire image combination exhibited the highest separability capability.

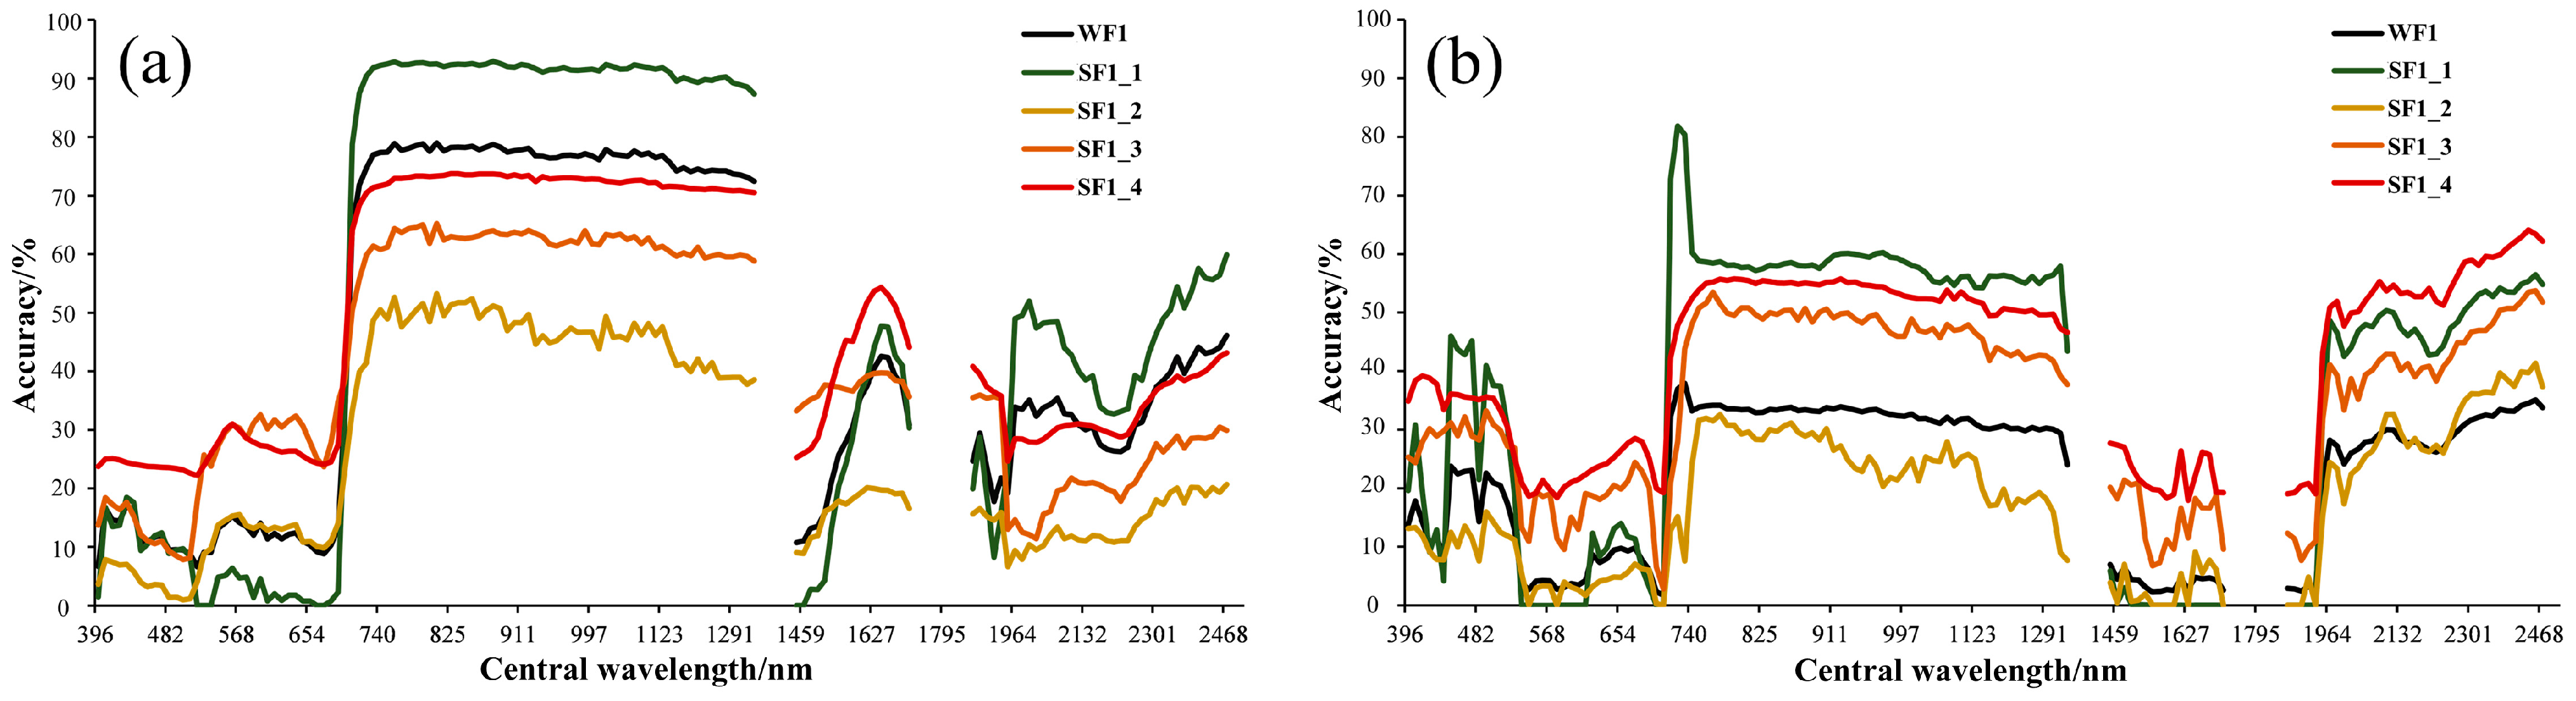
3.4. Analysis of Fire Severity Classification Accuracy for Different Spectral Bands

Figure 10 shows the classification accuracy of fire severity based on spectral and spectral difference analysis for different fire severities. The classification accuracy of the post-fire image and the pre-fire and post-fire differential image varied significantly with wavelength. For the post-fire image, the spectral classification accuracy was optimal in the near-infrared to shortwave infrared range (722 nm–1341 nm), with the highest WF1 of 78.99% at 800 nm. However, classification accuracy in other spectral ranges was relatively low. In contrast, the classification accuracy of the spectral difference in the pre- and post-fire images was poor across the entire spectral range, with the highest WF1 of 37.89% occurring at 731 nm. These findings suggest that the spatial spectral differences induced by fire in the post-fire image are more pronounced than the temporal spectral differences in the pre- and post-fire images. The post-fire spectral differences can effectively differentiate burned from unburned areas, though distinguishing between different fire severities remains challenging. On the other hand, the spectral differences between the pre- and post-fire images were not useful for reliably identifying burned areas, and they failed to provide an effective classification of fire severity. In contrast, the post-fire spectral differences were more effective for distinguishing burned from unburned areas, whereas the spectral differences in the pre- and post-fire images are inadequate for determining fire severities.

3.5. Analysis of Fire Severity Classification Accuracy for Different Indices

As shown in Figure 11, the classification accuracy of the three VIs derived from the post-fire image is generally highest in areas where spectral separability was most pronounced, as analyzed earlier. WF1 for DI category, using the combination of the near-infrared band at 757 nm and the visible band at 611 nm, reached its peak value of 79.26% (Table 1). The regions with higher classification accuracy for dVIs from thepre- and post-fire image combination were largely consistent with those from the post-fire image, both focusing on areas with higher spectral separability. Compared to original VIs, the classification accuracy of dDI showed a significant decline, while dRI accuracy slightly decreased. However, the classification accuracy of dNDI improved, with the highest value of WF1 (83.39%) achieved for the combination of shortwave infrared band 2048 nm and near-infrared band 1106 nm (Table 1). The classification accuracy for distinguishing between unburned and burned areas was markedly higher, while accuracy varied for different fire severities. High severities showed the highest classification accuracy, followed by moderate severities, with light severities showing the lowest accuracy. This variation in classification accuracy was a key factor contributing to the differences in overall index performance. In conclusion, the dNDI category, derived from the pre- and post-fire image combination, offered the highest classification accuracy, making it the most effective method for fire severity classification.
The TOP 10 WF1 for different VIs based on the post-fire image are shown in Table 1. Among the DI category, the highest accuracy was achieved with the combination of the near-infrared band at 757 nm and the red band at 611 nm, with an accuracy of 79.26%. Among the RI category, the highest accuracy was achieved with the combination of the shortwave infrared bands at 2216 nm and 1728 nm, with an accuracy of 75.08%. Among the NDI category, the highest accuracy was achieved with the combination of the shortwave infrared bands at 2216 nm and 1728 nm, with an accuracy of 74.90%. A comparison of the post-fire image results revealed that the DI category provided the best classification accuracy, while the RI and NDI category showed similar but relatively lower accuracy. The optimal classification accuracy for VIs was 79.26%.
The TOP 10 WF1 for dVIs based on the pre- and post-fire image combination are shown in Table 2. Among the dDI category, the highest accuracy was achieved with the combination of the shortwave infrared band at 1627 nm and the near-infrared band at 1224 nm, with an accuracy of 78.33%. Among the dRI category, the highest accuracy was achieved with the combination of the shortwave infrared band at 1543 nm and the near-infrared band at 1241 nm, with an accuracy of 82.75%. Among the dNDI category, the highest accuracy was achieved with the combination of the shortwave infrared band at 2048 nm and the near-infrared band at 1106 nm, with an accuracy of 83.39%. The analysis of the pre- and post-fire image combination indicated that the dNDI category provided the best classification accuracy, followed by the dRI category, and the dDI category yielded the lowest accuracy. The optimal classification accuracy for dVIs was 83.39%.

4. Conclusions

This study, based on ZY1E/F AHSI data, compares the sensitivity of fire severity estimation using spectral bands and indices from the post-fire image and the pre- and post-fire image combination, employing exhaustive and fixed-step threshold search methods. The results indicate the following: (1) The post-fire image generally exhibited better spectral separation and classification capability compared to the pre-fire and post-fire difference image. The classification accuracy based on spectral differences for the full spectral range in the pre- and post-fire difference image was low, with the highest WF1 of 37.89% at the 731 nm central wavelength. In contrast, the post-fire image had the highest spectral classification accuracy in the near-infrared range (722 nm–1341 nm), with a peak WF1 of 78.99% at the 800 nm central wavelength. (2) dNDI from the pre- and post-fire image combination outperformed VIs derived from the post-fire image and other dVIs constructed from the pre- and post-fire image combination. DI categories in the post-fire image showed good separability and classification accuracy, with the highest WF1 of 79.26% for the combination of the 757 nm and 611 nm central wavelength. The highest classification accuracy for the pre- and post-fire image combination was achieved by dNDI, with the peak WF1 of 83.39% for the combination of the 2048 nm and 1106 nm central wavelength. (3) There is clear spectral and index separability between unburned and burned areas, which allows for effective segmentation. However, the separability between various fire severities in burned areas is poor, particularly between light and moderate–high severities. This lack of distinction is a major limiting factor in fire severity estimation.
The complexity of the combustion process in forest and grassland makes it challenging to accurately and comprehensively extract areas with varying fire severities. The key to developing effective fire severity estimation indices lies in fully leveraging the spectral signals associated with various fire severity categories, enhancing the differentiation between severity levels while minimizing the influence of irrelevant information. This study is the first to comprehensively construct all possible indices using three commonly applied index formulation methods based on narrow bands (10 nm or 20 nm) spanning 396 nm to 2495 nm. The optimal spectral bands and indices of ZY-1 hyperspectral image at different time phases have been identified by systematically exploring the relationship between forest fire severity and spectral variations observed via satellite remote sensing. These findings provide valuable guidance for defining spectral settings in future operational fire severity-monitoring satellites and for developing or optimizing fire severity classification indices. However, this study only compared indices constructed from two bands and relied on simple linear relationships, such as spectral value size and variation trends. It lacks a deeper exploration of the interrelationships between multiple bands. Future work will focus on more complex spectral differences, with the aim of fully utilizing spectral information to achieve precise fire severity estimation.

Author Contributions

X.H. and X.Q. provided the conceptualization and methodology. X.H., F.J., F.M. and L.Y. collected the experimental materials. X.H. and X.Q. performed the data collation and analysis. X.H. wrote the manuscript. X.Q. and S.H. contributed with suggestions. All authors have read and agreed to the published version of the manuscript.

Funding

This research was funded by the National Key R&D Program of China, grant number “2023YFD2202000”.

Institutional Review Board Statement

Not applicable.

Informed Consent Statement

Not applicable.

Data Availability Statement

The ZY-1 hyperspectral data, requiring an application for access, were provided by the China Centre for Resources Satellite Data and Application (https://data.cresda.cn/, accessed 20 December 2023). The Sentinel-2 multispectral data used in this study were obtained from the Google Earth Engine (https://code.earthengine.google.com/, accessed 9 January 2024).

Acknowledgments

We would like to thank the Google Earth Engine platform, the European Space Agency, and the China Center for Resources Satellite Data and Application for providing data for this study. We also extend our gratitude to those who provided guidance and support.

Conflicts of Interest

The authors declare no conflicts of interest.

References

  1. Heydari, M.; Rostamy, A.; Najafi, F.; Dey, D. Effect of fire severity on physical and biochemical soil properties in Zagros oak (Quercus brantii Lindl.) forests in Iran. J. For. Res. 2017, 28, 95–104. [Google Scholar] [CrossRef]
  2. Singh, J.; Boucher, P.B.; Hockridge, E.G.; Davies, A.B. Effects of long-term fixed fire regimes on African savanna vegetation biomass, vertical structure and tree stem density. J. Appl. Ecol. 2023, 60, 1223–1238. [Google Scholar] [CrossRef]
  3. Fu, J.; Wu, Z.; Yan, S.; Zhang, Y.; Gu, X.; Du, L. Effects of climate, vegetation, and topography on spatial patterns of burn severity in the Great Xing’an Mountains. Acta Ecol. Sin. 2020, 40, 1672–1682. [Google Scholar]
  4. Chuvieco, E.; Mouillot, F.; Van der Werf, G.R.; San Miguel, J.; Tanase, M.; Koutsias, N.; García, M.; Yebra, M.; Padilla, M.; Gitas, I.; et al. Historical background and current developments for mapping burned area from satellite Earth observation. Remote Sens. Environ. 2019, 225, 45–64. [Google Scholar] [CrossRef]
  5. Han, D.; Di, X.; Yang, G.; Sun, L.; Weng, Y. Quantifying fire severity: A brief review and recommendations for improvement. Ecosyst. Health Sustain. 2021, 7, 1973346. [Google Scholar] [CrossRef]
  6. Miller, M.E.; Elliot, W.J.; Billmire, M.; Robichaud, P.R.; Endsley, K.A. Rapid-response tools and datasets for post-fire remediation: Linking remote sensing and process-based hydrological models. Int. J. Wildland Fire 2016, 25, 1061–1073. [Google Scholar] [CrossRef]
  7. Li, M.; Kang, X.; Fan, W. Burned area extraction in Huzhong forests based on remote sensing and the spatial analysis of the burned severity. Sci. Silvae Sin. 2017, 53, 163–174. [Google Scholar]
  8. Miller, C.W.; Harvey, B.J.; Kane, V.R.; Moskal, L.M.; Alvarado, E. Different approaches make comparing studies of burn severity challenging: A review of methods used to link remotely sensed data with the Composite Burn Index. Int. J. Wildland Fire 2023, 32, 449–475. [Google Scholar] [CrossRef]
  9. Saberi, S.J.; Agne, M.C.; Harvey, B.J. Do you CBI what I see? The relationship between the Composite Burn Index and quantitative field measures of burn severity varies across gradients of forest structure. Int. J. Wildland Fire 2022, 31, 112–123. [Google Scholar] [CrossRef]
  10. Yang, D.; Wu, Z.; Liang, Y.; He, H. Establishment of Quantitative Indexes of Forest Fire Severity in Forest Region. For. Grassl. Resour. Res. 2014, 6, 140–145. [Google Scholar] [CrossRef]
  11. Veraverbeke, S.; Hook, S.; Hulley, G. An alternative spectral index for rapid fire severity assessments. Remote Sens. Environ. 2012, 123, 72–80. [Google Scholar] [CrossRef]
  12. Veraverbeke, S.; Dennison, P.; Gitas, I.; Hulley, G.; Kalashnikova, O.; Katagis, T.; Kuai, L.; Meng, R.; Roberts, D.; Stavros, N. Hyperspectral remote sensing of fire: State-of-the-art and future perspectives. Remote Sens. Environ. 2018, 216, 105–121. [Google Scholar] [CrossRef]
  13. Chen, Y.; Lara, M.J.; Hu, F.S. A robust visible near-infrared index for fire severity mapping in Arctic tundra ecosystems. ISPRS J. Photogramm. Remote Sens. 2020, 159, 101–113. [Google Scholar]
  14. Kurbanov, E.; Vorobev, O.; Lezhnin, S.; Sha, J.; Wang, J.; Li, X.; Cole, J.; Dergunov, D.; Wang, Y. Remote sensing of forest burnt area, burn severity, and post-fire recovery: A review. Remote Sens. 2022, 14, 4714. [Google Scholar] [CrossRef]
  15. Parks, S.A.; Dillon, G.K.; Miller, C. A new metric for quantifying burn severity: The relativized burn ratio. Remote Sens. 2014, 6, 1827–1844. [Google Scholar]
  16. Carvajal-Ramírez, F.; Marques da Silva, J.R.; Agüera-Vega, F.; Martínez-Carricondo, P.; Serrano, J.; Moral, F.J. Evaluation of fire severity indices based on pre-and post-fire multispectral imagery sensed from UAV. Remote Sens. 2019, 11, 993. [Google Scholar] [CrossRef]
  17. McKenna, P.; Erskine, P.D.; Lechner, A.M.; Phinn, S. Measuring fire severity using UAV imagery in semi-arid central Queensland, Australia. Int. J. Remote Sens. 2017, 38, 4244–4264. [Google Scholar] [CrossRef]
  18. García-Llamas, P.; Suárez-Seoane, S.; Fernández-Guisuraga, J.M.; Fernández-García, V.; Fernández-Manso, A.; Quintano, C.; Taboada, A.; Marcos, E.; Calvo, L. Evaluation and comparison of Landsat 8, Sentinel-2 and Deimos-1 remote sensing indices for assessing burn severity in Mediterranean fire-prone ecosystems. Int. J. Appl. Earth Obs. Geoinf. 2019, 80, 137–144. [Google Scholar] [CrossRef]
  19. Veraverbeke, S.; Verstraeten, W.W.; Lhermitte, S.; Goossens, R. Evaluating Landsat Thematic Mapper spectral indices for estimating burn severity of the 2007 Peloponnese wildfires in Greece. Int. J. Wildland Fire 2010, 19, 558–569. [Google Scholar] [CrossRef]
  20. Quintano, C.; Fernandez-Manso, A.; Roberts, D.A. Burn severity mapping from Landsat MESMA fraction images and Land Surface Temperature. Remote Sens. Environ. 2017, 190, 83–95. [Google Scholar]
  21. Quintano, C.; Fernández-Manso, A.; Calvo, L.; Marcos, E.; Valbuena, L. Land surface temperature as potential indicator of burn severity in forest Mediterranean ecosystems. Int. J. Appl. Earth Obs. Geoinf. 2015, 36, 1–12. [Google Scholar] [CrossRef]
  22. Zheng, Z.; Zeng, Y.; Li, S.; Huang, W. A new burn severity index based on land surface temperature and enhanced vegetation index. Int. J. Appl. Earth Obs. Geoinf. 2016, 45, 84–94. [Google Scholar] [CrossRef]
  23. Fernández-García, V.; Santamarta, M.; Fernández-Manso, A.; Quintano, C.; Marcos, E.; Calvo, L. Burn severity metrics in fire-prone pine ecosystems along a climatic gradient using Landsat imagery. Remote Sens. Environ. 2018, 206, 205–217. [Google Scholar] [CrossRef]
  24. Tan, L.; Zeng, Y.; Zhong, Z. An adaptability analysis of remote sensing indices in evaluating fire severity. Remote Sens. Nat. Resour. 2016, 28, 84–90. [Google Scholar]
  25. Fernandez-Manso, A.; Quintano, C.; Roberts, D.A. Burn severity analysis in Mediterranean forests using maximum entropy model trained with EO-1 Hyperion and LiDAR data. ISPRS J. Photogramm. Remote Sens. 2019, 155, 102–118. [Google Scholar] [CrossRef]
  26. Chuvieco, E.; Riaño, D.; Danson, F.; Martin, P. Use of a radiative transfer model to simulate the postfire spectral response to burn severity. J. Geophys. Res. Biogeosci. 2006, 111. [Google Scholar] [CrossRef]
  27. Ghazali, N.N.; Saraf, N.M.; Rasam, A.R.A.; Othman, A.N.; Salleh, S.A.; Saad, N.M. Forest Fire Severity Level Using dNBR Spectral Index. Rev. Int. Geomat. 2025, 34, 89–101. [Google Scholar] [CrossRef]
  28. Morgan, P.; Keane, R.E.; Dillon, G.K.; Jain, T.B.; Hudak, A.T.; Karau, E.C.; Sikkink, P.G.; Holden, Z.A.; Strand, E.K. Challenges of assessing fire and burn severity using field measures, remote sensing and modelling. Int. J. Wildland Fire 2014, 23, 1045–1060. [Google Scholar] [CrossRef]
  29. Loboda, T.V.; French, N.H.; Hight-Harf, C.; Jenkins, L.; Miller, M.E. Mapping fire extent and burn severity in Alaskan tussock tundra: An analysis of the spectral response of tundra vegetation to wildland fire. Remote Sens. Environ. 2013, 134, 194–209. [Google Scholar] [CrossRef]
  30. Mallinis, G.; Mitsopoulos, I.; Chrysafi, I. Evaluating and comparing Sentinel 2A and Landsat-8 Operational Land Imager (OLI) spectral indices for estimating fire severity in a Mediterranean pine ecosystem of Greece. GIScience Remote Sens. 2018, 55, 1–18. [Google Scholar] [CrossRef]
  31. Tran, B.N.; Tanase, M.A.; Bennett, L.T.; Aponte, C. Evaluation of spectral indices for assessing fire severity in Australian temperate forests. Remote Sens. 2018, 10, 1680. [Google Scholar] [CrossRef]
  32. Lu, B.; He, Y.; Tong, A. Evaluation of spectral indices for estimating burn severity in semiarid grasslands. Int. J. Wildland Fire 2015, 25, 147–157. [Google Scholar] [CrossRef]
  33. Kadakci Koca, T. A statistical approach to site-specific thresholding for burn severity maps using bi-temporal Landsat-8 images. Earth Sci. Inform. 2023, 16, 1313–1327. [Google Scholar] [CrossRef]
  34. Amos, C.; Petropoulos, G.P.; Ferentinos, K.P. Determining the use of Sentinel-2A MSI for wildfire burning & severity detection. Int. J. Remote Sens. 2019, 40, 905–930. [Google Scholar]
  35. Badda, H.; Cherif, E.K.; Boulaassal, H.; Wahbi, M.; Yazidi Alaoui, O.; Maatouk, M.; Bernardino, A.; Coren, F.; El Kharki, O. Improving the accuracy of random forest classifier for identifying burned areas in the tangier-tetouan-al hoceima region using google earth engine. Remote Sens. 2023, 15, 4226. [Google Scholar] [CrossRef]
  36. Sun, G.; Qin, X.; Yin, L.; Liu, S.; Li, Z.; Chen, X.; Zhong, X. Changes analysis of post-fire vegetation spectrum and index based on time series GF-1 WFV images. Spectrosc. Spectr. Anal. 2018, 38, 511–517. [Google Scholar]
  37. Pang, Y.; Jia, W.; Qin, X.; Si, L.; Liang, X.; Lin, X.; Li, Z. Forest fire monitoring using airborne optical full spectrum remote sensing data. J. Remote Sens 2020, 24, 1280–1292. [Google Scholar] [CrossRef]
  38. van Gerrevink, M.J.; Veraverbeke, S. Evaluating the hyperspectral sensitivity of the differenced normalized burn ratio for assessing fire severity. Remote Sens. 2021, 13, 4611. [Google Scholar] [CrossRef]
  39. Hamilton, D.; Bowerman, M.; Colwell, J.; Donohoe, G.; Myers, B. Spectroscopic analysis for mapping wildland fire effects from remotely sensed imagery. J. Unmanned Veh. Syst. 2017, 5, 146–158. [Google Scholar] [CrossRef]
  40. Veraverbeke, S.; Stavros, E.N.; Hook, S.J. Assessing fire severity using imaging spectroscopy data from the Airborne Visible/Infrared Imaging Spectrometer (AVIRIS) and comparison with multispectral capabilities. Remote Sens. Environ. 2014, 154, 153–163. [Google Scholar] [CrossRef]
  41. Quintano, C.; Calvo, L.; Fernández-Manso, A.; Suárez-Seoane, S.; Fernandes, P.M.; Fernández-Guisuraga, J.M. First evaluation of fire severity retrieval from PRISMA hyperspectral data. Remote Sens. Environ. 2023, 295, 113670. [Google Scholar] [CrossRef]
  42. Toshiharu, M. Illustrated Remote Sensing (Revised Version); Japan Association of Remote Sensing: Tokyo, Japan; Japan Association of Surveyors: Tokyo, Japan, 2011; pp. 8–9. [Google Scholar]
  43. Berk, A.; Anderson, G.P.; Acharya, P.K.; Bernstein, L.S.; Muratov, L.; Lee, J.; Fox, M.J.; Adler-Golden, S.M.; Chetwynd, J.H., Jr.; Hoke, M.L. MODTRAN5: A reformulated atmospheric band model with auxiliary species and practical multiple scattering options. In Proceedings of the Algorithms and Technologies for Multispectral, Hyperspectral, and Ultraspectral Imagery X, Orlando, FL, USA, 12–16 April 2004; pp. 341–347. [Google Scholar]
  44. Li, Y.; Deng, R.; Li, J.; Guo, Y.; Li, Y.; Kuang, Z.; Gu, Y.; Liang, Y. Integrated radiometric and atmospheric calibration method of orbita hyperspectral images combined with typical ground object spectra. Bull. Surv. Mapp. 2025, 52–58. [Google Scholar] [CrossRef]
  45. Wang, Z.; Li, X.; Li, S.; Chen, L. Quickly atmospheric correction for GF-1 WFV cameras. J. Remote Sens. 2016, 20, 353–360. [Google Scholar]
  46. Zhang, H.; Zhang, H.; Yan, D.; Liu, T.; Li, G.; Yi, P. Fast generation of MODTRAN-based Atmospheric Correction Lookup Tables in the cluster computing environment. Remote Sens. Technol. Appl. 2024, 39, 1442–1451. [Google Scholar]
  47. Du, Y.; Li, M.; Fan, W.; Wang, B. Estimation of forest stand age based on GWR model and forest fire remote sensing data. Sci. Silvae Sin. 2019, 55, 184–194. [Google Scholar]
  48. Kaufman, Y.J.; Remer, L.A. Detection of forests using mid-IR reflectance: An application for aerosol studies. IEEE Trans. Geosci. Remote Sens. 1994, 32, 672–683. [Google Scholar] [CrossRef]
  49. Roteta, E.; Bastarrika, A.; Padilla, M.; Storm, T.; Chuvieco, E. Development of a Sentinel-2 burned area algorithm: Generation of a small fire database for sub-Saharan Africa. Remote Sens. Environ. 2019, 222, 1–17. [Google Scholar] [CrossRef]
  50. Kebede, T.A.; Hailu, B.T.; Suryabhagavan, K.V. Evaluation of spectral built-up indices for impervious surface extraction using Sentinel-2A MSI imageries: A case of Addis Ababa city, Ethiopia. Environ. Chall. 2022, 8, 100568. [Google Scholar] [CrossRef]
  51. Zhu, X.; Li, Q.; Guo, C. Evaluation of the monitoring capability of various vegetation indices and mainstream satellite band settings for grassland drought. Ecol. Inform. 2024, 82, 102717. [Google Scholar] [CrossRef]
Figure 1. Location of study area.
Forests 16 00640 g001
Figure 2. Color stereo of hyperspectral image of burned area by ZY1E AHSI data.
Forests 16 00640 g002
Figure 3. Schematic diagram of data preprocessing flow. The black solid boxes represent data states, the red dashed boxes indicate operational steps, and the blue dashed boxes denote corresponding processing functions.
Forests 16 00640 g003
Figure 4. The data for validation and sample in this study. (a,b) Sentinel-2 MSI image of pre-fire and post-fire, respectively, with the synthesized bands of Red-NIR-Green; (c) The different fire intensity regions divided by dNBR; (d) The distribution map of the sample points, and the bottom map is the ZY1E AHSI image with the synthesized bands of Red-NIR-Green.
Forests 16 00640 g004
Figure 5. Workflow for determining fire severity classification thresholds. (a) Dual-directional search for intensity thresholds in positive order; (b) Dual-directional search for intensity thresholds in inverse order.
Forests 16 00640 g005
Figure 6. Comparison results of spectral curves for different fire severities using the post-fire ZY1 AHSI image. Note: The ‘pre-fire or post-fire’ and ‘severity levels’ are connected by an underscore (‘_’) to represent the spectra or spectral differences in the respective severity levels in the period, similarly for subsequent cases.
Forests 16 00640 g006
Figure 7. Comparison results of spectral curves for different fire severities in the pre- and post-fire images. (a) Unburned; (b) Light severity; (c) Moderate severity; (d) High severity.
Forests 16 00640 g007
Figure 8. Comparison results of spectral separability among different fire severities. (a) Post-fire image; (b) Pre- and post-fire difference image.
Forests 16 00640 g008
Figure 9. The separability comparison of different VIs in the post-fire image and different dVIs in the pre- and post-fire image combination. (a) DI category; (b) RI category; (c) NDI category; (d) dDI category; (e) dRI category; (f) dNDI category. Note: The spectral resolution is 10 nm below the 1032 nm mark and 20 nm above it. Similarly for subsequent cases.
Forests 16 00640 g009
Figure 10. The accuracy of spectral and spectral difference classification for different fire severities. (a) Post-fire image; (b) Difference of the Pre- and post-fire image.
Forests 16 00640 g010
Figure 11. The classification accuracy of different VIs in the post-fire image and different dVIs in the pre- and post-fire image combination. (a) DI category; (b) RI category; (c) NDI category; (d) dDI category; (e) dRI category; (f) dNDI category.
Forests 16 00640 g011
Table 1. The TOP 10 classification accuracies of different VIs for post-fire image.
RankingDI CategoryRI CategoryNDI Category
Combination/nmWF1/%Combination/nmWF1/%Combination/nmWF1/%
1757–61179.262216–172875.082216–172874.90
2705–64579.112216–157774.972216–171274.71
3705–65479.042216–154374.762216–157774.70
4714–63778.942216–156074.682216–159474.69
5731–61978.922216–171274.652216–174574.60
6731–59478.782216–162774.551998–157774.59
7757–55978.742031–151074.452216–167874.54
8775–61178.662031–167874.392216–156074.47
9722–64578.652199–154374.392031–157774.44
10783–61978.652199–166174.352199–154374.44
Table 2. The TOP 10 classification accuracies of different dVIs for the pre- and post-fire image combination.
RankingdDI CategorydRI CategorydNDI Category
Combination/nmWF1/%Combination/nmWF1/%Combination/nmWF1/%
11627–122478.33 1543–124182.75 2048–110683.39
21627–124178.02 2031–166182.73 2031–110683.38
31627–130877.98 1543–132482.66 2199–107383.33
41627–120777.84 2048–161082.63 2417–74083.29
51627–119077.73 2048–125782.55 2031–105683.22
61627–125777.65 1745–124182.54 2115–83483.18
72199–74877.48 1745–132482.54 2216–110683.16
81644–119077.40 1610–124182.53 2048–105683.16
91627–105677.36 1610–122482.49 2401–75783.15
102199–73177.35 2031–161082.48 2216–108983.15
Disclaimer/Publisher’s Note: The statements, opinions and data contained in all publications are solely those of the individual author(s) and contributor(s) and not of MDPI and/or the editor(s). MDPI and/or the editor(s) disclaim responsibility for any injury to people or property resulting from any ideas, methods, instructions or products referred to in the content.

