Article

Spatiotemporal Dynamics of Forest Vegetation in Northern China and Their Responses to Climate Change

1
Precision Forestry Key Laboratory of Beijing, Beijing Forestry University, Beijing 100083, China
2
College of Mathematics Science, Inner Mongolia Normal University, Hohhot 010022, China
3
Key Laboratory of Genetics and Germplasm Innovation of Tropical Special Forest Trees and Ornamental Plants, Ministry of Education, Hainan University, Haikou 570228, China
4
Ecological Technical Research Institute, China International Engineering Consulting Corporation, Beijing 100037, China
5
Industry Development and Planning Institute, National Forestry and Grassland Administration, Beijing 100010, China
*
Author to whom correspondence should be addressed.
Forests 2025, 16(4), 671; https://doi.org/10.3390/f16040671
Submission received: 14 March 2025 / Revised: 1 April 2025 / Accepted: 10 April 2025 / Published: 11 April 2025
(This article belongs to the Special Issue Integrated Measurements for Precision Forestry)

Abstract

:
Forests play a crucial role in the global carbon cycle, climate regulation, and biodiversity conservation, making them essential for understanding ecosystem responses to environmental change. However, the spatiotemporal dynamics of forest vegetation and their responses to climate change have yet to be fully explored. This study assessed the spatiotemporal dynamics and adaptation of forest vegetation from Northern China by extracting changes in forest vegetation and phenological characteristics from 2001 to 2023 with the time-series MODIS Normalized Difference Vegetation Index (NDVI) data and analyzing the impact of climate variables on these changes. The linear regression analysis method and the four-parameter double logistic model were employed to assess forest vegetation changes and identify forest vegetation phenological phases, respectively. Partial correlation analysis was used to assess the relationship between forest vegetation and climate variables. The results of this study indicate that over the past two decades, the annual mean NDVI of forest vegetation has exhibited a slow increasing trend of approximately 0.002 yr−1, with a spatial distribution pattern that gradually decreases from south to north, showing a significant correlation with latitude. The magnitude of annual mean NDVI changes varies considerably among different forest vegetation types. However, except for evergreen broadleaf forests, the NDVI of all other forest types has shown a significant increasing trend. Additionally, central North China and southeastern Tibet exhibit higher NDVI values in both spring (>0.55) and autumn (>0.65) than other areas, while the NDVI values in Northeast China and North China are higher in summer (>0.8) compared to other areas. The study reveals substantial spatial heterogeneity in the average phenological phases and NDVI values of forest vegetation across different regions, influenced by latitude, altitude, and regional climatic conditions. The spatial distribution patterns of NDVI during the green-up and senescence phases remain relatively consistent, yet significant regional differences exist within the same phenological phase. Partial correlation analysis indicates that forest vegetation in different regions responds distinctly to meteorological factors. These findings contribute to a deeper understanding of the spatiotemporal dynamics of vegetation change and its complex interactions with climate change, offering valuable insights for forest ecosystem management and climate adaptation of forest vegetation.

1. Introduction

As an integral part of China’s ecosystem, the forests in Northern China are diverse in composition and span multiple geographic regions, playing a crucial role in ecological security and climate regulation. For instance, shelter forests in the northern arid and semi-arid regions serve as natural barriers against desertification [1]. The boreal forests in northeastern China possess high carbon storage capacity, significantly contributing to the regional and global carbon balance [2,3]. Meanwhile, forests in the Qinling and Huaihe ecological system play a vital role in water conservation, regulating water supply, and maintaining the hydrological cycles of the Yellow and Yangtze Rivers [4,5]. However, much of Northern China is characterized by arid climates, low precipitation, long, harsh winters, and short growing seasons, which limit large-scale forest growth and result in low forest cover and fragile ecological conditions [6]. Consequently, the protection and sustainable development of forests in this region are directly linked to local ecological security and long-term environmental sustainability.
Forest dynamics monitoring is a crucial tool for assessing forest health, ecological function, and climate impacts, primarily encompassing forest vegetation and phenological changes. Forest vegetation reflects trends in forest resource changes, influencing carbon cycling, hydrological regulation, and biodiversity. For example, forest loss contributes to increased carbon emissions, exacerbating global warming [7], while simultaneously reducing water retention capacity, intensifying erosion and extreme weather risks [8]. Additionally, changes in forest vegetation impact wildlife habitats, which in turn affect ecosystem stability [9]. On the other hand, phenological monitoring focuses on temporal variations in forest growth cycles, such as green-up and senescence phases. Phenological changes serve as key indicators of climate change, with global warming leading to longer growing seasons, while also increasing risks of drought, frost, and other environmental stresses, potentially affecting forest productivity and carbon sequestration [10]. Furthermore, phenological shifts influence ecosystem interactions, such as pollination, migration, and food chain structures, potentially leading to mistimed species interactions, which can negatively impact biodiversity [11]. Currently, forest vegetation and phenology in Northern China are profoundly affected by climate change. Analyzing their dynamic changes and response patterns to climate variability not only provides a scientific basis for forest management and policymaking but also plays a vital role in climate change adaptation, carbon management optimization, and ecological security maintenance. Therefore, the long-term monitoring of forest vegetation changes and phenology is essential for achieving sustainable forest management and ecosystem conservation [12].
Traditional forest dynamics monitoring methods primarily rely on ground surveys and ecological models, which offer high accuracy in forest resource assessment, carbon stock estimation, and ecosystem health monitoring [13,14]. However, these methods face limitations such as small spatial coverage, high costs, and slow data updates, making them challenging for large-scale forest ecosystem change monitoring [15]. Fortunately, the advancement of remote sensing technology has provided critical tools for monitoring forest dynamics, enabling efficient, cost-effective, and large-scale assessments of forest vegetation changes, phenological variations, and their responses to climate change.
Early remote forest dynamics monitoring primarily relied on optical remote sensing, utilizing visible and near-infrared bands to identify forest distribution, assessing forest health, tracking forest vegetation changes [16,17], and analyzing global forest phenology patterns [18]. However, early remote sensing technologies suffered from low spatial resolution, long update intervals, and susceptibility to atmospheric interference, making it challenging to accurately detect forest changes [19,20]. In recent years, advancements in high-resolution satellites, multi-source remote sensing data fusion, and artificial intelligence analysis have significantly improved spatial, temporal, and spectral precision in forest monitoring [19]. Moreover, the integration of optical and radar remote sensing has enhanced data reliability by enabling monitoring under cloud cover and nighttime conditions [21]. Additionally, cloud computing platforms like Google Earth Engine (GEE) have made large-scale and multi-temporal remote sensing data processing more efficient. Machine learning and artificial intelligence algorithms have also improved forest classification accuracy and automated forest cover change detection [22]. Regardless of technological advancements, both early and modern remote sensing applications rely heavily on the Normalized Difference Vegetation Index (NDVI) as the most widely used indicator for forest dynamics monitoring.
The NDVI is calculated from near-infrared (NIR) and red light (Red) reflectance, effectively reflecting forest vegetation health, cover changes, and phenological characteristics [23]. As a simple, efficient, and low-cost remote sensing indicator, NDVI plays an irreplaceable role in forest dynamics monitoring. Compared to traditional ground surveys, the NDVI provides continuous long-term data with minimal human interference. Additionally, compared to more complex remote sensing methods, the NDVI is easily accessible, computationally simple, and highly efficient, making it feasible for large-scale, long-term forest monitoring. Currently, the NDVI is widely used for monitoring forest vegetation changes at global and regional scales [24,25,26,27]. Furthermore, the NDVI curve variations can be used to track forest phenology, with the upward inflection point indicating the green-up phase in spring, the peak representing the period of maximum vegetation growth, and the downward inflection point corresponding to the senescence phase in autumn [23]. Long-term NDVI data enable the analysis of forest phenological shifts across large spatial and temporal scales, providing valuable insights into vegetation dynamics, seasonal shifts, and ecosystem responses to climate change [28,29,30,31]. The importance of the NDVI in quantifying forest vegetation spatiotemporal dynamics has been widely recognized. However, research on the spatiotemporal variations in forest vegetation in Northern China and their response to climate change remains limited, particularly in terms of the application of long-term NDVI datasets, which warrants further investigation.
This study utilizes time-series MODIS NDVI data from 2001 to 2023 as well as climatic data (temperature, precipitation, and radiation), and applies linear regression analysis and the four-parameter double logistic model to: (1) investigate changes in forest vegetation and phenological characteristics over time in Northern China; (2) quantify the influence of climate change on forest vegetation change and phenology; (3) compare the spatiotemporal dynamic changes among different forest vegetation types; (4) analyze regional differences in forest dynamics and their climatic responses. This study aims to provide insights into the spatiotemporal dynamics of forest vegetation change and their complex interactions with climate change, offering valuable references for forest ecosystem management and climate adaptation strategies.

2. Data and Methods

2.1. Study Area

The study area encompasses 16 provinces in Northern China, spanning from west to east, including Xinjiang, Tibet, Qinghai, Gansu, Inner Mongolia, Ningxia, Shaanxi, Shanxi, Henan, Hebei, Beijing, Tianjin, Shandong, Jilin, Liaoning, and Heilongjiang (Figure 1). The study area spans multiple natural geographic regions, including plateaus, mountains, grasslands, and forests, exhibiting rich natural resources and biodiversity. The plateau regions, such as the Himalayas and the Qinghai–Tibet Plateau, are characterized by high elevations and cold climates. The mountainous regions, including the Qilian Mountains and the Qinling Mountains, feature complex and diverse topography. The grassland regions, primarily located in Inner Mongolia, include the Hulunbuir Grassland. Other areas are predominantly hilly or flat plains.
The study area extends approximately from 26° N to 53° N in latitude and from 73° E to 135° E in longitude, encompassing the Northeast, North China, Northwest, and parts of Southwest China. The region includes major forest ecosystems such as boreal coniferous forests, broadleaf forests, mixed forests, grasslands, and wetlands. Coniferous forests are primarily distributed in the northeastern, southwestern, and northwestern regions, while broadleaf forests are mainly found in North China and Southwest China. Mixed forests are widely distributed across Northern China, whereas shrublands and sparse grasslands are predominantly located in North China and Northeast China. The northern and northwestern parts of the study area are characterized by a temperate continental climate, with cold and dry winters and hot, rainy summers, although precipitation remains low in plateau regions. The remaining areas experience a temperate monsoon climate, marked by hot and rainy summers and cold, dry winters, with particularly distinct seasonal variations in Northeast China.

2.2. Datasets

2.2.1. MODIS NDVI Dataset

The normalized difference vegetation index (NDVI) data used in this study are derived from the MOD13A1 dataset, which is part of the Vegetation Indices 16-Day L3 product. The Vegetation Indices 16-Day L3 data product, generated by the Moderate Resolution Imaging Spectroradiometer (MODIS) onboard NASA’s Terra satellite, is a global L3-level vegetation index product covering the period 2001–2025 with a spatial resolution of 500 m [32]. The MOD13A1 dataset integrates daily observations through a 16-day composite cycle, using the Maximum Value Composite (MVC) algorithm to select the optimal pixels under conditions of minimal cloud cover and low viewing angles, generating the NDVI. The NDVI is calculated based on the visible light and near-infrared bands (Red: 620–670 nm, NIR: 841–876 nm) (Equation (1)), with a value range of [−1, 1]. The NDVI dataset offers a high spatiotemporal resolution, an extended observation period, and corrections for atmospheric effects and satellite drift, making it widely applicable for monitoring vegetation dynamics at regional and global scales, including studies on phenology, vegetation coverage, and leaf area index (LAI). The data are provided in HDF format, containing additional information such as radiometrically corrected surface reflectance and solar zenith angle, supporting multi-index synergistic analysis. Based on data availability, we selected MODIS NDVI data from 2001 to 2023 to analyze forest vegetation dynamics. The dataset is available for download from NASA’s Level 1 and Atmosphere Archive & Distribution System (LAADS) website (http://ladsweb.nascom.nasa.gov, accessed on 20 October 2024).
N D V I = N I R R e d N I R + R e d ,
where NIR is the near-infrared band spectral reflectance and Red is the red band spectral reflectance.
To ensure the quality and suitability of MOD13A1 datasets, data cleaning, resampling, and rigorous quality control are adopted to process the data before using to analyze the spatiotemporal dynamics of forest vegetation. The specific implementation includes the following five steps: (1) set an annual mean NDVI threshold (annual mean NDVI < 0.1) to identify and exclude non-vegetated pixels, thereby reducing the interference of non-vegetated areas on the analysis results. (2) Use a specified time window (with the annual maximum NDVI not occurring during the period from mid-June to early September) to exclude pixels affected by clouds, ensuring the accuracy of the data. (3) To maintain consistency with the spatial resolution of other datasets and improve computational efficiency, the MOD13A1 data were resampled, converting the 500 m resolution data to 0.01° × 0.01°. (4) During winter, factors such as snow accumulation may cause negative NDVI values. To prevent these outliers from affecting the analysis results, all negative NDVI values are replaced with a fixed value of 0.05 (this value is selected based on experience, aiming to minimize interference with vegetation phenology analysis). (5) Based on the multi-year average, if the average NDVI value of a pixel from July to August is less than 1.35 times the average NDVI value from November to March of the following year, the pixel is classified as evergreen vegetation and excluded. This procedure aims to focus on vegetation dynamics with significant seasonal changes, thereby improving the quality of the NDVI data, reducing the interference of outliers on the research results, and ultimately providing a more accurate representation of the true state of vegetation and its changing trends.

2.2.2. Land Cover Dataset

The land cover dataset used in this study is the MCD12Q1 International Geosphere-Biosphere Program (IGBP) data product, generated by NASA based on MODIS satellite imagery (https://lpdaac.usgs.gov/products/mcd12q1v006/, accessed on 20 October 2024). The MCD12Q1 dataset has a spatial resolution of 500 m and provides global land cover classification information, including eight different forest cover types. This study specifically employed the IGBP classification scheme to conduct an in-depth analysis of vegetation cover and phenological changes across different forest types. Given that closed shrublands and open shrublands constitute a relatively small proportion of the study area, they were merged into a single “Shrubland” category during data processing. Additionally, to account for potential land cover changes over the study period, the forest cover classification from the midpoint year, 2010, was selected as the baseline. This approach minimizes the impact of land cover variability on the phenological analysis. The final dataset comprises the following seven land cover types: evergreen conifer forest (2.79%), evergreen broadleaf forest (3.56%), deciduous conifer forest (2.41%), deciduous broadleaf forest (41.63%), mixed forest (11.34%), woody sparse grassland (36.45%), and shrubland (1.82%), as shown in Figure 1. It is important to note that in phenological analyses, evergreen vegetation poses challenges in extracting distinct phenological characteristics. Therefore, evergreen broadleaf and evergreen conifer forests were excluded from further phenological analysis.

2.2.3. Meteorological Data

The meteorological data used in this study primarily include temperature, precipitation, and radiation. The temperature and precipitation data are sourced from the China 1 km monthly temperature and precipitation dataset, published by the National Tibetan Plateau Data Center (https://data.tpdc.ac.cn/zh-hans/data/, accessed on 22 June 2024). Both datasets have a spatial resolution of 0.0083333° (approximately 1 km) and cover the period from January 1901 to December 2023. These datasets were derived from the Climate Research Unit (CRU) global 0.5° climate dataset and the WorldClim high-resolution global climate dataset using the Delta spatial downscaling approach specifically for China. Their reliability has been validated using 496 independent meteorological observation stations, with results confirming their accuracy [33]. The datasets cover China’s major land areas, including Hong Kong, Macau, and Taiwan, but exclude the South China Sea islands and other offshore regions. For efficient storage, all data are stored as int16 format in NetCDF (nc) files, where the monthly mean temperature is recorded in 0.1 °C units, and precipitation is recorded in 0.1 mm units. While global remote sensing data provide extensive and detailed meteorological information for climate research on a global scale, using domestic data services is more suitable for meteorological analysis in specific regions of China.
Apart from temperature and precipitation, solar radiation is another crucial meteorological factor influencing vegetation growth and distribution. Obtaining high-quality, high-resolution radiation data is particularly essential when studying forest vegetation change and phenology. This study utilizes monthly radiation data from the TerraClimate dataset, which has a spatial resolution of 1/24° (approximately 4 km). The TerraClimate dataset is a global climate data product developed by the Climatology Lab, integrating multiple satellite observations and reanalysis model outputs to provide various meteorological variables including solar radiation, temperature, precipitation, wind speed, relative humidity, and evapotranspiration, and is designed to support research in ecology, hydrology, and climate change. Notably, the 1/24° spatial resolution of TerraClimate is closely aligned with the 0.01° resampled vegetation index used in this study, making it highly suitable for regional-scale, fine-resolution research. A key advantage of this dataset is its strict quality control and calibration processes, ensuring high accuracy and reliability. Additionally, it offers high spatiotemporal resolution and extensive coverage, spanning from 1958 to the present, with monthly updates. In this study, the solar radiation data from TerraClimate is primarily used, as it not only captures long-term trend variations but also reflects short-term seasonal fluctuations, providing valuable insights for vegetation dynamics research.

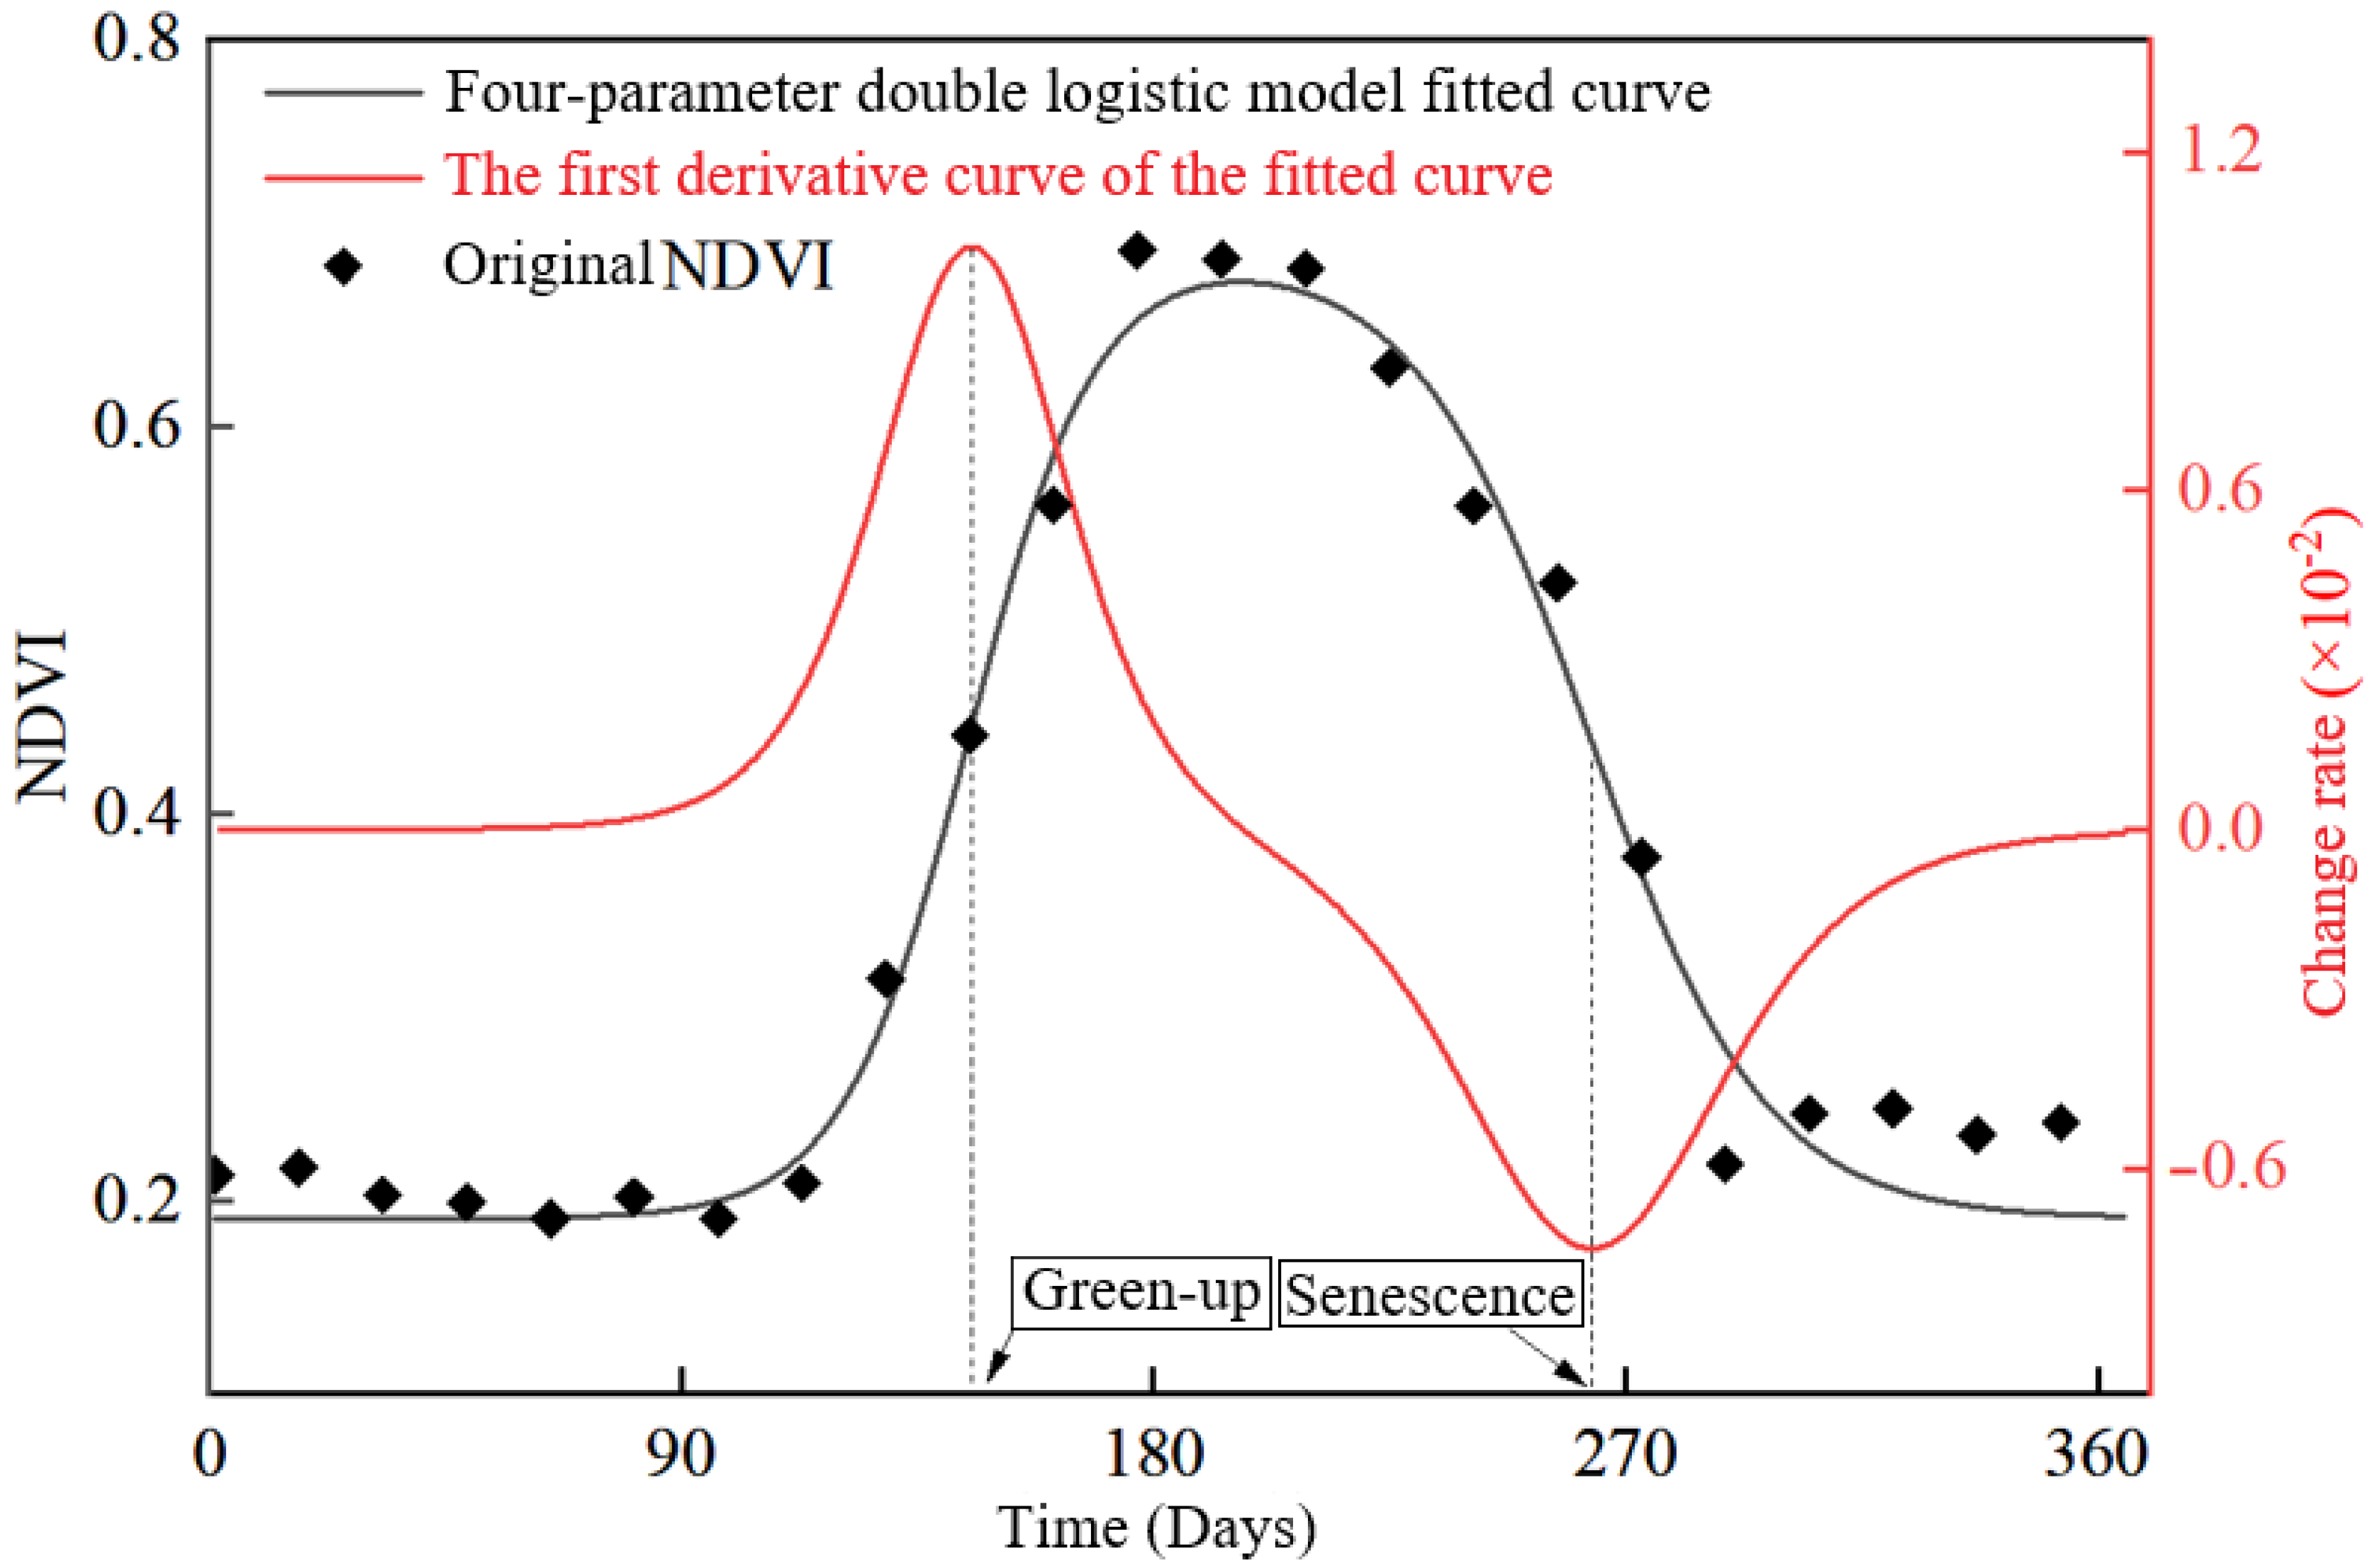
2.3. Forest Vegetation Phenological Feature Extraction

Optical remote sensing is prone to saturation effects in densely vegetated areas and is highly sensitive to the identification of sparse vegetation areas, especially bare land, which may introduce errors in the calculated vegetation index [32,34,35]. Therefore, a common approach is to apply smoothing to the vegetation index before phenology extraction to minimize these errors. In this study, the four-parameter double logistic model (Equation (2)) was employed to smooth and reconstruct the vegetation index. The NDVI daily data for forest vegetation from 2001 to 2023 were constructed at the pixel scale. The green-up and senescence phases of forest vegetation in the study area were then identified using the first derivative method (Figure 2).
This study utilizes the four-parameter double logistic model to identify the phenological periods of forest vegetation in Northern China. This approach is implemented in MATLAB R2022a (https://nl.mathworks.com/products/new_products/release2022a.html, accessed on 25 December 2024). Numerous studies have demonstrated that this model can effectively capture the green-up and senescence phases of vegetation [32,34,35,36]. In this approach, the first derivative of the NDVI fitted by the four-parameter double logistic model is analyzed to identify the time corresponding to its maximum value as the green-up period (Figure 2). The equation is as follows:
N D V I t = N D V I m i n + N D V I m a x N D V I m i n × 1 1 + exp a 1 + b 1 t 1 1 + exp a 2 + b 2 t ,
where NDVI(t) represents the NDVI value at Julian day t; NDVImax and NDVImin represent the maximum and minimum NDVI values within the year, respectively; a1, a2, b1, and b2 are empirical coefficients of the double logistic function, where a1 and a2 are the fitting parameters controlling the phase and slope of the green-up period, and b1 and b2 are the fitting parameters controlling the phase and slope of the senescence period.

2.4. Statistical Analysis

2.4.1. Linear Regression Model

The overall change trend of forest vegetation in Northern China from 2001 to 2023 was quantified using a univariate linear regression analysis. The slope of the trend line in the multi-year regression equation for each pixel represents the interannual rate of change. The significance of interannual forest vegetation changes was determined by examining the correlation between the time series (years) and the vegetation NDVI value series. A positive slope indicates an increase or delayed trend in vegetation NDVI, while a negative slope signifies a decline vegetation NDVI [32,36,37]. ENVI/IDL 5.6 software was used for pixel-wise calculation of phenological phases and NDVI parameters, as well as for the quantitative analysis of their spatiotemporal variation patterns. The calculation equation is as follows:
s l o p e = n × i = 1 n i × M i i = 1 n i i = 1 n M i n × i = 1 n i 2 ( i = 1 n i ) 2 ,
where slope is the slope of the linear regression, which indicates the trend and magnitude of forest vegetation change; n is the number of years in the monitoring period; Mi represents the annual mean vegetation NDVI value for the i-th year. The significance of the variation was determined by using the F-test in R studio (v4.1.3) software to calculate the confidence level (p < 0.05).

2.4.2. Partial Correlation Analysis

The partial correlation analysis method describes the relationship between two variables while eliminating the influence of other variables, such as assessing the correlation between temperature and forest vegetation change after removing the effects of other meteorological factors. Therefore, to better understand the independent impact of each meteorological factor on forest vegetation change, this study employs a pixel-wise partial correlation analysis (implemented in ENVI) to quantify the contribution of each meteorological factor to forest vegetation dynamics. The significance of the results was statistically analyzed using MATLAB programming language. The specific equations for calculating the Pearson correlation coefficient (Equation (4)) and the partial correlation coefficient (equation) are as follows:
R = i = 1 n ( X i X ¯ ) ( Y i Y ¯ ) i = 1 n ( X i X ¯ ) 2 i = 1 n ( Y i Y ¯ ) 2 ,
r ( 1,2 | 3 ) = R 12 R 13 × R 23 1 R 13 2 × 1 R 23 2 ,
where R represents the Pearson correlation coefficient between X and Y, n represents the number of samples, X and Y represent the values in the i-th year, and X ¯ and Y ¯ represent the average values of all years, respectively. r((1,2|3)) represents the partial correlation coefficient; R12, R13, and R23 denote the Pearson correlation coefficients between Y and X1, Y and X2, and X1 and X2, respectively. Each partial correlation coefficient is tested using the t-test (p < 0.05) [36].

3. Results

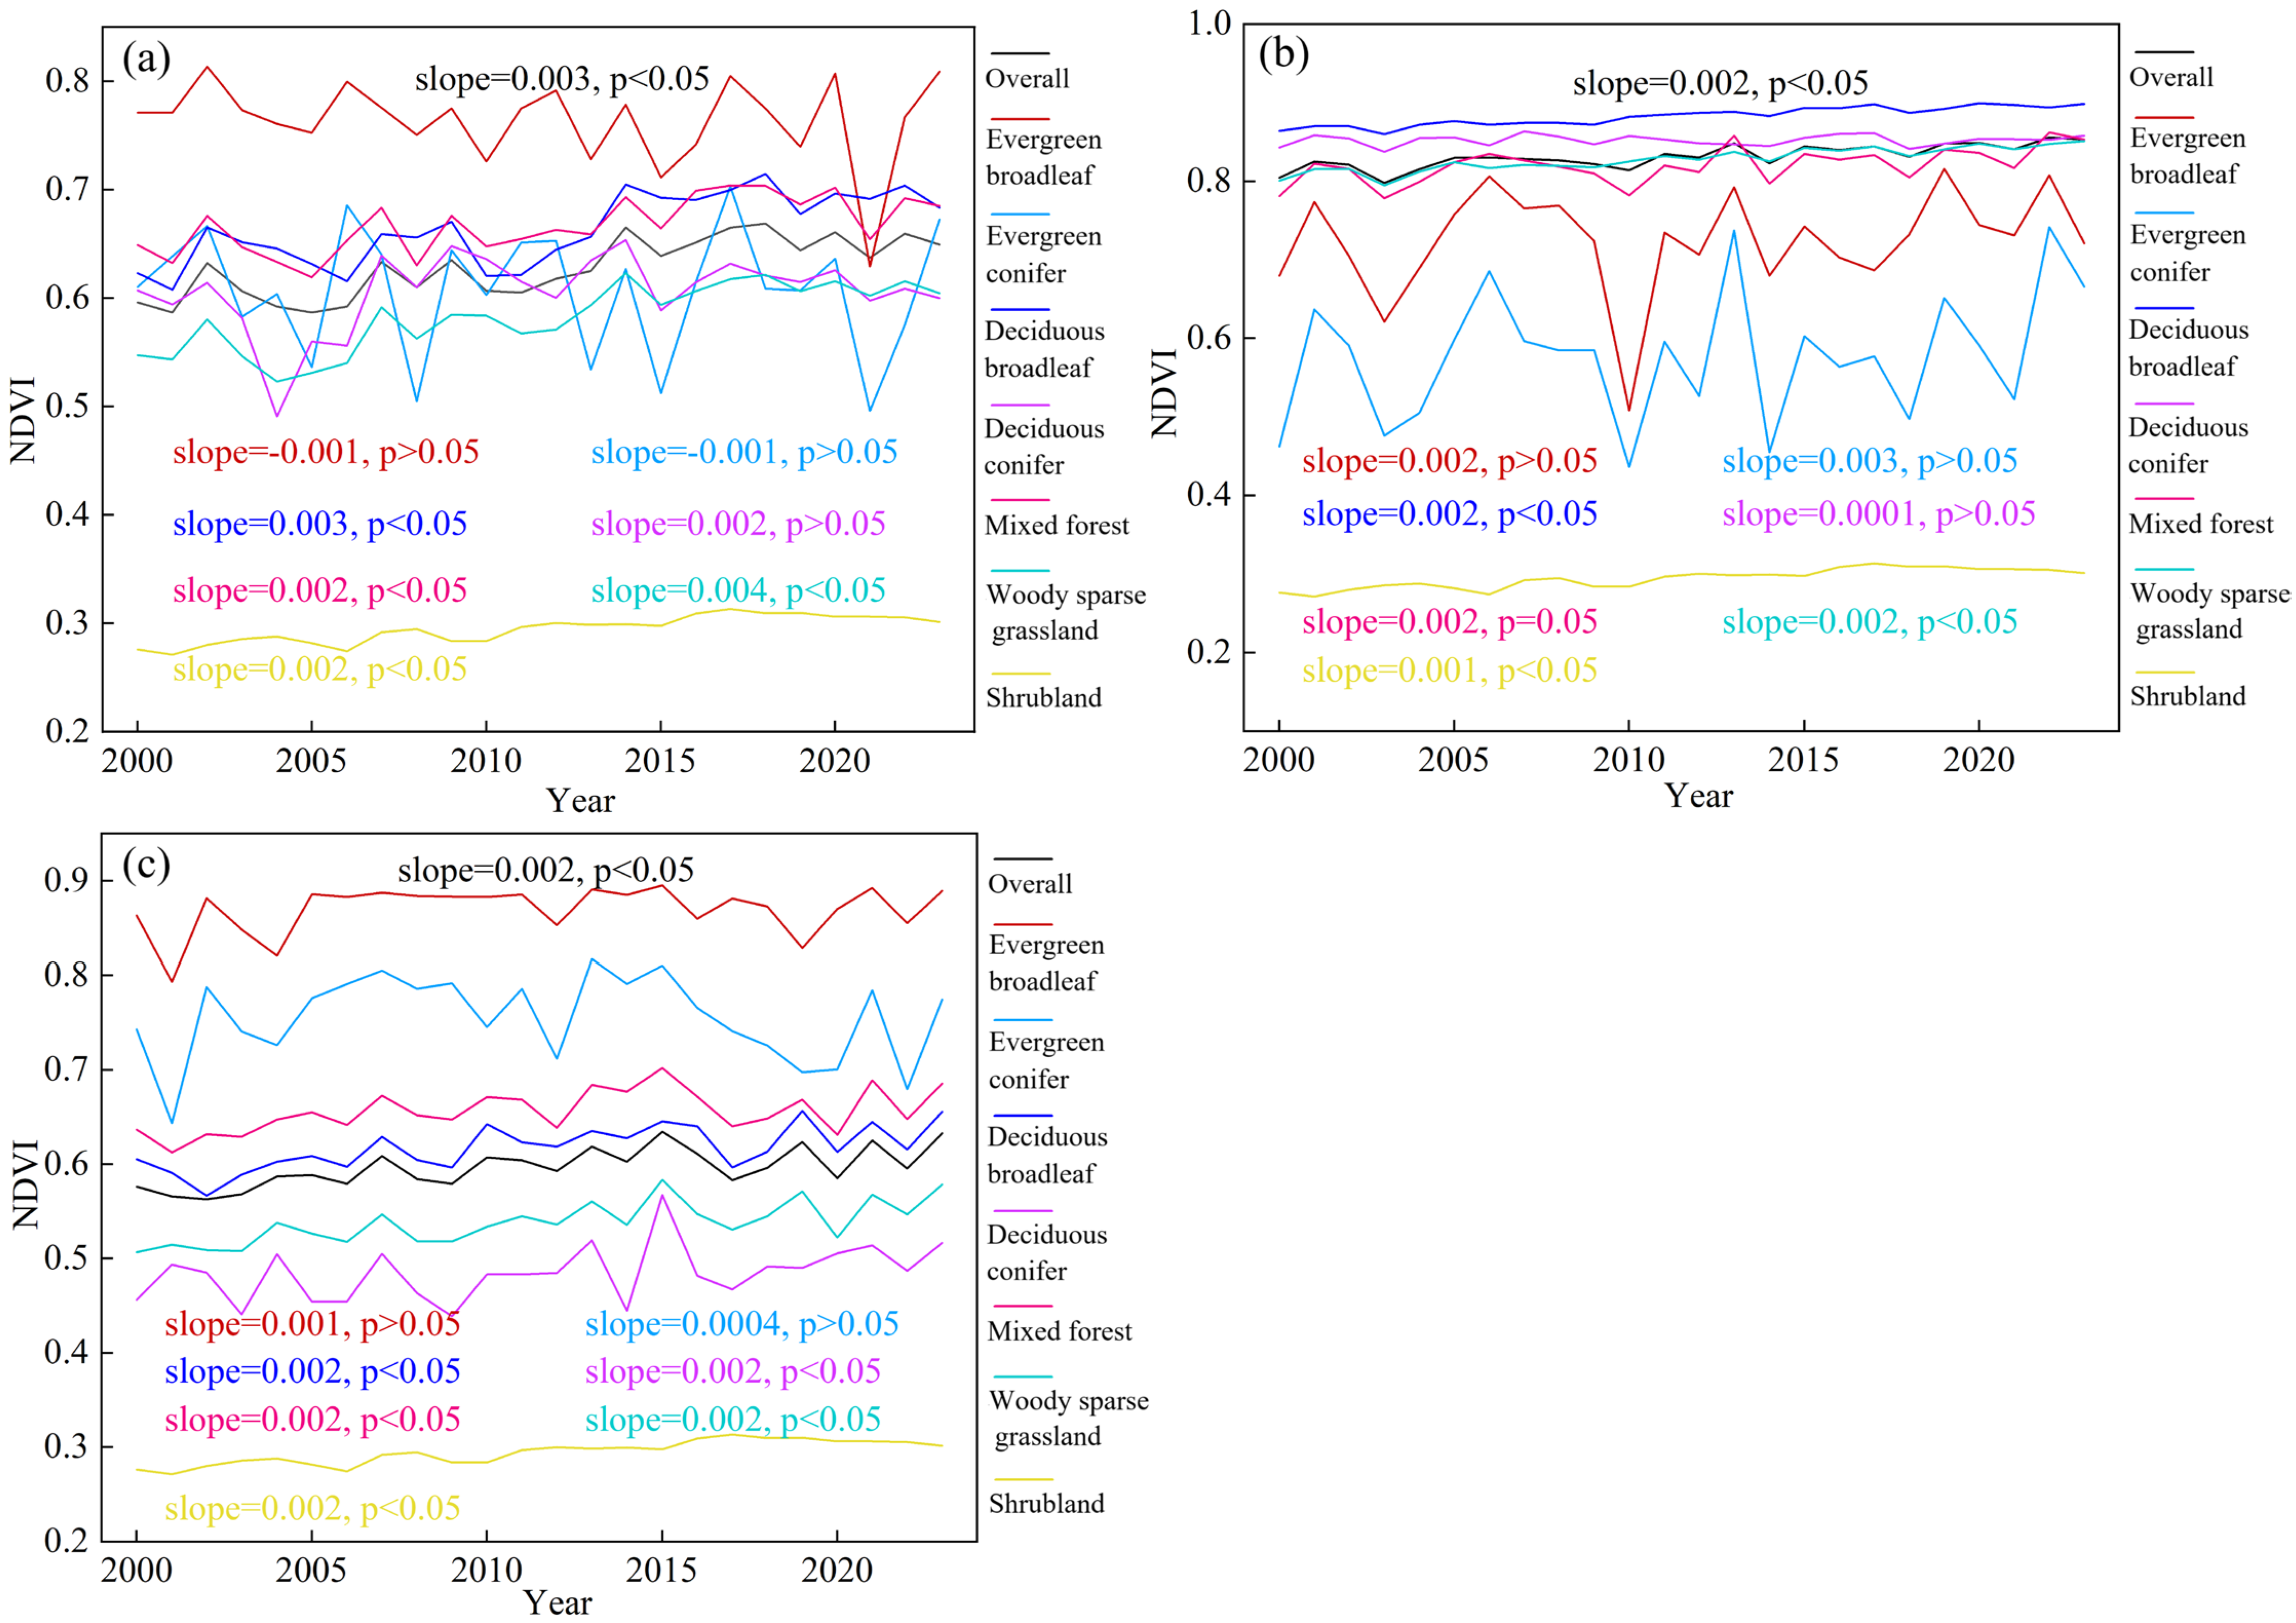
3.1. Spatiotemporal Dynamics in Forest Vegetation

The annual mean NDVI and its changing trends of forest vegetation change across 16 provinces in Northern China from 2001 to 2023 are shown in Figure 3. Over the past two decades, the annual mean NDVI exhibited a spatial pattern of gradual decrease from south to north, showing a significant correlation with latitude (Figure 3a). The region with the most significant changes in forest vegetation is observed in southeastern Tibet, where the annual mean NDVI exceeds 0.6, while the northernmost areas have the lowest NDVI values, mostly below 0.45. The growing season (April to October) mean NDVI shows an increasing trend in most study areas (Figure 3b), except for Tibet and Xinjiang, where the changes are not significant. The standard deviation of the annual mean NDVI indicated that southeastern Tibet has the highest variability, exceeding 0.05, followed by southern Shanxi and Gansu (0.035–0.05), while northeastern areas exhibit the lowest variability, below 0.035 (Figure 3c), consistent with the spatial distribution of the annual mean NDVI (Figure 3a). Regions with higher annual mean NDVI values exhibit larger standard deviations, while areas with lower NDVI values have smaller standard deviations. This indicates that regions with a higher annual mean NDVI tend to experience greater interannual fluctuations compared to those with lower NDVI values. The overall change trends of different vegetation types (Figure 3d) are generally consistent with the spatial pattern of change trends (Figure 3b), indicating that the regional mean NDVI of all forest types, except for evergreen broadleaf forests, shows a significant increasing trend. Among them, the increase is most pronounced in woody sparse grasslands and deciduous broadleaf forests, with a growth trend of 0.003 yr−1. This is followed by shrublands and mixed forests, which show an increase of 0.002 yr−1. Although the growth trend of deciduous needleleaf forests is 0.001 yr−1, it is statistically significant at the 0.95 confidence level. Overall, the mean NDVI trend across the 16 northern provinces shows an increasing trend of 0.002 yr−1.
To analyze the differences in forest vegetation changes across different seasons, the spatial distribution characteristics and changes in different seasons from 2001 to 2023 are mapped in Figure 4. The spring NDVI values of forest vegetation exhibit significant spatial variability (Figure 4a). The highest forest vegetation change is concentrated in central North China and southeastern Tibet, with NDVI values exceeding 0.55. In northeastern regions, NDVI values range approximately between 0.45 and 0.75. In contrast, forest vegetation change in western Tibet is relatively sparse and fragmented, with most NDVI values below 0.45. Over the past two decades, approximately 90% of the forest vegetation change in the study area has shown a significant increasing trend, primarily concentrated in central North China and northeastern regions. However, the increase in Tibet is less pronounced, with some areas even showing a slight decline (Figure 4a’). In summer, vegetation change in Northeast and North China is mostly above 0.8, significantly higher than in southeastern Tibet, where NDVI is below 0.55. Moreover, the increasing trend in vegetation NDVI is evident (Figure 4b,b’). In autumn, the spatial pattern is similar to that in spring, with the highest forest vegetation NDVI values concentrated in North China and southeastern Tibet, where values are mostly above 0.65, while in Northeast China, most values are below 0.65 (Figure 4c,c’). Overall, despite significant seasonal and regional differences in vegetation change, there is a general trend of increasing forest vegetation change over time.
The annual mean NDVI of different forest vegetation types exhibits substantial seasonal heterogeneity, revealing their dynamic changes and significance levels over the past two decades (Figure 5). Except for evergreen trees, the vegetation NDVI values of other forest types show a significant but slow increasing trend in spring over time (Figure 5a). Apart from evergreen broadleaf forests and shrublands, the NDVI values of other forest vegetation types have fluctuated between 0.5 and 0.7 over the years. In summer and autumn, all vegetation types generally exhibit a slow increasing trend in NDVI values over time (Figure 5b,c). The NDVI values of evergreen broadleaf and evergreen needleleaf forests show considerable fluctuations across different seasons over the years, with particularly large variations in the summer (Figure 5b). The increasing trend in the mean NDVI of broadleaf forests, mixed forests, and sparsely woody grassland areas during summer is not significant, with values fluctuating between 0.78 and 0.9 over the years. Additionally, there are significant differences in the mean NDVI of different forest vegetation types in autumn, with evergreen broadleaf forests showing the highest NDVI values, around 0.85, while shrublands exhibit the lowest NDVI values, consistently remaining around 0.3.

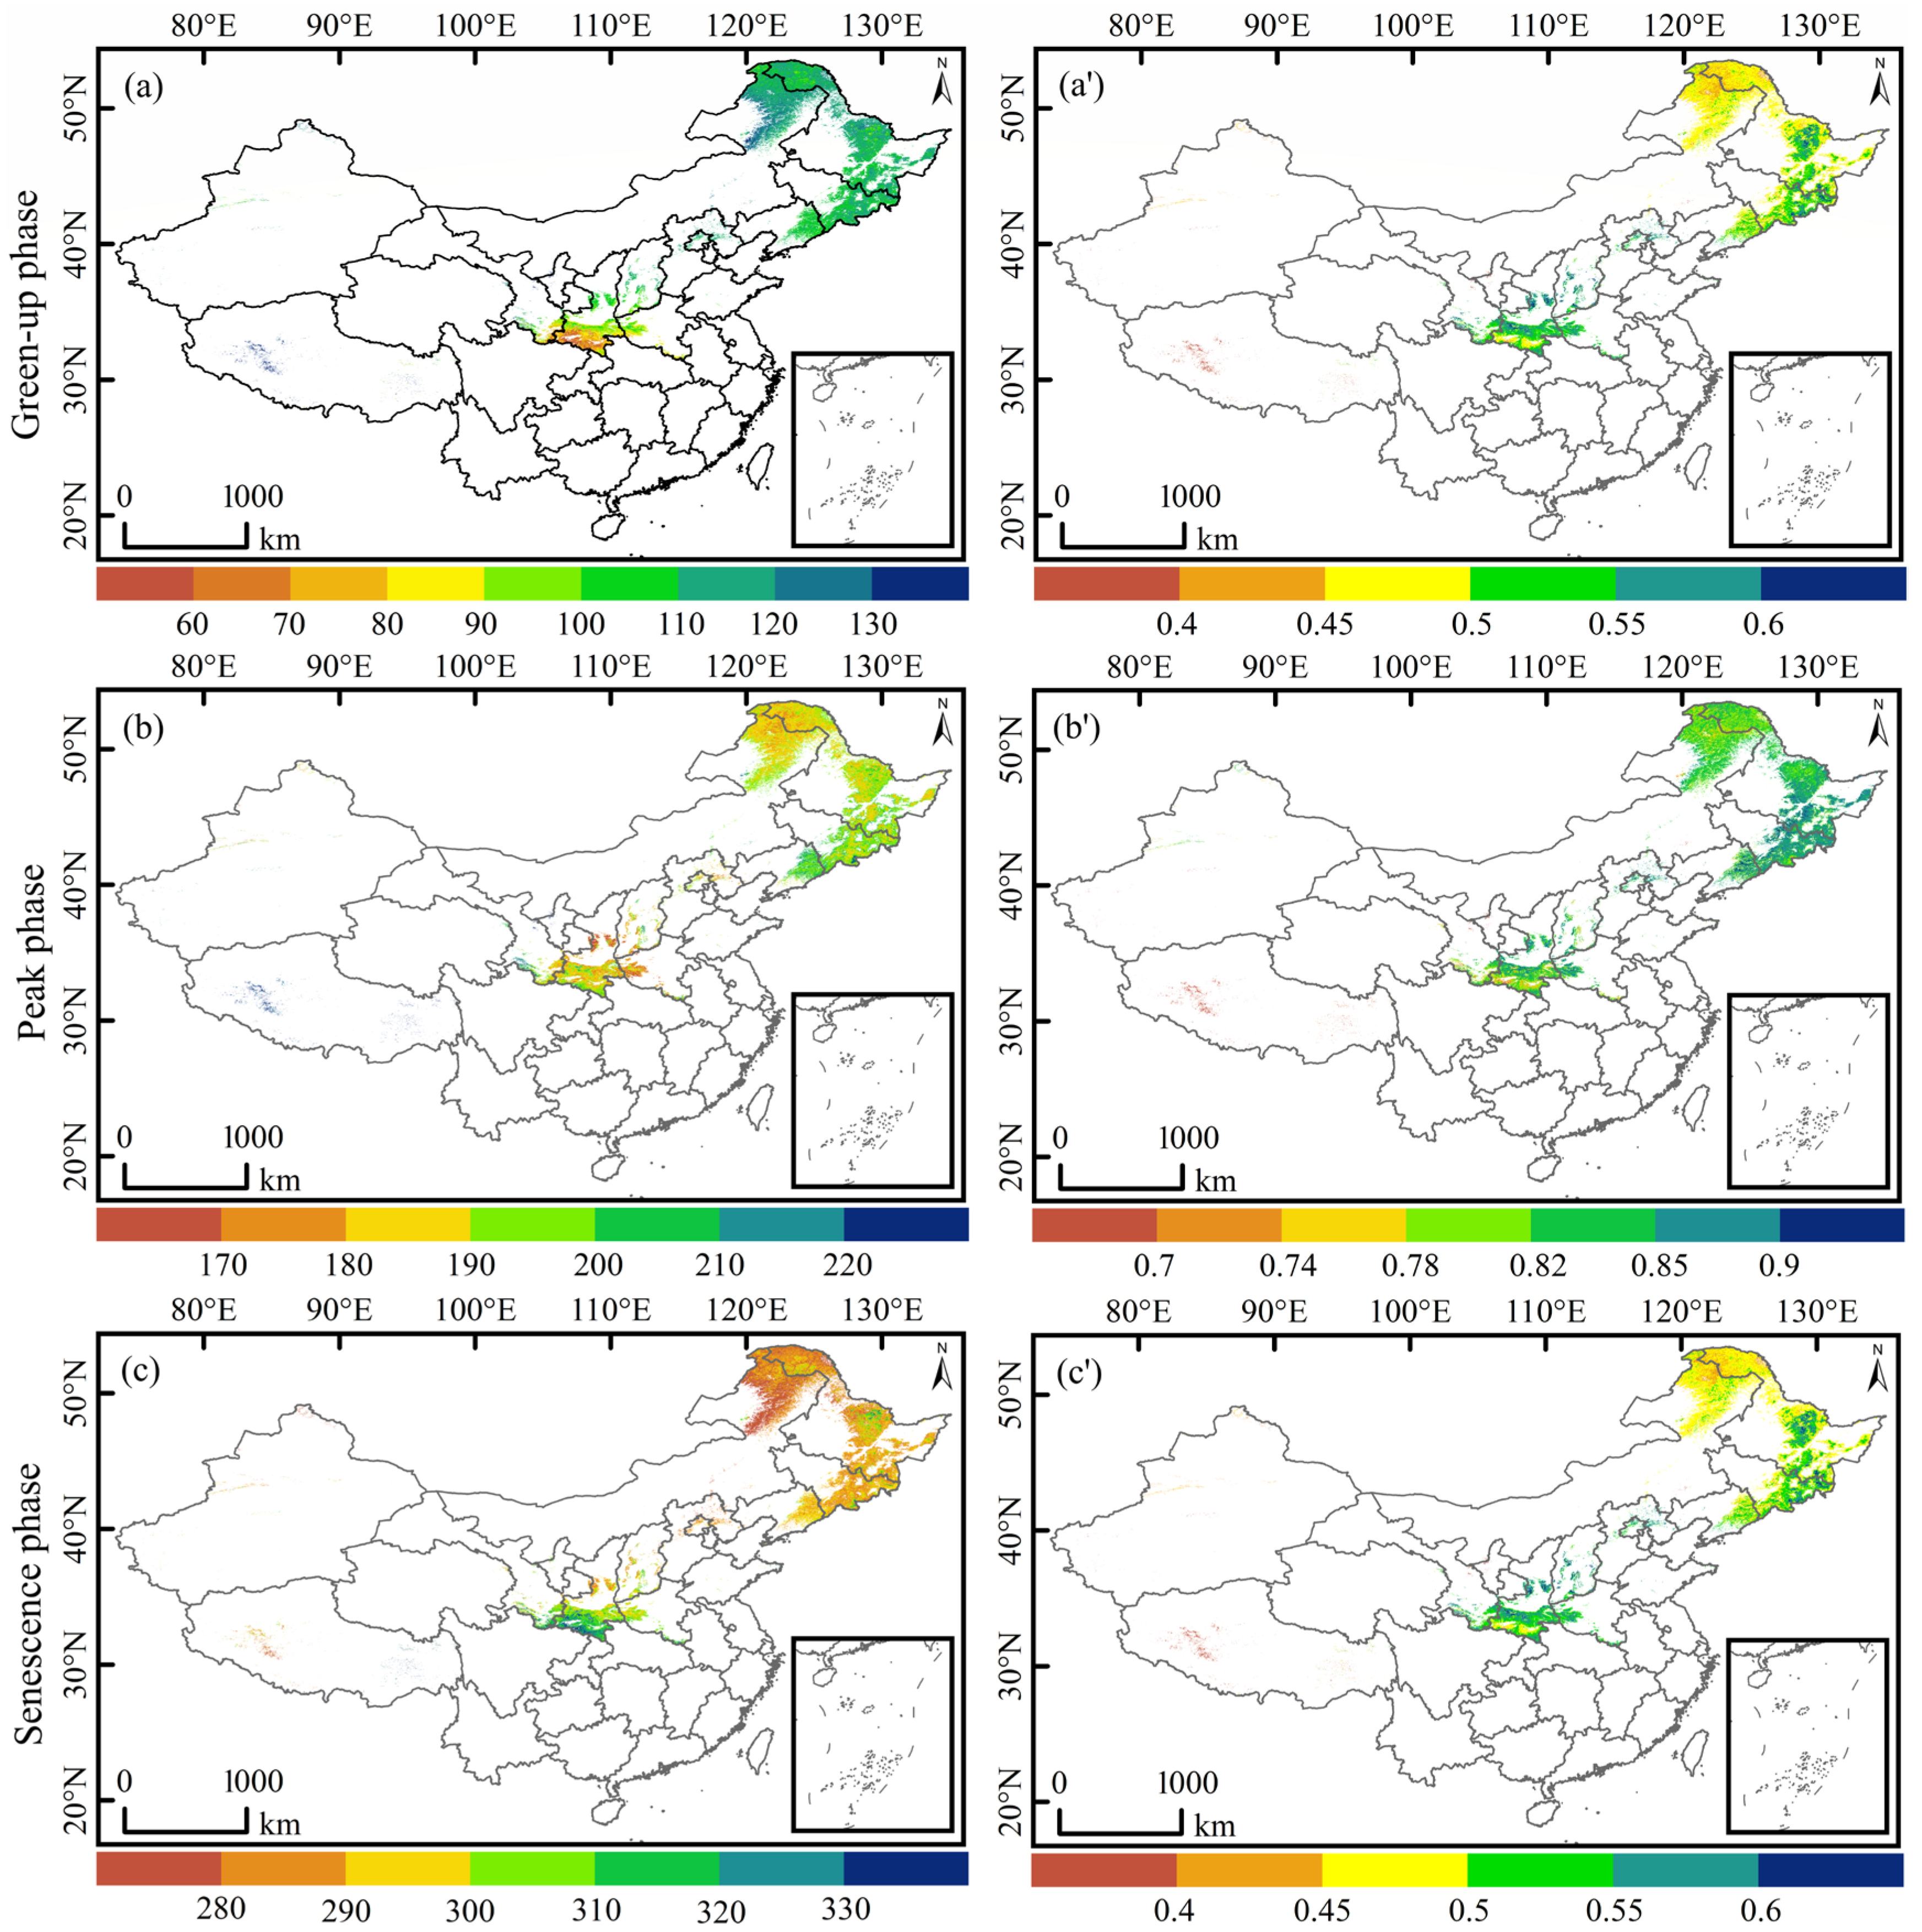
3.2. Spatiotemporal Dynamics in Forest Vegetation Phenology

The mean phenological phases and NDVI values of different forest vegetation types in Northern China exhibit significant spatial distribution differences (Figure 6). The early green-up regions are primarily concentrated in the Qinling Mountains in the central part of the study area, with an average green-up period occurring between the 70th and 100th day of the year (DOY), corresponding to mid-March to early April (Figure 6a). In other areas of North China, the green-up period generally falls between the 90th DOY and 110th DOY, spanning from late March to late April. In contrast, northeastern regions, particularly the Greater Khingan, Lesser Khingan, and Changbai Mountains, experience a later green-up period, averaging between the 110th DOY and 130th DOY, from late April to early May. Additionally, western Tibet, as well as the Tianshan and Altai Mountains in Xinjiang, exhibit the latest green-up periods, occurring after the 130th DOY. Additionally, regions with an earlier onset of green-up tend to exhibit higher NDVI values, whereas areas with a later green-up period tend to have lower corresponding NDVI values (Figure 6a’).
During the peak phase (rapid growth period), the spatial differences in forest vegetation across regions are relatively small. The relatively high NDVI values of the peak phase are mainly distributed in western China, including northwestern Xinjiang, western Tibet, and southern Gansu, typically occurring after the 210th DOY. In other regions, the peak phase is relatively similar, generally falling between the 170th DOY and 200th DOY (Figure 6b). Meanwhile, the spatial distribution of NDVI values during the peak phase also exhibits high consistency. Except for the Tibetan region, where the peak phase NDVI is below 0.74, NDVI values in most other areas fall within the range of 0.78 to 0.9 (Figure 6b’).
The spatial distribution of the senescence phase in forest vegetation exhibits an opposite pattern to that of the green-up phase (Figure 6c). Regions with a later green-up period tend to enter the senescence phase earlier, and overall, the senescence phase occurs earlier with increasing latitude. The earliest senescence phase is observed in the northeastern region, typically occurring before the 300th DOY, around late October, while other regions show relatively similar timing. Notably, the vegetation on the Qinghai–Tibet Plateau also enters the senescence phase relatively early. Additionally, the spatial distribution pattern of NDVI values during the senescence phase closely aligns with that of the green-up phase, indicating that similar or identical NDVI threshold criteria were used to define both phases (Figure 6c’).

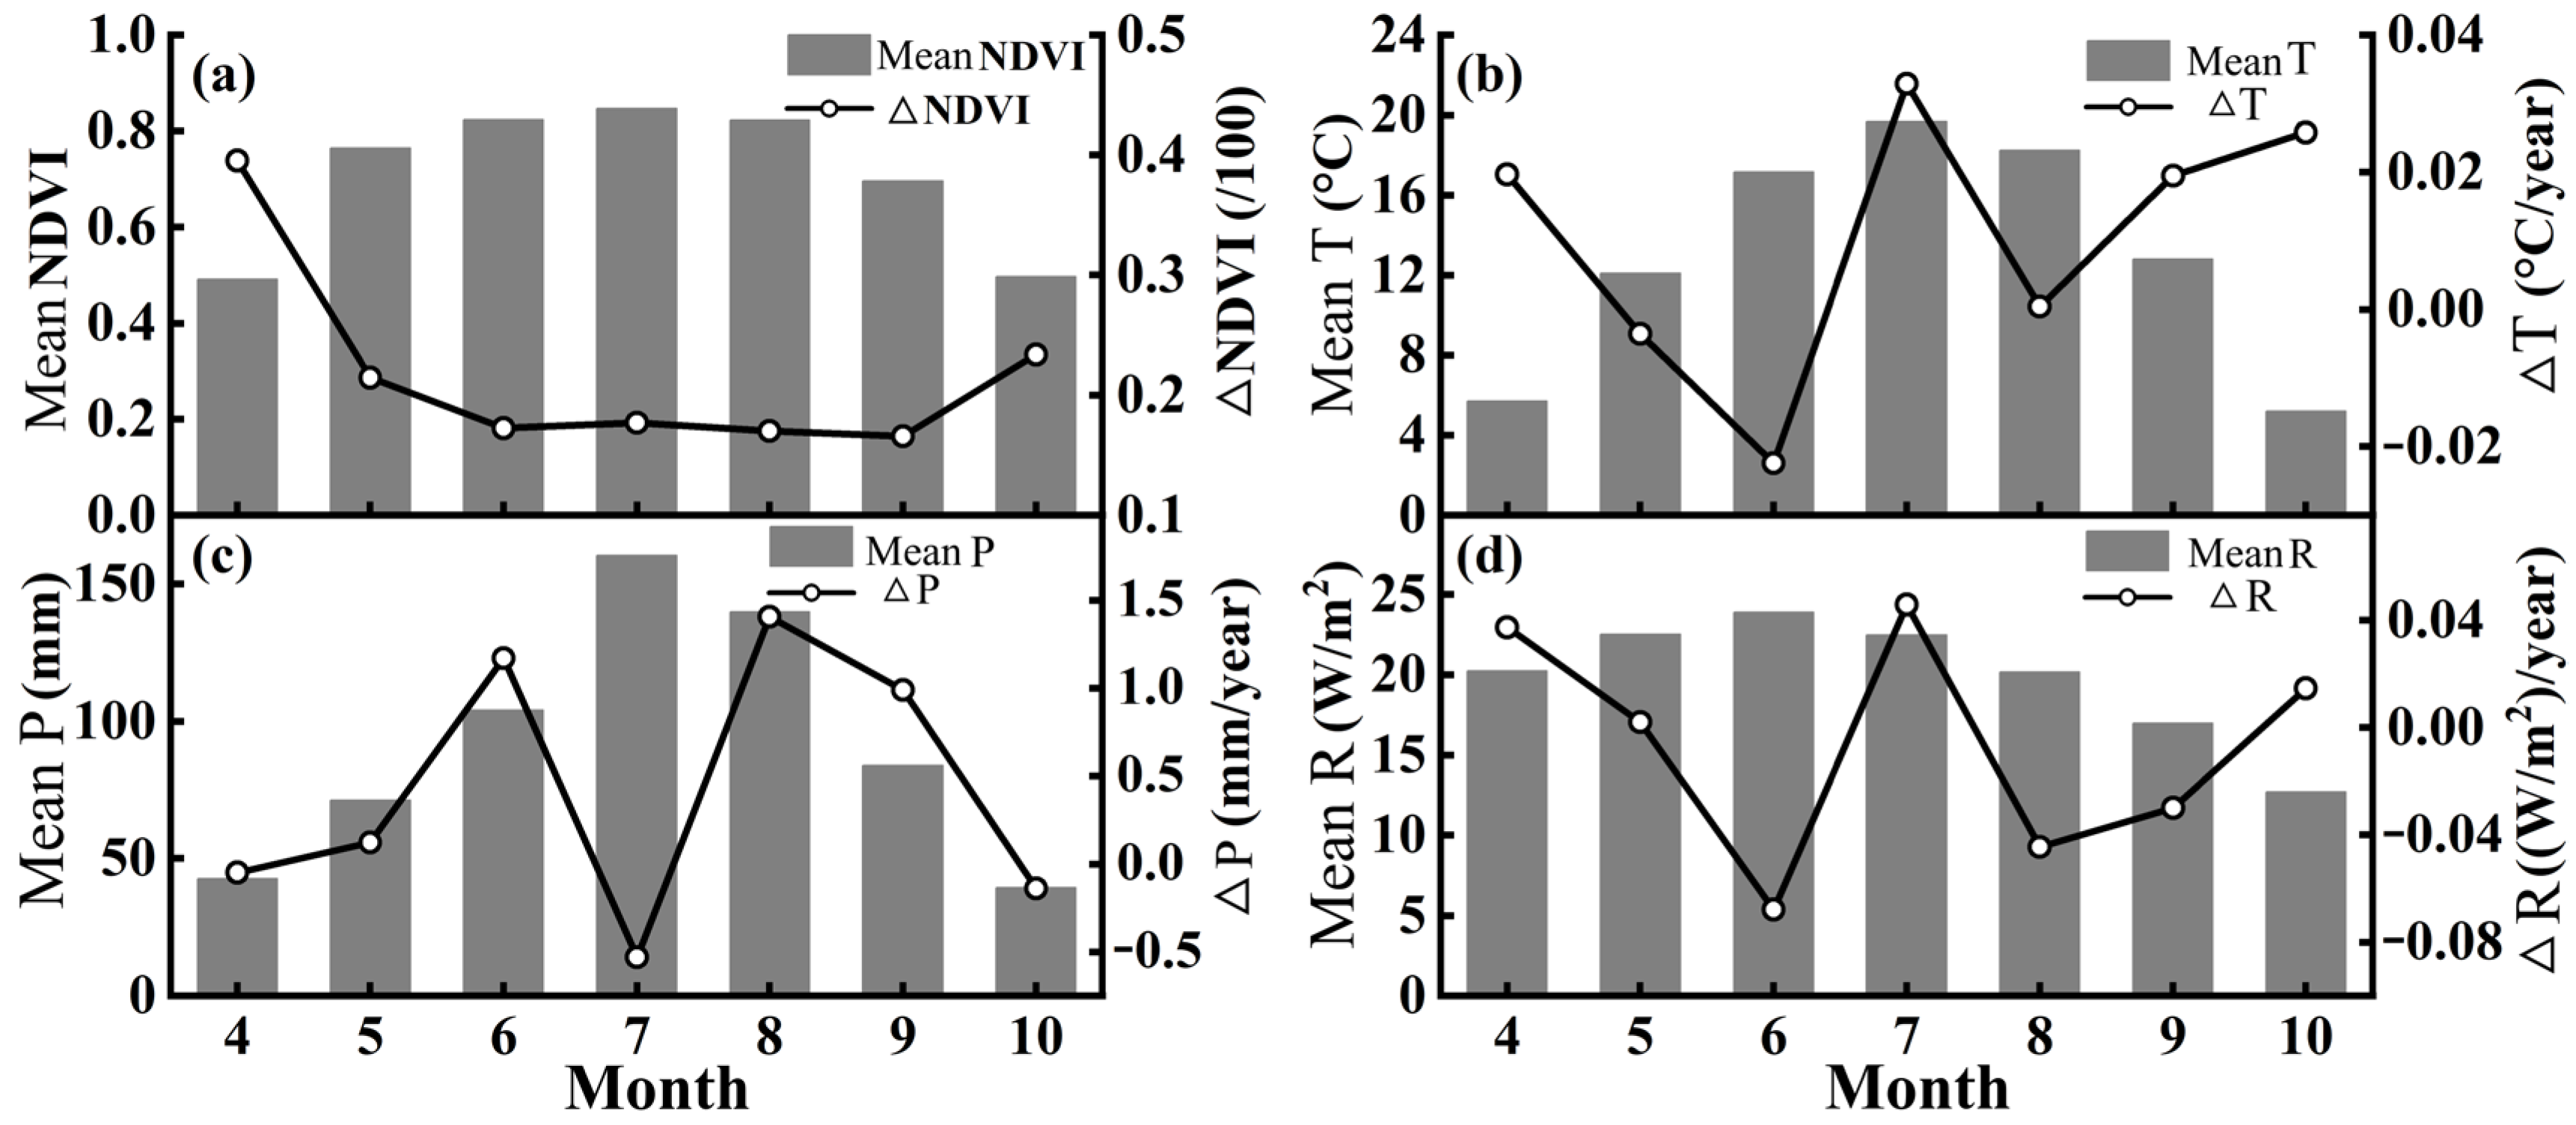
3.3. Response to Climate Change

The results of the partial correlation analysis indicate that approximately 74.8% of forest vegetation areas exhibit a positive correlation between forest vegetation change and temperature during the growing season (Figure 7a). These regions are primarily located in eastern Northeast China, northeastern Inner Mongolia, and parts of North China. In contrast, about 25.2% of the area shows a negative correlation, mainly distributed in southern Shaanxi, southeastern Tibet, and the northern Greater Khingan Mountains. The spatial distribution of the correlation between precipitation and forest vegetation change (Figure 7b) reveals that most of Northeast China and North China exhibit a positive correlation, with 64.6% of the region showing a statistically significant positive correlation. Negative correlation areas, accounting for 35.4%, are primarily located in northern Northeast China, southern Shaanxi, and southeastern Tibet. Regarding radiation, forest vegetation NDVI values in most areas are positively correlated with radiation changes, covering approximately 67.9% of the region. This positive correlation is mainly found in southeastern Tibet, most of North China, and parts of Northeast China. Conversely, negative correlation areas (32.1%) are mainly distributed in Northeast China. The correlation pattern also varies with latitude: in low-latitude regions, forest vegetation NDVI is generally positively correlated with radiation changes, whereas in high-latitude regions, a negative correlation is more common.
The mean values and change trends of NDVI, temperature, precipitation, and radiation during the growing season in northern forest vegetation are shown in Figure 8. Overall, NDVI is relatively low in April and October, reaching its peak between June and August. The NDVI trend throughout the growing season exhibits a significant upward trajectory. Temperature peaks in July, with the lowest values in April and October. Except for May and June, temperatures show an increasing trend across all other months, with a particularly significant rise in July (slope: 0.0329 yr−1, r = 0.21, p < 0.05). Similarly to seasonal temperature patterns, precipitation is highest in July and lowest in April and October. The precipitation trend indicates a significant increase in June (slope: 1.1696 yr−1, r = 0.18, p < 0.05) and August (slope: 1.4052 yr−1, r = 0.20, p < 0.05), whereas July shows a decreasing trend (slope: −0.53 yr−1, r = 0.24, p > 0.05). This inverse relationship between July precipitation and temperature suggests that forests may experience drought stress during this period. Radiation levels are highest from May to July and lowest in October. The change trend of radiation is similar to that of temperature, with significant increases in April, July, and October, while June and August exhibit significant decreases. This pattern indicates that temperature variations are primarily influenced by radiation. Overall, the mean NDVI values of forest vegetation and climatic variables during the growing season follow similar seasonal patterns.
The responses of different forest vegetation types to climatic factors during the growing season are summarized in Table 1. For evergreen broadleaf forests, the correlation between NDVI and temperature exhibits significant fluctuations. From April to August, the NDVI is predominantly negatively correlated with temperature, whereas in September, the correlation shifts to positive, reaching its peak in October (r = 0.47, p < 0.05). Precipitation shows weak overall correlations with the NDVI. In terms of radiation influence, the NDVI exhibits a consistent positive correlation across all months, with particularly significant correlations in July, September, and October. The most notable values are observed in September (r = 0.48, p < 0.05) and October (r = 0.43, p < 0.05), suggesting that enhanced radiation in autumn plays a crucial role in the growth of evergreen broadleaf forests. Evergreen needleleaf forests do not exhibit a significant correlation with temperature or precipitation; however, in September, the NDVI shows a significant positive correlation with radiation (r = 0.60, p < 0.01), indicating that increased autumn radiation plays an essential role in promoting their growth. For mixed forests, the NDVI shows a strong positive correlation with temperature in April (r = 0.50, p < 0.05) and with precipitation in September (r = 0.45, p < 0.05). However, no significant correlation is observed between NDVI and radiation levels. Shrublands exhibit a significant positive correlation between NDVI and temperature in April, August, and September, with the strongest correlation in September (r = 0.57, p < 0.01). In contrast, shrublands are highly sensitive to precipitation in July (r = 0.44, p < 0.05). Notably, reduced radiation in July appears to suppress vegetation growth (r = −0.53, p < 0.05), revealing a significant seasonal constraint on shrubland productivity. For deciduous broadleaf forests, the NDVI is positively correlated with temperature throughout the growing season, particularly in April (r = 0.75, p < 0.01) and July. Additionally, the NDVI shows significant positive correlations with both precipitation (r = 0.49, p < 0.05) and radiation (r = 0.49, p < 0.05) in these months, highlighting that spring is the most climate-sensitive period for deciduous broadleaf forests. In contrast, deciduous needleleaf forests exhibit significant positive correlations between the NDVI and temperature in May, July, August, and October, with the strongest correlation in May (r = 0.58, p < 0.01). However, no significant correlations are detected between the NDVI and either precipitation or radiation. For woody sparse grassland, the NDVI shows significant positive correlations with temperature in April, July, and September, particularly in April (r = 0.53, p < 0.05). Additionally, this vegetation type exhibits strong positive correlations with precipitation (r = 0.62, p < 0.01) and radiation (r = 0.66, p < 0.01) in April, further confirming that spring climatic conditions are essential for its growth.
Overall, different vegetation types exhibit varying degrees of sensitivity to climatic factors throughout the growing season. Notably, deciduous broadleaf forests and woody sparse grassland demonstrate particularly high sensitivity to climate variability during specific periods.

4. Discussion

4.1. Forest Vegetation Dynamics Under Climate Change

Forest vegetation change is an important indicator for maintaining ecological balance, quantifying and monitoring spatiotemporal dynamics, and analyzing vegetation responses to climate change. Quantifying the spatiotemporal dynamics of forest vegetation over time has gained increasing attention from forestry researchers in the past two decades [38,39,40,41,42]. Long-term MODIS NDVI datasets have comprehensively recorded forest vegetation change across different periods, providing essential data support for analyzing the spatiotemporal dynamics of forest vegetation. In this study, we utilized the time-series MODIS NDVI dataset from 2001 to 2023, combined with meteorological and temporal data, to quantify the spatiotemporal dynamics of forest vegetation in Northern China. Except for Tibet and Xinjiang, the annual mean NDVI generally exhibited a gradual increasing trend (Figure 3b), primarily concentrated in the North China region, including Gansu and Shaanxi, as well as in northeastern China. This increase indicates that afforestation efforts and natural forest conservation measures have contributed to the expansion of forest vegetation coverage in Northern China, which is consistent with the findings of Bai et al. [43], Qiu et al. [44], and Zhao et al. [32]. The mean NDVI values in southeastern Tibet are higher than in other regions (Figure 3a), but the change trend of NDVI is not significant, primarily because this area is dominated by evergreen coniferous forests. Notably, the standard deviation of NDVI in southeastern Tibet is significantly higher than in other regions (Figure 3c), which can be attributed to the region’s complex topography, high elevation, variable climate, strong winds, snow and rainfall erosion, and fluctuations in solar radiation contributing to irregular vegetation growth, resulting in greater NDVI variability [45,46]. Additionally, the standard deviation of NDVI in southern Shaanxi is also relatively high, which may be associated with human activities and land-use practices.
The observed seasonal heterogeneity in NDVI and its relationship with temperature, precipitation, and radiation highlight the complex interplay between climatic drivers and forest vegetation dynamics. The pronounced spatial and temporal variability in NDVI aligns with seasonal shifts in climatic conditions, consistent with Dang et al. [47] study emphasizing the critical role of temperature and water availability in regulating vegetation productivity at mid-to-high latitudes. Warmer spring temperatures accelerate snowmelt and soil thaw, promoting earlier leaf-out and photosynthetic activity, particularly in deciduous-dominated regions of North China and the northeastern zone [48,49]. However, the muted NDVI response in western Tibet suggests limitations imposed by low precipitation and radiation-induced aridity, corroborating findings that alpine ecosystems are highly sensitive to moisture deficits [50]. Summer NDVI peaks (June–August) coincide with optimal temperature and precipitation levels, yet the divergence between Northeastern China (NDVI > 0.8) and southeastern Tibet (NDVI < 0.55) underscores regional hydrothermal imbalances. The strong positive correlation between the NDVI and precipitation in Northeast China aligns have been observed, demonstrating that adequate rainfall during growing season is crucial for maintain forest vegetation growth (Figure 4b and Figure 7b). Conversely, the negative NDVI-precipitation correlation in southeastern Tibet may reflect waterlogging stress or cloud cover-induced radiation limitations during heavy rainfall events. The spatial distribution of NDVI in autumn exhibits a significant latitudinal pattern, with temperature and precipitation—both strongly correlated with latitude—playing a major role in influencing vegetation growth [51]. Regions with higher NDVI values are typically located at lower latitudes, where a warm and humid climate favors vegetation growth. In contrast, areas with lower NDVI values are predominantly found at higher latitudes, where cold and dry climatic conditions are less conducive to vegetation development.
Xiao et al. [52] utilized multi-temporal SPOT-4 VEGETATION data to distinguish different forest growth patterns based on NDVI variations among different forest types. The forest vegetation dynamics observed in this study are consistent with their findings, further confirming the distinct growth patterns across various forest vegetation types. Evergreen broadleaf forests display considerable NDVI fluctuations across seasons, particularly in summer, suggesting that their growth is influenced by multiple climatic drivers (Figure 5). Additionally, their NDVI values are higher in spring and autumn than in summer, with partial correlation analysis showing significant associations with temperature and radiation in September and October (Table 1), which indicates that their peak growing season occurs primarily in spring and early autumn, with growth being strongly influenced by temperature and radiation [53]. This finding is consistent with the study by Griebel et al. [54], which reported that canopy expansion mainly takes place in late summer and early autumn. Similarly, the NDVI values of evergreen coniferous forests tend to be higher in autumn than in spring and summer, with a strong correlation between the NDVI and radiation observed in September, indicating that their peak growing season is concentrated in late summer and early autumn. The peak growing season for other forest vegetation types is primarily concentrated in summer.

4.2. Forest Vegetation Phenological Dynamics Under Climate Change

In addition to the spatiotemporal dynamic relationship between forest vegetation and climatic factors, the spatiotemporal dynamic relationship between forest phenology and climatic factors was also further analyzed in this study. The spatial distribution characteristics of forest phenology in Northern China exhibit significant variations among different forest types, reflecting the combined influences of latitude, altitude, and regional climatic conditions. The Qinling Mountains’ central region experiences the earliest green-up period (70th–100th DOY) due to relatively mild climatic conditions and sufficient early spring warming (Figure 6a). In contrast, the green-up period in northeastern China, particularly in the Greater Khingan, Lesser Khingan, and Changbai Mountains, occurs later (110th–130th DOY) due to lower temperatures and prolonged winter conditions that suppress the onset of vegetation growth. This finding is consistent with previous studies by Zhao et al. (110th–150th DOY) [55] and Zheng et al. (105th–140th DOY) [32]. Moreover, in Tibet and Xinjiang, the green-up period is the latest (>130th DOY), primarily due to high-altitude effects, including lower temperatures and extended snow cover duration, which delay vegetation growth. Additionally, the observed negative correlation between green-up timing and NDVI values indicates that regions with later green-up tend to exhibit lower vegetation productivity. This pattern aligns with previous research on temperature-dependent growth constraints in high-latitude and high-altitude ecosystems, further highlighting the dominant role of climatic limitations in shaping forest phenology across Northern China [43,45,46,56].
Compared to the green-up period, the peak growing season in western China (including northwestern Xinjiang, western Tibet, and southern Gansu) is slightly delayed (around 210th DOY). This delay is likely due to lower early-season temperatures and water supply limitations, which postpone optimal growing conditions. Furthermore, the spatial consistency of NDVI values during the peak growing season (with most regions exhibiting NDVI values between 0.78 and 0.9, while Tibet and Xinjiang show lower values < 0.74) further supports the notion that high-altitude regions experience growth constraints due to environmental stressors such as low temperatures, shorter growing seasons, and water limitations.
Compared to the green-up period, regions with a later green-up tend to enter senescence earlier. This latitudinal pattern, where high-latitude regions (e.g., northeastern China) experience earlier senescence (before 300th DOY, i.e., late October), aligns with the well-established relationship between temperature and phenological cycles in boreal and temperate forests [32,47,49,53,57]. The earlier onset of senescence on the Qinghai–Tibet Plateau further indicates that extreme environmental conditions, including low temperatures and seasonal drought stress, accelerate vegetation dormancy. These findings collectively highlight the critical role of temperature and climatic constraints in regulating forest phenology in Northern China, supporting previous studies that emphasize the sensitivity of phenological cycles to climate change [32,47,49,55].

5. Conclusions

In this study, we assessed the spatiotemporal dynamics of forest vegetation in Northern China and their responses to climate variables using time-series MODIS NDVI data from 2001 to 2023. The NDVI data of forest vegetation and its variation were extracted and analyzed to assess changes across different regions and forest types, as well as to evaluate their correlations with meteorological factors. The results indicate that the annual mean NDVI exhibits a spatial distribution pattern that gradually decreases from south to north, showing a significant correlation with latitude. This trend is likely influenced by the latitudinal variations in natural factors such as climate, soil, and topography, which collectively affect vegetation growth. Different forest vegetation types exhibit significant spatial heterogeneity in NDVI values across seasons; however, the overall trend shows a gradual increase over time (year). Additionally, the timing of forest vegetation phenology is closely related to vegetation type and geographical location. The earliest green-up periods are mainly concentrated in the Qinling region of central North China, whereas the latest occur in the Tibetan Plateau and Xinjiang regions. The spatial distribution of NDVI values during the green-up and senescence phases is highly consistent, whereas the spatial pattern of phenological timing exhibits the opposite phenomenon. Finally, partial correlation analysis reveals significant differences in the sensitivity of different forest vegetation types to meteorological factors across regions. This study contributes to a deeper understanding of the spatiotemporal dynamics of forest vegetation change and its complex interactions with climate change, offering valuable insights for forest ecosystem management and climate adaptation of forest vegetation.

Author Contributions

Conceptualization, E.M.; methodology, E.M. and Z.F.; validation, E.M.; formal analysis, E.M. and P.C.; investigation, E.M.; resources, E.M.; data curation, E.M.; writing—original draft preparation, E.M.; writing—review and editing, E.M., L.W. and P.C.; supervision, Z.F.; project administration, E.M.; funding acquisition, Z.F. All authors have read and agreed to the published version of the manuscript.

Funding

This study was supported by National Innovation Park for Forestry and Grass Equipment (2024YG13), Engineering Research & Innovation Team Project of Beijing Forestry University (BLRC2023A03) and the Natural Science Foundation of Beijing (8232038, 8234065), National Natural Science Foundation of China (42330507) and the Key Research and Development Projects of Ningxia Hui Autonomous Region (2023BEG02050).

Data Availability Statement

The data are free to download from http://ladsweb.nascom.nasa.gov, accessed on 20 October 2024.

Conflicts of Interest

Author Panpan Chen was employed by China International Engineering Consulting Corporation. The remaining authors declare that the research was conducted in the absence of any commercial or financial relationships that could be construed as a potential conflict of interest.

References

  1. Zhai, J.J.; Wang, L.; Liu, Y.; Wang, C.Y.; Mao, X.G. Assessing the effects of China’s Three-North Shelter Forest Program over 40 years. Sci. Total Environ. 2023, 857, 159354. [Google Scholar] [CrossRef] [PubMed]
  2. Huang, C.; Li, S.; He, H.S.; Liang, Y.; Xu, W.R.; Wu, M.M.; Wu, Z.W.; Huang, C.; Chen, F.S. Effects of forest management practices on carbon dynamics of China’s boreal forests under changing climates. J. Environ. Manag. 2023, 335, 117497. [Google Scholar] [CrossRef] [PubMed]
  3. Liu, Y.; Trancoso, R.; Ma, Q.; Ciais, P.; Gouve, L.P.; Yue, C.F.; Assis, J.; Blanco, J.A. Carbon density in boreal forests responds non-linearly to temperature: An example from the Greater Khingan Mountains, northeast China. Agric. For. Meteorol. 2023, 338, 109519. [Google Scholar] [CrossRef]
  4. Wang, L.; Zhu, Q.A.; Zhang, J.; Liu, J.; Zhu, C.F.; Qu, L.S. Vegetation dynamics alter the hydrological interconnections between upper and mid-lower reaches of the Yellow River Basin, China. Ecol. Indic. 2023, 148, 110083. [Google Scholar] [CrossRef]
  5. Zhao, G.L.; Tian, S.M.; Liang, S.; Jing, Y.C.; Chen, R.X.; Wang, W.W.; Han, B. Dynamic evolution trend and driving mechanisms of water conservation in the Yellow River Basin, China. Sci. Rep. 2024, 14, 26304. [Google Scholar] [CrossRef]
  6. Wei, X.X.; Liu, R.G.; Liu, Y.; He, J.Y.; Chen, J.L.; Qi, L.; Zhou, Y.L.; Qin, Y.W.; Wu, C.Y.; Dong, J.W.; et al. Forest Areas in China Are Recovering Since the 21st Century. Geophys. Res. Lett. 2024, 51, e2024GL110312. [Google Scholar] [CrossRef]
  7. Pan, Y.D.; Birdsey, R.A.; Fang, J.Y.; Houghton, R.; Kauppi, P.E.; Kurz, W.A.; Phillips, O.L.; Shvidenko, A.; Lewis, S.L.; Canadell, J.G.; et al. A Large and Persistent Carbon Sink in the World’s Forests. Science 2011, 333, 988–993. [Google Scholar] [CrossRef]
  8. Ellison, D.; Futter, M.N.; Bishop, K. On the forest cover-water yield debate: From demand- to supply-side thinking. Glob. Change Biol. 2012, 18, 806–820. [Google Scholar] [CrossRef]
  9. Pimm, S.L.; Jenkins, C.N.; Abell, R.; Brooks, T.M.; Gittleman, J.L.; Joppa, L.N.; Raven, P.H.; Roberts, C.M.; Sexton, J.O. The biodiversity of species and their rates of extinction, distribution, and protection. Science 2014, 344, 1246752. [Google Scholar] [CrossRef]
  10. Piao, S.L.; Liu, Q.; Chen, A.P.; Janssens, I.A.; Fu, Y.S.; Dai, J.H.; Liu, L.L.; Lian, X.; Shen, M.G.; Zhu, X.L. Plant phenology and global climate change: Current progresses and challenges. Glob. Change Biol. 2019, 25, 1922–1940. [Google Scholar] [CrossRef]
  11. Visser, M.E.; Both, C. Shifts in phenology due to global climate change: The need for a yardstick. Proc. R. Soc. B-Biol. Sci. 2005, 272, 2561–2569. [Google Scholar] [CrossRef] [PubMed]
  12. Mbow, H.-O.P.; Reisinger, A.; Canadell, J.; O’Brien, P. Special Report on Climate Change, Desertification, Land Degradation, Sustainable Land Management, Food Security, and Greenhouse Gas Fluxes in Terrestrial Ecosystems (SR2); IPCC: Ginevra, Switzerland, 2017. [Google Scholar]
  13. Avitabile, V.; Camia, A. An assessment of forest biomass maps in Europe using harmonized national statistics and inventory plots. Forest Ecol. Manag. 2018, 409, 489–498. [Google Scholar] [CrossRef] [PubMed]
  14. Seidl, R.; Schelhaas, M.J.; Rammer, W.; Verkerk, P.J. Increasing forest disturbances in Europe and their impact on carbon storage. Nat. Clim. Change 2014, 4, 806–810. [Google Scholar] [CrossRef]
  15. Fassnacht, F.E.; Hartig, F.; Latifi, H.; Berger, C.; Hernández, J.; Corvalán, P.; Koch, B. Importance of sample size, data type and prediction method for remote sensing-based estimations of aboveground forest biomass. Remote Sens. Environ. 2014, 154, 102–114. [Google Scholar] [CrossRef]
  16. Myneni, R.B.; Keeling, C.D.; Tucker, C.J.; Asrar, G.; Nemani, R.R. Increased plant growth in the northern high latitudes from 1981 to 1991. Nature 1997, 386, 698–702. [Google Scholar] [CrossRef]
  17. Tucker, C.J.; Townshend, J.R.G.; Goff, T.E. African Land-Cover Classification Using Satellite Data. Science 1985, 227, 369–375. [Google Scholar] [CrossRef]
  18. Justice, C.O.; Townshend, J.R.G.; Holben, B.N.; Tucker, C.J. Analysis of the Phenology of Global Vegetation Using Meteorological Satellite Data. Int. J. Remote Sens. 1985, 6, 1271–1318. [Google Scholar] [CrossRef]
  19. Hansen, M.; Potapov, P.; Margono, B.; Stehman, S.; Turubanova, S.; Tyukavina, A. Response to comment on “High-resolution global maps of 21st-century forest cover change”. Science 2014, 344, 981. [Google Scholar] [CrossRef]
  20. Vermote, E.F.; El Saleous, N.Z.; Justice, C.O. Atmospheric correction of MODIS data in the visible to middle infrared: First results. Remote Sens. Environ. 2002, 83, 97–111. [Google Scholar] [CrossRef]
  21. Reiche, J.; Verbesselt, J.; Hoekman, D.; Herold, M. Fusing Landsat and SAR time series to detect deforestation in the tropics. Remote Sens. Environ. 2015, 156, 276–293. [Google Scholar] [CrossRef]
  22. Aziz, G.; Minallah, N.; Saeed, A.; Frnda, J.; Khan, W. Remote sensing based forest cover classification using machine learning. Sci. Rep. 2024, 14, 69. [Google Scholar] [CrossRef] [PubMed]
  23. Zhang, X.Y.; Friedl, M.A.; Schaaf, C.B.; Strahler, A.H.; Hodges, J.C.F.; Gao, F.; Reed, B.C.; Huete, A. Monitoring vegetation phenology using MODIS. Remote Sens. Environ. 2003, 84, 471–475. [Google Scholar] [CrossRef]
  24. Defries, R.S.; Townshend, J.R.G. Ndvi-Derived Land-Cover Classifications at a Global-Scale. Int. J. Remote Sens. 1994, 15, 3567–3586. [Google Scholar] [CrossRef]
  25. Hartoyo, A.P.P.; Sunkar, A.; Ramadani, R.; Faluthi, S.; Hidayati, S. Normalized difference vegetation index (NDVI) analysis for vegetation cover in Leuser Ecosystem Area, Sumatra, Indonesia. Biodivers. J. Biol. Divers. 2021, 22, 1160–1171. [Google Scholar] [CrossRef]
  26. Jia, K.; Liang, S.L.; Zhang, L.; Wei, X.Q.; Yao, Y.J.; Xie, X.H. Forest cover classification using Landsat ETM plus data and time series MODIS NDVI data. Int. J. Appl. Earth Obs. 2014, 33, 32–38. [Google Scholar] [CrossRef]
  27. Ma, N.; Cao, S.S.; Bai, T.; Yang, Z.H.; Cai, Z.Z.; Sun, W. Assessment of Vegetation Dynamics in Xinjiang Using NDVI Data and Machine Learning Models from 2000 to 2023. Sustainability 2025, 17, 306. [Google Scholar] [CrossRef]
  28. Hmimina, G.; Dufrêne, E.; Pontailler, J.Y.; Delpierre, N.; Aubinet, M.; Caquet, B.; de Grandcourt, A.; Burban, B.; Flechard, C.; Granier, A.; et al. Evaluation of the potential of MODIS satellite data to predict vegetation phenology in different biomes: An investigation using ground-based NDVI measurements. Remote Sens. Environ. 2013, 132, 145–158. [Google Scholar] [CrossRef]
  29. Pan, Z.K.; Huang, J.F.; Zhou, Q.B.; Wang, L.M.; Cheng, Y.X.; Zhang, H.K.; Blackburn, G.A.; Yan, J.; Liu, J.H. Mapping crop phenology using NDVI time-series derived from HJ-1 A/B data. Int. J. Appl. Earth Obs. 2015, 34, 188–197. [Google Scholar] [CrossRef]
  30. Verhegghen, A.; Bontemps, S.; Defourny, P. A global NDVI and EVI reference data set for land-surface phenology using 13 years of daily SPOT-VEGETATION observations. Int. J. Remote Sens. 2014, 35, 2440–2471. [Google Scholar] [CrossRef]
  31. Wu, C.Y.; Peng, D.L.; Soudani, K.; Siebicke, L.; Gough, C.M.; Arain, M.A.; Bohrer, G.; Lafleur, P.M.; Peichl, M.; Gonsamo, A.; et al. Land surface phenology derived from normalized difference vegetation index (NDVI) at global FLUXNET sites. Agric. For. Meteorol. 2017, 233, 171–182. [Google Scholar] [CrossRef]
  32. Zheng, W.R.; Liu, Y.Q.; Yang, X.G.; Fan, W.Y. Spatiotemporal Variations of Forest Vegetation Phenology and Its Response to Climate Change in Northeast China. Remote Sens. 2022, 14, 2909. [Google Scholar] [CrossRef]
  33. Peng, S.Z.; Ding, Y.X.; Liu, W.Z.; Li, Z. 1 km monthly temperature and precipitation dataset for China from 1901 to 2017. Earth Syst. Sci. Data 2019, 11, 1931–1946. [Google Scholar] [CrossRef]
  34. White, K.; Pontius, J.; Schaberg, P. Remote sensing of spring phenology in northeastern forests: A comparison of methods, field metrics and sources of uncertainty. Remote Sens. Environ. 2014, 148, 97–107. [Google Scholar] [CrossRef]
  35. Liu, R.G.; Shang, R.; Liu, Y.; Lu, X.L. Global evaluation of gap-filling approaches for seasonal NDVI with considering vegetation growth trajectory, protection of key point, noise resistance and curve stability. Remote Sens. Environ. 2017, 189, 164–179. [Google Scholar] [CrossRef]
  36. He, X.R.; Zhang, L.Q.; Lu, Y.H.; Chai, L.H. Spatiotemporal Variations of Vegetation and Its Response to Climate Change and Human Activities in Arid Areas—A Case Study of the Shule River Basin, Northwestern China. Forests 2024, 15, 1147. [Google Scholar] [CrossRef]
  37. Zhang, D.J.; Ge, W.Y.; Zhang, Y. Evaluating the vegetation restoration sustainability of ecological projects: A case study of Wuqi County in China. J. Clean. Prod. 2020, 264, 121751. [Google Scholar] [CrossRef]
  38. Huo, H.; Sun, C.P. Spatiotemporal variation and influencing factors of vegetation dynamics based on Geodetector: A case study of the northwestern Yunnan Plateau, China. Ecol. Indic. 2021, 130, 108005. [Google Scholar] [CrossRef]
  39. Alemayehu, B.; Suarez-Minguez, J.; Rosette, J. Plantation forests driven spatiotemporal vegetation trends and its interplay with climate variables in the Northwestern Highlands of Ethiopia. Int. J. Appl. Earth Obs. 2025, 137, 104411. [Google Scholar] [CrossRef]
  40. Estoque, R.C.; Dasgupta, R.; Winkler, K.; Avitabile, V.; Johnson, B.A.; Myint, S.W.; Gao, Y.; Ooba, M.; Murayama, Y.; Lasco, R.D. Spatiotemporal pattern of global forest change over the past 60 years and the forest transition theory. Environ. Res. Lett. 2022, 17, 084022. [Google Scholar] [CrossRef]
  41. Fu, W.X.; Tian, L.; Tao, Y.; Li, M.Y.; Guo, H.D. Spatiotemporal changes in the boreal forest in Siberia over the period 1985-2015 against the background of climate change. Earth Syst. Dynam. 2023, 14, 223–239. [Google Scholar] [CrossRef]
  42. Wahelo, T.T.; Mengistu, D.A.; Merawi, T.M. Spatiotemporal trends and drivers of forest cover change in Metekel Zone forest areas, Northwest Ethiopia. Environ. Monit. Assess. 2024, 196, 1170. [Google Scholar] [CrossRef] [PubMed]
  43. Bai, R.H.; Wang, X.Z.; Li, J.W.; Yang, F.; Shangguan, Z.P.; Deng, L. The impact of vegetation reconstruction on soil erosion in the Loess plateau. J. Environ. Manag. 2024, 363, 121382. [Google Scholar] [CrossRef]
  44. Qiu, B.W.; Chen, G.; Tang, Z.H.; Lu, D.F.; Wang, Z.Z.; Chen, C.C. Assessing the Three-North Shelter Forest Program in China by a novel framework for characterizing vegetation changes. ISPRS J. Photogramm. 2017, 133, 75–88. [Google Scholar] [CrossRef]
  45. Jiang, F.G.; Deng, M.L.; Long, Y.; Sun, H. Spatial Pattern and Dynamic Change of Vegetation Greenness From 2001 to 2020 in Tibet, China. Front. Plant Sci. 2022, 13, 892625. [Google Scholar] [CrossRef]
  46. Li, P.L.; Zhu, D.; Wang, Y.L.; Liu, D. Elevation dependence of drought legacy effects on vegetation greenness over the Tibetan Plateau. Agric. For. Meteorol. 2020, 295, 108190. [Google Scholar] [CrossRef]
  47. Dang, C.Y.; Shao, Z.F.; Huang, X.; Zhuang, Q.W.; Cheng, G.; Qian, J.X. Climate warming-induced phenology changes dominate vegetation productivity in Northern Hemisphere ecosystems. Ecol. Indic. 2023, 151, 110326. [Google Scholar] [CrossRef]
  48. Pulliainen, J.; Aurela, M.; Laurila, T.; Aalto, T.; Takala, M.; Salminen, M.; Kulmala, M.; Barr, A.; Heimann, M.; Lindroth, A.; et al. Early snowmelt significantly enhances boreal springtime carbon uptake. Proc. Natl. Acad. Sci. USA 2017, 114, 11081–11086. [Google Scholar] [CrossRef]
  49. Gu, H.S.; Qiao, Y.X.; Xi, Z.X.; Rossi, S.; Smith, N.G.; Liu, J.Q.; Chen, L. Warming-induced increase in carbon uptake is linked to earlier spring phenology in temperate and boreal forests. Nat. Commun. 2022, 13, 3698. [Google Scholar] [CrossRef]
  50. Zhang, T.; Shan, B.; Xu, M.; Zhao, G.; Zheng, Z.; Tang, Y.; Chen, N.; Zhu, J.; Cong, N.; Niu, B.; et al. Soil moisture alters the responses of alpine ecosystem productivity to environmental factors, especially VPD, on the Qinghai-Tibetan Plateau. Sci. Total Environ. 2024, 947, 174518. [Google Scholar] [CrossRef]
  51. Jia, Q.; Gao, X.T.; Jiang, Z.L.; Li, H.X.; Guo, J.P.; Lu, X.Y.; Li, F.Y. Sensitivity of temperate vegetation to precipitation is higher in steppes than in deserts and forests. Ecol. Indic. 2024, 166, 112317. [Google Scholar] [CrossRef]
  52. Xiao, X.M.; Boles, S.; Liu, J.Y.; Zhuang, D.F.; Liu, M.L. Characterization of forest types in Northeastern China, using multi-temporal SPOT-4 VEGETATION sensor data. Remote Sens. Environ. 2002, 82, 335–348. [Google Scholar] [CrossRef]
  53. Chen, J.H.; Wang, S.Q.; Shi, H.; Chen, B.; Wang, J.B.; Zheng, C.; Zhu, K. Radiation and temperature dominate the spatiotemporal variability in resilience of subtropical evergreen forests in China. Front. Glob. Change 2023, 6, 1166481. [Google Scholar] [CrossRef]
  54. Griebel, A.; Bennett, L.T.; Arndt, S.K. Evergreen and ever growing—Stem and canopy growth dynamics of a temperate eucalypt forest. Forest Ecol. Manag. 2017, 389, 417–426. [Google Scholar] [CrossRef]
  55. Zhao, J.J.; Wang, Y.Y.; Zhang, Z.X.; Zhang, H.Y.; Guo, X.Y.; Yu, S.; Du, W.L.; Huang, F. The Variations of Land Surface Phenology in Northeast China and Its Responses to Climate Change from 1982 to 2013. Remote Sens. 2016, 8, 400. [Google Scholar] [CrossRef]
  56. Tao, J.; Zhang, Y.J.; Zhu, J.T.; Jiang, Y.B.; Zhang, X.Z.; Zhang, T.; Xi, Y. Elevation-dependent temperature change in the Qinghai-Xizang Plateau grassland during the past decade. Theor. Appl. Climatol. 2014, 117, 61–71. [Google Scholar] [CrossRef]
  57. Ols, C.; Kålås, I.H.; Drobyshev, I.; Söderström, L.; Hofgaard, A. Spatiotemporal variation in the relationship between boreal forest productivity proxies and climate data. Dendrochronologia 2019, 58, 125648. [Google Scholar] [CrossRef]
Figure 1. Geographical location of the study area and distribution characteristics of forest types (the small inset area in the bottom-left subfigure represents the South China Sea Islands).
Forests 16 00671 g001
Figure 2. Schematic diagram of forest green-up phase and senescence phase determination using a four-parameter double logistic function.
Forests 16 00671 g002
Figure 3. Forest vegetation changes in Northern China from 2001 to 2023. (a) spatial distribution characteristics of growing season mean NDVI; (b,c) represent the changing trend and standard deviation of the growing season mean NDVI, respectively; (d) temporal dynamics of vegetation NDVI values for different forest types.
Forests 16 00671 g003
Figure 4. Forest vegetation changes in different seasons in Northern China from 2001 to 2023. (a,a’) represent the spatial distribution characteristics of the spring mean NDVI and its changes, respectively; (b,b’) represent the spatial distribution characteristics of the summer mean NDVI and its changes, respectively; (c,c’) represent the spatial distribution characteristics of the autumn mean NDVI and its changes, respectively.
Forests 16 00671 g004
Figure 5. Spatiotemporal dynamics of different forest vegetation types. (ac) represent spatiotemporal dynamics of different forest types in Spring, Summer and Autumn seasons, respectively.
Forests 16 00671 g005
Figure 6. The spatial distribution characteristics of the mean phenological phases of forest vegetation and their corresponding NDVI in Northern China from 2001 to 2023. (a,a’) represent the phenological changes in the green-up phase and the corresponding NDVI changes, respectively. (b,b’) represent the phenological changes in the peak phase (rapid growth phase) and the corresponding NDVI changes, respectively. (c,c’) represent the phenological changes in the senescence phase and the corresponding NDVI changes, respectively.
Forests 16 00671 g006
Figure 7. The spatial correlation between growing season NDVI and temperature, precipitation, and radiation in northern forest vegetation. (ac) represent the response of forest vegetation to temperature, precipitation, and radiation, respectively.
Forests 16 00671 g007
Figure 8. The mean values and changing trends of NDVI, temperature, precipitation, and radiation during the growing season (April to October) in northern forests. T: temperature, P: precipitation, R: radiation, △: change trend. (ad) represent the mean values and changing trends of NDVI, temperature, precipitation, and radiation, respectively.
Forests 16 00671 g008
Table 1. The partial correlation analysis between the monthly NDVI of different vegetation types and climatic factors. * p < 0.05, ** p < 0.01, ‘n.s’: not significant; T: temperature, P: precipitation, R: radiation; r: partial correlation coefficient.
Vegetation TypesClimate Factorsr
AprilMayJuneJulyAugustSeptemberOctober
Evergreen
broadleaf
Tn.sn.sn.sn.sn.sn.s0.47 *
Pn.sn.sn.sn.sn.sn.sn.s
Rn.sn.sn.sn.sn.s0.48 *0.43 *
Evergreen
needleleaf
Tn.sn.sn.sn.sn.sn.sn.s
Pn.sn.sn.sn.sn.sn.sn.s
Rn.sn.sn.sn.sn.s0.60 **n.s
Mixed forestT0.50 *n.sn.sn.sn.sn.sn.s
Pn.sn.sn.sn.sn.s0.45 *n.s
Rn.sn.sn.sn.sn.sn.sn.s
ShrublandT0.67 **n.sn.sn.s0.43 *0.57 **n.s
Pn.sn.sn.s0.44 *n.sn.sn.s
Rn.sn.sn.s−0.53 *n.sn.sn.s
Deciduous
broadleaf
T0.75 **n.sn.s0.55 **n.sn.sn.s
P0.49 *n.sn.sn.sn.sn.sn.s
R0.49 *n.sn.sn.sn.sn.sn.s
Deciduous
needleleaf
Tn.s0.58 **n.s0.44 *0.44 *n.s0.44 *
Pn.sn.sn.sn.sn.sn.sn.s
Rn.sn.sn.sn.sn.sn.sn.s
Woody sparse
grassland
T0.53 *n.sn.s0.50 *n.s0.39 *n.s
P0.62 **n.sn.sn.sn.sn.sn.s
R0.66 **n.sn.s0.45 *n.sn.sn.s
Disclaimer/Publisher’s Note: The statements, opinions and data contained in all publications are solely those of the individual author(s) and contributor(s) and not of MDPI and/or the editor(s). MDPI and/or the editor(s) disclaim responsibility for any injury to people or property resulting from any ideas, methods, instructions or products referred to in the content.

