Article

Extension of Cut-to-Length Logging Trails on Salvage Logging Operations: An Overview of the Northeastern Italian Alps

1
Department of Land, Environment, Agriculture and Forestry, University of Padova, Viale dell’Università 16, 35020 Legnaro, Italy
2
Department of Forestry and Wood Science, Stellenbosch University, Matieland 7602, South Africa
*
Author to whom correspondence should be addressed.
Forests 2025, 16(4), 673; https://doi.org/10.3390/f16040673
Submission received: 23 January 2025 / Revised: 12 March 2025 / Accepted: 5 April 2025 / Published: 12 April 2025
(This article belongs to the Section Forest Operations and Engineering)

Abstract

:
Climate change is increasing the frequency and severity of disturbances, calling for extensive salvage logging operations. This study examines fully mechanized cut-to-length operations in the northeastern Italian Alps as a response to windthrow and bark beetle outbreaks following Storm Vaia. Using high-resolution orthophotos, logging trail extent, density, and configuration were analyzed in relation to terrain and ecological sensitivity. A total of 29 forest sites, covering a worksite area of 1078 hectares, were analyzed, with a combined trail length exceeding 700 km. Results indicate an average logging trail density of 500 m/ha, and a machine-trafficked area percentage of 22%. Terrain analysis revealed that 68% of the worksite area was below a 30% slope, facilitating machinery operations, while 32% of the site required adaptive strategies for steeper terrain. Additionally, depth-to-water maps were implemented to assess sensitive zones according to different moisture conditions, revealing that one-fifth of the trafficked zones were at higher risk of soil disturbances due to potentially high moisture levels. This study provides critical baseline data on mechanized salvage logging effects at a large scale, offering insights for future data-driven decision making for efficient planning under sustainable forest management.

1. Introduction

Forests in Central Europe are largely managed ecosystems [1], providing multiple benefits to our society. Although ecological alterations and climate changes have persistently been driving ecosystem dynamics to date [2], forest wind disturbance is one of the longstanding concerns for foresters, affecting management objectives at both strategic and economic levels from the stand to landscape scales [3,4], and threatening societal well-being [5]. In Europe, harsh wind is indeed the main disturbance, as well as the driver of tree damage, with an average of two catastrophic storms every year [6]. As disturbances are strongly climate-sensitive, changes in drivers over the last two decades have contributed to the increasing vulnerability of European forests to natural disturbances [7,8,9], along with severe episodic events becoming more frequent [10] and occurring at unprecedented times and places [11], with increasing trends expected in the future [12,13]. Mountainous conifer forests are likely to be more exposed to the above issues [14,15], facing new management and recovery strategies outside the ranges in which they were addressed for quality timber production, within close-to-nature or shelterwood systems [16]. In fact, salvage logging operations after extensive wind disturbance differ from original planned logging activities in higher harvesting intensity [17] and in the greater susceptibility of the site, enclosing disturbance legacies and short-term regeneration dynamics [18]. Consequently, the ability of these forests to recover has come into focus with the application of large-scale salvage logging [19], raising conflicts among the recovery of economic losses, the prevention of secondary disturbance (i.e., bark beetle outbreak), and the impact resulting from field traffic with heavy machinery on both soil and landscape [20,21]. The management response to windthrow by salvage logging represents a trade-off between different objectives, balancing local needs and requirements. This includes enhancing forest stand productivity [22], removing suitable breeding material within pest–tree connectivity [23,24], and regulating biomass to preserve ecosystem biodiversity [25]. In such a context, forest owners make risky decisions about future management, involving multiple stakeholders and facing organizational and logistical barriers [26]. Because of the emergency context, decision making is confined to a short time frame, sometimes resulting in reduced focus on detailed operational strategies to match site-specific features [27].
Despite methodological improvements and the wide availability of literature addressing specific storm-related issues in forest management over the last several years [28,29], the relationship between large-scale interventions and the magnitude of changes produced by salvage logging are areas of ongoing research, showing some gaps in site- and species-related factors to exploit for optimizing the management response at strategic level [30].
This aspect becomes even more critical in areas where close-to-nature forestry with low harvesting intensity is applied, such as in the Italian Alps [31], where silvicultural guidelines are aimed at the conservation of mountainous forests to ensure vital protection against natural hazards such as avalanches, rockfall, and landslides [32], thereby safeguarding nearby communities and infrastructure [19]. In these contexts, a large-scale disturbance event leads to a temporary revision of management strategies, shifting from limited felling intensity (20–30 percent) to near-total extraction, as in the case of salvage logging [33]. In such a period of change, the governance and management of forests require adaptive improvements, making the role of research more important than ever.
Therefore, the objectives of this study are (i) to analyze the extent and intensity of salvage logging operations by ground-based extraction systems after a wind disturbance and (ii) to evaluate how the fully mechanized CTL system influences the extent and density of logging trails, in relation to terrain morphology and mountainous forest accessibility, with an emphasis on the overlap with potential soil sensitive areas.

2. Materials and Methods
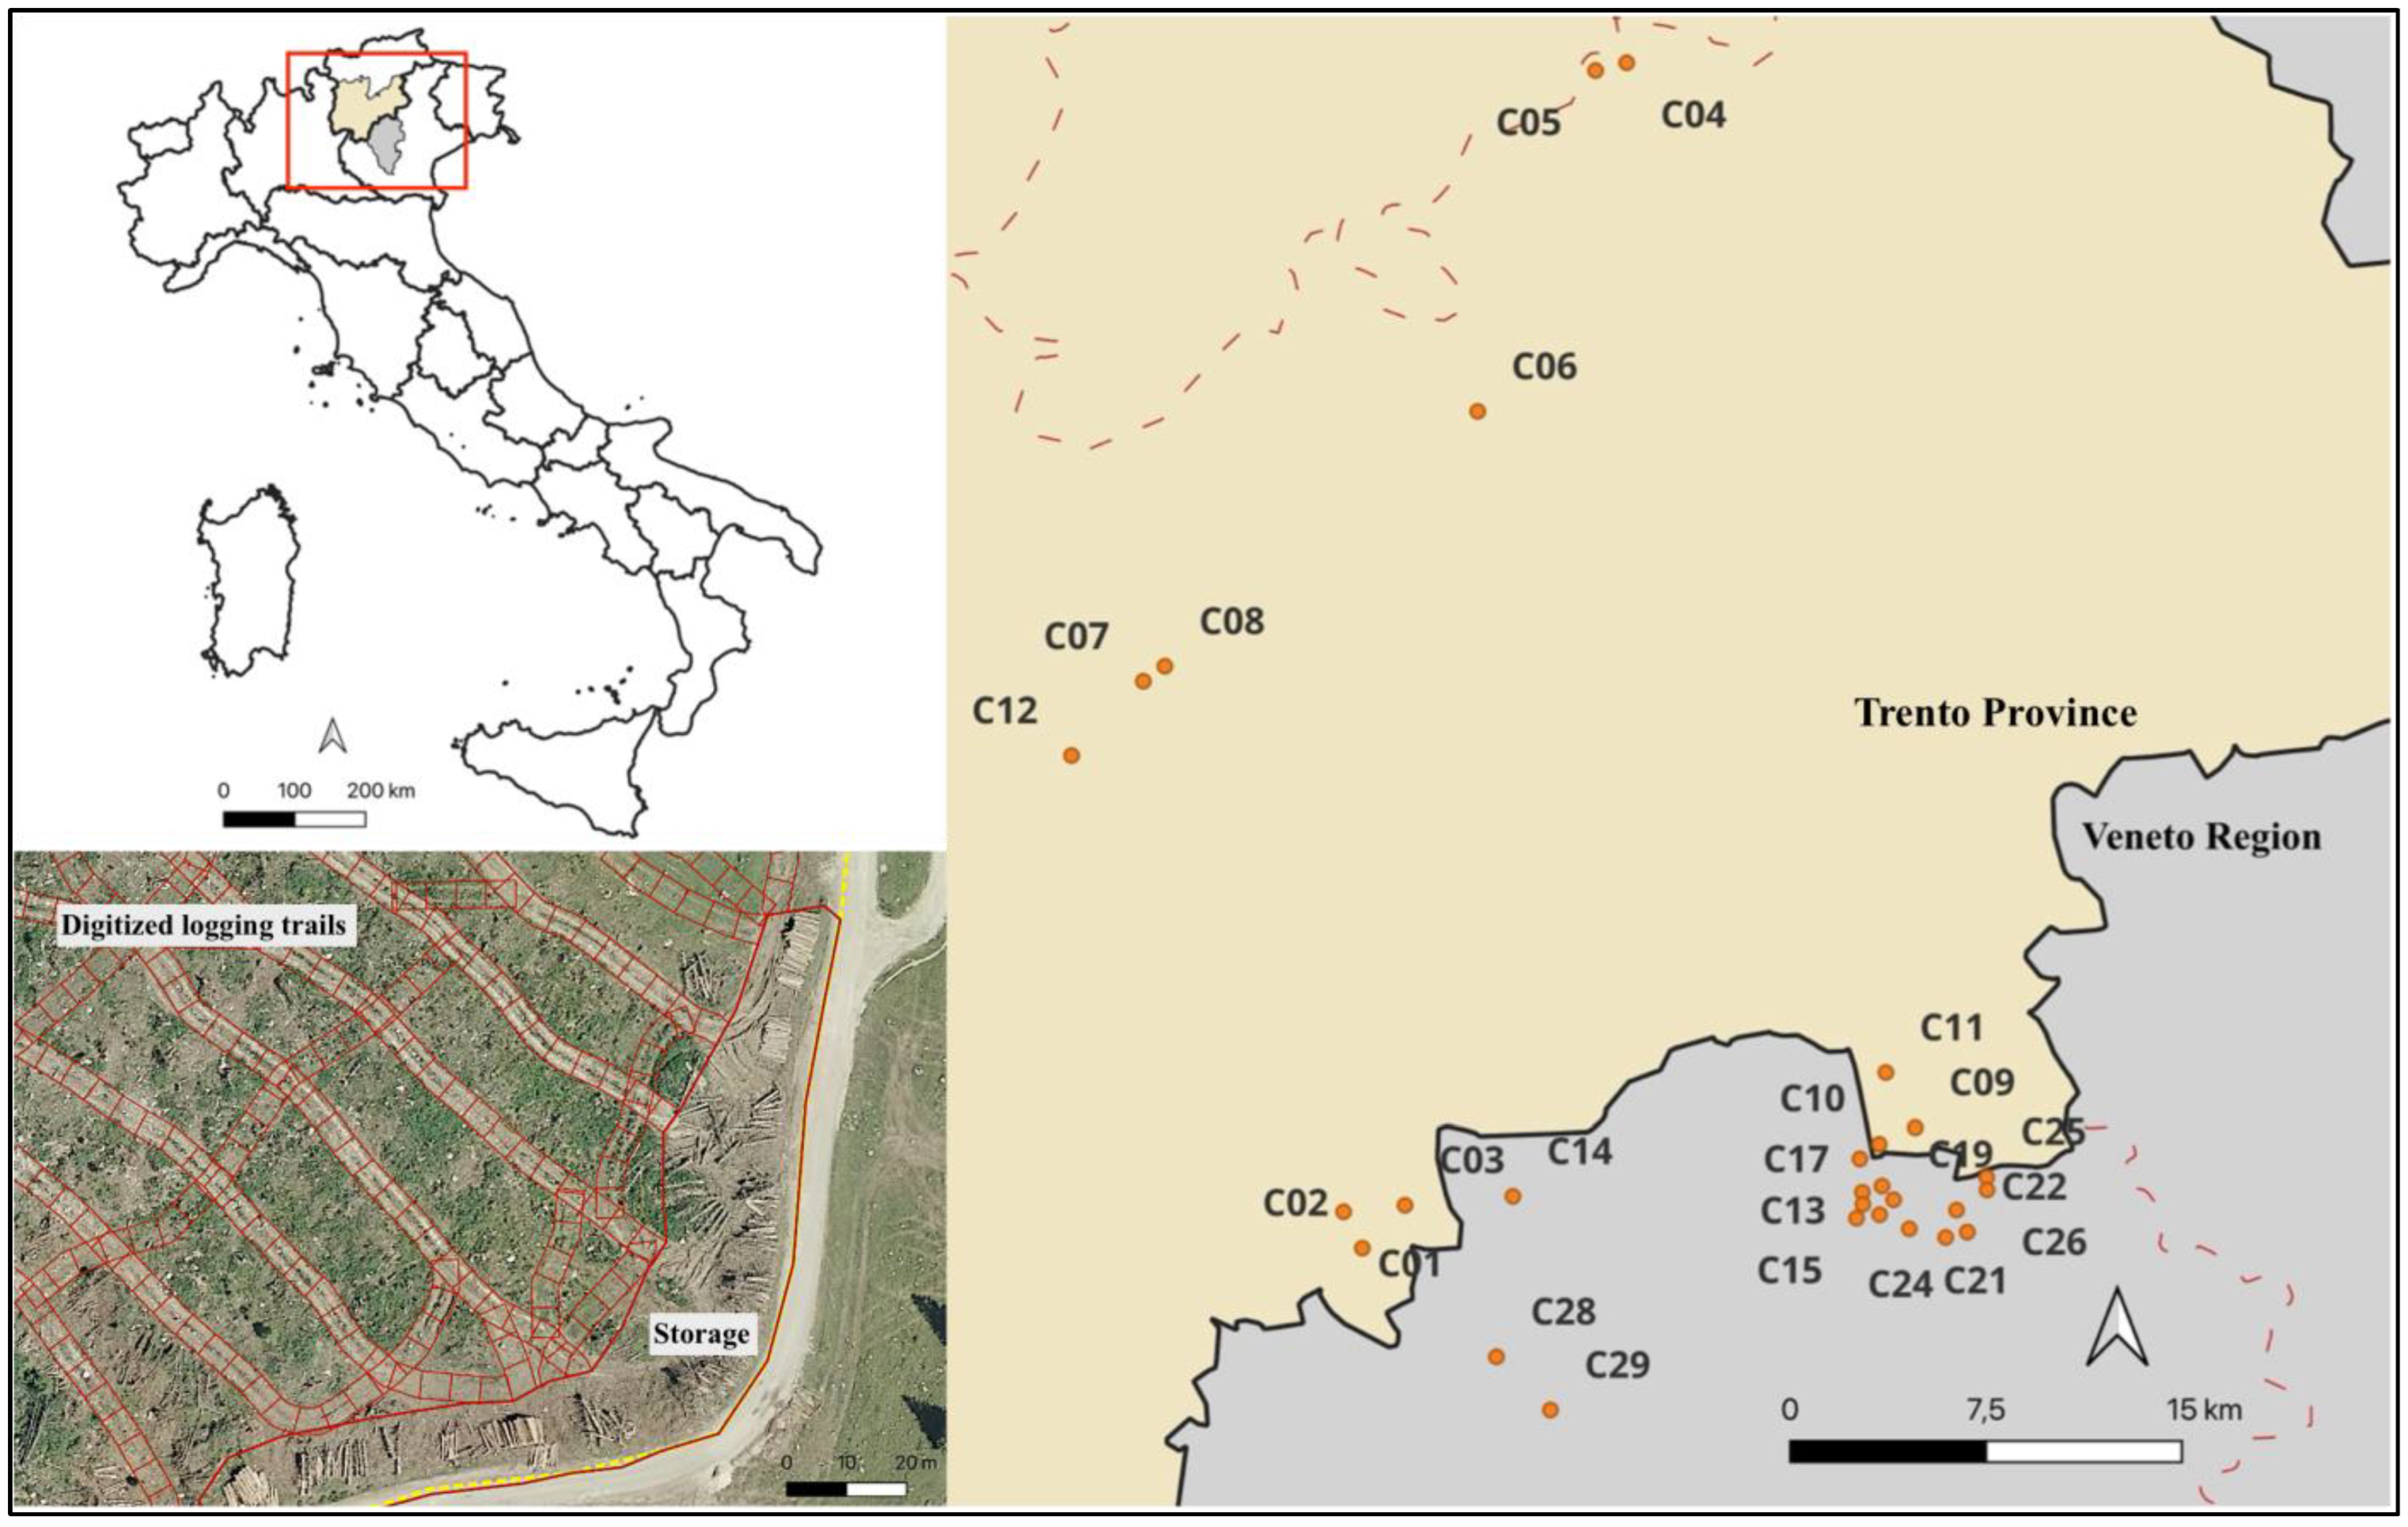
2.1. Study Area

The study area is located in the northeastern Italian Alps, within the autonomous province of Trento (Trentino–Alto Adige Region) and the “Altipiano dei Sette Comuni”, in the northern part of Vicenza Province (Veneto Region). This area faced a significant challenge following Storm Vaia, which occurred in October 2018 and caused extensive damage, uprooting numerous spruce trees (Picea abies (L.) H. Karst.) and affecting large sections of forest [34]. In fact, during the storm, wind speeds exceeded the resistance threshold of tree structural factors, causing extensive damage across all affected areas, regardless of forest type, structure, or altitude [6]. When wind speed overcomes 94–100 km/h, the mechanical resistance of trees becomes negligible compared to the aerodynamic forces exerted by the air mass [35]. In particular windfirm stands, this threshold can rise to 150 km/h [36]; however, the wind gusts during Vaia far exceeded these values [34]. As a result, all forest formations suffered widespread damage, despite pure, single-layered, and dense stands being the most vulnerable to windthrow [37]. Due to its superficial root system compared to other species, like larch (Larix decidua) and fir (Abies alba), and its susceptibility to bark beetles, spruce has been the predominant tree species affected by windstorms and bark beetle infestation in both regions [38,39]. Today, the management response to Vaia has shifted from addressing issues related to the storm to managing secondary disturbance factors [40], with primary attention focused on the bark beetle outbreak [41].
In collaboration with the Forest Service of the Province of Trento and the Forest Directorate of the Veneto Region, 29 forest plots (Table 1 and Figure 1) with Norway spruce (Picea abies L.) as the dominant tree species, harvested using a high level of mechanization, were identified. These parcels were logged between 2019 and 2020 according to the cut-to-length (CTL) harvesting method, fully mechanized with harvesters and forwarders (Figure 2).

2.2. Data Sources and Software

Several types of data were used to analyze machinery operations during salvage logging activities:
High-resolution orthophotos, with a resolution of 15 × 15 cm per cell, were taken from the 2021 AGEA flights (Province of Trento) and the 2021 ETRA flights (Veneto Region). These data were used for photo interpretation of forest logging trails and logging site areas.
Spatial data, such as high-resolution Digital Terrain Models (DTMs) with 0.5 × 0.5 m and 1 × 1 m cell sizes, are freely available from the geographic portals of the Province of Trento and the Veneto Region, respectively. The GIS-based spatial analysis was supported by the open-source QGIS software, integrating some computation through the Open Jump GIS (vers. 2.2.1).

2.3. Timber Logging Area Estimation

The analysis of high-resolution orthophotos made it possible to determine where the machinery had operated, as well as to manually delineate the boundaries of the logging areas. Using Province of Trento and Veneto Region base maps, forest roads classified as suitable for truck access were identified and exploited to pinpoint different entry points to the logging sites and unloading areas for timber transported by forwarders.
For each site, the area affected by skidding operations was determined. Through further analysis of the DTMs, the minimum, maximum, and average slopes, as well as the minimum and maximum elevations of the logging areas, were established. Additionally, the surface area dedicated to timber landings and the extent of truck-accessible forest roads serving the logging site were measured. The surfaces of the log landings and truck-accessible roads were then rasterized for use as raster starting points. By applying a lowest cost function to the slope area raster, it was possible to identify continuous slope surfaces, categorized into the three following slope classes: (i) <30%, (ii) 30–60%, and (iii) ≥60%, according to Pucher et al. [42]. In this framework, the first range reflects the use of the “fully mechanized” level without operational issues. The second range identifies a system where the use of winch-assisted traction devices is mandatory to facilitate operations, while, in the third range, it is necessary to consider other systems, such as tower yarders.
This analysis made it possible to determine the extent of the surface area within each slope class accessible for machinery operations.

2.4. Logging Trail Photo Interpretations

Through GIS-supported photo-interpretation of each image, the logging paths of the machinery were reconstructed, starting from the identified log landings and truck-accessible roads. Vector segments were converted into polygons using a buffer operation, with a standard width of 4.5 m. This width was adopted as the standard for logging trails [43]. The digitization of the logging trails was crucial to understanding how the machinery moved within each logging site. For each site, parameters related to machine movements, including total trail length and the average trafficked area per hectare, were calculated.

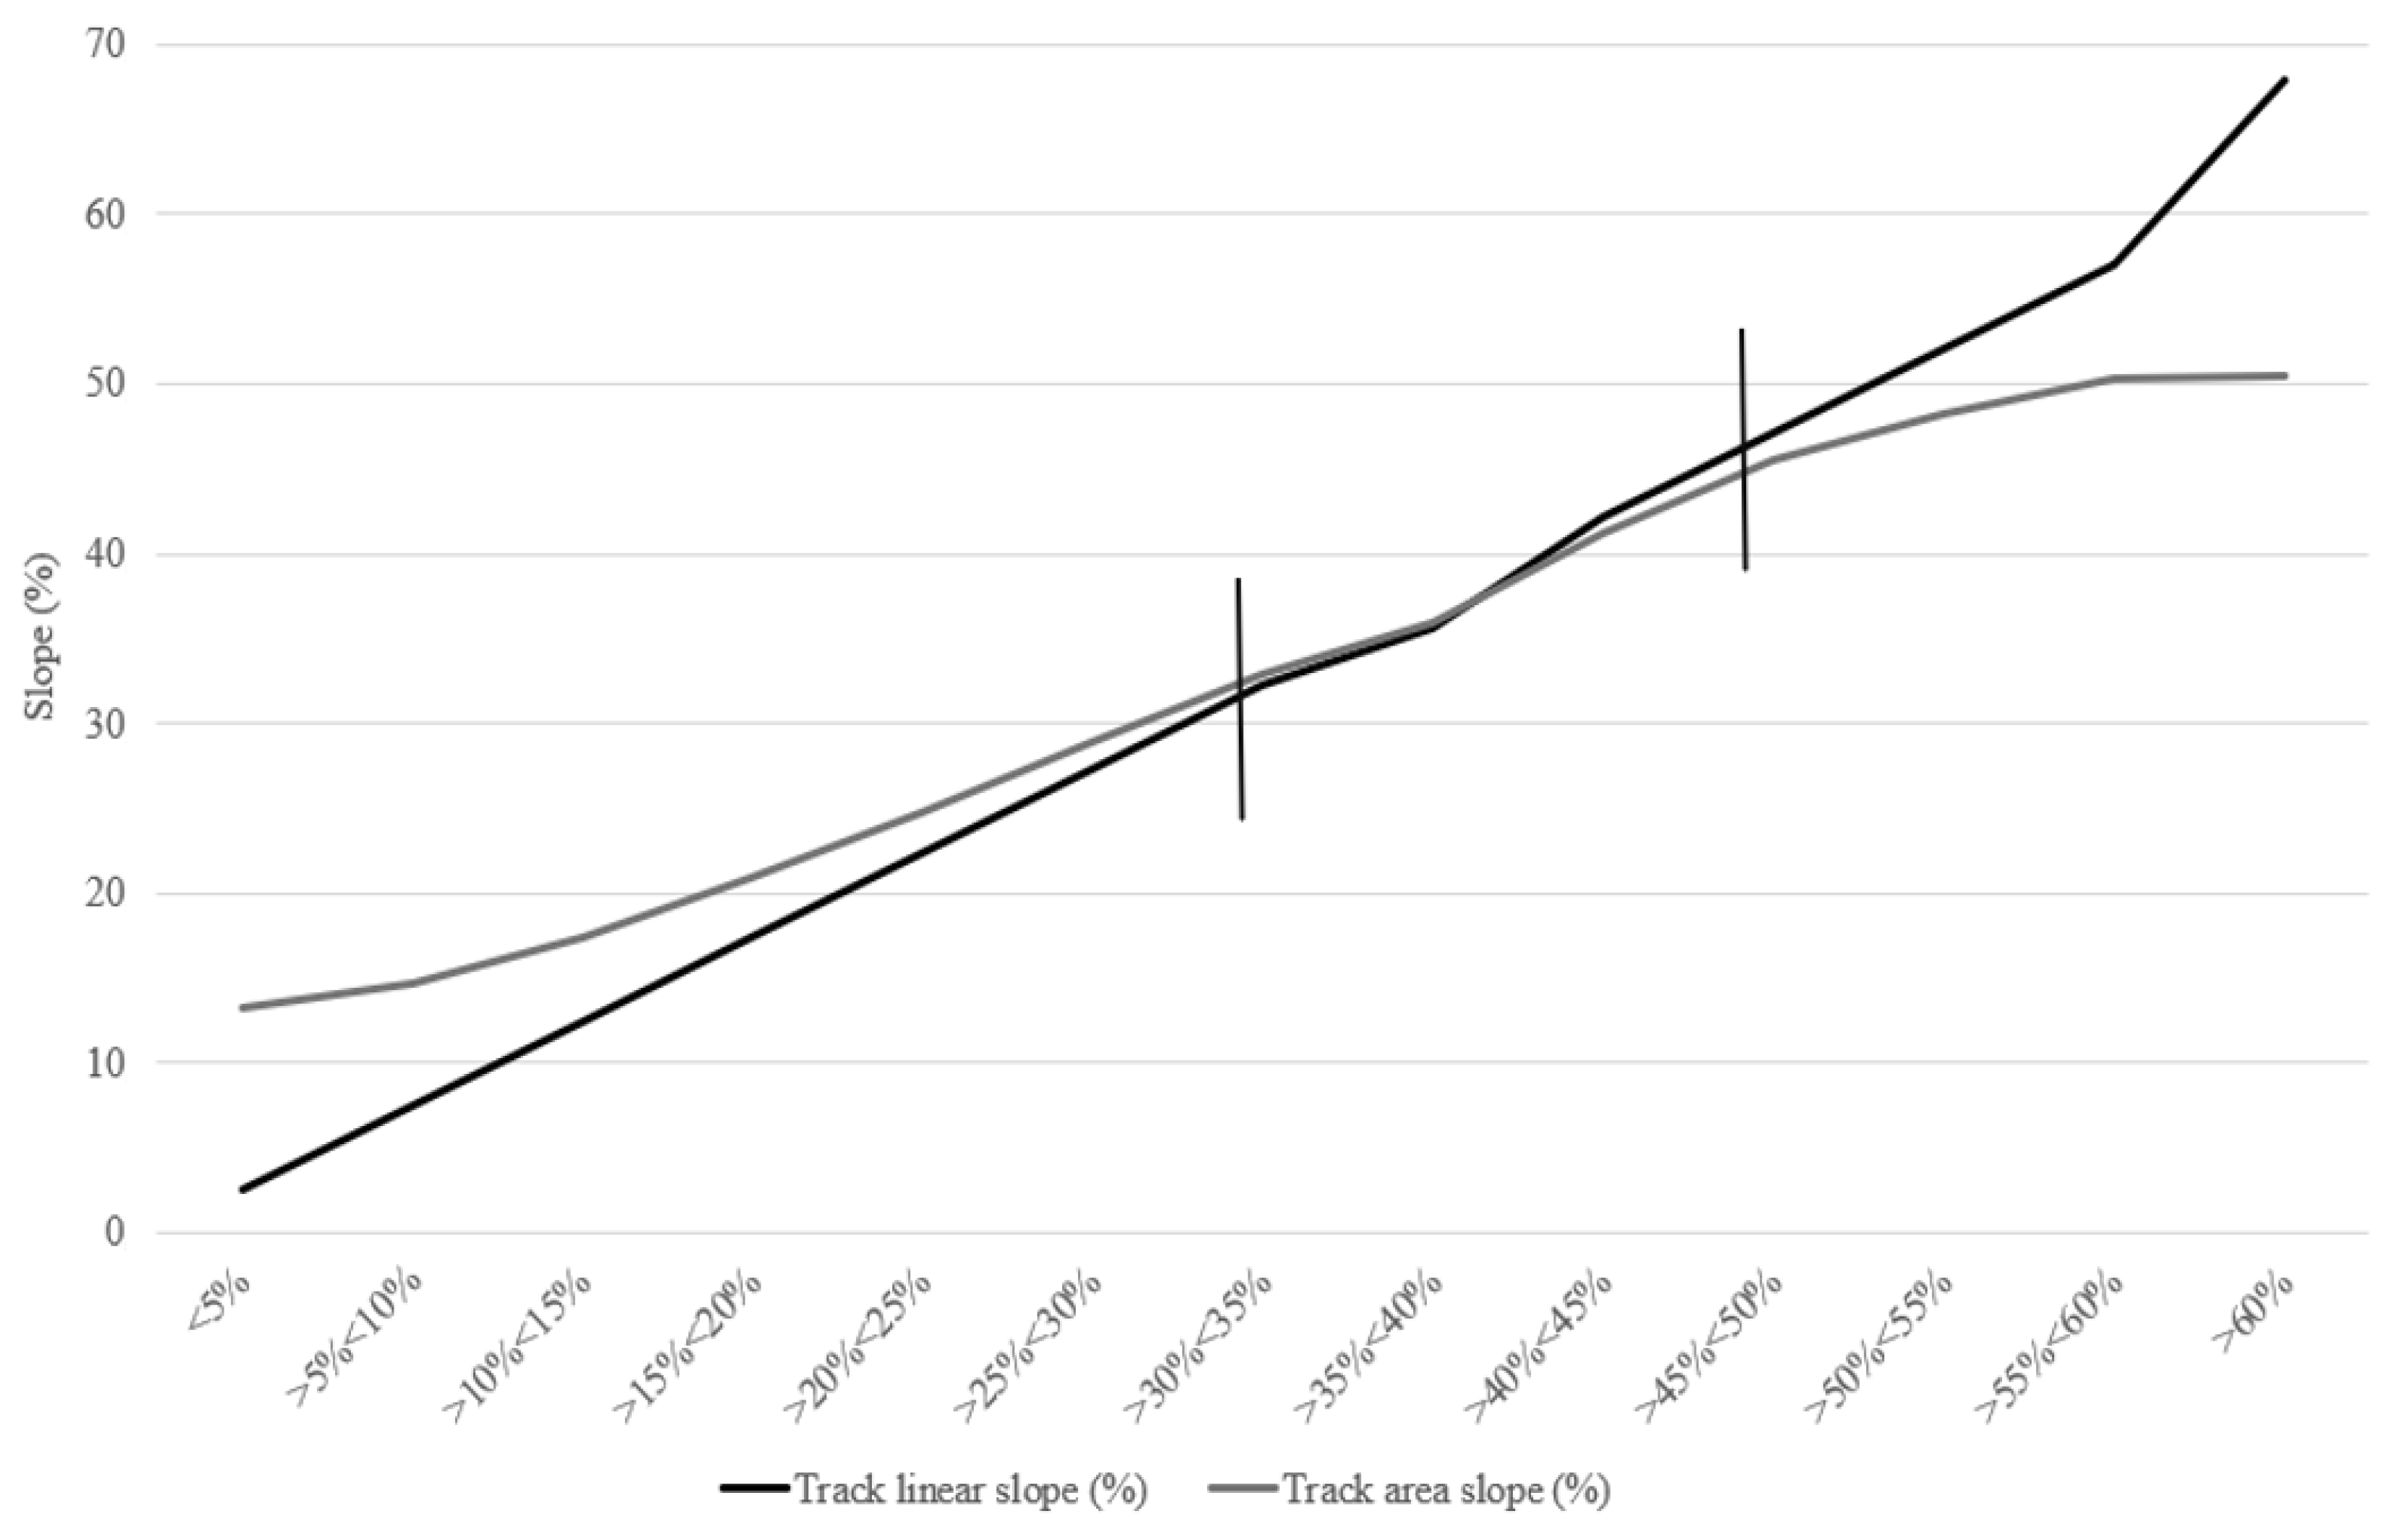
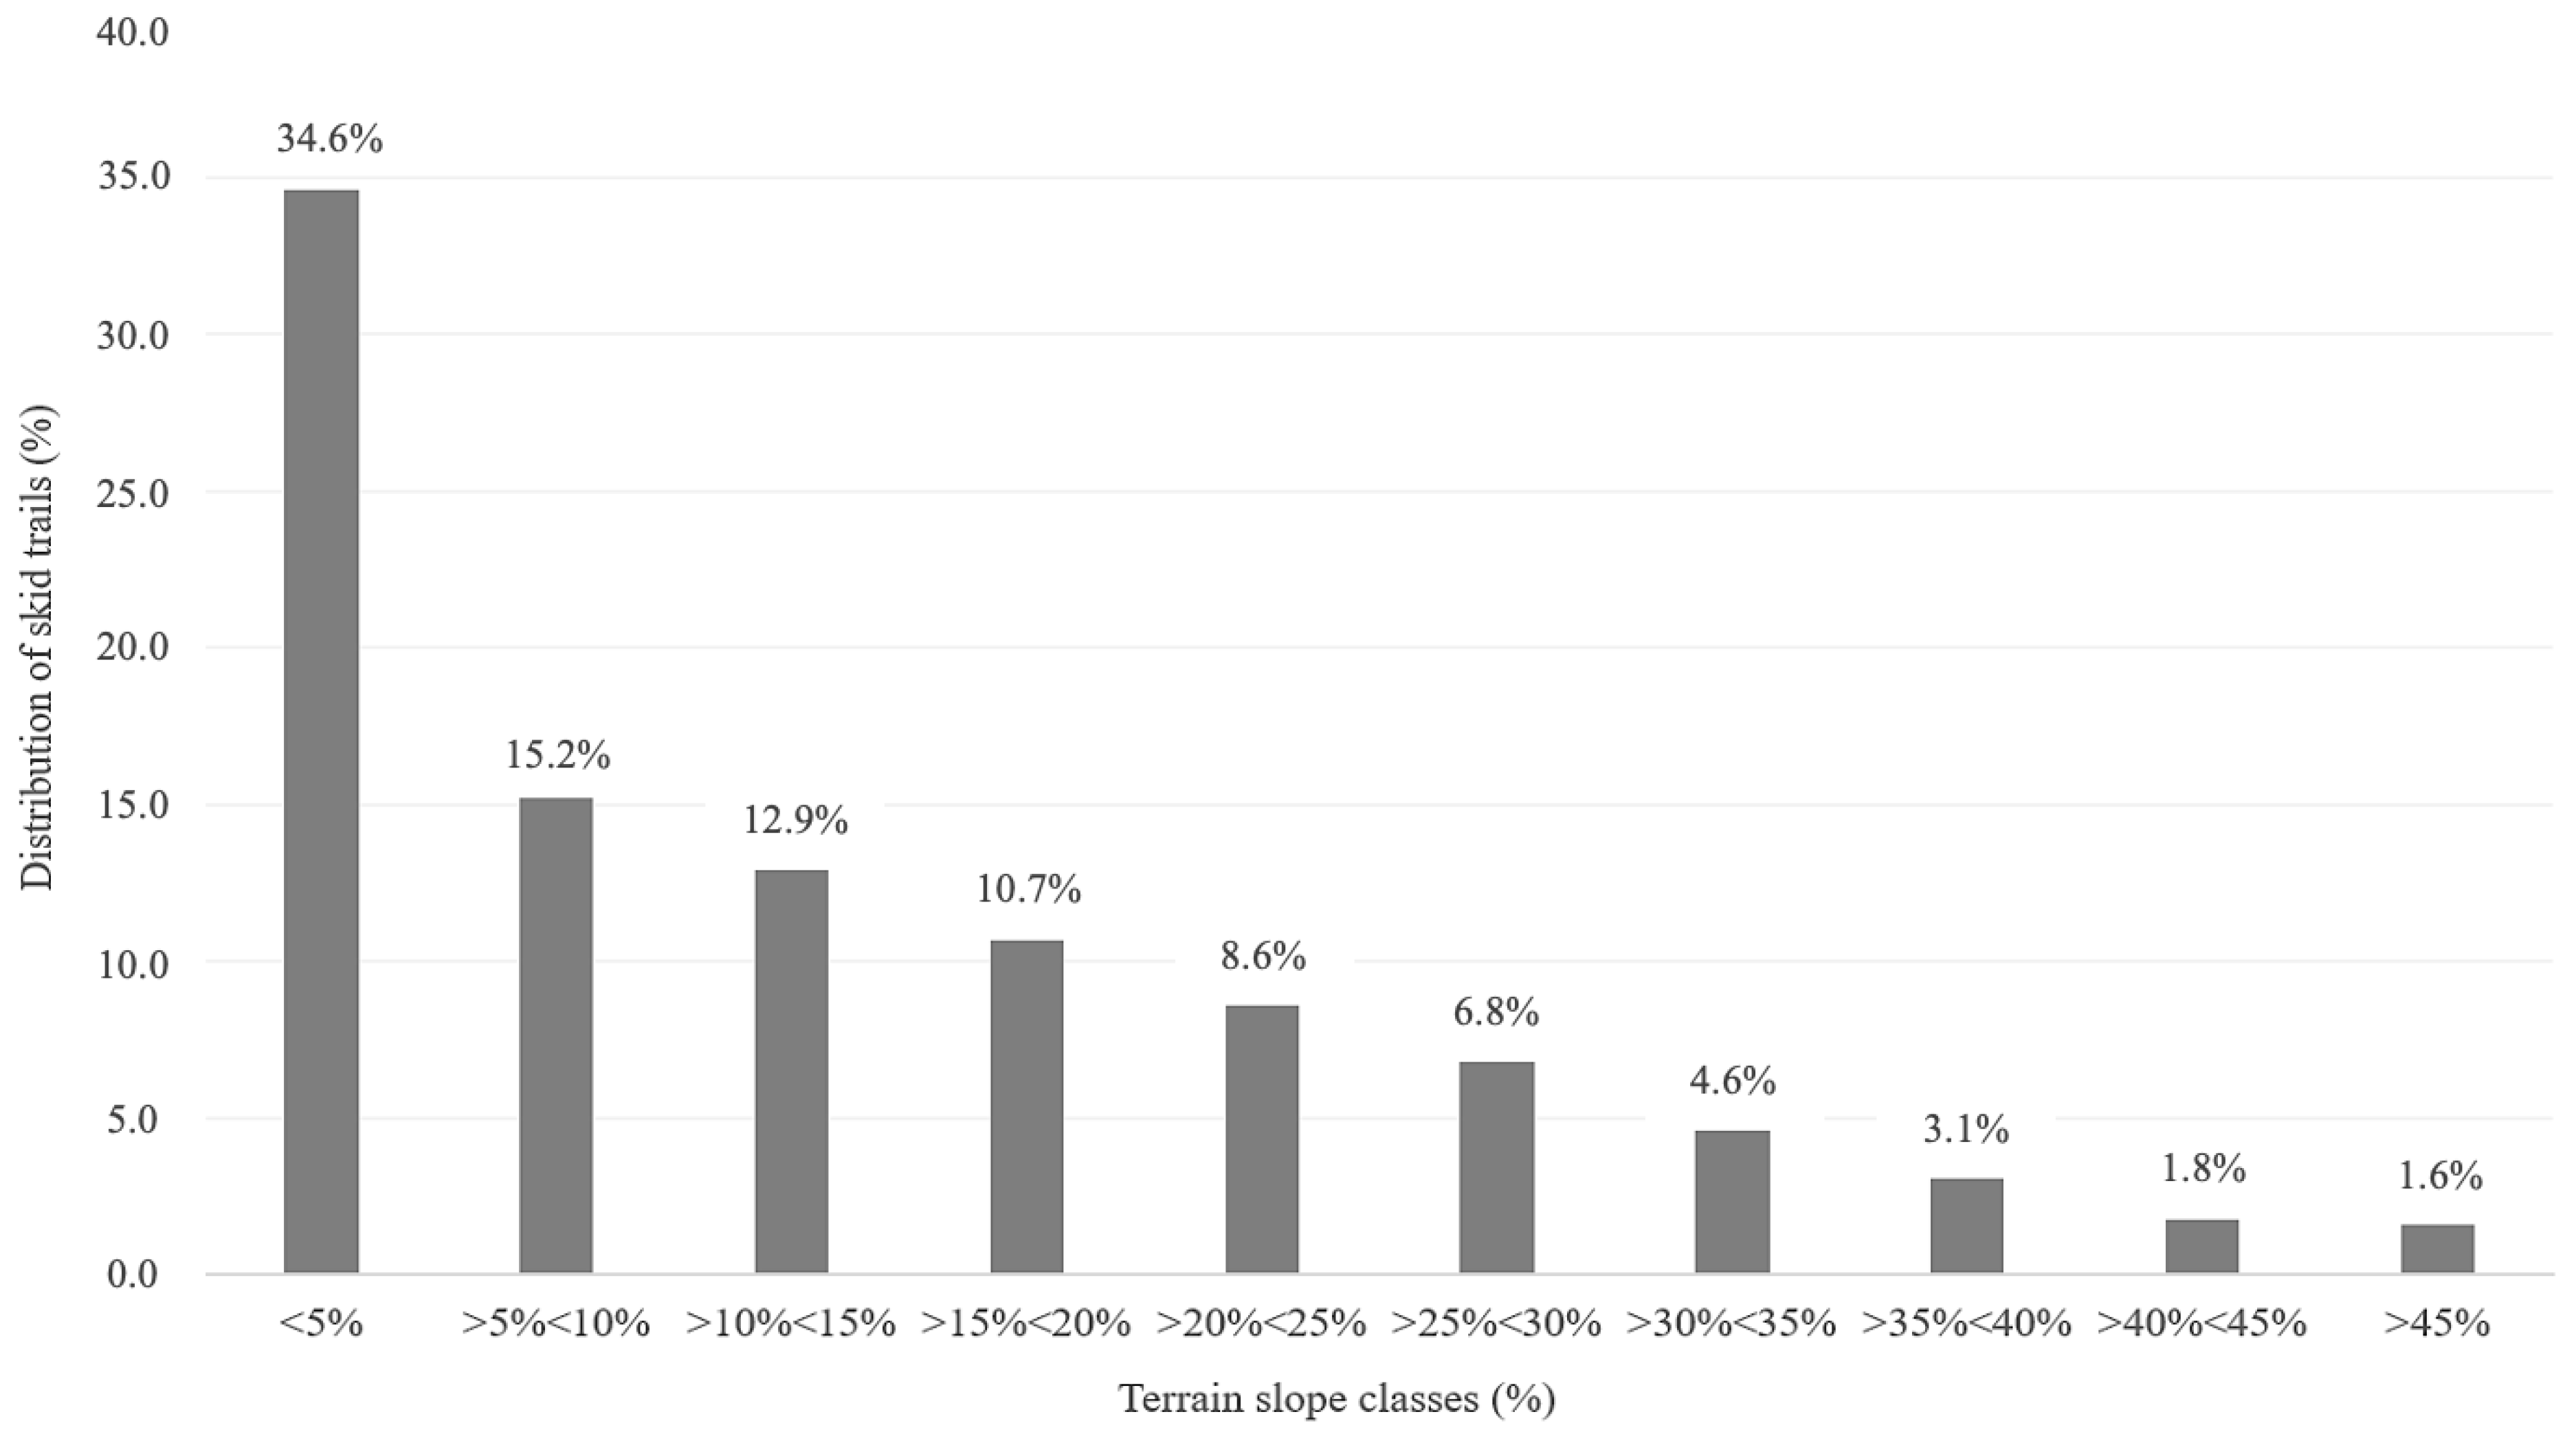
2.5. Characterization of the Logging Trails

Each logging trail was subject to morphological characterization. Using the QGIS plug-in “Road Slope Calculator”, the logging trails were divided into linear segments of 5 m in length. The Road Slope Calculator provided an average slope value for each segment, calculated based on the DTM. The slope data from the individual segments were compiled into a single database to analyze how the machinery moved within the logging area, as well as to parameterize the slope ranges where the machines operated. Each 5 m segment calculated with the Road Slope Calculator was subsequently converted into a 4.5 m wide buffer polygon, and the average slope of the polygon area was calculated. The two slope datasets (linear and surface) were then compared and analyzed to identify the threshold at which the two variables converge, indicating when the machinery begins to move in the direction of the maximum slope to minimize the risk of lateral overturning. For each site, the extraction distance of the machinery was then quantified. Using a lowest cost path function, the truck-accessible roads and log landings were established as starting points, while the logging trails, extracted from the DTM, were used as the cost raster. This approach assigned a cumulative value in meters to each cell, increasing with distance from the starting points. The calculation process was optimized based on proximity to the timber unloading points, providing a weighted average value according to the distance of machinery from the unloading locations.
The density between the logging trails was quantified using the following methodology: after converting the trails into unique raster files, a proximity function was applied. This function, starting from the logging trails considered as origin cells (zero cells), assigns a linear distance value to each subsequent cell. In the case of two parallel paths, the proximity values converge halfway between the two. To obtain the actual distance between the logging trails, it is necessary to double the average value where the two proximity values meet.

2.6. Depth-to-Water Map

DTW (depth-to-water) maps are a predictive tool used to identify and map wetland areas [44,45]. These maps provide information on the depth and extent of groundwater according to the land surface [46]. In forestry operations, DTW maps are employed as an effective tool and they are widely used to minimize soil damage caused by the movement of forestry machinery during logging and skidding activities [47,48]. The creation of DTW maps was carried out through Open Jump GIS and QGIS software. The only input required for the analysis was a Digital Terrain Model (DTM) with a resolution of at least 5.0 m. In this study, resolutions of 0.5 m, for the sites located in Trento Province, and 1.0 m, for the site located in Veneto Region, were the bases for DTW map extraction.
The process of generating DTW maps begins with an initial hydrological analysis for the extraction of the catchment area. A DEPIT function was used to create a depressionless DTM. The flow direction algorithm (D8) was then used to derive the flow accumulation network [49]. A critical step in generating a DTW map is the selection of an appropriate flow initiation threshold, which defines the minimum surface area required for adequate water accumulation to enable the transition from groundwater emergence to surface water flow. The watershed raster network delineates the flow initiation area (FIA), and the selection of the FIA threshold value is influenced by seasonal conditions and soil moisture levels. Accurate threshold selection is essential, as it directly impacts the model’s sensitivity to terrain and hydrological features. An excessively high threshold may cause the model to overlook smaller flow channels, while a threshold set too low could result in excessive identification of surface water pathways, reducing model accuracy.
In this study, two different threshold values, 1.00 ha and 0.25 ha, were considered, simulating generally moist or wet soil conditions [50]. The DTM was then used to calculate the percent slope across the entire hydrographical basin, and then to calculate the lowest cost path from any cell in the landscape to the nearest surface water cell selected, according to the FIA threshold (DTW = 0 for channels) [51].
Therefore, the DTW index identifies the vertical distance to the nearest water flow line. A depth of up to 1 m is usually assumed to indicate areas with water saturation, which can be associated with a high susceptibility to rutting [52].
Consistent with the above, the DTW index was applied to each logging site to measure the total susceptibility of surface area in hectares. Subsequently, the digitized machine path was overlaid on the DTW map to identify the logging trails that intersect sensitive areas classified by the index. This analysis was performed using two different threshold values of FIA to assess how many trails crossed areas with varying levels of sensitivity to soil moisture and potential disturbance. In this regard, three different scenarios have been hypothesized and associated with three distinct combinations of outcomes (Table 2). Class 0 includes non-DTW zones, which generally tend to be free of waterlogging; thus, they are not identified by the computed DTW maps. Class 1 includes areas that are sensitive only during wetter periods, following precipitation and snowmelt; in this scenario, the activation of the hydrographic network occurs according to a FIA value of 0.25 hectares. Class 2 incorporates persistently wet areas, which are considered as highly susceptible to soil compaction phenomena; this condition has been simulated by setting an FIA value of 1 hectare, thus including areas identified by a threshold value of 0.25 hectares.

3. Results

A total of 29 sample salvage logging sites, distributed across the southern Alps in Italy, were analyzed, covering a total worksite area of 1078 hectares. Across the sites, 603 km of logging trails were identified, with an average linear length of 86 m, an average trail density of 500 m per hectare, and an average trail spacing of 12 m.
Concerning terrain analysis, the mean slope of the study area was 25.5%, ranging from 13.7% to 36.8%. The weighted average slope of logging trails was 16.25%, with a minimum of 8.7% and a maximum of 32%. Within the total worksite, the machine-trafficked area ranged from 12.5% to 28.6%, with a weighted average of 22%. In addition, 2.7% of the worksite was served by the regional forest road network, which is suitable for truck transport of harvested timber. The landing area dedicated to log storing across all sites amounted to 215 m2/ha, accounting for 2.2% of the worksite, according to the need to accommodate the high timber volumes (250–500 m3/ha) extracted during the salvage logging operations.
The average extraction distance, defined as the distance from the tree felling site to the nearest truck-accessible road network or landing area, was estimated at 135 m. In sites with limited accessibility, extraction distances varied significantly, ranging from 150 m up to 1 km. By contrast, sites better served by the forest road network exhibited notably shorter extraction distances, sometimes reaching as low as 50 m. On steeper slopes, where trail gradients exceeded 25%, extraction distances remained under 150 m. In areas with gentler slopes, averaging less than 16%, extraction distances were notably longer, ranging from 300 to 450 m. The analysis of the machine-trafficable surface revealed that 68% of the area in each site was characterized by a continuous slope below 30%, starting from the nearest road network segment or landing area to the tree felling sites. Meanwhile, 32% of the area exhibited slopes between 30% and 60%.
By categorizing both the track linear slope and the terrain slope into classes of 5% increment classes, it becomes evident that the alignment between the two variables increases with increasing slope. In the slope classes between 0 and 15%, the significantly high difference indicates that machinery operating within this range is not constrained by terrain inclination. Instead, machines exhibit greater freedom of movement in the absence of design constraints, often favoring paths with lower linear gradients, frequently transverse to the terrain slope. However, this gap decreases with increasing terrain slope. As shown in Figure 3, the relative difference between track and terrain slope falls below 5% in the slope classes between 30% and 50%, indicating a closer alignment. This indicates that forestry machinery tends to follow the direction of maximum terrain inclination as slopes steepen. This behavior aims to minimize excessive oblique positioning, which cannot be effectively compensated for by the self-leveling mechanisms of the machinery.
As shown in Figure 4, the logging trail paths have been classified into slope categories, each divided into 5% intervals. Despite the weighted average slope of the study area being 24.0%, most logging trails (34.6%) are concentrated in the first slope category (<5%). Only 11% of the trails were opened on terrain with slopes greater than 30%, and a very small fraction (1.6%) traversed areas with slopes exceeding 45%. Furthermore, while 32% of the worksite area required slopes over 30% to be accessible, 88% of traffic was concentrated in areas with slopes below this threshold [53].
Figure 5 shows a heatmap of various parameters resulting from terrain analysis across individual forest sites within the study area, revealing patterns and potential correlations among slope characteristics, trafficability, and operational accessibility. Sites with steeper logging trails often correspond to lower trafficability, indicating lower machinery movement on paths. Additionally, sites with larger accessible areas below a 30% slope (darker tones) exhibit higher machine traffic and lower values in other variables, suggesting easier operational conditions, with machinery operating without additional traction aids. This scenario implies that flatter sites simplify operational logistics, while steeper areas require careful planning to maintain efficiency and safety in extraction operations.
For each site, a DTW map was created. Potentially water-saturated areas were identified, and the trail pattern was analyzed in comparison with the micro-hydrographic network. Across the 29 sites, the maps indicated that 9.56% and 18.14% of the study area were subject to wet conditions, according to the FIA values of 1 hectare and 0.25 hectares, respectively. Among the DTW zones, the average terrain slope was 21% according to both FIA values. Among the machine-trafficked area, 14.3% and 26.6% of logging trails were included within DTW zones, according to the FIA values of 1 hectare and 0.25 hectares, respectively, showing that one-fifth of the trafficked zones were at higher risk of soil compaction due to potentially high moisture levels.
Concerning the track segment analysis (according to 5 m fragmentation), the Mood’s Median Test demonstrated significant differences in slopes for both logging trails and terrain across DTW zones with FIA values of 0.25 ha and 1 ha, with all tests yielding a p-value of 0. According to FIA = 0.25 ha, non-DTW zones had higher median slopes of 16% for logging trails and 21.4% for terrain, while DTW zones had lower median slopes of 9.4% and 14.4%, respectively. Similarly, for FIA = 1 ha, non-DTW zones had median slopes of 14.8% for logging trails and 20.3% for terrain, compared to lower median slopes of 8.2% and 13.1% in DTW zones, respectively.
Overall, the medians of the slopes along logging trails intersecting DTW zones (for both 0.25 and 1 ha FIA) were lower than those for segments that did not intersect DTW zones. Observing the effects of DTW at 0.25 ha versus 1 ha FIA, it is evident that the median slopes for track segments crossing DTW 1 ha are lower than those crossing DTW 0.25 ha.
According to the three combinations of DTW zones reported in Table 1, the Mood’s Median Test revealed a significant difference (p-value = 0) in both track and terrain slopes across them. Median slope percentages significantly decrease with increasing FIA value, indicating that both logging trails and terrain within DTW zones are generally flatter. For track slopes, Class 0 had a median of 16%, Class 1 had a lower median, of 10.6%, and Class 2 had the lowest median, of 8.2%. Similarly, for terrain slopes, Class 0 had a median of 21.4%, Class 1 had a lower median, of 15.6%, and Class 2 had the lowest median, of 13.1%.

4. Discussion

In this study, through high-resolution orthophotos, it was possible to digitize machine trails and landing areas, in order to quantify the extension and the level of impact generated during salvage logging operations.
In addition, a morphological analysis was carried out within a large salvage logging site and related to the characteristics of the logging tracks. More specifically, the DTW index was calculated and overlaid on the study area to simulate different levels of suitability to soil moisture conditions, assuming two distinct levels of soil compaction susceptibility. The terrain and logging track analysis was focused on both scenarios distinctly.
The analysis of orthophotos revealed a high proximity between the logging trails. The observed value reflects the more intensive disturbance typical of salvage logging, which involves near-total canopy removal with non-optimal falling directions of windthrown trees, resulting in reduced spacing and different impacts on soil and ecosystem dynamics. In standard mechanized logging operations, trail spacing is typically 20–24 m, depending on the boom reach of the harvester [54]. However, this distance can increase in specific cases, such as mixed harvesting systems or particular operational needs, as seen in the work of Berendt et al. [55]. The visible degree of soil disturbance, whose logging trails were clearly visible post-harvest during the photo-interpretation procedure, was attributed to the repeated passage of machines. The number of machine passes over forest soil is among the factors that significantly influence the degree of soil degradation [56], with a greater effect during the first few machine passes or cycles [57,58], together with logging machinery characteristics [59]. Harvester trails, however, were generally obscured by subsequent forwarder operations, so the predominant visible effect of surface traffic was more related to the intensive use of forwarders on the logging trails.
In the salvage operations conducted, emergency conditions driven by time constraints, as well as the need to address the exceptional effects of primary and secondary disturbance events within a mountainous environment, led to insufficient planning of the logging sites, with soil disturbance being among the notable side effects. This issue highlights the crucial role of proactive logging trail planning in minimizing environmental damage while maximizing operational efficiency. Using a GIS-based decision support system (DSS), Parsakhoo et al. [60], were able to develop an optimized network of skid trails to facilitate the extraction of marked trees by evaluating multiple parameters, including terrain slope, soil type, and nearby water networks, to ensure both accessible and environmentally sustainable trails.
Despite the large volumes of timber to be extracted, the lack of structured traffic management resulted in machine operators moving freely within the worksite area, occasionally moving along DTW zones more susceptible to soil compaction. As reported by Hoffmann et al. [44], and Ring et al. [61], the integration of DTW maps into mobile GIS applications on the machines’ on-board computers would enable operators to access site-specific data, facilitating the selection of extraction routes that optimize both soil conservation and operational efficiency.
For this study, DTM resolutions of 1 m and 0.5 m were primarily used, ensuring a high level of detail. This approach aligns with prior findings by Mohtashami et al. [62], which validated these resolutions as effective for forest harvest planning, balancing detail with computational efficiency to predict soil moisture conditions effectively.
A notable correlation was observed between the slope of the terrain and the trend for trail gradients to be aligned with the maximum slope, as an adaptation aimed to minimize the risk of machine rollover beyond the systems that automatically balance the inclination of the cabin within a certain range, which are implemented in some advanced models of forestry machines. Additionally, it is well known that the variability in the degree of logging trail extension and soil impact is influenced by multiple factors [47].
This study focused on analyzing, at a large scale, the spatial extent and density of skid trails in fully mechanized cut-to-length operations. The assessment of the spatial impact of logging operation represents a novel approach within the Alpine context, particularly in the case of large-scale intensive operations, such as salvage logging. Considering the limitations of large-scale orthophoto interpretation, future research should include more detailed, ground-based assessments at the operational scale to quantify soil impacts from intensive harvesting practices, compared to conventional low-intensity interventions commonly performed in the northeastern Italian Alps. Indeed, due to the broad scale of the analysis, the emergency conditions associated with salvage logging, and the involvement of multiple logging companies, this study encountered significant limitations in collecting detailed information, further complicated by the high fragmentation of forest ownership typical of the Italian context. Consequently, the data obtained were limited primarily to the types of equipment used in salvage logging operations. Future research in similar contexts should therefore prioritize the acquisition of detailed ground-based data to overcome these constraints.

5. Conclusions

This study provides baseline data on the extent and intensity of mechanized operations in salvage logging areas in mountainous forest terrain under real conditions, which will improve future site management and recovery efforts. These data will also serve as a foundation for ongoing research into the long-term effects of these operations on soil health, compaction, and forest regeneration.
Recent advances in remote sensing technology and the availability of high-resolution data provide avenues to further explore the potential of digital approaches through photogrammetric surveys and airborne LiDAR data processing [63,64] to obtain a combined understanding between treatment intensities and site-specific response, terrain morphology, and soil damage susceptibility [44]. In this regard, Kim et al. [58] highlighted the potential of UAV photogrammetry in identifying the spatial extent of soil disturbances caused by forestry operations, offering a cost-effective and efficient alternative to traditional field-based assessments. These findings reinforce the reliability of remote sensing technologies in complementing, or even replacing, conventional methods, particularly in large-scale or inaccessible forested areas where rapid assessment is required, supporting more efficient operational management and informed decision-making.
The use of DTW scenarios is already advancing the generation of high-resolution wet-area maps that embrace geomorphological dynamics, exploiting large datasets and tools for site-specific analysis. This approach is now widely applied in forestry and spatial planning, showing its versatility and effectiveness. Moreover, the DTW index operates with minimal input requirements, relying solely on a digital terrain model at a suitable resolution, to implement routing optimization according to varied soil moisture conditions. It is, however, essential to verify the predicted scenarios in the field prior to initiating logging operations, in order to ensure alignment with actual ground-based conditions. Additionally, DTW maps can be complemented with information on soil texture, further enhancing their reliability. However, in this study, such data were not available due to our large-scale approach, which did not allow for the integration of more detailed soil texture and moisture variability information.
The disturbance events that have occurred across the study area provide an unprecedented opportunity to employ advanced mechanization systems. Monitoring their effects, at both the small and large scales, enhances their integration into regular forest management practices when operations return to more conventional management conditions. Furthermore, new methods of landscape ecology provide forest supply chain advanced possibilities to support decisions, tackling forest transportation and routing according to different landscape patterns and ground-collected data [65]. To address the growing challenge of extreme events, the implementation of such data facilitates the creation of a complex decision-making environment, allowing for adaptive operational choices in forest management and improving the connection of ecological, economic, and social objectives at the forest site scale. This approach ensures a more holistic management framework, contributing to the resilience and sustainability of forest ecosystems in the face of climate variability.

Author Contributions

Conceptualization, N.D.M. and D.I.; methodology, S.G.; software, D.I.; validation, N.D.M., D.I. and L.M.; formal analysis, L.M.; investigation, N.D.M., D.I. and L.M.; resources, S.G.; data curation, N.D.M. and D.I.; writing—original draft preparation, N.D.M. and D.I.; writing—review and editing, N.D.M., D.I., S.G. and L.M.; supervision, S.G.; project administration, S.G.; funding acquisition, S.G. All authors have read and agreed to the published version of the manuscript.

Funding

European Union Next-Generation EU (Piano Nazionale di Ripresa e Resilienza—PNRR Missione 4 Componente 2, Investimento 1.5 D.D. 1058 23 June 2022, ECS_00000043).

Data Availability Statement

The dataset supporting the findings of this study has been deposited in the University of Padua Research Data Repository and is openly accessible at the following URL: https://researchdata.cab.unipd.it/id/eprint/1543 (accessed on 12 March 2025) under the terms and conditions specified in the repository, and is intended to support transparency and reproducibility of the research.

Acknowledgments

N.D.M. contributed to this publication under the LERH PhD School of the University of Padova; D.I. and S.G. contributed to the publication under the PNRR research activities of the consortium iNEST (Interconnected North–East Innovation Ecosystem), funded by the European Union Next-Generation EU (Piano Nazionale di Ripresa e Resilienza (PNRR) Missione 4 Componente 2, Investimento 1.5 D.D. 1058 23 June 2022, ECS_00000043). This manuscript reflects only the authors’ views and opinions; neither the European Union nor the European Commission can be considered responsible for them.

Conflicts of Interest

The authors declare no conflicts of interest.

References

  1. MCPFE. State of Europe’s Forests 2015; MCPFE: Zvolen, Slovakia, 2015; Volume 1. [Google Scholar]
  2. Williams, J.W.; Burke, K.D. Past abrupt changes in climate and terrestrial ecosystems. In Biodiversity and Climate Change: Transforming the Biosphere; Yale University Press: New Haven, CT, USA, 2019. [Google Scholar] [CrossRef]
  3. Lindner, M.; Maroschek, M.; Netherer, S.; Kremer, A.; Barbati, A.; Garcia-Gonzalo, J.; Seidl, R.; Delzon, S.; Corona, P.; Kolström, M.; et al. Climate change impacts, adaptive capacity, and vulnerability of European forest ecosystems. For. Ecol. Manag. 2010, 259, 698–709. [Google Scholar] [CrossRef]
  4. Udali, A.; Andrighetto, N.; Grigolato, S.; Gatto, P. Economic impacts of forest storms—Taking stock of after-vaia situation of local roundwood markets in northeastern italy. Forests 2021, 12, 414. [Google Scholar] [CrossRef]
  5. Romagnoli, F.; Masiero, M.; Secco, L. Windstorm Impacts on Forest-Related Socio-Ecological Systems: An Analysis from a Socio-Economic and Institutional Perspective. Forests 2022, 13, 939. [Google Scholar] [CrossRef]
  6. Motta, R.; Ascoli, D.; Corona, P.; Marchetti, M.; Vacchiano, G. Selvicoltura e schianti da vento. Il caso della “tempesta Vaia”. Forest@ 2018, 15, 94–98. [Google Scholar] [CrossRef]
  7. Bussotti, F.; Papitto, G.; Di Martino, D.; Cocciufa, C.; Cindolo, C.; Cenni, E.; Bettini, D.; Iacopetti, G.; Pollastrini, M. Are the conditions of the Italian forests worsening due to extreme climatic events? Evidence from the national monitoring networks ICP Forests—CON. ECO.FOR. Forest@—Riv. Di Selvic. Ed Ecol. For. 2022, 19, 74–81. [Google Scholar] [CrossRef]
  8. Forzieri, G.; Girardello, M.; Ceccherini, G.; Spinoni, J.; Feyen, L.; Hartmann, H.; Beck, P.S.A.; Camps-Valls, G.; Chirici, G.; Mauri, A.; et al. Emergent vulnerability to climate-driven disturbances in European forests. Nat. Commun. 2021, 12, 1081. [Google Scholar] [CrossRef]
  9. Romagnoli, F.; Cadei, A.; Costa, M.; Marangon, D.; Pellegrini, G.; Nardi, D.; Masiero, M.; Secco, L.; Grigolato, S.; Lingua, E.; et al. Windstorm impacts on European forest-related systems: An interdisciplinary perspective. For. Ecol. Manag. 2023, 541, 121048. [Google Scholar] [CrossRef]
  10. IPCC. Climate Change 2022—Impacts, Adaptation and Vulnerability; IPCC: Geneva, Switzerland, 2023. [Google Scholar] [CrossRef]
  11. Sommerfeld, A.; Senf, C.; Buma, B.; D’Amato, A.W.; Després, T.; Díaz-Hormazábal, I.; Fraver, S.; Frelich, L.E.; Gutiérrez, Á.G.; Hart, S.J.; et al. Patterns and drivers of recent disturbances across the temperate forest biome. Nat. Commun. 2018, 9, 4355. [Google Scholar] [CrossRef] [PubMed]
  12. Senf, C.; Seidl, R. Mapping the forest disturbance regimes of Europe. Nat. Sustain. 2021, 4, 63–70. [Google Scholar] [CrossRef]
  13. Senf, C.; Seidl, R. Storm and fire disturbances in Europe: Distribution and trends. Glob. Change Biol. 2021, 27, 3605–3619. [Google Scholar] [CrossRef]
  14. Kotlarski, S.; Gobiet, A.; Morin, S.; Olefs, M.; Rajczak, J.; Samacoïts, R. 21st Century alpine climate change. Clim. Dyn. 2023, 60, 65–86. [Google Scholar] [CrossRef]
  15. Seidl, R.; Thom, D.; Kautz, M.; Martin-Benito, D.; Peltoniemi, M.; Vacchiano, G.; Wild, J.; Ascoli, D.; Petr, M.; Honkaniemi, J.; et al. Forest disturbances under climate change. Nat. Clim. Change 2017, 7, 395–402. [Google Scholar] [CrossRef] [PubMed]
  16. Grilli, G.; Jonkisz, J.; Ciolli, M.; Lesinski, J. Mixed forests and ecosystem services: Investigating stakeholders’ perceptions in a case study in the Polish Carpathians. For. Policy Econ. 2016, 66, 11–17. [Google Scholar] [CrossRef]
  17. Schmiegelow, F.K.A.; Stepnisky, D.P.; Stambaugh, C.A.; Koivula, M. Reconciling salvage logging of boreal forests with a natural-disturbance management model. Conserv. Biol. 2006, 20, 971–983. [Google Scholar] [CrossRef]
  18. Marangon, D.; Betetto, C.; Wohlgemuth, T.; Cadez, L.; Alberti, G.; Tomelleri, E.; Lingua, E. Impact of salvage logging on short-term natural regeneration in montane forests of the Alps after large windthrow events. For. Ecol. Manag. 2024, 567, 122085. [Google Scholar] [CrossRef]
  19. Piazza, N.; Bebi, P.; Vacchiano, G.; Rigling, A.; Wohlgemuth, T.; Bottero, A. Post-windthrow forest development in spruce-dominated mountain forests in Central Europe. For. Ecol. Manag. 2024, 561, 121884. [Google Scholar] [CrossRef]
  20. Li, J.; Morimoto, J.; Hotta, W.; Suzuki, S.N.; Owari, T.; Toyoshima, M.; Nakamura, F. The 30-year impact of post-windthrow management on the forest regeneration process in northern Japan. Landsc. Ecol. Eng. 2023, 19, 227–242. [Google Scholar] [CrossRef]
  21. Thorn, S.; Bässler, C.; Brandl, R.; Burton, P.J.; Cahall, R.; Campbell, J.L.; Castro, J.; Choi, C.Y.; Cobb, T.; Donato, D.C.; et al. Impacts of salvage logging on biodiversity: A meta-analysis. J. Appl. Ecol. 2018, 55, 279–289. [Google Scholar] [CrossRef]
  22. Lindenmayer, D.B.; Noss, R.F. Salvage logging, ecosystem processes, and biodiversity conservation. Conserv. Biol. 2006, 20, 949–958. [Google Scholar] [CrossRef]
  23. Bozzini, A.; Francini, S.; Chirici, G.; Battisti, A.; Faccoli, M. Spruce Bark Beetle Outbreak Prediction through Automatic Classification of Sentinel-2 Imagery. Forests 2023, 14, 1116. [Google Scholar] [CrossRef]
  24. Mezei, P.; Grodzki, W.; Blaženec, M.; Škvarenina, J.; Brandysova, V.; Jakuš, R. Host and site factors affecting tree mortality caused by the spruce bark beetle (Ips typographus) in mountainous conditions. For. Ecol. Manag. 2014, 331, 196–207. [Google Scholar] [CrossRef]
  25. Udali, A.; Garollo, L.; Lingua, E.; Cavalli, R.; Grigolato, S. Logging Residue Assessment in Salvage Logging Areas: A Case Study in the North-Eastern Italian Alps. South-East. Eur. For. 2023, 14, 69–81. [Google Scholar] [CrossRef]
  26. Stare, D.; Grošelj, P.; Pezdevšek Malovrh, Š. Decision Support Framework for Evaluating The Barriers To Salvage Logging: A Case Study on Private Forest Management in Slovenia. Environ. Manag. 2023, 71, 718–729. [Google Scholar] [CrossRef] [PubMed]
  27. Riguelle, S.; Hébert, J.; Jourez, B. Integrated and systemic management of storm damage by the forest-based sector and public authorities. Ann. For. Sci. 2016, 73, 585–600. [Google Scholar] [CrossRef]
  28. Petucco, C.; Andrés-Domenech, P.; Duband, L. Cut or keep: What should a forest owner do after a windthrow? For. Ecol. Manag. 2020, 461, 117866. [Google Scholar] [CrossRef]
  29. Sanginés de Cárcer, P.; Mederski, P.S.; Magagnotti, N.; Spinelli, R.; Engler, B.; Seidl, R.; Eriksson, A.; Eggers, J.; Bont, L.G.; Schweier, J. The Management Response to Wind Disturbances in European Forests. Curr. For. Rep. 2021, 7, 167–180. [Google Scholar] [CrossRef]
  30. Zerbe, S. Forests. In Restoration of Ecosystems–Bridging Nature and Humans: A Transdisciplinary Approach; Springer: Berlin/Heidelberg, Germany, 2023; pp. 107–152. [Google Scholar]
  31. Brang, P.; Spathelf, P.; Larsen, J.B.; Bauhus, J.; Bončína, A.; Chauvin, C.; Drössler, L.; García-Güemes, C.; Heiri, C.; Kerr, G.; et al. Suitability of close-to-nature silviculture for adapting temperate European forests to climate change. Forestry 2014, 87, 492–503. [Google Scholar] [CrossRef]
  32. Teich, M.; Accastello, C.; Perzl, F.; Berger, F. Protective Forests for Ecosystem-based Disaster Risk Reduction (Eco-DRR) in the Alpine Space. In Protective Forests as Ecosystem-Based Solution for Disaster Risk Reduction (Eco-DRR); IntechOpen: London, UK, 2022. [Google Scholar] [CrossRef]
  33. Remeš, J. Development and present state of close-to-nature silviculture. J. Landsc. Ecol. 2018, 11, 17–32. [Google Scholar] [CrossRef]
  34. Chirici, G.; Giannetti, F.; Travaglini, D.; Nocentini, S.; Francini, S.; D’Amico, G.; Calvo, E.; Fasolini, D.; Broll, M.; Maistrelli, F.; et al. Forest damage inventory after the “Vaia” storm in Italy. Forest@—Riv. Di Selvic. Ed Ecol. For. 2019, 16, 3–9. [Google Scholar] [CrossRef]
  35. Virot, E.; Ponomarenko, A.; Dehandschoewercker; Quéré, D.; Clanet, C. Critical wind speed at which trees break. Phys. Rev. E 2016, 93, 023001. [Google Scholar] [CrossRef]
  36. Gardiner, B.; Schuck, A.; Schelhaas, M.J.; Orazio, C.; Blennow, K.; Nicoll, B. Living with Storm Damage to Forests; European Forest Institute: Joensuu, Finland, 2013. [Google Scholar]
  37. Mitchell, S.J.; Ruel, J.C. Modeling windthrow at stand and landscape scales. In Simulation Modeling of Forest Landscape Disturbances; Springer: Cham, Switzerland, 2015. [Google Scholar] [CrossRef]
  38. Faccoli, M.; Finozzi, V.; Andriolo, A.; Bernardinelli, I.; Salvadori, C.; Deganutti, L.; Battisti, A. Il bostrico tipografo sulle Alpi orientali. Evoluzione, gestione e prospettive future dopo Vaia. Sherwood For. Ed Alberi Oggi 2022, 257, 23–26. [Google Scholar]
  39. Nardi, D.; Finozzi, V.; Battisti, A. Massive windfalls boost an ongoing spruce bark beetle outbreak in the Southern Alps. L’Italia For. E Mont. 2022, 77, 23–34. [Google Scholar] [CrossRef]
  40. Lingua, E.; Richter, P.; Faes, L.; Berger, F.; Garbarino, M.; Marzano, R. Natural disturbances and protective forests: The effects of cascading and compound hazards after the storm VAIA (Northeastern Italy). In Proceedings of the Copernicus Meetings, Vienna, Austria, 14–19 April 2024. [Google Scholar]
  41. Hlásny, T.; König, L.; Krokene, P.; Lindner, M.; Montagné-Huck, C.; Müller, J.; Qin, H.; Raffa, K.F.; Schelhaas, M.J.; Svoboda, M.; et al. Bark Beetle Outbreaks in Europe: State of Knowledge and Ways Forward for Management. Curr. For. Rep. 2021, 7, 138–165. [Google Scholar] [CrossRef]
  42. Pucher, C.; Erber, G.; Hasenauer, H. Europe’s Potential Wood Supply by Harvesting System. Forests 2023, 14, 398. [Google Scholar] [CrossRef]
  43. Äijälä, O.; Koistinen, A.; Sved, J.; Vanhatalo, K.; Väisänen, P. Metsänhoidon suositukset [best practices for forest management]. Hels. Tapion Julk. 2019, 252. [Google Scholar]
  44. Hoffmann, S.; Schönauer, M.; Heppelmann, J.; Asikainen, A.; Cacot, E.; Eberhard, B.; Hasenauer, H.; Ivanovs, J.; Jaeger, D.; Lazdins, A.; et al. Trafficability Prediction Using Depth-to-Water Maps: The Status of Application in Northern and Central European Forestry. Curr. For. Rep. 2022, 8, 55–71. [Google Scholar] [CrossRef]
  45. Murphy, P.N.C.; Ogilvie, J.; Castonguay, M.; Zhang, C.F.; Meng, F.R.; Arp, P.A. Improving forest operations planning through high-resolution flow-channel and wet-areas mapping. For. Chron. 2008, 84, 568–574. [Google Scholar] [CrossRef]
  46. White, B.; Ogilvie, J.; Campbell, D.M.H.; Hiltz, D.; Gauthier, B.; Chisholm, H.K.; Wen, H.K.; Murphy, P.N.C.; Arp, P.A. Using the cartographic depth-to-water index to locate small streams and associated wet areas across landscapes. Can. Water Resour. J. 2012, 37, 333–347. [Google Scholar] [CrossRef]
  47. Labelle, E.R.; Hansson, L.; Högbom, L.; Jourgholami, M.; Laschi, A. Strategies to Mitigate the Effects of Soil Physical Disturbances Caused by Forest Machinery: A Comprehensive Review. Curr. For. Rep. 2022, 8, 20–37. [Google Scholar] [CrossRef]
  48. Latterini, F.; Venanzi, R.; Tocci, D.; Picchio, R. Depth-to-Water Maps to Identify Soil Areas That Are Potentially Sensitive to Logging Disturbance: Initial Evaluations in the Mediterranean Forest Context. Land 2022, 11, 709. [Google Scholar] [CrossRef]
  49. Murphy, P.N.C.; Ogilvie, J.; Connor, K.; Arp, P.A. Mapping wetlands: A comparison of two different approaches for New Brunswick, Canada. Wetlands 2007, 27, 846–854. [Google Scholar] [CrossRef]
  50. Schönauer, M.; Väätäinen, K.; Prinz, R.; Lindeman, H.; Pszenny, D.; Jansen, M.; Maack, J.; Talbot, B.; Astrup, R.; Jaeger, D. Spatio-temporal prediction of soil moisture and soil strength by depth-to-water maps. Int. J. Appl. Earth Obs. Geoinf. 2021, 105, 102614. [Google Scholar] [CrossRef]
  51. Larson, J.; Lidberg, W.; Ågren, A.M.; Laudon, H. Predicting soil moisture conditions across a heterogeneous boreal catchment using terrain indices. Hydrol. Earth Syst. Sci. 2022, 26, 4837–4851. [Google Scholar] [CrossRef]
  52. Schönauer, M.; Hoffmann, S.; Maack, J.; Jansen, M.; Jaeger, D. Comparison of selected terramechanical test procedures and cartographic indices to predict rutting caused by machine traffic during a cut-to-length thinning-operation. Forests 2021, 12, 113. [Google Scholar] [CrossRef]
  53. Amishev, D.; Hunt, J. Winch-Assist Harvester: Best Practice Manual; FPInnovations: Vancouver, BC, Canada, 2018; Volume SP-533, ISBN 9780864885784. [Google Scholar]
  54. Dvořák, J.; Bystrický, R.; Hošková, P.; Hrib, M.; Jarkovská, M.; Kováč, J.; Krilek, J.; Natov, P.; Natovová, L. The Use of Harvester Technology in Production Forests; Lesnická práce: Prague, Czech Republic, 2011; ISBN 978-80-7458-018-5. [Google Scholar]
  55. Berendt, F.; Tolosana, E.; Hoffmann, S.; Alonso, P.; Schweier, J. Harvester productivity in inclined terrain with extended machine operating trail intervals: A german case study comparison of standing and bunched trees. Sustainability 2020, 12, 9168. [Google Scholar] [CrossRef]
  56. Solgi, A.; Lotfalian, M.; Rafiei, A.A.; Marchi, E.; Ilstedt, U. Combined effects of traffic intensity, skid trail slope, skidder type, and soil moisture content on soil degradation in the Hyrcanian forest of Iran. Int. J. For. Eng. 2023, 34, 385–396. [Google Scholar] [CrossRef]
  57. Sadeghi, S.; Solgi, A.; Tsioras, P.A. Effects of traffic intensity and travel speed on forest soil disturbance at different soil moisture conditions. Int. J. For. Eng. 2022, 33, 146–154. [Google Scholar] [CrossRef]
  58. Kim, I.; Seo, J.; Woo, H.; Choi, B. Assessing Rutting and Soil Compaction Caused by Wood Extraction Using Traditional and Remote Sensing Methods. Forests 2025, 16, 86. [Google Scholar] [CrossRef]
  59. Solgi, A.; Naghdi, R.; Labelle, E.R.; Tsioras, P.A.; Nikooy, M. Effect of varying machine ground pressure and traffic frequency on the physical properties of clay loam soils located in mountainous forests. Int. J. For. Eng. 2016, 27, 161–168. [Google Scholar] [CrossRef]
  60. Parsakhoo, A.; Mostafa, M.; Shataee, S.; Lotfalian, M. Decision support system to find a skid trail network for extracting marked trees. J. For. Sci. 2017, 63, 62–69. [Google Scholar] [CrossRef]
  61. Ring, E.; Andersson, M.; Hansson, L.; Jansson, G.; Högbom, L. Logging mats and logging residue as ground protection during forwarder traffic along till hillslopes. Croat. J. For. Eng. 2021, 42, 445–462. [Google Scholar] [CrossRef]
  62. Mohtashami, S.; Eliasson, L.; Hansson, L.; Willén, E.; Thierfelder, T.; Nordfjell, T. Evaluating the effect of DEM resolution on performance of cartographic depth-to-water maps, for planning logging operations. Int. J. Appl. Earth Obs. Geoinf. 2022, 108, 102728. [Google Scholar] [CrossRef]
  63. Balestra, M.; Marselis, S.; Sankey, T.T.; Cabo, C.; Liang, X.; Mokroš, M.; Peng, X.; Singh, A.; Stereńczak, K.; Vega, C.; et al. LiDAR Data Fusion to Improve Forest Attribute Estimates: A Review. Curr. For. Rep. 2024, 10, 281–297. [Google Scholar] [CrossRef]
  64. Shi, Y.; Wang, T.; Skidmore, A.K.; Heurich, M. Improving LiDAR-based tree species mapping in Central European mixed forests using multi-temporal digital aerial colour-infrared photographs. Int. J. Appl. Earth Obs. Geoinf. 2020, 84, 101970. [Google Scholar] [CrossRef]
  65. Stupariu, M.S.; Cushman, S.A.; Pleşoianu, A.I.; Pătru-Stupariu, I.; Fürst, C. Machine learning in landscape ecological analysis: A review of recent approaches. Landsc. Ecol. 2022, 37, 1227–1250. [Google Scholar] [CrossRef]
Figure 1. Study plots with regional boundaries (black lines) and detail of digitized logging trails and landing area.
Forests 16 00673 g001
Figure 2. The highly mechanized cut-to-length system consists of two machines: the harvester (a), which fells trees or, in the case of windthrown trees, detaches the stem from the stump, and performs the operations of delimbing and processing the stem into logs; and the forwarder (b), which loads and transports the wood logs (via logging trails) to the landing at the forest roadside.
Forests 16 00673 g002
Figure 3. Alignment of track slope and terrain slope across 5% intervals, demonstrating convergence at steeper slopes within the central 30%–50% range.
Forests 16 00673 g003
Figure 4. Classification of logging trail into 5% slope classes.
Forests 16 00673 g004
Figure 5. Heatmap showing four variables across forest sites (C01 to C29). The variables include: (1) mean slope of the study area, (2) percentage of trafficked area impacted by forestry machinery (harvesters and forwarders) on logging trails, (3) mean slope of extraction trails, and (4) area with a slope below 30%, accessible to machinery without additional aids (such as track extensions, required on slopes between 30% and 60%).
Forests 16 00673 g005
Table 1. Forest sites and species compositions. The dominant tree species is spruce (RS), while other secondary tree species are fir (WS), larch (LA), Scots pine (SP), arolla pine (AP), BP black pine (BP), beech (BE), birch (B), chestnut (CT), and oak (OA).
PlotLat/Long Coord.Area (ha)Slope (%)Elevation (m a.s.l.)Tree Species
C015,091,793 N 680,192 E6.8629.131430RS/WS/BE
C025,090,400 N 680,908 E14.6324.401475RS/WS/LA/BE
C035,092,042 N 682,541 E21.6623.791290RS/WS/LA/AP
C045,135,719 N 691,033 E40.5120.401719RS/WS/BE
C055,135,421N 689,841 E68.3720.321910RS/WS/BE
C065,122,385 N 685,326 E33.1831.781230RS/WS/LA/BE
C075,112,063 N 672,520 E22.8522.861029RS/CT/OA
C085,112,636 N 673,345 E25.0920.881116RS/WS/BE
C095,094,997 N 702,085 E83.7723.441348RS/WS/BE
C105,094,371 N 700,705 E37.1217.711387RS/WS/LA/AP
C115,097,097 N 700,957 E106.5829.611381RS/WS/LA/BE
C125,109,221 N 669,772 E31.3732.02909RS/WS/LA/SP
C135,093,814 N 699,963 E20.3117.601401RS/WS/BE
C145,092,381 N 686,677 E6.8331.821468RS/WS/BE
C155,091,544 N 699,835 E51.0723.581483RS/WS/BE
C165,092,541 N 700,058 E60.8117.961492RS/WS/BE
C175,092,081 N 700,081 E18.6119.101391RS/WS/BE
C185,092,775 N 700,809 E43.8813.731423RS/WS/BE
C195,092,254 N 701,254 E44.3317.431329RS/WS/BE
C205,091,682 N 700,720 E112.5819.481365RS/WS/BE
C215,091,141 N 701,854 E51.0021.301346RS/WS/BE
C225,091,016 N 704,077 E12.6732.911451RS/WS/BE
C235,091,856 N 703,665 E81.9533.221397RS/WS/BE
C245,091,016 N 704,077 E11.3529.531464RS/WS/BE
C255,093,105 N 704,822 E17.4232.311311RS/WS/BE
C265,092,626 N 704,834 E22.8736.751290RS/WS/BE
C275,090,811 N 703,250 E3.2935.821337RS/WS/BE
C285,086,246 N 686,046 E10.6729.841252RS/WS/BE
C295,084,211 N 688,111 E16.2931.401315RS/WS/BE
Table 2. Different scenarios for depth-to-water analysis.
CombinationDWT—025 haDWT—1 haDescription
0NONONon-sensitive area
1YESNOSensitive areas during wet periods
2YESYESWet area
Disclaimer/Publisher’s Note: The statements, opinions and data contained in all publications are solely those of the individual author(s) and contributor(s) and not of MDPI and/or the editor(s). MDPI and/or the editor(s) disclaim responsibility for any injury to people or property resulting from any ideas, methods, instructions or products referred to in the content.

