Abstract
Urban parks serve as essential carbon sinks in cities, mitigating climate change by sequestering atmospheric CO2. Maximizing the carbon sequestration potential within constrained urban spaces is a critical step toward carbon neutrality. However, few studies have systematically examined how the internal spatial composition and shape of green spaces affect their vegetation carbon sequestration capacity. This study analyzes the relationship between landscape indices and vegetation carbon sequestration density (VCSD) using field surveys and high-resolution remote sensing data from 123 urban parks in Zhengzhou, China. The results indicate that Zhengzhou’s parks sequester 14.03 Gg C yr−1, with a VCSD of 0.53 kg C m−2 yr−1. Significant differences in VCSD were observed among park types, with theme parks having the highest average VCSD (0.69 kg C m−2 yr−1) and community parks the lowest (0.43 kg C m−2 yr−1). The key drivers primarily consist of landscape indices that characterize green space distribution and configuration, including the proportion of green space (Pg), largest green patch index (LPI), number of green patches (NP), green patch dispersion index (SPL), and landscape shape index (LSI), with specific thresholds identified for each. Based on these findings, category-specific spatial composition strategies are proposed to precisely enhance the carbon sequestration of park vegetation. This study provides actionable guidance for urban park designers to maximize the carbon sequestration potential of green spaces, thereby mitigating climate change and promoting human health and well-being through green space design.
1. Introduction
As one of the most populous nations globally, China is undergoing rapid urbanization. Its urban population comprised 59% of its total population in 2018 and is expected to increase by 255 million by 2050 []. Concurrently, China’s urban impervious surface area expanded by 3.6 times between 1978 and 2017 [,]. This sharp rise in population and urban impervious surfaces has directly led to substantial CO2 emissions, contributing to increasingly severe global climate change []. Predictions indicate that global temperatures may rise by approximately 1.4 to 5.8 °C over the next century [,]. Urban areas, being hotspots of human activity and major sources of carbon emissions, play a pivotal role in environmental impact [,,]. Currently, lowering CO2 emissions and strengthening urban carbon sinks are broadly acknowledged as essential strategies for addressing global climate change [,]. Green plants can absorb atmospheric CO2 and fix it through photosynthesis, thus reducing the concentration of CO2 in the atmosphere [,,]. Urban parks, as key natural components of urban ecosystems, play a significant role in offsetting CO2 emissions from fossil fuel combustion and in regulating the global carbon cycle [,,]. Studies have shown that urban green spaces in Hangzhou offset 18.57% of the city’s annual industrial carbon emissions []. Seoul’s parks sequester 20.2 tons of carbon annually, offsetting about 2.3% of the city’s total carbon emissions from gasoline consumption, with an economic value of USD 7.1 million per year []. Moreover, the vegetation carbon sequestration benefits of urban parks vary among cities, with average vegetation carbon density in parks in Beijing, Seoul, and Dhaka being 2.6 kg C m−2yr−1, 0.35 kg C m−2yr−1 and 0.53 kg C m−2yr−1, respectively [,,]. Therefore, translating research on high-carbon-sequestering parks into design language through rational and scientific planning to support urban green development has become an unavoidable contemporary issue [,,].
Existing studies have examined the factors influencing vegetation carbon sequestration in urban parks, such as climate conditions, socio-economic factors, and plant species composition. For instance, Yunfang Jiang’s simulation study on the carbon cycle determined that relative humidity, temperature, and wind speed significantly impact the carbon cycling of green spaces []. Jian Lin’s research in New York City revealed a negative correlation between carbon density, urban development intensity, and socio-economic deprivation []. In Xi’an, China, Liyixuan Fan found that the plant communities in urban green spaces significantly affect parks’ carbon sequestration capabilities []. However, few studies have systematically explored the impact of parks’ internal spatial composition on their carbon vegetation sequestration abilities. Spatial composition is often quantified using landscape pattern indices, which represent a wide range of quantitative indicators of spatial heterogeneity, such as patch types, features, and landscape mosaics [,,,]. Utilizing these landscape pattern indices, the internal spatial composition and landscape configuration of parks can be accurately quantified and analyzed. A thorough analysis of the relationship between parks’ vegetation carbon sequestration capabilities and landscape pattern indices can provide a scientific basis for enhancing park vegetation carbon sequestration and sustainable urban development.
As the central hub of the Central Plains Urban Agglomeration in China, Zhengzhou is encountering significant urban climate challenges due to rapid urbanization. Strengthening the carbon sequestration potential of urban park vegetation and formulating scientifically grounded spatial planning strategies have become essential for promoting sustainable urban growth []. This study has the following aims: (1) to quantify the carbon sequestration capacity of woody and shrubby vegetation in Zhengzhou’s parks and analyze the heterogeneity of vegetation carbon sequestration capacities among different park types; (2) to analyze the relationship between parks’ vegetation carbon sequestration capacity and park spatial composition; and (3) to explore spatial composition optimization strategies and models for enhancing vegetation carbon sequestration in urban parks.
2. Materials and Methods
The study’s workflow is illustrated in Figure 1. The research was conducted in three main phases: (1) Vegetation carbon sequestration estimation: Field survey data and the i-Tree Eco model were used to quantify the carbon sequestration capacity of urban parks, while GF-2 remote sensing imagery was utilized to extract land use information and characterize park spatial structure. (2) Relationship analysis: Correlation analysis and Boosted Regression Trees (BRTs) were applied to examine the relationship between carbon sequestration capacity and landscape structure. (3) Spatial optimization strategy: Based on the findings, a spatial enhancement strategy was proposed to optimize park design for improved carbon sequestration.
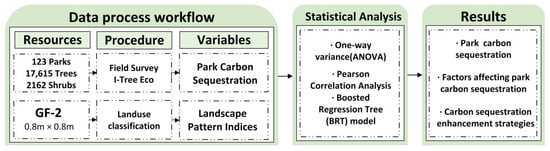
Figure 1.
Flowchart of the study.
2.1. Study Area
Zhengzhou, a typical rapidly urbanizing region in China (112°42′–114°14′ E, 34°16′–34°58′ N), is the core megacity of the Central Plains Urban Agglomeration. As the capital of Henan Province, Zhengzhou spans a total area of 7567 km2 and had a resident population of 12.74 million in 2021. The city also contains approximately 130.58 km2 of parkland area []. Zhengzhou has a continental monsoon climate in the north temperate zone, with an average annual temperature of 14.7 °C and an average annual precipitation of 632 mm. Over the past 30 years, Zhengzhou has undergone dramatic urbanization: urban construction land area has grown by 346.57% and population by 226.19%, and the urbanization rate reached 79.1% in 2021 [,].
A total of 123 parks were randomly chosen as study sites (Figure 2). These parks are distributed throughout the Jinshui, Erqi, Huiji, Zhongyuan, and Guncheng districts in the central zone of Zhengzhou, completely covering all park categories and sizes in Zhengzhou.
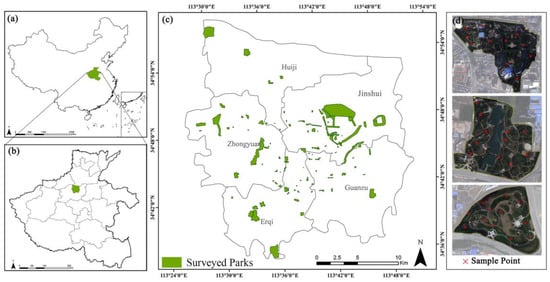
Figure 2.
Location of the study area and vegetation sample plots in Zhengzhou, China. (a): Location of Henan Province in China; (b): location of Zhengzhou Central City within Henan Province; (c): distribution of 123 surveyed urban parks (in green) across five central districts of Zhengzhou; (d) aerial imagery of selected example parks showing sample plots marked with red crosses (×).
2.2. Remote Sensing Data
To analyze the landscape patterns of urban parks, cloud-free GF-2 satellite imagery with a high spatial resolution of 0.8 m, captured in August 2018, was utilized in this study. Firstly, preprocessing operations such as radiometric calibration, atmospheric correction, orthorectification, and image fusion were conducted in ENVI 5.3 to improve data accuracy. Then, an object-based method was used for land use information extraction. In this study, land use information was categorized into four types: vegetation (green spaces), impervious surfaces (including transportation networks, industrial, commercial, and residential areas), water bodies (lakes and rivers), and bare soil (construction sites and non-vegetated areas). The classification achieved an overall accuracy of 89%, demonstrating high reliability.
Studying park classifications facilitates the detailed formulation of optimization strategies. This study categorized parks based on the “Urban Green Space Classification Standard” (CJJ/T85-2017) into comprehensive parks, community parks, theme parks, and recreational parks (Table 1).

Table 1.
Park classification criteria and description.
2.3. Field Vegetation Survey
Measurements were taken in 123 parks in Zhengzhou to estimate vegetation carbon sequestration. The sampling locations in this study were determined using a random generation method. The “Create Random Points” tool in ArcGIS was used to randomly create points, and areas of approximately 400 m2 were created around these points as sample plots (Figure 2d). A standard of one sample plot per 2.5 ha was used within each park, with a maximum of 25 sample plots and a minimum of one sample plot. Field surveys were conducted and completed in July 2021. The survey content included the following: (1) trees: species, diameter at breast height (DBH, defined as the diameter of the trunk at 1.3 m above the ground), height (H), crown width (C); (2) shrubs: species, shrub height, shrub basal diameter, shrub crown width.
A total of 805 sample plots were surveyed, covering 17,626 trees belonging to 99 species, 69 genera, and 38 families. The dominant tree species in Zhengzhou’s urban parks were Ligustrum lucidum W.T.Aiton, Ginkgo biloba L., Cedrus deodara (Roxb.) G.Don, and Prunus cerasifera Ehrh. Additionally, 2162 shrubs were recorded across 140 species, 82 genera, and 44 families. The dominant shrub species included Photinia × fraseri Dress, Buxus megistophylla Levl., Ligustrum quihoui Carr., and Pittosporum tobira (Thunb.) W.T.Aiton (Table 2).
Table 2.
Dominant trees and shrubs species (Top 15) in the surveyed urban parks.
2.4. Vegetation Carbon Sequestration Estimation
In this study, the carbon sequestration capacity of trees was mainly calculated using the i-Tree Eco model, which is widely used for assessing the ecological benefits of individual trees [,,,]. Due to the relatively limited contribution of herbaceous plants to carbon sequestration, in this study carbon sequestration is defined as the amount of atmospheric carbon sequestered annually in woody and shrubby tissues (from CO2) []. The model calculates the carbon sequestration of each tree based on species-specific allometric growth equations, primarily based on data such as tree species, diameter at breast height (DBH), crown width, and crown width loss rate [,,]. The model selects the allometric growth equation based on the nearest principle, and for tree species without a specific allometric growth equation, the equation of a species in the same genus or family is used for the calculation. Since the original parameters of the model (meteorological, air quality, precipitation, climate zone, etc.) are not available for Zhengzhou City, Xianyang City, which has a similar climate, was selected as a reference city.
Shrub carbon sequestration was assessed using biomass measurements and conversion coefficients for carbon storage and sequestration. For the aboveground biomass of shrubs, estimation was performed using shrub-specific biomass models that were geographically close to or had similar research conditions to Zhengzhou City. For shrubs without corresponding biomass models, biomass models of shrub species in the same genus or family were considered. If no corresponding species were available, a standardized model for tree-like or typical shrubs was applied instead. The carbon storage of shrubs is calculated based on a conversion coefficient of 0.5 for carbon storage and biomass [,]. The conversion coefficient for shrub carbon storage and sequestration is determined based on the conversion ratios of carbon storage and sequestration in tree species from the same family in this study (Table 3). The calculation formula is as follows:
Table 3.
Modeling above-ground biomass of shrub monocultures.
In the formula, represents the carbon sequestration capacity of shrub species from family , measured in kilograms (kg); denotes the aboveground biomass of the shrub, also in kilograms (kg). refers to the conversion coefficient for carbon storage to carbon sequestration capacity for shrubs and trees of family (Table 4).
Table 4.
Shrub carbon storage and sequestration conversion factors.
The total carbon sequestration of a sample is determined by summing the carbon sequestration of all trees and shrubs within it, calculated using the following formula:
where is the amount of carbon sequestered in sample , is the amount of carbon sequestered by tree within the sample, is the amount of carbon sequestered by shrub within the sample, represents the number of trees in the sample, and denotes the number of shrubs in the sample. The park’s carbon sequestration was then calculated using the following formula:
where is the amount of carbon sequestered in park , is the sum of carbon sequestered in all sample sites within park , is the sum of green space area in all sample sites within park , and is the total green space area in park .
The final formula for determining the carbon sequestration density in parks is as follows:
where is the sequestration density of park , represents the total carbon sequestered in park , and denotes the total area of park .
2.5. Driving Factors and Statistical Analysis
Landscape indices quantify landscape pattern information, providing a comprehensive reflection of landscape composition, including the number, type, proportion, and spatial arrangement of landscape elements. The impact of urban landscape structure on urban green carbon sinks has been confirmed [,,].
Building on previous studies of landscape pattern indices in Zhengzhou City, this study selected 11 key landscape indices to quantify the spatial characteristics of park green spaces [,]. These indices include perimeter–area ratio (PERIM), Shannon’s evenness index (SHEI), percentage of green space in the landscape (Pg), percentage of impervious surface in the landscape (Pi), percentage of water bodies in the landscape (Pw), number of green space patches (NP), largest patch index (LPI), landscape shape index (LSI), mean patch area (AREA_MN), patch cohesion index (SPLIT), and aggregation index (AI). The meaning and graphical representation of each landscape index are shown in Table 5 and Figure 3. The calculation of landscape pattern indices was implemented using Fragstats 4.2 software https://www.fragstats.org (accessed on 8 January 2023).
Table 5.
Landscape Index and ecological connotations.
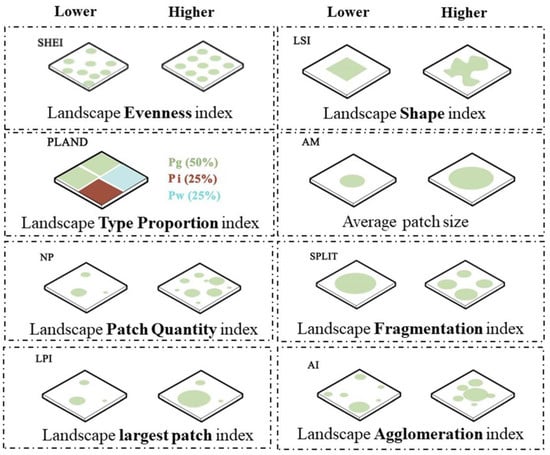
Figure 3.
Illustration of the significance of the Landscape Pattern Index.
To investigate variations in carbon sequestration among park vegetation and the factors influencing them, one-way analysis of variance (ANOVA), Pearson correlation analysis, and Boosted Regression Tree (BRT) models were utilized. ANOVA was conducted to assess significant differences in carbon sequestration by vegetation across various park categories, while Pearson correlation analysis was applied to examine the relationship between vegetation carbon sequestration and landscape pattern indices. The BRT model was employed to assess the interaction between vegetation carbon sequestration in parks and landscape patterns, determining the relative contribution of each variable to carbon sequestration in Zhengzhou’s parks. BRT is a machine learning method that develops multiple regression trees through iterative random selection and self-learning, ultimately producing a final regression tree through weighted optimization []. Unlike traditional linear regression models, BRT excels at capturing intricate nonlinear relationships between dependent and independent variables [,]. In recent times, BRT has been extensively applied across various research domains [,].The calculations for BRT were performed using R software 4.3.2 with the “dismo” package [], “gbm” package [], and “ggbrt” package []. The learning rate (0.01, 0.005, 0.001), tree complexity (2–6), and bag fraction (0.5, 0.75) were determined within a range based on previous experience and optimized through tenfold cross-validation [,,].
3. Results
3.1. Carbon Sequestration of Urban Parks
The total carbon sequestration in Zhengzhou City parks’ vegetation is 14.03 Gg C yr−1, with an average carbon sequestration of 0.11 Gg C yr−1 and an average VCSD of 0.53 kg C m−2 yr−1 (Table 6). There is significant heterogeneity in the vegetation carbon sequestration capacity of parks in Zhengzhou City. Specifically, the distribution of carbon sequestration and VCSD in Zhengzhou City parks ranged from 0.0008 to 2.28 Gg C yr−1 and 0.03 to 2.10 kg C m−2 yr−1, respectively. Without considering the differences in park area, the maximum difference in VCSD density between parks is 70 times.
Table 6.
Statistics on the vegetation carbon sequestration capacity of 123 parks in Zhengzhou.
Across various park types, the average VCSD distribution ranged from 0.43 to 0.69 kg C m−2 yr−1. Theme parks had the fewest numbers (13) but the highest average VCSD at 0.69 kg C m−2 yr−1. This was followed by recreational parks (21), comprehensive parks (52), and community parks (27), with average VCSD values of 0.60 kg C m−2 yr−1, 0.50 kg C m−2 yr−1, and 0.43 kg C m−2 yr−1, respectively. In terms of park area, comprehensive parks had the largest average area at 38.10 ha. Recreational parks had the smallest average area, at only 1.51 ha, with sizes ranging from 0.32 ha to 6.14 ha. Regarding the number of surveyed trees and shrubs, comprehensive parks, community parks, and theme parks had similar average counts: 189, 173, and 192, respectively. Recreational parks had the lowest average number of surveyed trees and shrubs, with only 22 (Figure 4).
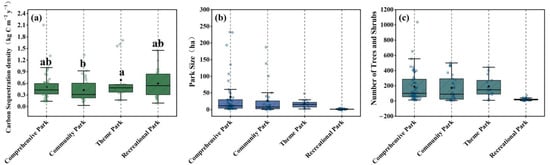
Figure 4.
Box plots illustrate the variation in (a) vegetation carbon sequestration density, (b) park size, and (c) the number of trees and shrubs among different types of parks in Zhengzhou. Letters “a”, “b”, and “ab” above the boxes indicate groups that are significantly different according to Fisher’s Least Significant Difference (LSD) test (p < 0.05). Park types sharing at least one letter are not significantly different from each other.
In addition, theme parks, despite being the least numerous, exhibit the highest average VCSD. According to the statistical analysis (Figure 4a), theme parks are significantly different from community parks, but not from comprehensive or recreational parks. Recreational parks, which are generally smaller in the area, also show relatively high average VCSD. Comprehensive parks have the largest number but do not show significantly higher VCSD compared to other categories.
3.2. Spatial Variation in Park Landscape Metrics
In the study of parks, the landscape pattern indices of different categories of parks also differed considerably (Figure 5). Specifically, the park perimeter index (PER) varied considerably, with a distribution ranging from 231.61 to 12,423.02 m and a mean value of 2073.53 m, with the largest perimeter being Longhu Park (12,423.02 m) and the smallest being Hanxiu Park (231.61 m). The distribution range of the Shannon Homogeneity Index (SHEI) was 0.27~0.95, with a mean value of 0.58. The distribution ranges of percentage of water (Pw), percentage of green space (Pg), and percentage of impervious surface (Pi) were 0%~44.30%, 16.49%~92.51%, and 2.47%~80.99%, respectively, with the largest mean value of 70.85% for Pw, followed by the largest for Pi and Pw with 21.14% and 5.18%, respectively. Among all the parks studied, Zheng Yuan had the largest Pg of 92.51% and Shang Yun Yuan had the smallest Pg of 16.49%. The distribution of the number of green space patches (NP) in all parks ranged from 1 to 756, with a large variation and a mean value of 41.49. The largest number of green space patches was in Cherry Gully Forest Park and the smallest was in Ancai Tour Park. The distribution of the maximum patch index (LPI) ranges from 2.50% to 92.67%, with the highest among the parks being Zheng Yuan and the lowest being Longhu Park. For the landscape shape index (LSI), the range of values was 1.50~42.33, with the highest value being for Longhu Park and the lowest being for Zheng Park. The average patch area (AM) varied between 0.01 and 3.60 ha, with the largest found in Flower Expo Park and the smallest in Shang Yun Park. The value of landscape dispersion index (SPL) ranges from 1.16 to 437.12, with the highest value being for Longhu Park and the lowest being for Zheng Park. The distribution range of the Agglomeration Index (AI) is 86.78%~99.52%, with the highest-value park being Kangshi Park and the lowest-value park being Shangyun Park. Overall, the distribution range of each landscape index varies greatly, with the maximum and minimum values mostly concentrated in Longhu Park, Zheng Park, and Shangyun Park (Table 7).
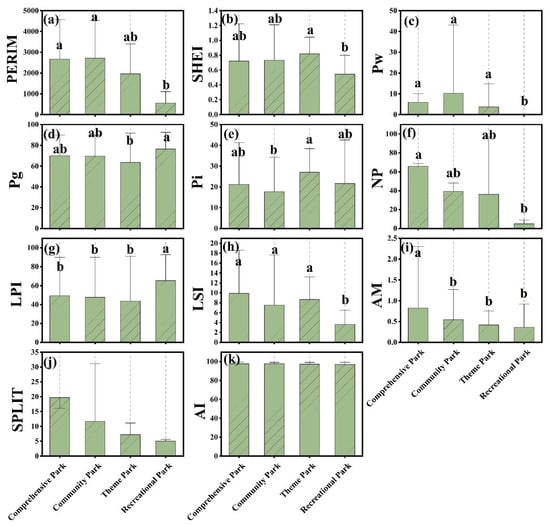
Figure 5.
Differences in landscape pattern indices among four types of urban parks in Zhengzhou (a–k). Letters “a”, “b”, and “ab” indicate statistically significant groupings based on Fisher’s Least Significant Difference (LSD) test (p < 0.05). Bars that share a letter are not significantly different.
Table 7.
Zhengzhou park green space landscape pattern index statistics.
In addition to this, each landscape index showed significant variability across categories, but the variability also varied across landscape indices (Figure 5).
Among the different park categories, PER was significantly higher for comprehensive parks and community parks than for recreational parks, and SHEI was significantly higher for theme parks than for recreational parks. The same trend was observed for Pw and LSI, both of which were significantly higher for comprehensive parks, community parks, and theme parks than for recreational parks. Pg was significantly higher for recreational parks than for theme parks, and Pi was significantly higher for theme parks than for community parks. For number of patches (NP), comprehensive parks were significantly higher than recreational parks. LPI was significantly higher for recreational parks than for the other three types of parks, whereas the opposite pattern was observed for LSI. In contrast, AM was significantly higher in comprehensive parks than in the other park types. The LSI of recreational parks was significantly lower than the other three types of parks. AM was significantly lower in comprehensive parks than in the other three categories. SPLIT and AI were not significantly different in the classification of parks of different natures.
3.3. Correlation Between Carbon Sequestration and Landscape Drivers Across Different Urban Park Types
Significant correlations between Zhengzhou’s landscape pattern indices and vegetation carbon sequestration density (VCSD) were found using correlation analysis, with substantial variations between park kinds (Figure 6). In general, VCSD was positively correlated by the aggregation index (AI), average patch area (AM), biggest patch index (LPI), and green space proportion (Pg). On the other hand, there were negative correlations with the number of patches (NP), splitting index (SPL), Shannon’s evenness index (SHEI), and landscape shape index (LSI).
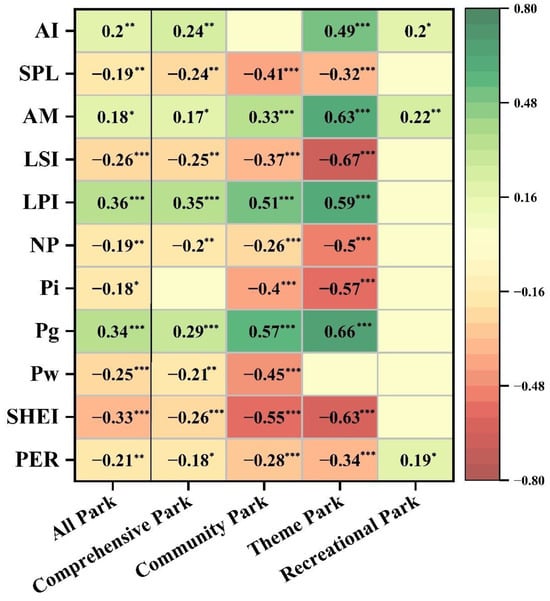
Figure 6.
Heatmaps illustrating the correlation coefficients between landscape pattern indices and vegetation carbon sequestration density (VCSD) across different park types. Asterisks indicate levels of statistical significance: p < 0.05 (*), p < 0.01 (**), and p < 0.001 (***). Cells without numbers indicate non-significant correlations (p ≥ 0.05).
The largest relationships between park types were seen in theme parks, which were especially noticeable in their positive correlations with AM (0.63) and Pg (0.66) and negative correlations with LSI (−0.67), SHEI (−0.63), and Pi (−0.57). Strong relationships were also seen in community parks, with Pg (0.57) and LPI (0.51) showing positive correlations with VCSD and SHEI (−0.55), and Pw (−0.45) having a negative effect.
The carbon sequestration density of vegetation was negatively correlated with SHEI (−0.26) and positively correlated with LPI (0.35) in comprehensive parks, which demonstrated moderate but significant relationships. Recreational parks, on the other hand, exhibited mild correlations overall, with AM (0.22), AI (0.20), and PER (0.19) exhibiting mildly positive connections with VCSD. This suggests that smaller recreational green spaces have different spatial dynamics.
These findings demonstrate how park spatial composition and structure have a major impact on vegetation carbon sequestration, underscoring the need for focused landscape optimization based on particular park attributes.
Based on the results of the correlation analysis, the relative importance of each influencing factor was quantified, and the top five indicators were visualized (Figure 7). The most important indicators for VCSD varied among park types, but overall, LSI, SHEI, LPI, NP, and Pg were found to be significant. In comprehensive parks, the top five indicators accounted for 60.2% of the total importance: LSI (13.8%), SPL (12.2%), LPI (11.8%), AI (11.5%), and AM (10.7%). For community parks, the five most influential landscape pattern indices were SHEI (35.9%), Pg (28.1%), NP (14.2%), LPI (8.78%), and AM (1.92%), totaling 91.9% of the total importance. Theme parks’ top five influencing factors accounted for 88.17% of the total importance, including LSI (25.9%), SHEI (23.1%), NP (15.4%), LPI (12.1%), and Pg (11.6%). The most important indicators for recreational parks were PER (44.5%), AI (36.6%), and AM (18.9%), accounting for 100% of the total importance.
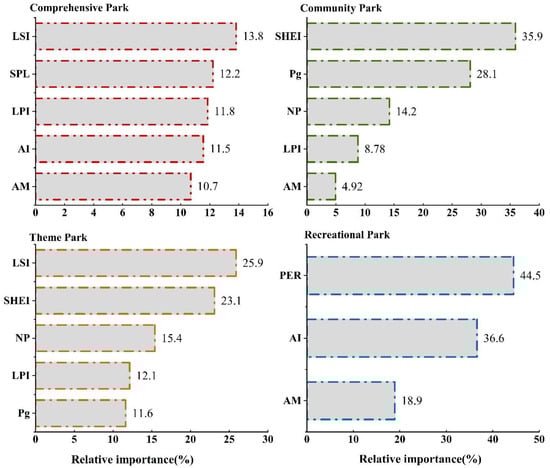
Figure 7.
Relative importance of factors influencing VCSD in different types of parks.
The identification and visualization of the marginal effects of dominant influencing landscape drivers are represented by the partial plot, showing how VCSD varies with each individual factor (Figure 8).
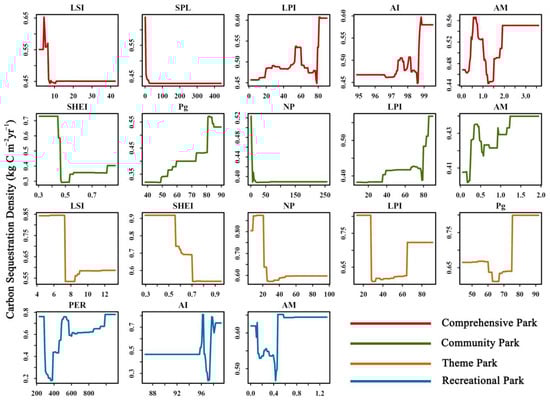
Figure 8.
Partial plots between VCSD and dominant influencing landscape drivers in different types of urban parks.
Specifically, for comprehensive parks, the five most influential indices all fluctuated around 0.2 kg C m−2yr−1 for VCSD. Among them, LSI and SPL showed a negative correlation trend with VCSD, and VCSD decreased sharply with increasing LSI and SPL. In contrast, LPI and AI exhibited a fluctuating increasing trend with VCSD. The effect of LPI on VCSD increased sharply and reached a maximum of 0.15 kg C m−2yr−1 after LPI was greater than 80%, and the effect of AI on VCSD increased significantly after AI was greater than 97%, to a maximum of 98%. The AM index as a whole showed a positive correlation with VCSD, and continued to increase VCSD after the average green space patch area was greater than 1.2 ha.
For community parks, VCSD increased with increasing Pg, LPI, and AM. Pg showed an overall linear increasing trend with VCSD, but VCSD decreased slightly after Pg was greater than 82%. The positive effect of LPI on VCSD increased sharply after 80%. AM showed a fluctuating increasing trend in its positive effect on VCSD. In contrast, SHEI and NP showed a negative trend in relation to community parks. VCSD decreased sharply with increasing NP. For theme parks, LSI, SHEI, NP, and LPI showed negative correlations with VCSD. A sharp decline in VCSD was observed when LSI exceeded 7, SHEI surpassed 0.5, NP exceeded 20, and LPI went beyond 20, with an average negative impact of 0.3 kg C m−2 yr−1. Conversely, Pg exhibited a positive correlation with VCSD, particularly when Pg exceeded 68%. For recreational parks, PER, AM, and AI indices displayed a positive relationship with VCSD, with the impact on VCSD increasing steadily when PER exceeded 400 m and AM was greater than 0.4 ha. The effect of the AI index on VCSD became more pronounced when AI exceeded 95%.
Overall, the impact of dominant landscape drivers on VCSD varies across park types, highlighting the importance of spatial configuration in optimizing vegetation carbon sequestration. LSI, SPL, SHEI and NP have a negative impact on VCSD. LPI, AI, AM, Pg and PER have a positive effect on VCSD, suggesting that larger, well-connected green patches with high vegetation cover are more effective for carbon sequestration.
4. Discussion
4.1. Comparison with Previous Studies
Our findings indicate that the average VCSD of the 123 parks in Zhengzhou is 0.53 kg C m−2 yr−1, which is lower than that of parks in Beijing (3.18 kg C m−2 yr−1) [] and the Green Expo Park in Zhengzhou (2.06 kg C m−2 yr−1) [], but higher than the VCSD reported by Jo, H.-K for 71 parks in Daejeon and Daegu, South Korea (0.26 kg C m−2 yr−1) [] (Table 8). Several factors may contribute to the variation in vegetation carbon sequestration across cities in our study.
Table 8.
Vegetation carbon sequestration density statistics of urban parks in different regions.
Firstly, these differences can be partially attributed to disparities in urban development levels and the history of park establishment. As China’s capital and an ancient city, Beijing has a long history of greening initiatives. Various types of urban green spaces have been developed, and numerous parks have been preserved throughout the city’s expansion []. For instance, in 2010, Beijing had 62,672 hectares of urban green space, nearly six times the 11,033 hectares in Zhengzhou []. Moreover, the development of urban parks in Zhengzhou began relatively late. The city designated its first park in 1952, and by 1964, only three urban parks had been established. Due to limited attention to park development in subsequent years, Zhengzhou did not initiate a comprehensive greening strategy until 1997, when it set the goal of becoming a “garden city”, leading to the rapid expansion of park areas [].
Secondly, the different species of high-carbon-sequestering plants in different cities also contribute to the differences in carbon sequestration among cities. For example, the results of the study on Beijing parks show that Sophora japonica L., Populus tomentosa Carrière, Fraxinus chinensis Roxb., Ginkgo biloba L., and Salix matsudana Koidz. have higher carbon sequestration benefits []. Another study identified species such as Styphnolobium japonicum (L.) Schott, Salix babylonica L., Pittosporum tobira (Thunb.) W.T.Aiton, Spiraea salicifolia L., and Iris pseudacorus L. in Xi’an []. Furthermore, the characteristics of trees in parks in different cities can also affect VCSD. Research indicates that in urban green space communities, mature trees with longer growth periods and faster growth rates have higher carbon sequestration and oxygen release benefits [].
Lastly, the VCSD observed in our study (0.53 kg C m−2yr−1) is significantly lower than that of Zhengzhou’s Green Expo Park (2.06 kg C m−2yr−1), likely due to differences in sample size, park design, and estimation methods. Our study analyzed 123 parks, leading to a lower average VCSD, whereas the Green Expo Park represents a single, intensively managed green space. For instance, among the parks studied, Zhengzhou Zhilin Park had the highest VCSD (2.1 kg C m−2yr−1), slightly exceeding that of the Greening Expo Park, while Xuyuan Park had the lowest (0.03 kg C m−2yr−1). Additionally, the Green Expo Park’s extensive plant diversity (700+ species, 635,000 individual plants) and well-structured vegetation significantly enhance its VCSD []. Furthermore, differences in carbon sequestration estimation methods may also contribute to the observed discrepancies, such as the use of LiDAR data in Zhengzhou’s Green Expo Park versus the plot-based modeling approach used in this study [,,] (Table 7).
4.2. Effects of Landscape Patterns on Carbon Sequestration
Our results indicate that the structure and configuration of green spaces within parks are crucial factors influencing their vegetation carbon sequestration capacity. Specifically, green space proportion (Pg) and largest patch index (LPI) showed a positive correlation with carbon sequestration, while the number of patches (NP), splitting index (SPL), Shannon’s evenness index (SHEI), and landscape shape index (LSI) exhibited negative correlations. Firstly, the positive effects of Pg and LPI on carbon sequestration have been consistently confirmed by previous studies [,,]. This is because increasing green space proportion directly expands the vegetation area available for carbon sequestration, making it an efficient strategy, particularly in areas with low vegetation coverage []. Additionally, larger patch sizes and improved connectivity help regulate local microclimates, enhance water-use efficiency, and create favorable habitat conditions []. Enhanced connectivity among green patches also supports ecological processes and promotes more vigorous plant growth []. Conversely, the negative correlation observed between carbon sequestration and NP, SPL, and SHEI aligns with earlier studies [,], suggesting that higher fragmentation and increased patch numbers reduce the effectiveness of carbon sequestration. This finding should raise concerns, as the rapid urbanization and intensive human activities occurring in China are significantly increasing landscape fragmentation and patch quantity, thereby weakening urban green spaces’ carbon sequestration capabilities [,].
Secondly, our findings indicate a negative correlation between vegetation carbon sequestration and patch shape complexity (LSI). However, previous studies have reported inconsistent results regarding this aspect. For instance, Jing Huang et al. found that higher landscape shape complexity in Luohe City resulted in increased carbon sequestration efficiency, with Peiyuan Tao et al. achieving similar findings in Beijing [,]. In contrast, studies by Yangyang Yuan et al. on Nanjing’s urban blue–green spaces and Xianghua Li et al. on Shanghai’s waterfront areas found that complex landscape shapes inhibited carbon sequestration [,]. Jian Lin’s research in New York indicated that moderate forest-edge complexity enhanced carbon sequestration []. This discrepancy may firstly be attributed to differences in study scales. Generally, smaller-scale studies can more easily observe the subtle ecological effects induced by complex landscape shapes, whereas large-scale studies (e.g., city-wide or regional scales) might mask these nuanced edge effects and ecological processes []. Appropriate scale selection is critical to accurately reflect the spatial variability in landscape patterns and carbon sequestration. However, the suitable grid scale for evaluating ecological functions in green spaces varies notably, partially due to differences in land use structure and the underlying determinants shaping landscapes []. In addition, variations in model assumptions and parameter settings could explain discrepancies across different studies. Different research may adopt various assumptions and parameters (such as growth models, vegetation-type parameters, and carbon conversion coefficients) when estimating carbon sequestration, affecting comparability. For example, Xianghua Li utilized Landsat 8 imagery (30 m resolution) with the CASA model to estimate carbon storage, while Jing Huang employed GF-2 imagery (0.8 m resolution) with the i-Tree Eco model, reaching opposite conclusions. Therefore, promoting localized evaluation and model optimization for urban green space carbon sequestration is crucial to addressing regional differences [].
Collectively, these relationships confirm that strategically managing the spatial composition and arrangement of green spaces—particularly by increasing continuous green coverage and minimizing fragmentation—plays a crucial role in optimizing urban parks’ carbon sequestration potential.
4.3. Implications for Urban Park Design and Management
Our study demonstrates that the dominant factors influencing vegetation carbon sequestration density (VCSD) differ significantly among urban park types. Consequently, spatial design strategies for enhancing vegetation carbon sequestration must be tailored specifically to each park category (Figure 9).
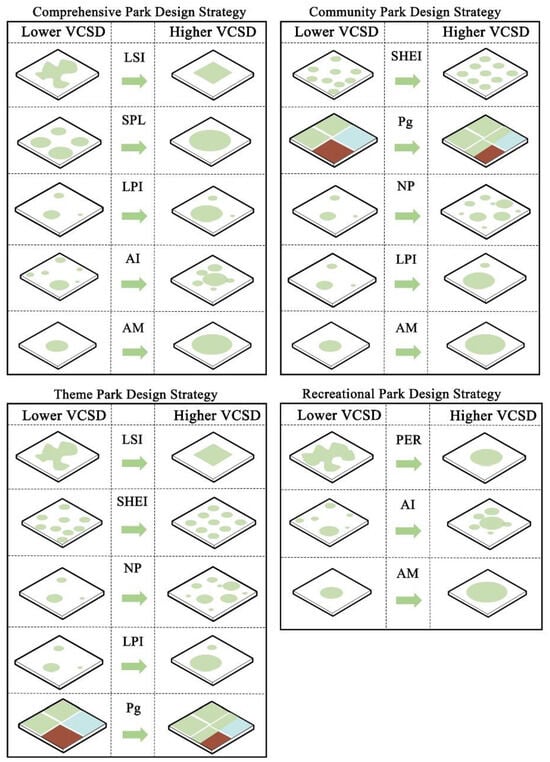
Figure 9.
Illustration of design strategy in different types of parks. The red areas represent Pi (Percentage of impervious surface), green areas represent Pg (Percentage of vegetation), and blue areas represent Pw (Percentage of water bodies).
For comprehensive parks, our findings suggest that the landscape shape index (LSI), largest patch index (LPI), and aggregation index (AI) play a significant role in influencing carbon sequestration. Specifically, vegetation carbon sequestration significantly improves when LPI exceeds 80% and AI surpasses 97%. Comprehensive parks typically cover larger areas with more complex internal configurations; thus, enhancing internal connectivity and creating large contiguous green patches can substantially increase vegetation carbon sequestration. Spatial planning for these parks should therefore prioritize increasing patch continuity and connectivity through internal structural optimization, minimizing fragmentation by pathways and infrastructure, and maintaining large patches of uninterrupted vegetation cover.
Community parks showed a strong reliance on green space proportion (Pg) and LPI, alongside clear negative effects from increased numbers of patches (NP) and Shannon’s evenness index (SHEI). In densely populated neighborhoods, maintaining fewer, larger, and more contiguous green spaces rather than multiple fragmented patches could markedly enhance carbon sequestration efficiency. Community parks should prioritize increasing the size and connectivity of green patches and minimizing fragmentation.
In theme parks, a high LSI, representing complex spatial shapes, negatively impacts vegetation carbon sequestration. Pg positively correlates with VCSD when it exceeds 68%, suggesting that in these parks, simple-shaped, high-density vegetation areas provide superior carbon sequestration. Due to the typically specialized recreational functions of theme parks, designers should simplify green patch shapes, enhance vegetation coverage, and maintain stable internal ecological environments to maximize carbon sequestration potential.
Recreational parks benefit from increasing the park perimeter (PER) and average patch area (AM). Greater perimeter values and larger average patch sizes consistently enhance vegetation carbon sequestration, suggesting the benefit of designs that expand green patch boundaries and optimize patch size. For these parks, enhancing both edge complexity moderately and maintaining larger green patches will improve their ecological benefits (Figure 9).
The findings of this study also offer valuable insights for urban areas beyond the specific context of Zhengzhou. This study relied on extensive field survey data collected in Zhengzhou, a city that has experienced rapid urban park development over the past two decades []. As a typical case of urban greening in China since the Reform and Opening-up era, Zhengzhou represents broader trends in urban green space expansion. Given Zhengzhou’s role as a central city within China’s Central Plains Urban Agglomeration, our findings regarding park carbon sequestration can be effectively applied to other cities within the region that share similar climatic conditions, landscape construction standards, and regional ecological characteristics. Moreover, the park classification system used in this research (CJJ/T85-2017) was issued by China’s Ministry of Housing and Urban–Rural Development in 2018 and is now widely utilized nationwide in park construction and research [,,,]. Thus, the category-specific spatial design strategies proposed here have practical relevance and broad applicability for urban green space management throughout China.
Overall, our findings highlight the critical importance of customized spatial strategies for different park categories. In cities with limited space for new green areas, such as rapidly urbanized areas in China, it becomes increasingly crucial to adopt precise design practices aimed at optimizing existing park structures rather than solely expanding green areas. By aligning spatial strategies with the unique attributes and vegetation carbon sequestration drivers of each park type, cities can significantly enhance their green spaces’ contributions to climate mitigation goals.
4.4. Limitations and Suggestions
The study reveals a correlation between park vegetation carbon sequestration and spatial structure, highlighting the importance of optimizing park spatial design to enhance carbon sequestration capacity. However, this study only discusses the possibility of enhancing park vegetation carbon sequestration from the perspective of spatial structure. In reality, there are many factors that affect park carbon sequestration, such as plant species selection, the plant diversity index, socio-economic factors, and natural environmental factors. Therefore, in future research, it is advisable to incorporate additional influencing factors for a more comprehensive analysis of the driving mechanisms behind park vegetation carbon sequestration and to provide more detailed and comprehensive enhancement strategies. Secondly, due to limitations in the vegetation carbon sequestration calculation models, the calculation of shrub carbon sequestration capacity in this study was based on the extrapolation of isometric growth equations from previous studies. Yet, the limited variety and regional differences in existing isometric growth equations for shrubs may lead to an overestimation of shrub carbon sequestration capacity. Thirdly, this study only focuses on vegetation carbon sequestration in parks. In reality, carbon sequestration by park soils is equally significant. For example, a carbon pools study in Berlin, Germany, in 2020 showed that more than two-thirds of carbon is stored in soil []. Another study showed that the ratio of soil carbon storage to vegetation carbon storage in the city of Hamburg, Germany, was 2:1 []. In addition, it was shown that the global average carbon emission from soils is 0.71 kg C m−2 yr−1, which is higher than the value of plant carbon sequestration in this study []. Therefore, it is worthwhile to make a soil carbon emission assessment of urban parks in future studies. In summary, some research suggestions, such as accurately quantifying vegetation carbon sequestration based on more precise data (such as LiDAR point cloud data), holistically assessing the role of plant and soil carbon sequestration in parks and carbon emission effects, and holistically exploring the drivers of vegetation in parks, are recommended to be included in future studies.
5. Conclusions
This study integrated field survey data, remote sensing data, and the i-Tree Eco model to quantify vegetation carbon sequestration in urban parks in Zhengzhou, identifying significant correlations between landscape patterns and vegetation carbon sequestration density (VCSD). The key findings are as follows:
- The total vegetation carbon sequestration capacity of parks in Zhengzhou is 14.03 Gg C yr−1, with an average VCSD of 0.53 kg C m−2 yr−1.
- Green space proportion (Pg) and largest patch index (LPI) positively influenced VCSD, while the number of patches (NP), splitting index (SPL), Shannon’s evenness index (SHEI), and landscape shape index (LSI) had negative effects. Each driving factor exhibited specific threshold ranges, highlighting the need for targeted spatial optimization.
- Spatial optimization strategies should be tailored according to park types. For comprehensive parks, simplifying patch shapes (reducing LSI) and enhancing aggregation (increasing AI and LPI) significantly improved VCSD. Community parks require higher green space coverage, larger dominant patches, and a controlled number of patches to avoid fragmentation. Theme parks benefit from simplified patch geometries and increased spatial evenness, while recreational parks can moderately increase perimeter complexity and maintain higher internal aggregation and patch size.
Given the challenges in creating new parks within highly urbanized areas, optimizing the spatial structure and design of existing parks is becoming increasingly critical. The findings of this study provide a foundation for optimizing urban green space patterns from a carbon sequestration perspective, thereby supporting sustainable urban ecosystem development and advancing cities’ transitions towards carbon neutrality.
Author Contributions
Conceptualization, C.D., S.G. and P.S.; methodology, C.D. and P.S.; software, C.D. and P.S.; validation, C.D. and S.G.; formal analysis, C.D.; investigation, C.D.; resources, S.G. and P.S.; data curation, C.D.; writing—original draft preparation, C.D.; writing—review and editing, S.J. and S.G. visualization, C.D.; supervision, S.G. and I.V.; project administration, S.G. and I.V.; funding acquisition, I.V. and A.F. All authors have read and agreed to the published version of the manuscript.
Funding
This work was supported by the National Natural Science Foundation of China (grant number 32460421), the Key Technology R&D Program of Henan Province (grant number 242102320320), and the Hungarian University of Agriculture and Life Sciences—MATE.
Data Availability Statement
The data presented in this study are available on request from the corresponding author.
Acknowledgments
Thanks to the Hungarian University of Agriculture and Life Sciences—MATE for financial support for the publication of this paper.
Conflicts of Interest
The authors declare no conflicts of interest.
References
- United Nations, Department of Economic and Social Affairs, Population Division. World Urbanization Prospects: The 2018 Revision; United Nations: New York, NY, USA, 2019; ISBN 978-92-1-148319-2. [Google Scholar]
- Gong, P.; Li, X.; Wang, J.; Bai, Y.; Chen, B.; Hu, T.; Liu, X.; Xu, B.; Yang, J.; Zhang, W.; et al. Annual maps of global artificial impervious area (GAIA) between 1985 and 2018. Remote Sens. Environ. 2020, 236, 111510. [Google Scholar] [CrossRef]
- Li, X.; Gong, P.; Zhou, Y.; Wang, J.; Bai, Y.; Chen, B.; Hu, T.; Xiao, Y.; Xu, B.; Yang, J.; et al. Mapping global urban boundaries from the global artificial impervious area (GAIA) data. Environ. Res. Lett. 2020, 15, 094044. [Google Scholar] [CrossRef]
- Alley, R.; Berntsen, T.; Bindoff, N.L.; Chen, Z.; Chidthaisong, A.; Friedlingstein, P.; Gregory, J.; Hegerl, G.; Heimann, M.; Hewitson, B.; et al. Climate Change 2021: The Physical Science Basis. Contribution of Working Group I to the Sixth Assessment Report of the Intergovernmental Panel on Climate Change; Masson-Delmotte, V., Zhai, P., Pirani, A., Connors, S.L., Péan, C., Berger, S., Caud, N., Chen, Y., Goldfarb, L., Gomis, M.I., et al., Eds.; Cambridge University Press: Cambridge, UK; New York, NY, USA, 2021. [Google Scholar]
- Thomas, C.D.; Cameron, A.; Green, R.E.; Bakkenes, M.; Beaumont, L.J.; Collingham, Y.C.; Erasmus, B.F.N.; de Siqueira, M.F.; Grainger, A.; Hannah, L.; et al. Extinction risk from climate change. Nature 2004, 427, 145–148. [Google Scholar] [CrossRef] [PubMed]
- Root, T.L.; Price, J.T.; Hall, K.R.; Schneider, S.H.; Rosenzweig, C.; Pounds, J.A. Fingerprints of global warming on wild animals and plants. Nature 2003, 421, 57–60. [Google Scholar] [CrossRef]
- Grimm, N.B.; Faeth, S.H.; Golubiewski, N.E.; Redman, C.L.; Wu, J.; Bai, X.; Briggs, J.M. Global Change and the Ecology of Cities. Science 2008, 319, 756–760. [Google Scholar] [CrossRef]
- Nowak, D.J.; Crane, D.E. Carbon storage and sequestration by urban trees in the USA. Environ. Pollut. 2002, 116, 381–389. [Google Scholar] [CrossRef]
- Mitchell, M.G.E.; Johansen, K.; Maron, M.; McAlpine, C.A.; Wu, D.; Rhodes, J.R. Identification of fine scale and landscape scale drivers of urban aboveground carbon stocks using high-resolution modeling and mapping. Sci. Total Environ. 2018, 622–623, 57–70. [Google Scholar] [CrossRef]
- Dhakal, S. GHG emissions from urbanization and opportunities for urban carbon mitigation. Curr. Opin. Environ. Sustain. 2010, 2, 277–283. [Google Scholar] [CrossRef]
- Ge, S.; Zhao, S. Organic carbon storage change in China’s urban landfills from 1978–2014. Environ. Res. Lett. 2017, 12, 104013. [Google Scholar] [CrossRef]
- Russo, A.; Escobedo, F.J.; Timilsina, N.; Schmitt, A.O.; Varela, S.; Zerbe, S. Assessing urban tree carbon storage and sequestration in Bolzano, Italy. Int. J. Biodivers. Sci. Ecosyst. Serv. Manag. 2014, 10, 54–70. [Google Scholar] [CrossRef]
- Ge, Z.; Wen, W.; Xu, L.; Chen, G.; Zhou, G.; Ji, B.; Zhou, Y.; Zhu, G.; Shi, Y. Vegetation Carbon Accumulation Driven by Stand Characteristics and Climatic Factors in Subtropical Forests of Southeastern China. J. Sustain. For. 2022, 41, 941–958. [Google Scholar] [CrossRef]
- Valánszki, I.; Virág, D.; Kiszter, I.B.; Boromisza, Z. Green infrastructure development opportunities in rural settlements. 4D J. Landsc. Archit. Gard. Arts 2021, 60, 34–49. [Google Scholar] [CrossRef] [PubMed]
- Sun, Y.; Xie, S.; Zhao, S. Valuing urban green spaces in mitigating climate change: A city-wide estimate of aboveground carbon stored in urban green spaces of China’s Capital. Glob. Change Biol. 2019, 25, 1717–1732. [Google Scholar] [CrossRef]
- Ren, Z.; Zheng, H.; He, X.; Zhang, D.; Shen, G.; Zhai, C. Changes in spatio-temporal patterns of urban forest and its above-ground carbon storage: Implication for urban CO2 emissions mitigation under China’s rapid urban expansion and greening. Environ. Int. 2019, 129, 438–450. [Google Scholar] [CrossRef]
- Tóth, B.; Doma-Tarcsányi, J.; Szabó, K. Study of planting density and canopy cover in open spaces in Budapest. 4D J. Landsc. Archit. Gard. Arts 2023, 70, 14–31. [Google Scholar] [CrossRef]
- Zhao, M.; Kong, Z.; Escobedo, F.J.; Gao, J. Impacts of urban forests on offsetting carbon emissions from industrial energy use in Hangzhou, China. J. Environ. Manag. 2010, 91, 807–813. [Google Scholar] [CrossRef]
- Jo, H.-K.; Kim, J.-Y.; Park, H.-M. Carbon reduction and planning strategies for urban parks in Seoul. Urban For. Urban Green. 2019, 41, 48–54. [Google Scholar] [CrossRef]
- Wang, Y.; Chang, Q.; Li, X. Promoting sustainable carbon sequestration of plants in urban greenspace by planting design: A case study in parks of Beijing. Urban For. Urban Green. 2021, 64, 127291. [Google Scholar] [CrossRef]
- Shadman, S.; Ahanaf Khalid, P.; Hanafiah, M.M.; Koyande, A.K.; Islam, M.A.; Bhuiyan, S.A.; Sin Woon, K.; Show, P.-L. The carbon sequestration potential of urban public parks of densely populated cities to improve environmental sustainability. Sustain. Energy Technol. Assess. 2022, 52, 102064. [Google Scholar] [CrossRef]
- Fan, L.; Wang, J.; Han, D.; Gao, J.; Yao, Y. Research on Promoting Carbon Sequestration of Urban Green Space Distribution Characteristics and Planting Design Models in Xi’an. Sustainability 2023, 15, 572. [Google Scholar] [CrossRef]
- Jia, X.; Han, H.; Feng, Y.; Song, P.; He, R.; Liu, Y.; Wang, P.; Zhang, K.; Du, C.; Ge, S.; et al. Scale-dependent and driving relationships between spatial features and carbon storage and sequestration in an urban park of Zhengzhou, China. Sci. Total Environ. 2023, 894, 164916. [Google Scholar] [CrossRef] [PubMed]
- Nicese, F.P.; Colangelo, G.; Comolli, R.; Azzini, L.; Lucchetti, S.; Marziliano, P.A.; Sanesi, G. Estimating CO2 balance through the Life Cycle Assessment prism: A case—Study in an urban park. Urban For. Urban Green. 2021, 57, 126869. [Google Scholar] [CrossRef]
- Jiang, Y.; Sun, Y.; Liu, Y.; Li, X. Exploring the correlation between waterbodies, green space morphology, and carbon dioxide concentration distributions in an urban waterfront green space: A simulation study based on the carbon cycle. Sustain. Cities Soc. 2023, 98, 104831. [Google Scholar] [CrossRef]
- Lin, J.; Ma, Q.; Ju, Y.; Zhang, H.; Wang, Q.; Huang, B. Relationships between urbanization, tree morphology, and carbon density: An integration of remote sensing, allometric models, and field survey. Urban For. Urban Green. 2022, 76, 127725. [Google Scholar] [CrossRef]
- Riitters, K.H.; O’Neill, R.V.; Hunsaker, C.T.; Wickham, J.D.; Yankee, D.H.; Timmins, S.P.; Jones, K.B.; Jackson, B.L. A factor analysis of landscape pattern and structure metrics. Landsc. Ecol. 1995, 10, 23–39. [Google Scholar] [CrossRef]
- Herold, M.; Scepan, J.; Clarke, K.C. The Use of Remote Sensing and Landscape Metrics to Describe Structures and Changes in Urban Land Uses. Env. Plan A 2002, 34, 1443–1458. [Google Scholar] [CrossRef]
- Plexida, S.G.; Sfougaris, A.I.; Ispikoudis, I.P.; Papanastasis, V.P. Selecting landscape metrics as indicators of spatial heterogeneity—A comparison among Greek landscapes. Int. J. Appl. Earth Obs. Geoinf. 2014, 26, 26–35. [Google Scholar] [CrossRef]
- Wu, J.; Shen, W.; Sun, W.; Tueller, P.T. Empirical patterns of the effects of changing scale on landscape metrics. Landsc. Ecol. 2002, 17, 761–782. [Google Scholar] [CrossRef]
- Du, C.; Song, P.; Wang, K.; Li, A.; Hu, Y.; Zhang, K.; Jia, X.; Feng, Y.; Wu, M.; Qu, K.; et al. Investigating the Trends and Drivers between Urbanization and the Land Surface Temperature: A Case Study of Zhengzhou, China. Sustainability 2022, 14, 13845. [Google Scholar] [CrossRef]
- Zhengzhou Statistics Bureau Zhengzhou Statistical Yearbook. 2022. Available online: https://topic.zhengzhou.gov.cn/u/cms/tjj/statistical_2022/index.htm (accessed on 11 January 2024).
- ZZP. Available online: https://tjj.zhengzhou.gov.cn/ndsj/3134558.jhtml (accessed on 10 January 2024).
- Ma, J.; Li, X.; Baoquan, J.; Liu, X.; Li, T.; Zhang, W.; Liu, W. Spatial variation analysis of urban forest vegetation carbon storage and sequestration in built-up areas of Beijing based on i-Tree Eco and Kriging. Urban For. Urban Green. 2021, 66, 127413. [Google Scholar] [CrossRef]
- Rossi, L.; Menconi, M.E.; Grohmann, D.; Brunori, A.; Nowak, D.J. Urban Planning Insights from Tree Inventories and Their Regulating Ecosystem Services Assessment. Sustainability 2022, 14, 1684. [Google Scholar] [CrossRef]
- Song, P.; Kim, G.; Mayer, A.; He, R.; Tian, G. Assessing the Ecosystem Services of Various Types of Urban Green Spaces Based on i-Tree Eco. Sustainability 2020, 12, 1630. [Google Scholar] [CrossRef]
- Xie, Y.; Hirabayashi, S.; Hashimoto, S.; Shibata, S.; Kang, J. Exploring the Spatial Pattern of Urban Forest Ecosystem Services based on i-Tree Eco and Spatial Interpolation: A Case Study of Kyoto City, Japan. Environ. Manag. 2023, 72, 991–1005. [Google Scholar] [CrossRef]
- Davies, Z.G.; Edmondson, J.L.; Heinemeyer, A.; Leake, J.R.; Gaston, K.J. Mapping an urban ecosystem service: Quantifying above-ground carbon storage at a city-wide scale: Urban above-ground carbon storage. J. Appl. Ecol. 2011, 48, 1125–1134. [Google Scholar] [CrossRef]
- Nowak, D.J.; Greenfield, E.J.; Hoehn, R.E.; Lapoint, E. Carbon storage and sequestration by trees in urban and community areas of the United States. Environ. Pollut. 2013, 178, 229–236. [Google Scholar] [CrossRef]
- McPherson, E.G.; Kotow, L. A municipal forest report card: Results for California, USA. Urban For. Urban Green. 2013, 12, 134–143. [Google Scholar] [CrossRef]
- Nyelele, C.; Kroll, C.N.; Nowak, D.J. Present and future ecosystem services of trees in the Bronx, NY. Urban For. Urban Green. 2019, 42, 10–20. [Google Scholar] [CrossRef]
- Houghton, R.A. Aboveground Forest Biomass and the Global Carbon Balance. Glob. Change Biol. 2005, 11, 945–958. [Google Scholar] [CrossRef]
- Yao, Z.; Liu, J.; Zhao, X.; Long, D.; Wang, L. Spatial dynamics of aboveground carbon stock in urban green space: A case study of Xi’an, China. J. Arid Land 2015, 7, 350–360. [Google Scholar] [CrossRef]
- Yao, Z.-Y.; Liu, J.-J. Models for biomass estimation of four shrub species planted in urban area of Xi’an city, Northwest China. Ying Yong Sheng Tai Xue Bao 2014, 25, 111–116. [Google Scholar]
- Li, X.; Guo, Q.; Wang, X.; Zheng, H. Allometry of understory tree species in a natural secondary forest in northeast China. Sci. Silvae Sin. 2010, 46, 22–32. [Google Scholar]
- Zhang, K.; Yun, G.; Song, P.; Wang, K.; Li, A.; Du, C.; Jia, X.; Feng, Y.; Wu, M.; Qu, K.; et al. Discover the Desirable Landscape Structure of Urban Parks for Mitigating Urban Heat: A High Spatial Resolution Study Using a Forest City, Luoyang, China as a Lens. Int. J. Environ. Res. Public Health 2023, 20, 3155. [Google Scholar] [CrossRef] [PubMed]
- Golden, H.E.; Lane, C.R.; Prues, A.G.; D’Amico, E. Boosted Regression Tree Models to Explain Watershed Nutrient Concentrations and Biological Condition. J. Am. Water Resour. Assoc. 2016, 52, 1251–1274. [Google Scholar] [CrossRef]
- Sun, F.; Mejia, A.; Che, Y. Disentangling the Contributions of Climate and Basin Characteristics to Water Yield Across Spatial and Temporal Scales in the Yangtze River Basin: A Combined Hydrological Model and Boosted Regression Approach. Water Resour. Manag. 2019, 33, 3449–3468. [Google Scholar] [CrossRef]
- Yang, R.-M.; Zhang, G.-L.; Liu, F.; Lu, Y.-Y.; Yang, F.; Yang, F.; Yang, M.; Zhao, Y.-G.; Li, D.-C. Comparison of boosted regression tree and random forest models for mapping topsoil organic carbon concentration in an alpine ecosystem. Ecol. Indic. 2016, 60, 870–878. [Google Scholar] [CrossRef]
- Alavipanah, S.; Schreyer, J.; Haase, D.; Lakes, T.; Qureshi, S. The effect of multi-dimensional indicators on urban thermal conditions. J. Clean. Prod. 2018, 177, 115–123. [Google Scholar] [CrossRef]
- Sun, F.; Liu, M.; Wang, Y.; Wang, H.; Che, Y. The effects of 3D architectural patterns on the urban surface temperature at a neighborhood scale: Relative contributions and marginal effects. J. Clean. Prod. 2020, 258, 120706. [Google Scholar] [CrossRef]
- Hijmans, R.J.; Phillips, S.; Elith, J.; Leathwick, J. Dismo: Species Distribution Modeling, 1.3-1.4. 2023. Available online: https://rspatial.org/raster/sdm/ (accessed on 21 May 2023).
- Greg, R.; Edwards, D.; Kriegler, B.; Schroedl, S.; Southworth, H.; Greenwell, B.; Boehmke, B.; Cunningham, J.; GBM Developers. Gbm: Generalized Boosted Regression Models, 2.2.2. 2024. Available online: https://github.com/gbm-developers (accessed on 10 January 2024).
- Jouffray, J.-B.; Wedding, L.M.; Norström, A.V.; Donovan, M.K.; Williams, G.J.; Crowder, L.B.; Erickson, A.L.; Friedlander, A.M.; Graham, N.A.J.; Gove, J.M.; et al. Parsing human and biophysical drivers of coral reef regimes. Proc. R. Soc. B Biol. Sci. 2019, 286, 20182544. [Google Scholar] [CrossRef]
- Han, D.; An, H.; Wang, F.; Xu, X.; Qiao, Z.; Wang, M.; Sui, X.; Liang, S.; Hou, X.; Cai, H.; et al. Understanding seasonal contributions of urban morphology to thermal environment based on boosted regression tree approach. Build. Environ. 2022, 226, 109770. [Google Scholar] [CrossRef]
- Huang, J.; Wang, Y. Cooling intensity of hybrid landscapes in a metropolitan area: Relative contribution and marginal effect. Sustain. Cities Soc. 2022, 79, 103725. [Google Scholar] [CrossRef]
- Li, Z.; Hu, D. Exploring the relationship between the 2D/3D architectural morphology and urban land surface temperature based on a boosted regression tree: A case study of Beijing, China. Sustain. Cities Soc. 2022, 78, 103392. [Google Scholar] [CrossRef]
- Jo, H.-K.; Park, H.-M.; Kim, J.-Y. Carbon Offset Service of Urban Park Trees and Desirable Planting Strategies for Several Metropolitan Cities in South Korea. Forests 2023, 14, 278. [Google Scholar] [CrossRef]
- Gong, L.; Mao, B.; Qi, Y.; Xu, C. A satisfaction analysis of the infrastructure of country parks in Beijing. Urban For. Urban Green. 2015, 14, 480–489. [Google Scholar] [CrossRef]
- Chen, W.Y. The role of urban green infrastructure in offsetting carbon emissions in 35 major Chinese cities: A nationwide estimate. Cities 2015, 44, 112–120. [Google Scholar] [CrossRef]
- Yang, Y.; He, R.; Ning, D.; Wang, G.; Liu, M.; Fekete, A. An Overview of Urban Park Development in Zhengzhou, China. Acta Biol. Marisiensis 2021, 4, 1–13. [Google Scholar] [CrossRef]
- Nowak, D.J.; Stevens, J.C.; Sisinni, S.M.; Luley, C.J. Effects of urban tree management and species selection on atmospheric carbon dioxide. J. Arboric. 2002, 28, 113–122. [Google Scholar] [CrossRef]
- Wang, Y.; Lei, Y.; Lin, C.-Y.; Ackerma, A.C.; Huang, H.; Tian, Y.; Wang, P.; Ma, Z.; We, M.; Tian, G.; et al. A parametric and visualization model of the rainfall runoff production process in an urban green infrastructure at the park scale: A case study of Zhengzhou Green Expo Park. Int. J. Urban Sci. 2025, 1–22. [Google Scholar] [CrossRef]
- Raciti, S.M.; Hutyra, L.R.; Newell, J.D. Mapping carbon storage in urban trees with multi-source remote sensing data: Relationships between biomass, land use, and demographics in Boston neighborhoods. Sci. Total Environ. 2014, 500–501, 72–83. [Google Scholar] [CrossRef]
- Wang, V.; Gao, J.; Schwendenmann, L. Assessing changes of urban vegetation cover and aboveground carbon stocks using LiDAR and Landsat imagery data in Auckland, New Zealand. Int. J. Remote Sens. 2020, 41, 2140–2158. [Google Scholar] [CrossRef]
- Velasco, E.; Roth, M.; Tan, S.H.; Quak, M.; Nabarro, S.D.A.; Norford, L. The role of vegetation in the CO2 flux from a tropical urban neighbourhood. Atmos. Chem. Phys. 2013, 13, 10185–10202. [Google Scholar] [CrossRef]
- Di Sacco, A.; Hardwick, K.A.; Blakesley, D.; Brancalion, P.H.S.; Breman, E.; Cecilio Rebola, L.; Chomba, S.; Dixon, K.; Elliott, S.; Ruyonga, G.; et al. Ten golden rules for reforestation to optimize carbon sequestration, biodiversity recovery and livelihood benefits. Glob. Change Biol. 2021, 27, 1328–1348. [Google Scholar] [CrossRef] [PubMed]
- Ariluoma, M.; Ottelin, J.; Hautamäki, R.; Tuhkanen, E.-M.; Mänttäri, M. Carbon sequestration and storage potential of urban green in residential yards: A case study from Helsinki. Urban For. Urban Green. 2021, 57, 126939. [Google Scholar] [CrossRef]
- Huang, J.; Song, P.; Liu, X.; Li, A.; Wang, X.; Liu, B.; Feng, Y. Carbon Sequestration and Landscape Influences in Urban Greenspace Coverage Variability: A High-Resolution Remote Sensing Study in Luohe, China. Forests 2024, 15, 1849. [Google Scholar] [CrossRef]
- Wang, R.-Y.; Mo, X.; Ji, H.; Zhu, Z.; Wang, Y.-S.; Bao, Z.; Li, T. Comparison of the CASA and InVEST models’ effects for estimating spatiotemporal differences in carbon storage of green spaces in megacities. Sci. Rep. 2024, 14, 5456. [Google Scholar] [CrossRef]
- Guo, Y.; Ren, Z.; Wang, C.; Zhang, P.; Ma, Z.; Hong, S.; Hong, W.; He, X. Spatiotemporal patterns of urban forest carbon sequestration capacity: Implications for urban CO2 emission mitigation during China’s rapid urbanization. Sci. Total Environ. 2024, 912, 168781. [Google Scholar] [CrossRef]
- Whittinghill, L.J.; Rowe, D.B.; Schutzki, R.; Cregg, B.M. Quantifying carbon sequestration of various green roof and ornamental landscape systems. Landsc. Urban Plan. 2014, 123, 41–48. [Google Scholar] [CrossRef]
- Tao, P.; Lin, Y.; Wang, X.; Li, J.; Ma, C.; Wang, Z.; Dong, X.; Yao, P.; Shao, M. Optimization of Green Spaces in Plain Urban Areas to Enhance Carbon Sequestration. Land 2023, 12, 1218. [Google Scholar] [CrossRef]
- Shi, N.; Yu, Y.; Liang, S.; Ren, Y.; Liu, M. Effects of urban green spaces landscape pattern on carbon sink among urban ecological function areas at the appropriate scale: A case study in Xi’an. Ecol. Indic. 2024, 158, 111427. [Google Scholar] [CrossRef]
- Zhuang, Q.; Shao, Z.; Li, D.; Huang, X.; Li, Y.; Altan, O.; Wu, S. Impact of global urban expansion on the terrestrial vegetation carbon sequestration capacity. Sci. Total Environ. 2023, 879, 163074. [Google Scholar] [CrossRef]
- Kabisch, N.; Qureshi, S.; Haase, D. Human–environment interactions in urban green spaces—A systematic review of contemporary issues and prospects for future research. Environ. Impact Assess. Rev. 2015, 50, 25–34. [Google Scholar] [CrossRef]
- Yuan, Y.; Tang, S.; Zhang, J.; Guo, W. Quantifying the relationship between urban blue-green landscape spatial pattern and carbon sequestration: A case study of Nanjing’s central city. Ecol. Indic. 2023, 154, 110483. [Google Scholar] [CrossRef]
- Li, X.; Jiang, Y.; Liu, Y.; Sun, Y.; Li, C. The impact of landscape spatial morphology on green carbon sink in the urban riverfront area. Cities 2024, 148, 104919. [Google Scholar] [CrossRef]
- Turner, M.G. Spatial and temporal analysis of landscape patterns. Landsc. Ecol. 1990, 4, 21–30. [Google Scholar] [CrossRef]
- Xu, C.; Liu, M.; Hong, C.; Chi, T.; An, S.; Yang, X. Temporal variation of characteristic scales in urban landscapes: An insight into the evolving internal structures of China’s two largest cities. Landsc. Ecol. 2012, 27, 1063–1074. [Google Scholar] [CrossRef]
- Qin, H.; Zhou, W.; Qian, Y.; Zhang, H.; Yao, Y. Estimating aboveground carbon stocks of urban trees by synergizing ICESat-2 LiDAR with GF-2 data. Urban For. Urban Green. 2022, 76, 127728. [Google Scholar] [CrossRef]
- Xie, X.; Zhou, H.; Gou, Z. Dynamic real-time individual green space exposure indices and the relationship with static green space exposure indices: A study in Shenzhen. Ecol. Indic. 2023, 154, 110557. [Google Scholar] [CrossRef]
- Gao, J.; Han, H.; Ge, S. Carbon-Saving Potential of Urban Parks in the Central Plains City: A High Spatial Resolution Study Using a Forest City, Shangqiu, China, as a Lens. Land 2023, 12, 1383. [Google Scholar] [CrossRef]
- Feng, Y.; Zhang, K.; Li, A.; Zhang, Y.; Wang, K.; Guo, N.; Wan, H.Y.; Tan, X.; Dong, N.; Xu, X.; et al. Spatial and Seasonal Variation and the Driving Mechanism of the Thermal Effects of Urban Park Green Spaces in Zhengzhou, China. Land 2024, 13, 1474. [Google Scholar] [CrossRef]
- Zhi, J.; Ge, L.; Geng, T.; Zhang, Z.; Li, L.; Zhu, H.; Zhou, Z.; Jiang, W.; Qu, L.; Su, Y.; et al. Accurately mapping social functional zones of urban green spaces by integrating remote sensing images and crowd-sourced geospatial data. Int. J. Digit. Earth 2024, 17, 1–26. [Google Scholar] [CrossRef]
- Richter, S.; Haase, D.; Thestorf, K.; Makki, M. Carbon Pools of Berlin, Germany: Organic Carbon in Soils and Aboveground in Trees. Urban For. Urban Green. 2020, 54, 126777. [Google Scholar] [CrossRef]
- Dorendorf, J.; Eschenbach, A.; Schmidt, K.; Jensen, K. Both tree and soil carbon need to be quantified for carbon assessments of cities. Urban For. Urban Green. 2015, 14, 447–455. [Google Scholar] [CrossRef]
- Oertel, C.; Matschullat, J.; Zurba, K.; Zimmermann, F.; Erasmi, S. Greenhouse gas emissions from soils—A review. Geochemistry 2016, 76, 327–352. [Google Scholar] [CrossRef]
Disclaimer/Publisher’s Note: The statements, opinions and data contained in all publications are solely those of the individual author(s) and contributor(s) and not of MDPI and/or the editor(s). MDPI and/or the editor(s) disclaim responsibility for any injury to people or property resulting from any ideas, methods, instructions or products referred to in the content. |
© 2025 by the authors. Licensee MDPI, Basel, Switzerland. This article is an open access article distributed under the terms and conditions of the Creative Commons Attribution (CC BY) license (https://creativecommons.org/licenses/by/4.0/).