Abstract
We developed a model for estimating the carbon storage and volume of entire forest stands at the provincial level, aiming to improve the accuracy of regional productivity assessments. Based on data from the branches, roots, leaves, and trunks of eight dominant tree species (grouped by origin) in Fujian Province, combined with plot-level data, we developed a compatible carbon storage estimation model. This model integrates species composition coefficients and uses stand volume as the independent variable. We estimated the model parameters using a combination of the immune evolutionary algorithm and an improved simplex method, which enhances convergence speed and solution stability compared to the traditional version. The accuracy of the model was validated by cross-model validation and concurrent testing. Applying the model to forest stand data from Wuyishan City, we simulated theoretical logging volumes to demonstrate its practical utility. The results demonstrated that the model exhibited high accuracy in fitting the observed data, with reliable predictions of carbon storage and volume across different forest components. In the case study area, the volume was 21.0521 million cubic meters and the carbon storage was 7.3238 million tons, both of which increased with decreasing interval periods. When logging factors were considered, the increases in carbon storage fluctuated as the interval periods increased and were higher than those when logging factors were not considered. This study confirmed that the developed models were effective for predicting land carbon storage and volume, and the simulation method successfully overcame the challenges associated with model estimation.
1. Introduction
Forests are vital natural resource assets, playing a crucial role in both biodiversity conservation and maintaining the global carbon balance. Stand carbon storage is a key indicator for measuring forest carbon sequestration and is essential for assessing forest carbon budgets. Accurate estimations of stand carbon storage are significantly important for addressing global climate issues and promoting sustainable development [1,2,3]. Stand volume is another critical metric for evaluating carbon storage, which directly reflects the quantity and quality of forest resource assets that can be obtained by field forestry surveys. Unlike stand volume, which can be directly measured through field surveys, stand carbon storage requires indirect estimation via biomass measurement models adjusted by a fixed carbon content rate (0.45 or 0.50).
Over the past decade, numerous studies at the level of individual trees have been conducted globally [4,5]. However, stand-level measurement models, which could address gaps when individual tree data are lacking, have received less attention. The reliance on fixed carbon content rates in these models often affords biased outcomes and precludes the dynamic monitoring of carbon storage [6]. Therefore, there is an increasing need for developing models that estimate total stand carbon storage and volume as a supplement to forest carbon storage estimation when data are missing. Recently, research on stand-level carbon storage models has gradually increased [7,8,9,10], primarily focusing on the northern and northeastern regions of China [11,12]. However, research on the development of stand-level carbon storage estimation models for southern tree species is limited.
Fujian Province, which has the highest forest coverage rate in China at 66.80%, remains a focal point for forestry and ecological research and is pivotal for practical forestry operations. Stand-level theoretical growth equations have been developed for this region, facilitating regional-scale dynamic monitoring and research into carbon sequestration capacities [13,14,15,16]. Despite progress in model development, several challenges persist. The diversity of dominant tree species and their mixed composition complicates accurate carbon estimation at the regional scale. Site quality, a critical driver of stand growth, must be integrated into the model, while the difficulty in determining stand age—particularly in uneven-aged forests—can lead to the propagation of estimation errors. Additionally, models relying on diameter and height may not align well with updated forest inventories, and ignoring logging in theoretical productivity equations may hinder the realistic simulation of forest dynamics and sustainable management planning.
Therefore, in response to these challenges, in this study, we developed a carbon storage estimation model that integrates species composition coefficients with volume as the independent variable, using continuous multi-period forest resource inventory data and supplementary plot data from Fujian Province. Employing the Richards growth equation and mathematical derivation, a stand volume estimation model was also established, incorporating species composition coefficients and site quality grades as dummy variables and interval periods as independent variables. These models collectively formed a growth–carbon storage framework, enabling the dynamic monitoring of total stand carbon storage at the regional level and simulating changes in its increments. This approach also included simulation calculations for determining theoretical logging volumes, providing a foundation for more refined carbon sink monitoring and sustainable forest management.
2. Materials
The foundational data for this model were derived from the continuous forest resource inventory of Fujian Province, specifically from class I fixed plots (the national forest resources continuous inventory) collected in 1998, 2003, 2008, 2013, and 2018. These permanent plots are systematically established and revisited at regular intervals to monitor long-term forest dynamics. The primary dataset used in this study was derived from the forest resource inventory of Fujian Province, which is part of China’s national continuous forest inventory system, coordinated by the National Forestry and Grassland Administration. The inventory includes class I fixed plots, which are systematically distributed and revisited every five years. The data used in this study were obtained through official collaboration with the Fujian Provincial Forestry Survey and Planning Institute, which holds custodianship over the regional dataset. Access to this database is not currently available to the public due to confidentiality and regional forest management policies. However, external researchers may request access through formal applications submitted to the Institute. The dataset includes tree species, origin, age, DBH, height, volume, and site quality, and was provided in tabular form. To supplement the dataset, temporary standard plots were additionally established between March 2021 and December 2022. Each standard plot covers 0.067 ha in a square layout and was designed to capture recent forest conditions and expand species and site variability beyond that of the fixed plots.
Henceforth, the plots and standard plots are collectively referred to as “plots”. The collected data included species (group), origin, age, diameter at breast height, and volume (Table 1). Utilizing the three-sigma rule, we eliminated outliers, ultimately selecting 2027 plots for modeling. These included 369 plots of Cunninghamia lanceolata plantations, 214 plots of natural Cunninghamia lanceolata, 239 plots of Pinus massoniana plantations, 226 plots of natural Pinus massoniana forest, 257 plots of hard broad-leaved tree species (group) plantations, 284 plots of natural hard broad-leaved tree species (group) forests, 221 plots of soft broad-leaved tree species (group) plantations, and 217 plots of natural soft broad-leaved tree species (group) forests. Using carbon conversion factors, biomass was transformed into carbon storage, and the carbon storage per plot was calculated by combining the number of trees per plot. These data were used to analyze the carbon storage of each dominant tree species (group and origin) (Table 2).

Table 1.
Characteristics of tree measurement factors in plots for dominant tree species (group and origin).
Table 2.
Carbon storage characteristics of dominant tree species (group and origin) across different site quality levels.
The species composition coefficients (Kj) were calculated for each plot based on the species-level basal area data extracted from the forest inventory. Specifically, the basal area of each of the four dominant species groups was divided by the total basal area of the plot and then scaled to ensure a total sum of 10. These standardized coefficients were used directly as the inputs in the modeling framework.
The data were collected from the resource database for each dominant tree species (group and origin) in Wuyishan City, including factors like area, site quality grade, species composition coefficient, and age. The total area of the study region was 171,393 ha. Hblts_nf occupied the largest area (63,778 ha), followed by Cl_pf (43,801 ha) and Pm_nf (43,663 ha). The areas occupied by Hblts_pf, Sblts_pf, and Sblts_nf were smaller, accounting for 1.15%, 0.58%, and 0.03% of the total area, respectively.
3. Methods
3.1. Construction of Stand Carbon Storage Estimation Model
In this study, Equation (1) was used as the standard carbon storage model, denoted as f(Li,M,β). To account for the mixed-species structure of the stands, we introduced species composition coefficients into the model. These coefficients (K1, K2, K3, and K4) represent the proportional presence of four dominant tree species (or species groups): Cunninghamia lanceolata (K1), Pinus massoniana (K2), hard broad-leaved species (K3), and soft broad-leaved species (K4).
The species composition coefficient was incorporated into the model to address the issues associated with the expression of the mixed-species ratios. The general form of the carbon storage model related to the species composition is expressed as f[Li(aij,Kj),M,β]. Li(aij,Kj) is a linear function; specifically, Li(aij,Kj) = ai1K1 + ai2K2 + ai3K3 + ai4K4, where K1 represents Cunninghamia lanceolata, K2 represents Pinus massoniana, K3 represents the hard broadleaf species (group), and K4 represents the soft broadleaf species (group). The values were in the range of [0, 10] and the sum K1 + K2 + K3 + K4 = 10.
where W is the stand carbon storage, M is the stand volume, L1 and L2 are the parameters to be determined in the model, and β represents the model estimation error.
There are differences in carbon storage among the different tree organs. If models are established for total carbon storage (W0), branches (W1), roots (W2), leaves (W3), and trunks (W4) separately, the total amount (W0) is not equal to the algebraic sum of the components (W1 + W2 + W3 + W4). To address this problem, a holistic modeling approach was adopted to resolve the incompatibility between the total and components, forming an additive carbon storage model system. The technical approach involves first establishing the total model and then establishing the component ratio models. The component amounts were calculated proportionally to the total amount.
As forests grow and develop, the proportion of carbon storage distributed among different components constantly changes. The establishment of a joint estimation system for the components aims to solve the incompatibility issue of independent models. It determines the proportions of the carbon storage components at different growth stages of the forest, and the sum of the proportions satisfies the 100% constraint. In this study, a joint estimation method was used for the nonlinear models to address the incompatibility issues between the total and component models. The basic principles of this method are as follows.
Let the general formulas for the carbon storage models of the entire stand (W0), branches (W1), roots (W2), leaves (W3), and trunks (W4) be f0(Li,M,β), f1(Li,M,β), f2(Li,M,β), f3(Li,M,β), and f4(Li,M,β), respectively. To ensure compatibility between the component models and the total forest carbon storage model, the following formulas were used to control and build a comprehensive carbon storage model:
where ,,,, and represent the comprehensive carbon storage models for the whole tree (total), branches, roots, leaves, and trunks, respectively, and W′ is the estimated value for the total model, W0.
Let and , . Substituting these expressions into the above formulas, we obtain the following:
This section outlines the basic principles of holistic modeling. By constructing a holistic tree carbon storage model, consistency between the estimates of the total and the individual components was achieved.
3.2. Construction of Dynamic Stand Volume Estimation Model
In the stand carbon storage model, an important independent variable (M) exists, where M represents the actual stand volume. Utilizing f(Li,M,β) allows for the measurement of the actual stand carbon storage. To estimate future trends in carbon storage and the forest carbon sequestration potential, it is necessary to establish a dynamic stand volume estimation model.
Constructing a dynamic estimation model for the stand volume requires the selection of an appropriate growth equation, which is a fundamental task. Among the commonly used growth equations, the Richards equation was chosen as the base equation for constructing the dynamic estimation of stand volume and is expressed as follows:
where M represents the stand volume; T represents the age of the stand; b, c, and z are the parameters to be determined in the model; and β represents the model’s estimation error.
To solve the problem associated with determining the age of uneven-aged forests, a dynamic estimation model for the stand volume using the interval periods as the independent variables was derived from Equation (11) as follows:
where M1 is the current (initial) stand volume, M2 is the future (final) stand volume, and Tn represents the interval period (Tn = T2 − T1; T2 and T1 are the final and initial ages of the stand, respectively).
The model parameter b, which is estimated as the maximum value, is generally related to the site quality and can be established as a function of the site quality grades, i.e., b = f(bi,Ii) = b1I1 + b2I2 + b3I3 + b4I4. Here, I1, I2, I3, and I4 represent the site quality grades for class 1, class 2, class 3, and class 4, respectively; the values for the site quality grades are either 0 or 1, where, if the site is fertile, I1 = 1 and I2, I3, and I4 are 0; if the site is moderately fertile, I2= 1, and I1, I3, and I4 are 0, and so forth. The parameters b1, b2, b3, and b4 were determined using the model.
The parameter c represents the rate of change in stand volume with age, and z is related to the assimilation process during tree growth, functioning as a function of the species composition coefficients, with the mathematical expressions c = c1K1 + c2K2 + c3K3 + c4K4 and z = z1K1 + z2K2 + z3K3 + z4K4. Here, c1, c2, c3, c4, z1, z2, z3, and z4 are the parameters to be determined by the model.
In summary, the dynamic estimation model for stand carbon storage constructed in this study is related to site quality and species composition.
3.3. Parameter Estimation and Accuracy Evaluation
To ensure robustness, the parameter estimation and model validation were conducted concurrently. The methods used for the parameter estimation include traditional intelligent algorithms. Traditional algorithms mainly include the conventional least-squares, improved simplex, and golden section methods. Intelligent algorithms include the immune evolutionary algorithm (IEA) and genetic algorithms, among others. In this study, a combination of the IEA and improved simplex method was used to estimate the model parameters.
The IEA, inspired by biological immune mechanisms, identifies optimal solutions by simulating evolutionary processes, where the fittest individuals are typically closest to the global optimum and carry key problem-solving characteristics [17]. The improved simplex method constructs a simplex in an n + 1 dimensional space and iteratively replaces the worst-performing point with a reflection point to approach the optimal solution. This process adapts through reflection, expansion, and contraction strategies to accelerate convergence [18,19].
Compared with traditional optimization approaches, the combined use of the IEA and improved simplex method offers notable advantages. The IEA provides global search capability and maintains diversity in the solution space, effectively avoiding premature convergence. Meanwhile, the improved simplex method enhances local search efficiency through adaptive operations such as reflection, expansion, and contraction. It dynamically adjusts the step sizes to improve the convergence stability and accuracy. The complementary strengths of these two methods enable efficient and robust parameter estimation in the high-dimensional, nonlinear models developed in this study.
Cross-validation divides all the samples into five groups. In each iteration, one group is selected as the validation sample and does not participate in the modeling, whereas the other four groups serve as modeling samples to determine the model parameters. Throughout the modeling process, modeling and testing are conducted concurrently, with five rounds in total, where each sample undergoes one validation and four modeling sessions [20].
The model evaluation metrics included the correlation index (R), residual standard deviation (RSD), total relative error (RS), mean systematic error (MSE), mean absolute relative error (RMA), and prediction accuracy (EA). The metrics calculated from the modeling samples were used as the fitting accuracy indicators, whereas those calculated from the samples that did not participate in the modeling served as the applicability (or usability) accuracy indicators.
3.4. Simulation Calculation Method to Determine Harvesting Volume
To reflect the trends and potential of forest carbon storage more accurately, the forest harvesting volume was determined using a simulation calculation method. This method, combined with the stand volume and carbon storage estimation models, was used to forecast future carbon storage and its changes. The simulation calculation method simulated stand growth by controlling stand area and was based on legal forest theory to calculate the annual harvesting volume of the stands [21,22].
Because the harvesting of natural forests is currently not permitted in China, this simulation was conducted only for plantations, revealing trends in forest carbon storage and increases (carbon sequestration) under reasonable harvesting volumes. The formula for calculating this increase is as follows:
where represents the increase, is the forest carbon storage at time T2, and is the forest carbon storage at time T1.
3.5. Simplified Overview of the Modeling Framework
To assist readers less familiar with mathematical modeling, a simplified overview of the modeling process is provided here. The overall modeling framework includes three key components: (1) an estimation of the stand volume using site quality and species composition; (2) a calculation of the total carbon storage based on stand volume and species composition coefficients; and (3) the decomposition of total carbon storage into individual components (trunk, branch, root, and leaf) using a compatible, additive modeling structure. These models were calibrated using optimization algorithms to ensure accuracy and applicability across the dominant tree species and site conditions.
4. Results
4.1. Analysis of Stand Carbon Storage Modeling Results
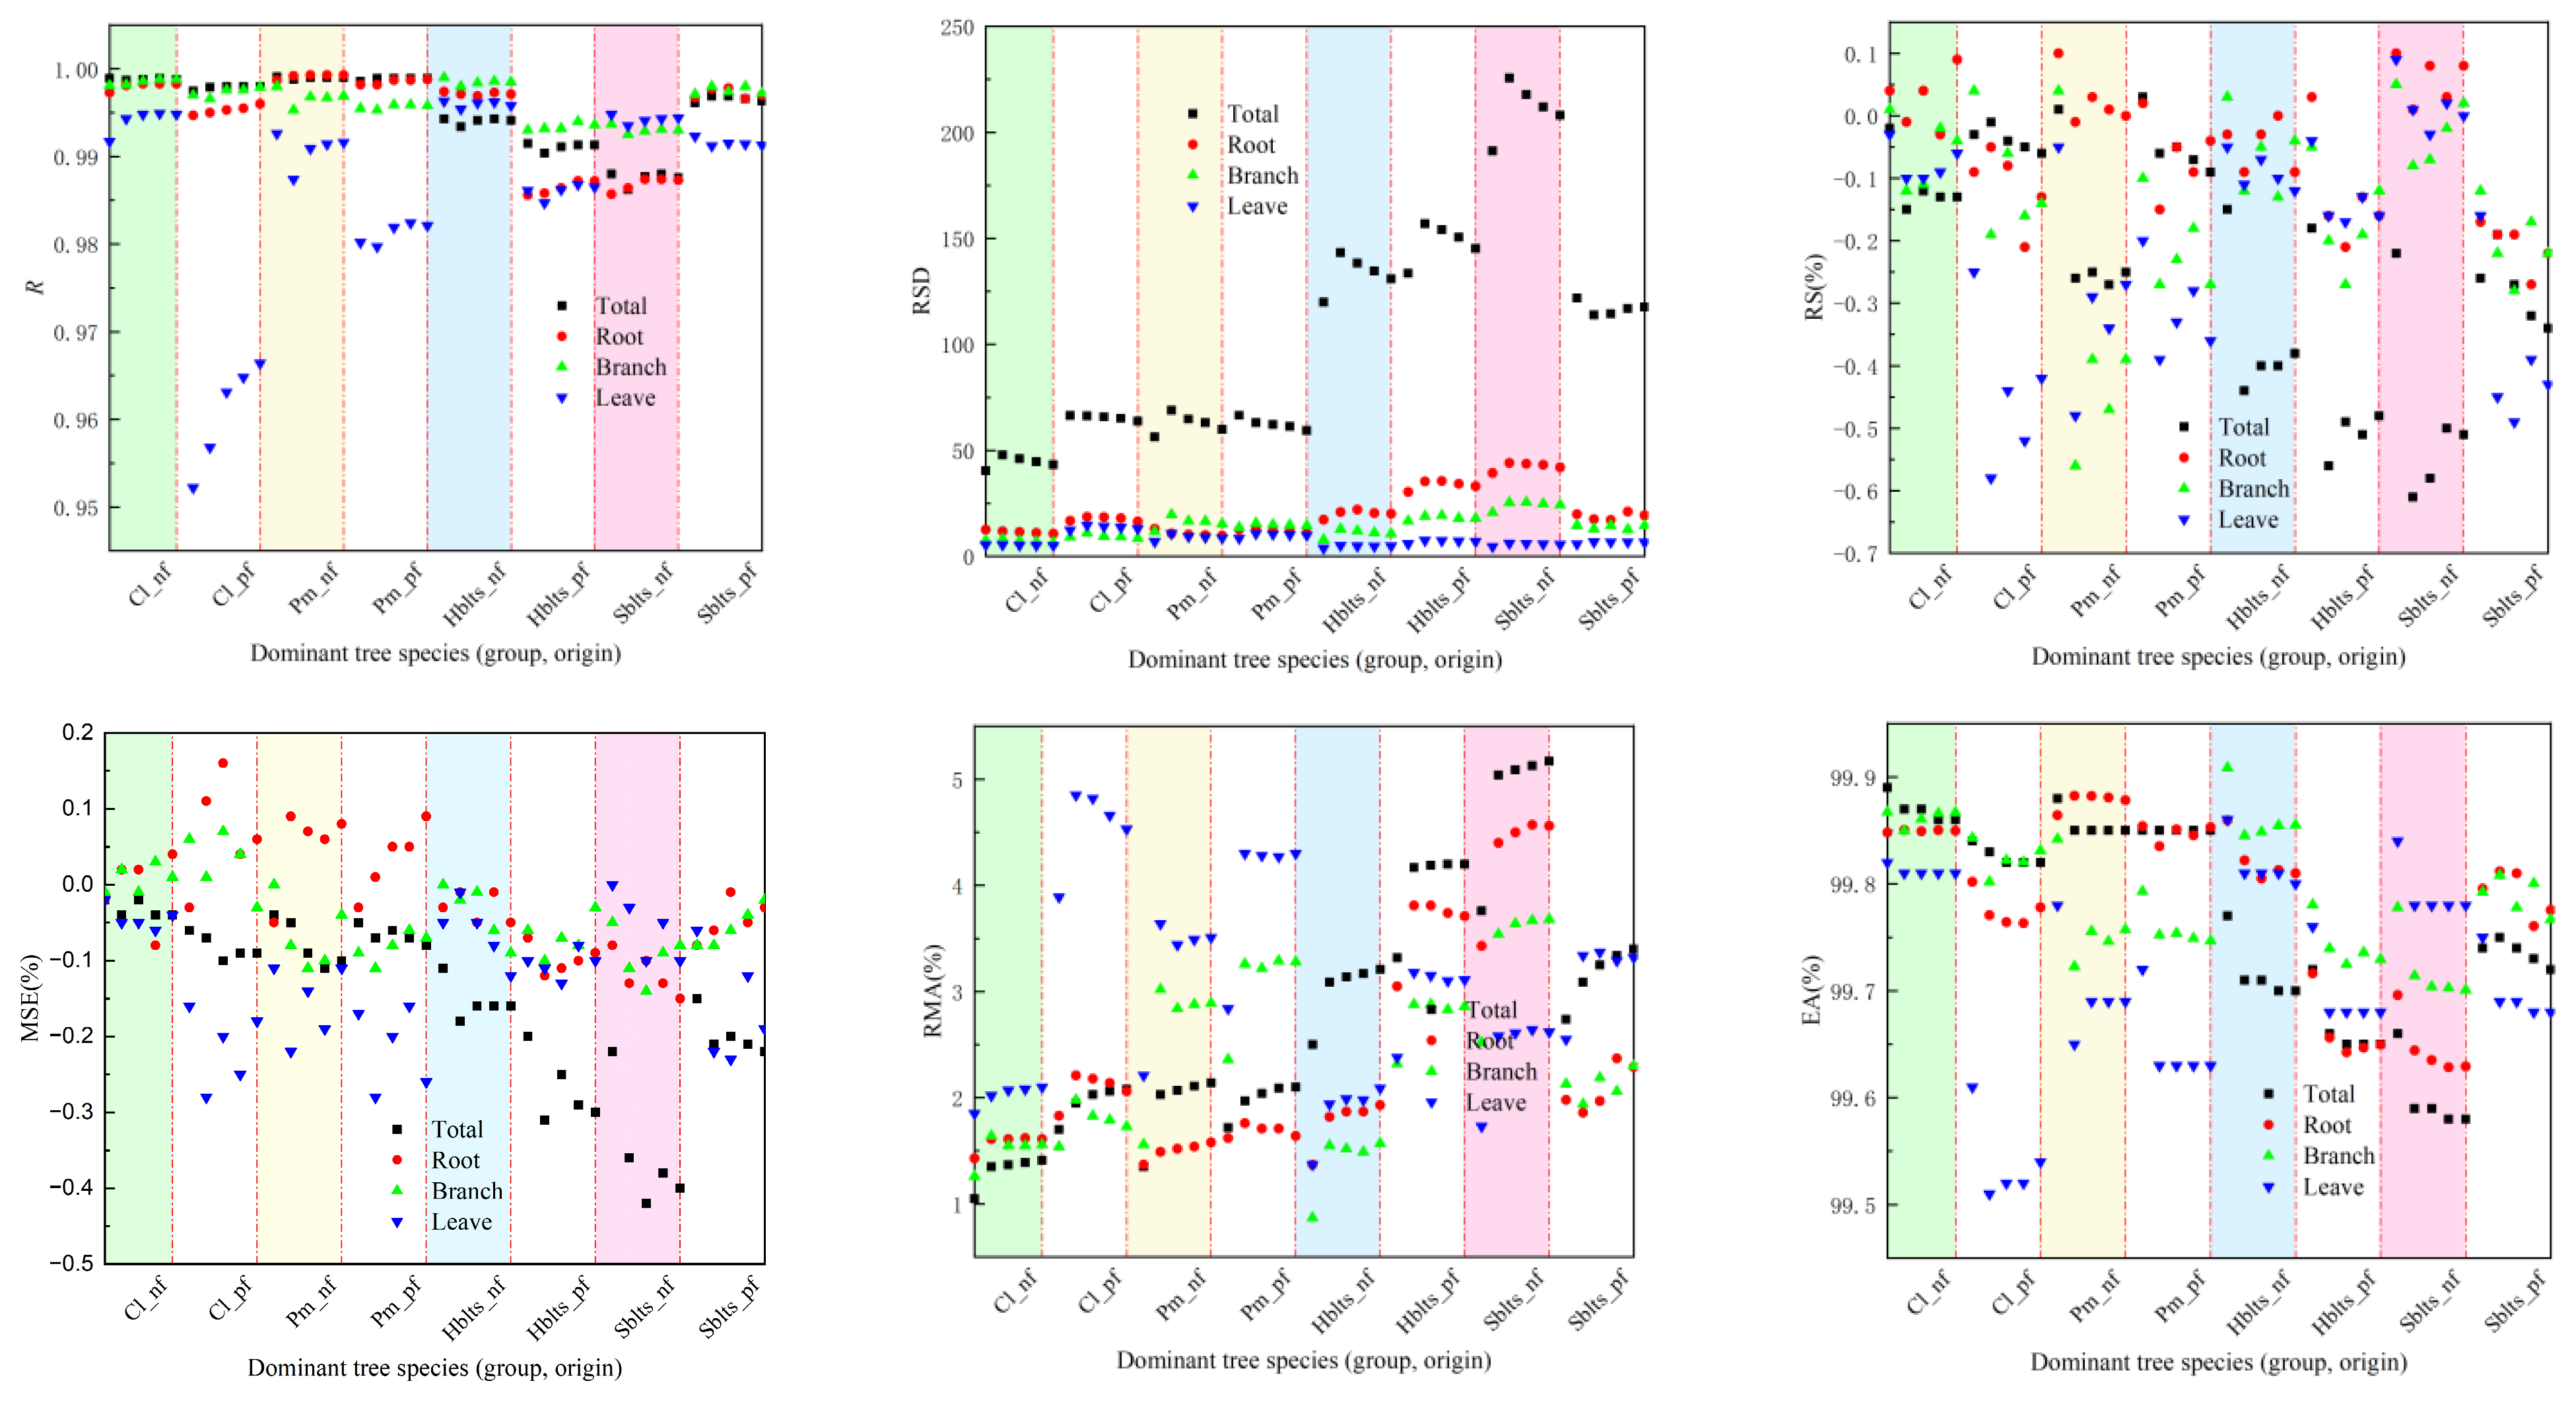
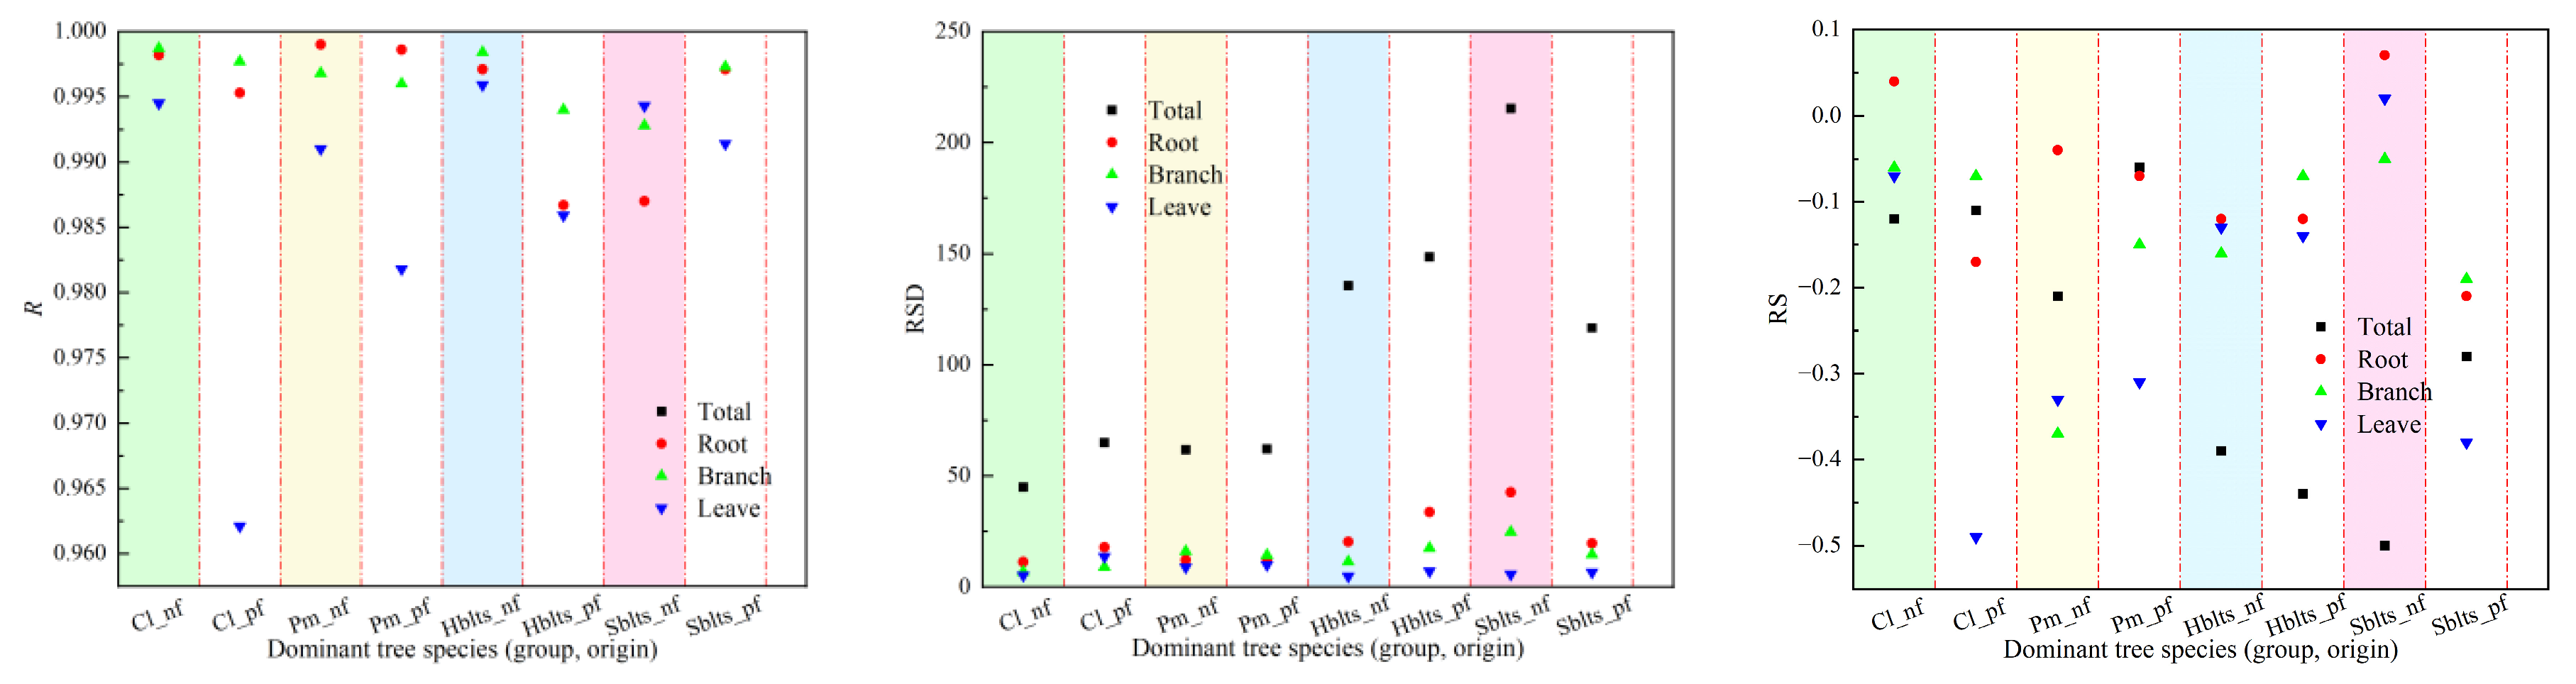
The samples were divided into five groups for the synchronous modeling and testing to obtain cross-modeling and testing accuracy values for each dominant tree species (group and origin), as shown in Figure 1 and Figure 2. For modeling accuracy (Figure 1), the overall R value exceeded 0.9860, the RSD values ranged from 40.44 to 225.66, the RS and MSE values were within ±1%, the RMA values remained below 5.5%, and the EA values surpassed 99.50%. Specifically, for the roots, the R value exceeded 0.9800, the RSD values were between 9.80 and 45.00, the RS and MSE values were within ±2%, the RMA values stayed below 5%, and the EA values surpassed 99.60%. For the branches, the R value was greater than 0.9920, the RSD values ranged from 6.50 to 25.50, the RS and MSE values were within ±1%, the RMA values remained below 4%, and the EA values exceeded 99.70%. For the leaves, the R value surpassed 0.9550, the RSD values ranged from 3.90 to 14.70, the RS and MSE values were within ±0.7%, the RMA values stayed below 5%, and the EA values exceeded 99.50%. These results indicate that the cross-modeling fitting accuracy for each dominant tree species (group and origin) was high, particularly for branches.
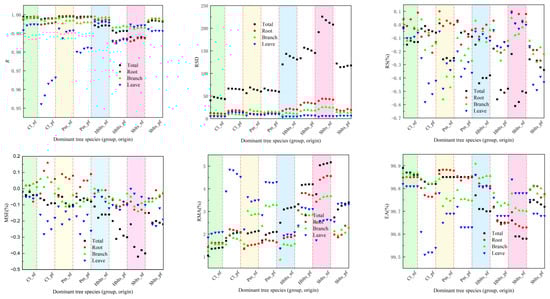
Figure 1.
Accuracy indicators for modeling in cross-modeling. The x-axis represents the categorical species groups (group and origin); the data points are shown as separate markers without connecting lines to avoid misinterpretation of continuity. The evaluation indicators RS, MSE, RMA, and EA are expressed as a percentage (%), while R and RSD are dimensionless. The species groups include the following: Cl_pf = Cunninghamia lanceolata plantation, Cl_nf = natural Cunninghamia lanceolata, Pm_pf = Pinus massoniana plantation, Pm_nf = natural Pinus massoniana, HBlts_pf = hard broad-leaved tree species plantation, HBlts_nf = natural hard broad-leaved tree species, Sblts_pf = soft broad-leaved tree species plantation, and Sblts_nf = natural soft broad-leaved tree species.
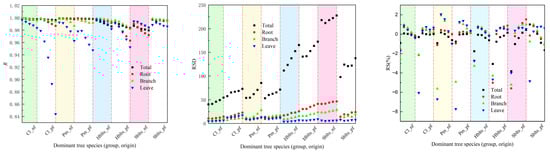
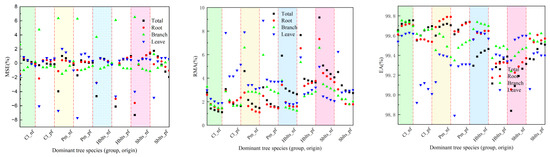
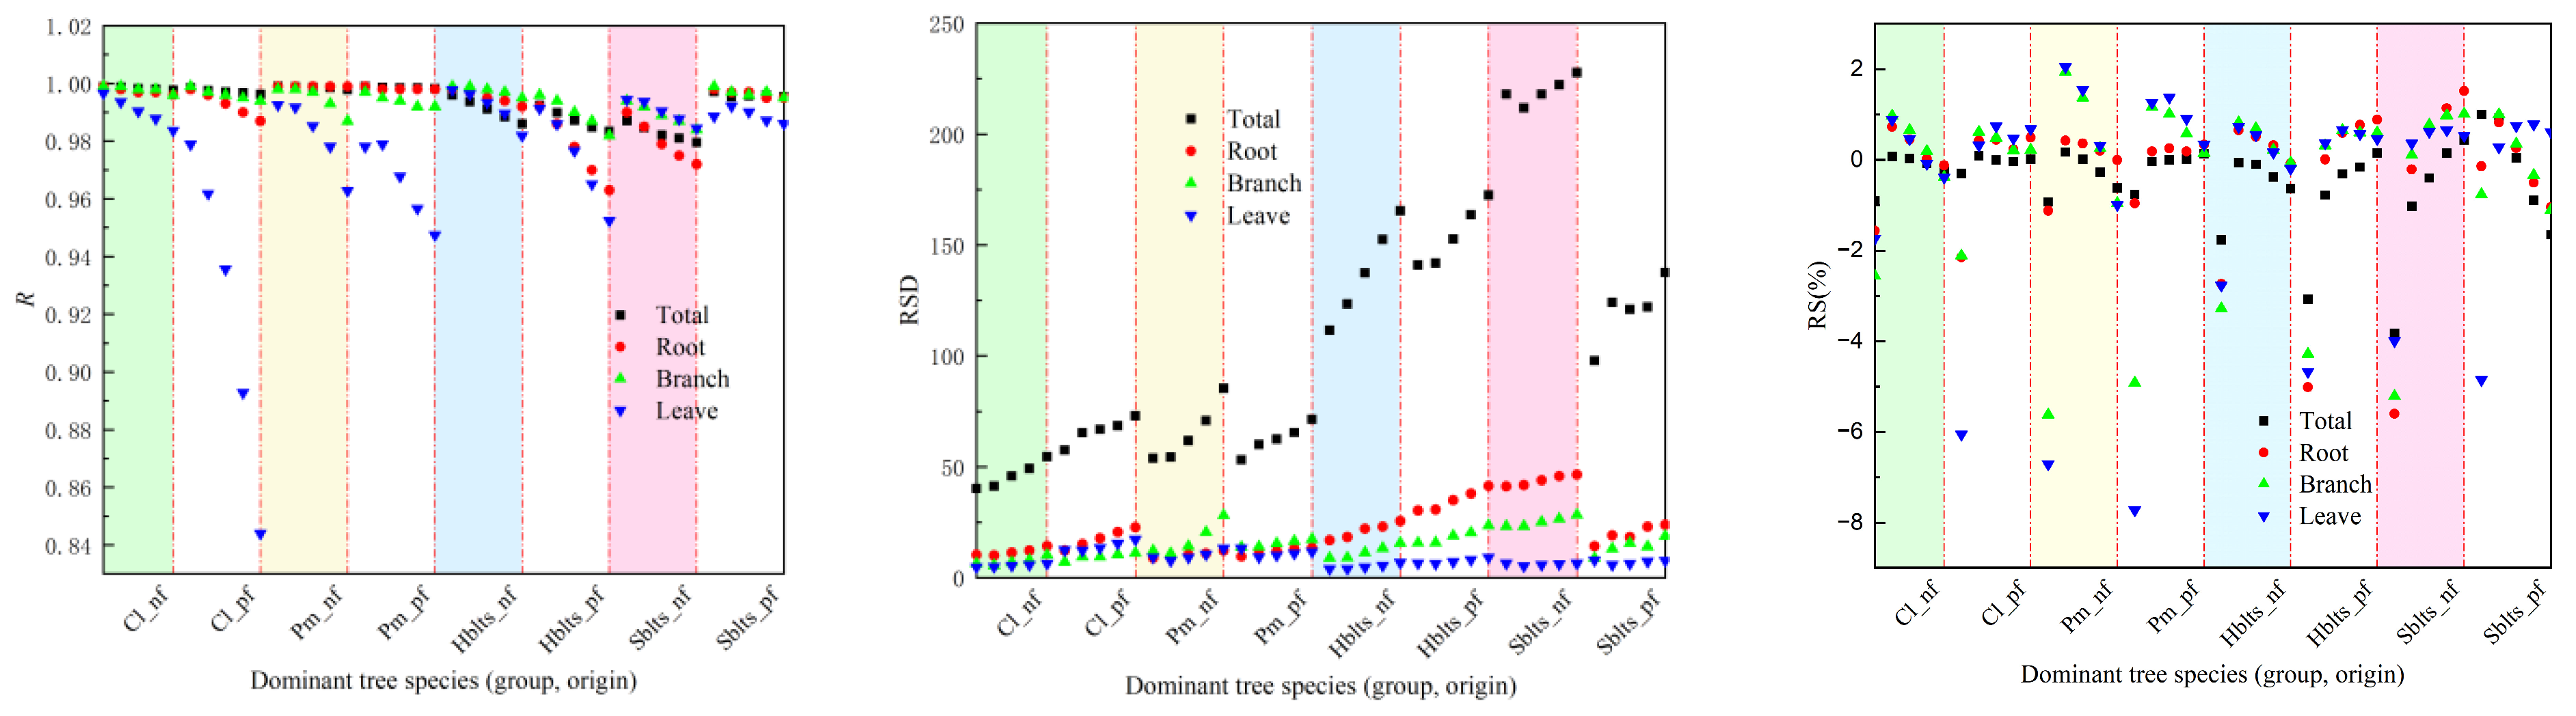
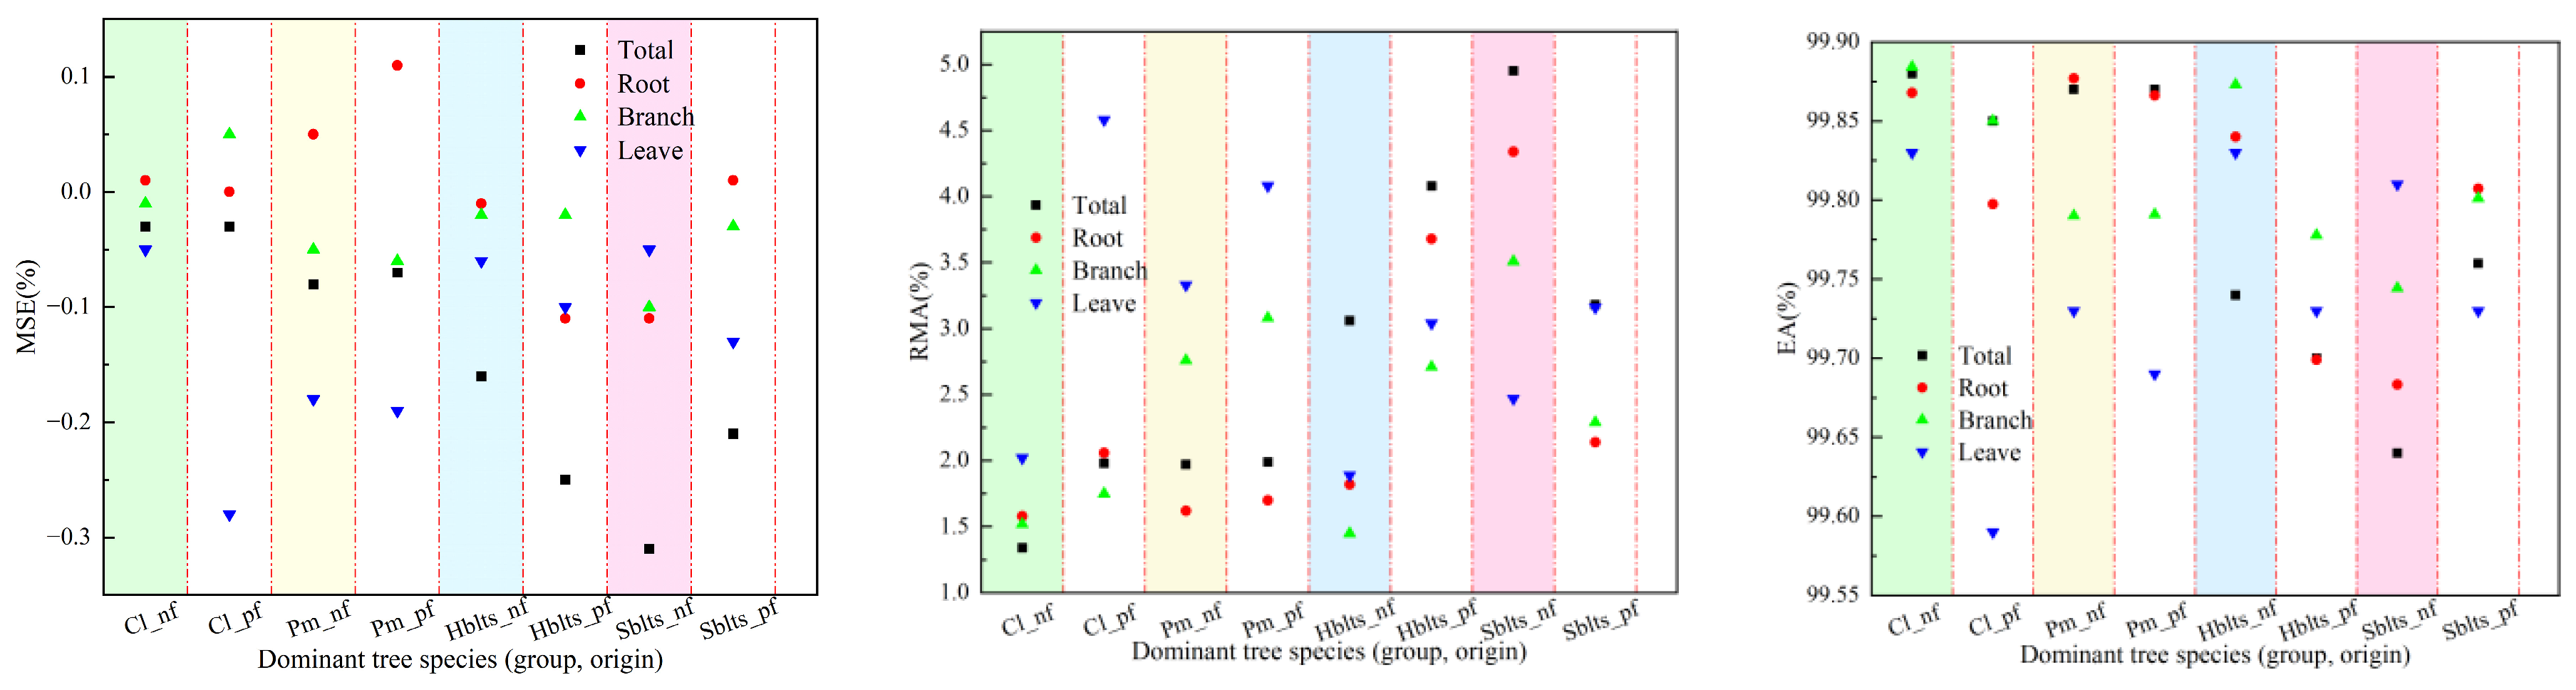
Figure 2.
Accuracy indicators for testing in cross-modeling testing.
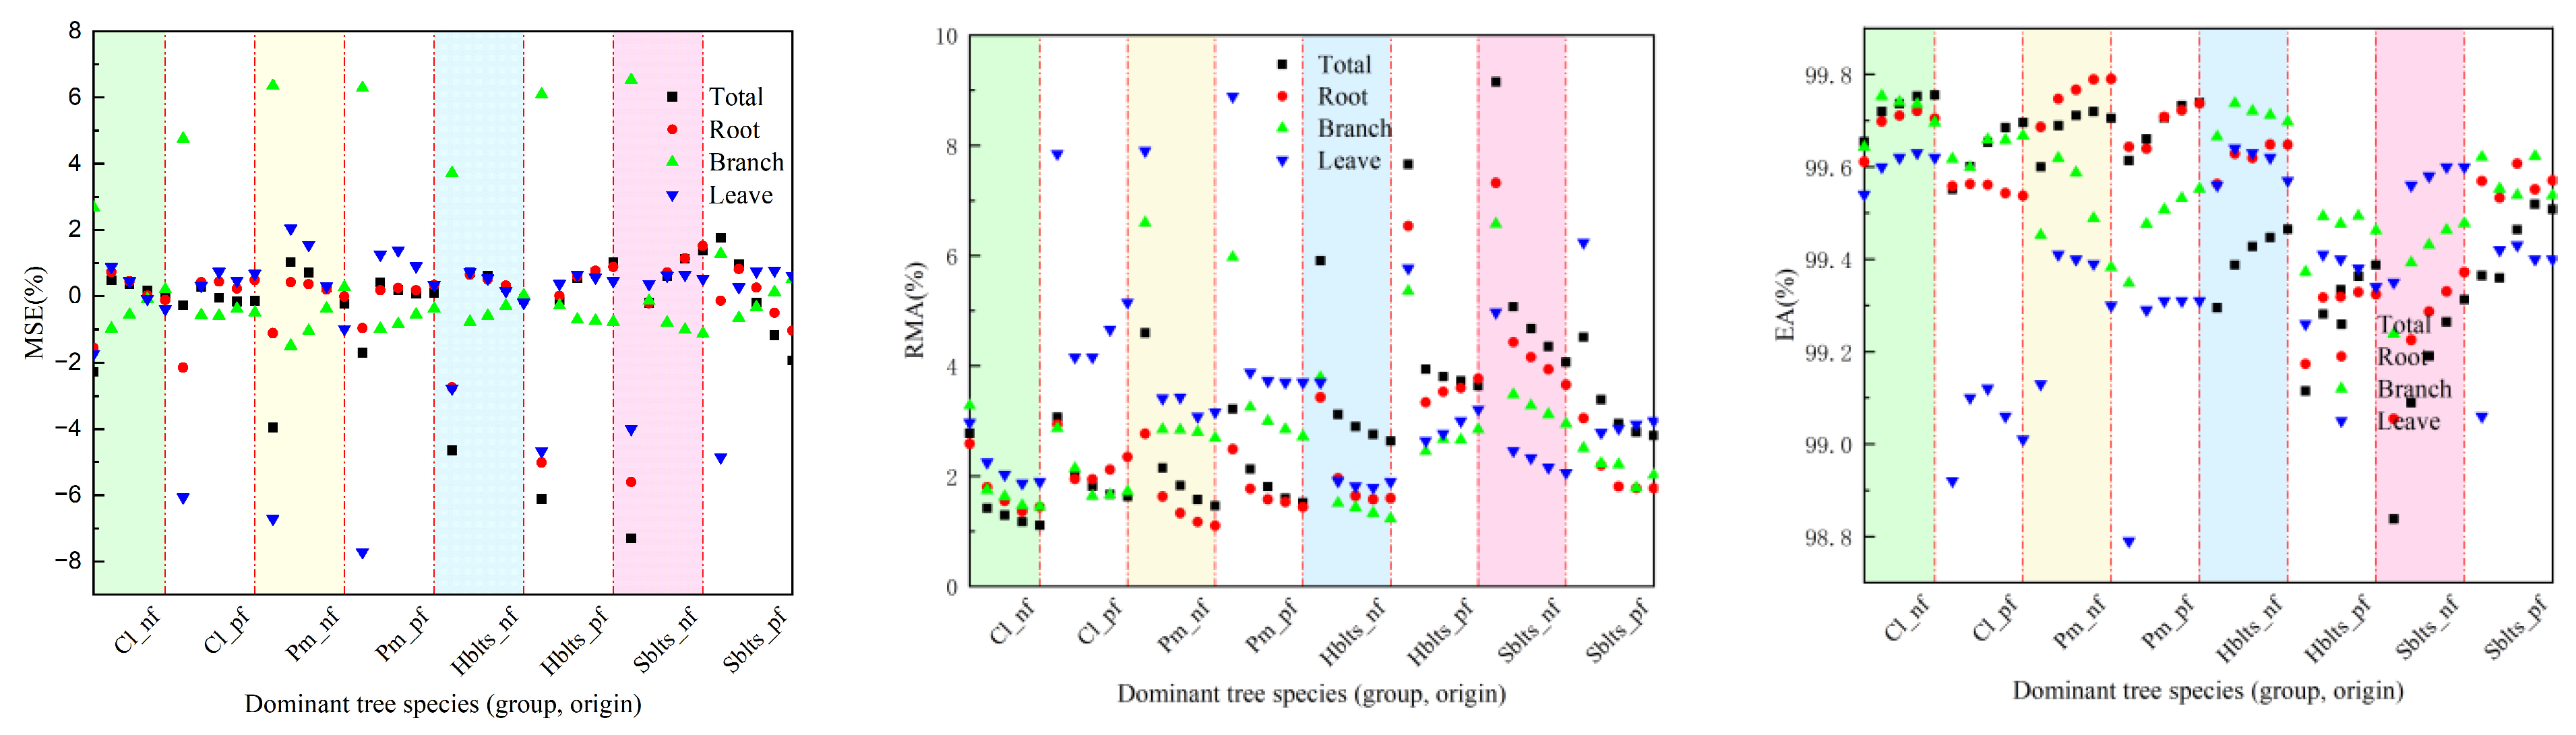
Regarding testing accuracy, as depicted in Figure 2, the overall R value exceeded 0.9800, with RSD values ranging between 40.00 and 227.89, RS and MSE values within ±8%, RMA values below 9.2%, and EA values surpassing 98.80%. Specifically for the roots, the R value was greater than 0.9630, the RSD values ranged between 8.90 and 46.53, the RS and MSE values were within ±6%, the RMA values stayed below 7.5%, and the EA values exceeded 99.05%. For the branches, the R value surpassed 0.9810, the RSD values ranged from 5.65 to 28.33, the RS and MSE values were within ±6%, the RMA values remained below 7%, and the EA values exceeded 99.20%. For the leaves, the R value was above 0.8440, the RSD values ranged from 4.04 to 17.26, the RS and MSE values were within ±8%, the RMA values stayed below 9%, and the EA values exceeded 98.70%. It can be observed that the testing accuracy values are lower than the modeling accuracy values; however, they are still within an acceptable range.
Using all the samples to fit the stand carbon storage model, comprehensive modeling accuracy values for each indicator were obtained (Figure 3), and the model parameter values for carbon storage in various parts of the stand were determined (Table 3). From the perspective of fitting accuracy, the stand carbon storage models for Cl_nf, Cl_pf, Pm_nf, and Pm_pf showed the highest accuracy, followed by those for Hblts_nf, Hblts_pf, Sblts_pf, and Sblts_nf, which had the lowest fitting accuracy among the eight dominant tree species (group and origin). Overall, the R values were greater than 0.9620, the RSD values were within the range of [4.80, 215.39], the RS and MSE values were within ±0.6%, the RMA values were below 5%, and the EA values exceeded 99.50%. The fitting accuracy of the stand carbon storage estimation models for each dominant tree species (group and origin) was high, further improving the cross-modeling and testing accuracy values.
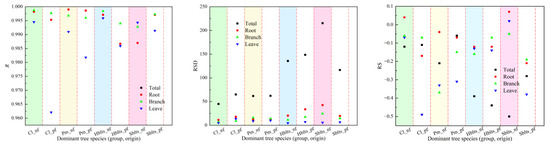
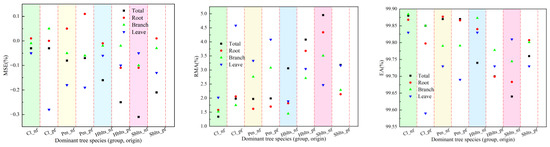
Figure 3.
Comprehensive accuracy values for each indicator in the stand carbon storage model.
Table 3.
Model parameter values for carbon storage in various parts of the stand for each dominant tree species (group and origin).
Regarding the model parameters, for the total volume, the a1j values for Cl_nf, Pm_nf, Hblts_nf, and Sblts_nf were ordered as a11 < a12 < a13 < a14, whereas those for Cl_pf, Pm_pf, Hblts_pf, and Sblts_pf were ordered as a11 < a12 < a14 < a13. In terms of the a2j values, Cl_nf and Cl_pf had the highest a22 values; Pm_nf, Pm_pf, Hblts_nf, and Sblts_pf had the highest a21 values; and Sblts_nf had the highest a23 value. However, the effect of the a2j values on the change in the estimated stand carbon storage was greater than that of the a1j values, indicating that Cunninghamia lanceolata and Pinus massoniana significantly affected the total carbon storage of the stand. The a23 and a24 values were higher for the roots of each dominant tree species (group and origin), indicating that the proportion of hard broadleaf and soft broadleaf species significantly affected the carbon storage of the stand roots. Except for the high a23 value of the leaves in Sblts_pf, the leaves of the other dominant tree species (group and origin) had higher a22 values. The a21 and a22 values were significant for the trunks of each dominant tree species (group and origin).
4.2. Analysis of Stand Volume Modeling Results
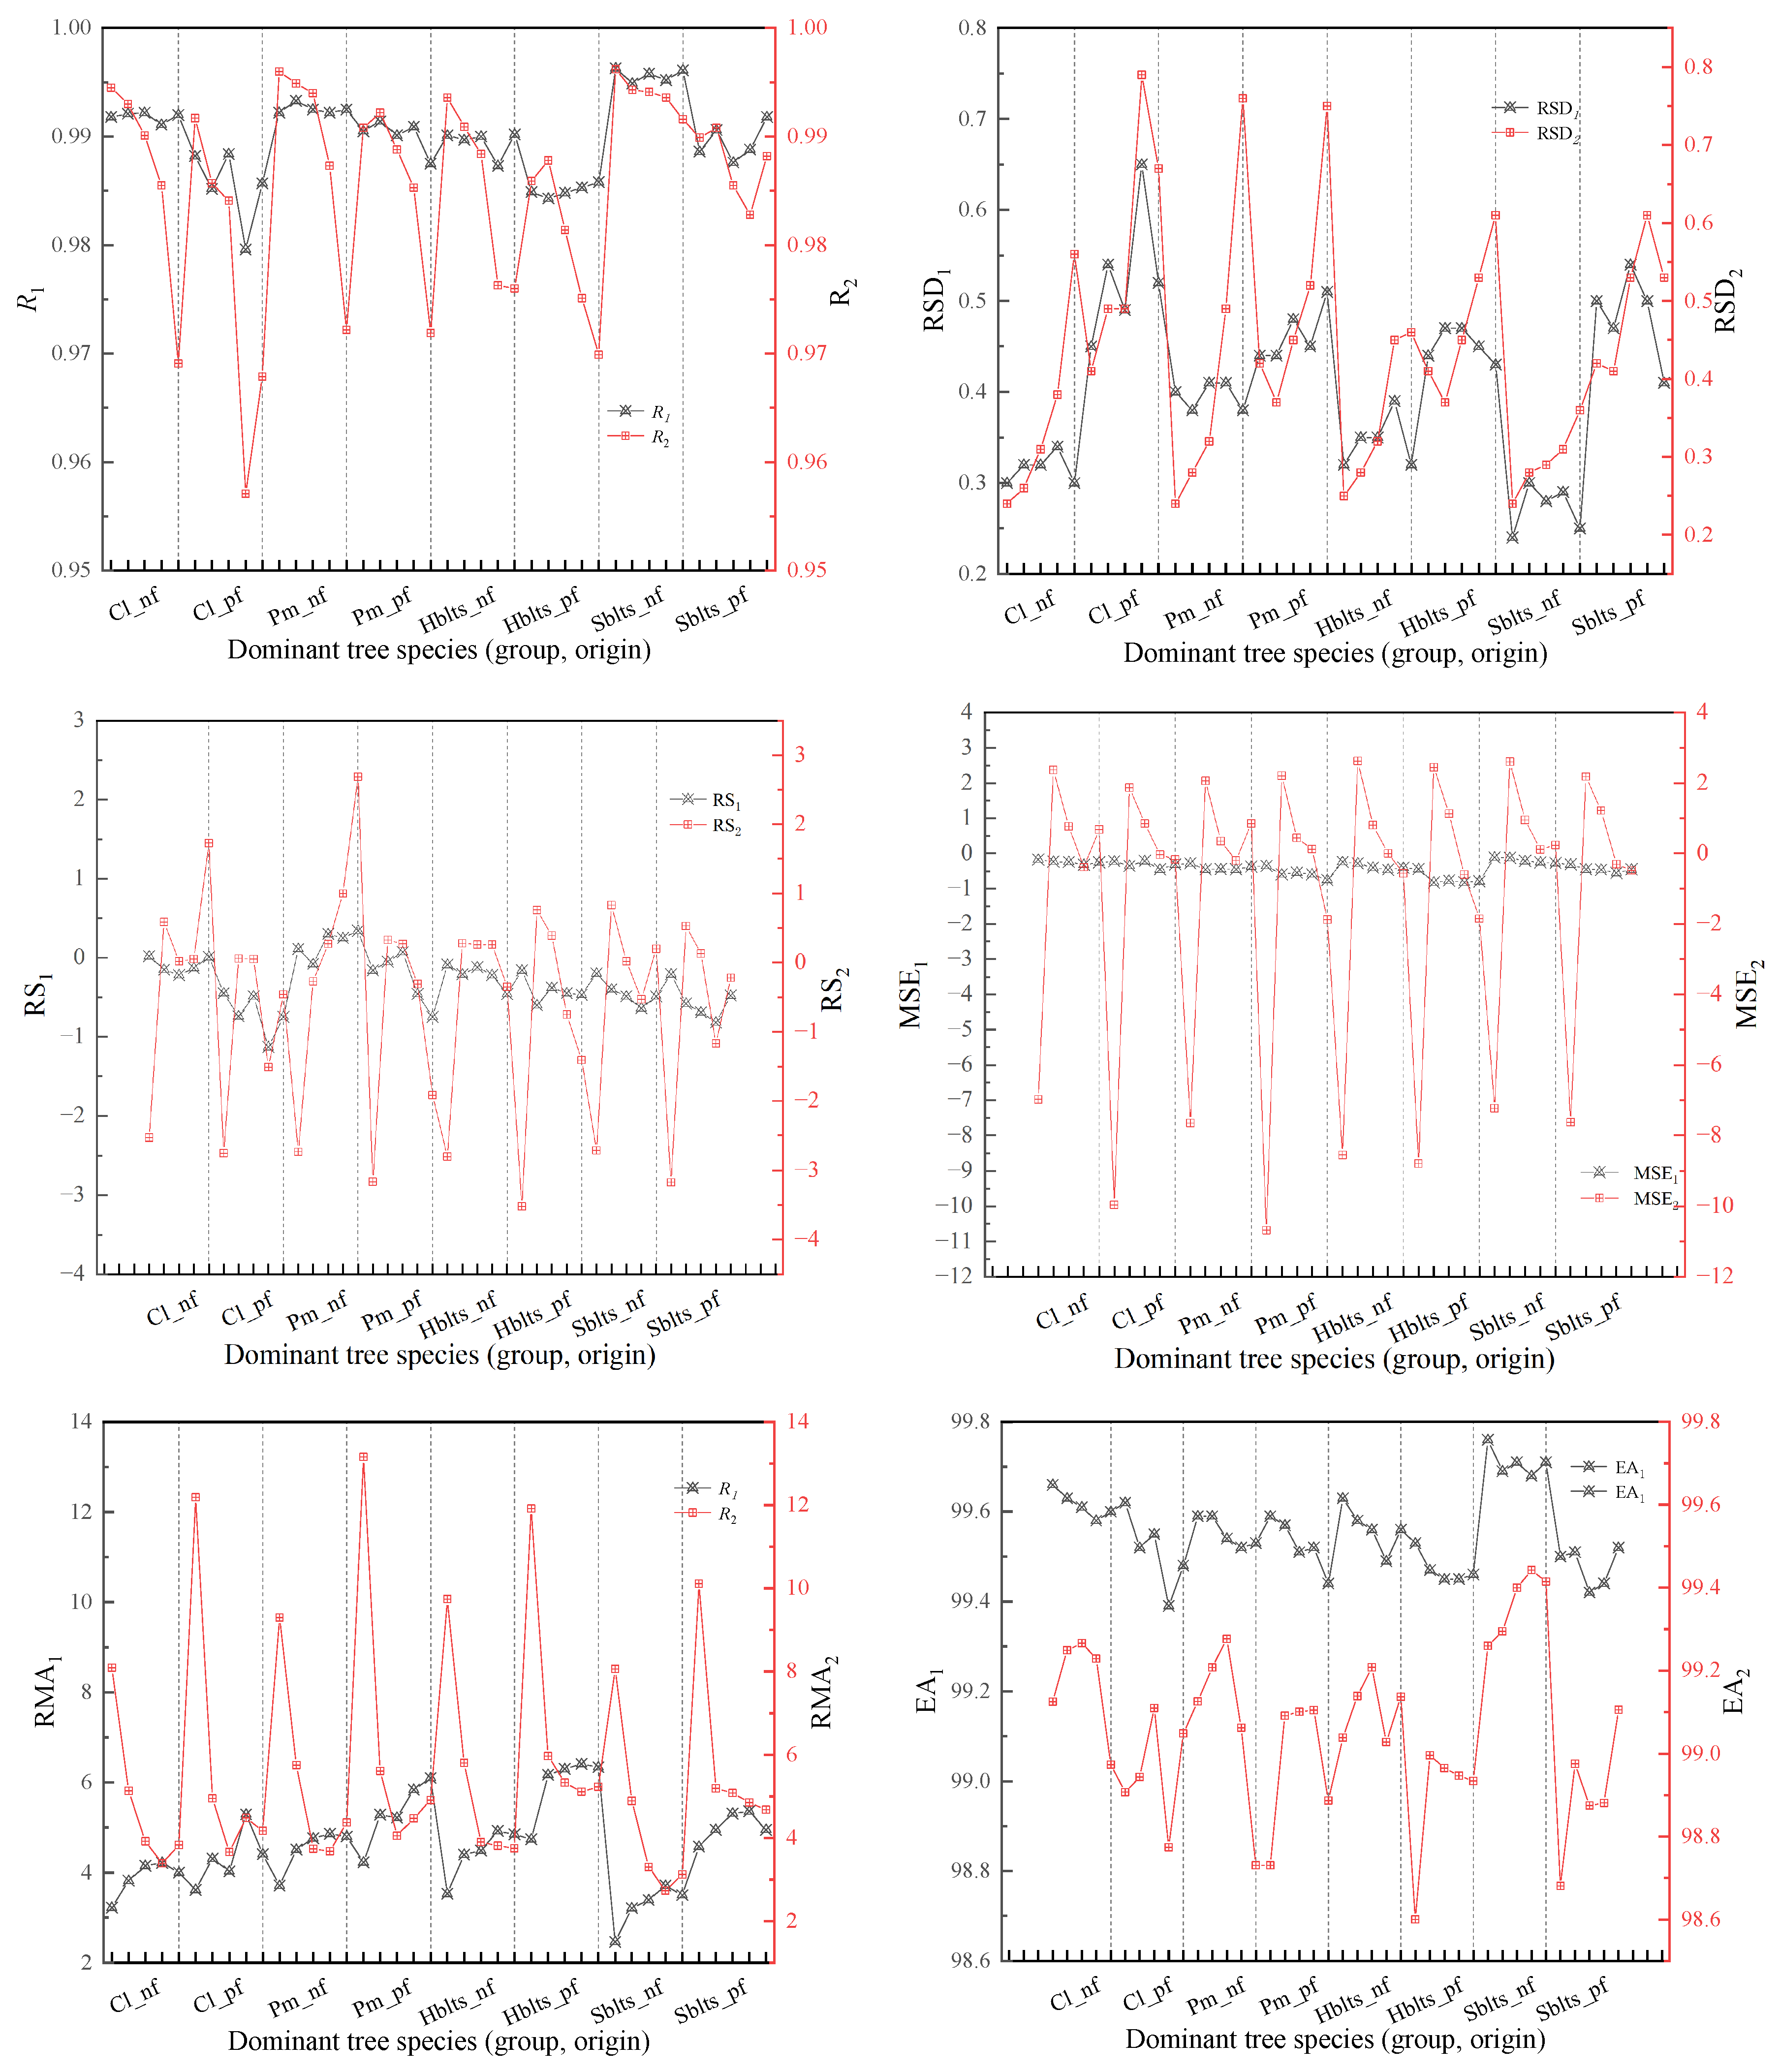
By employing a synchronized approach to cross-modeling and testing, the accuracy values for the stand volume estimation model for each dominant tree species (group and origin) were obtained (Figure 4). Overall, the pattern of changes in the modeling and testing accuracy for stand volume mirrors that of the carbon storage model; that is, modeling accuracy is higher than testing accuracy, and the variation in modeling accuracy among different tree species (group, origin) is relatively small, whereas testing accuracy shows greater fluctuations. The modeling accuracy (R1 > 0.9800, RSD1 < 0.7%) and testing accuracy (R2 > 0.9570, RSD2 < 0.8%) indicated robust model performance. The RS1 and MSE1 values are within ±1.5%, while the RS2 and MSE2 values are within ±10.7%; the RMA1 values are all below 7%, and the RMA2 values are all below 147%; and the EA1 values are all above 99.30%, and the EA2 values are all above 98.6%.
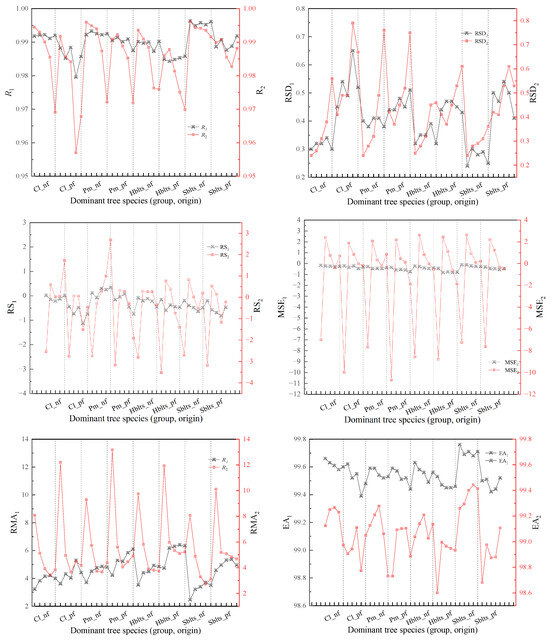
Figure 4.
Cross-modeling and testing accuracy values for the stand volume estimation model of each dominant tree species (group and origin). Black indicates modeling accuracy, while red represents validation accuracy.
Using all the samples to fit the stand volume estimation model, the fitting accuracy and parameter values for each dominant tree species (group and origin) were obtained (Table 4). The R values were greater than 0.9840, the RSD values were in the range of [0.29, 0.57], the RS and MSE values were all within ±1%, the RMA values were all below 6%, and the EA values were above 99.40%. The fitting accuracy of the stand volume estimation models for each dominant tree species (group and origin) was high, further improving the cross-modeling and testing accuracy values.
Table 4.
The fitting accuracy and parameter values for the stand volume estimation model of each dominant tree species (group and origin).
In terms of the model parameters, the bi values were ordered as b1 > b2 > b3 > b4, indicating that the estimated maximum stand volume decreased with decreasing site quality grades, a pattern that aligns with the general relationship between site conditions and tree growth. The ci values generally showed that c1 and c2 were higher than c3 and c4, indicating that Cunninghamia lanceolata and Pinus massoniana have higher growth rates than the hard broadleaf and soft broadleaf species (groups). The ci value is related to the assimilation action power index m during the cumulative process of stand volume, with m = 1− 1/ci, resulting in m values less than 1; in particular, z4 has the smallest value, followed by z3, indicating that the volume growth resistance is more pronounced in hard and soft broadleaf species (groups).
4.3. Analysis of Model Application Results
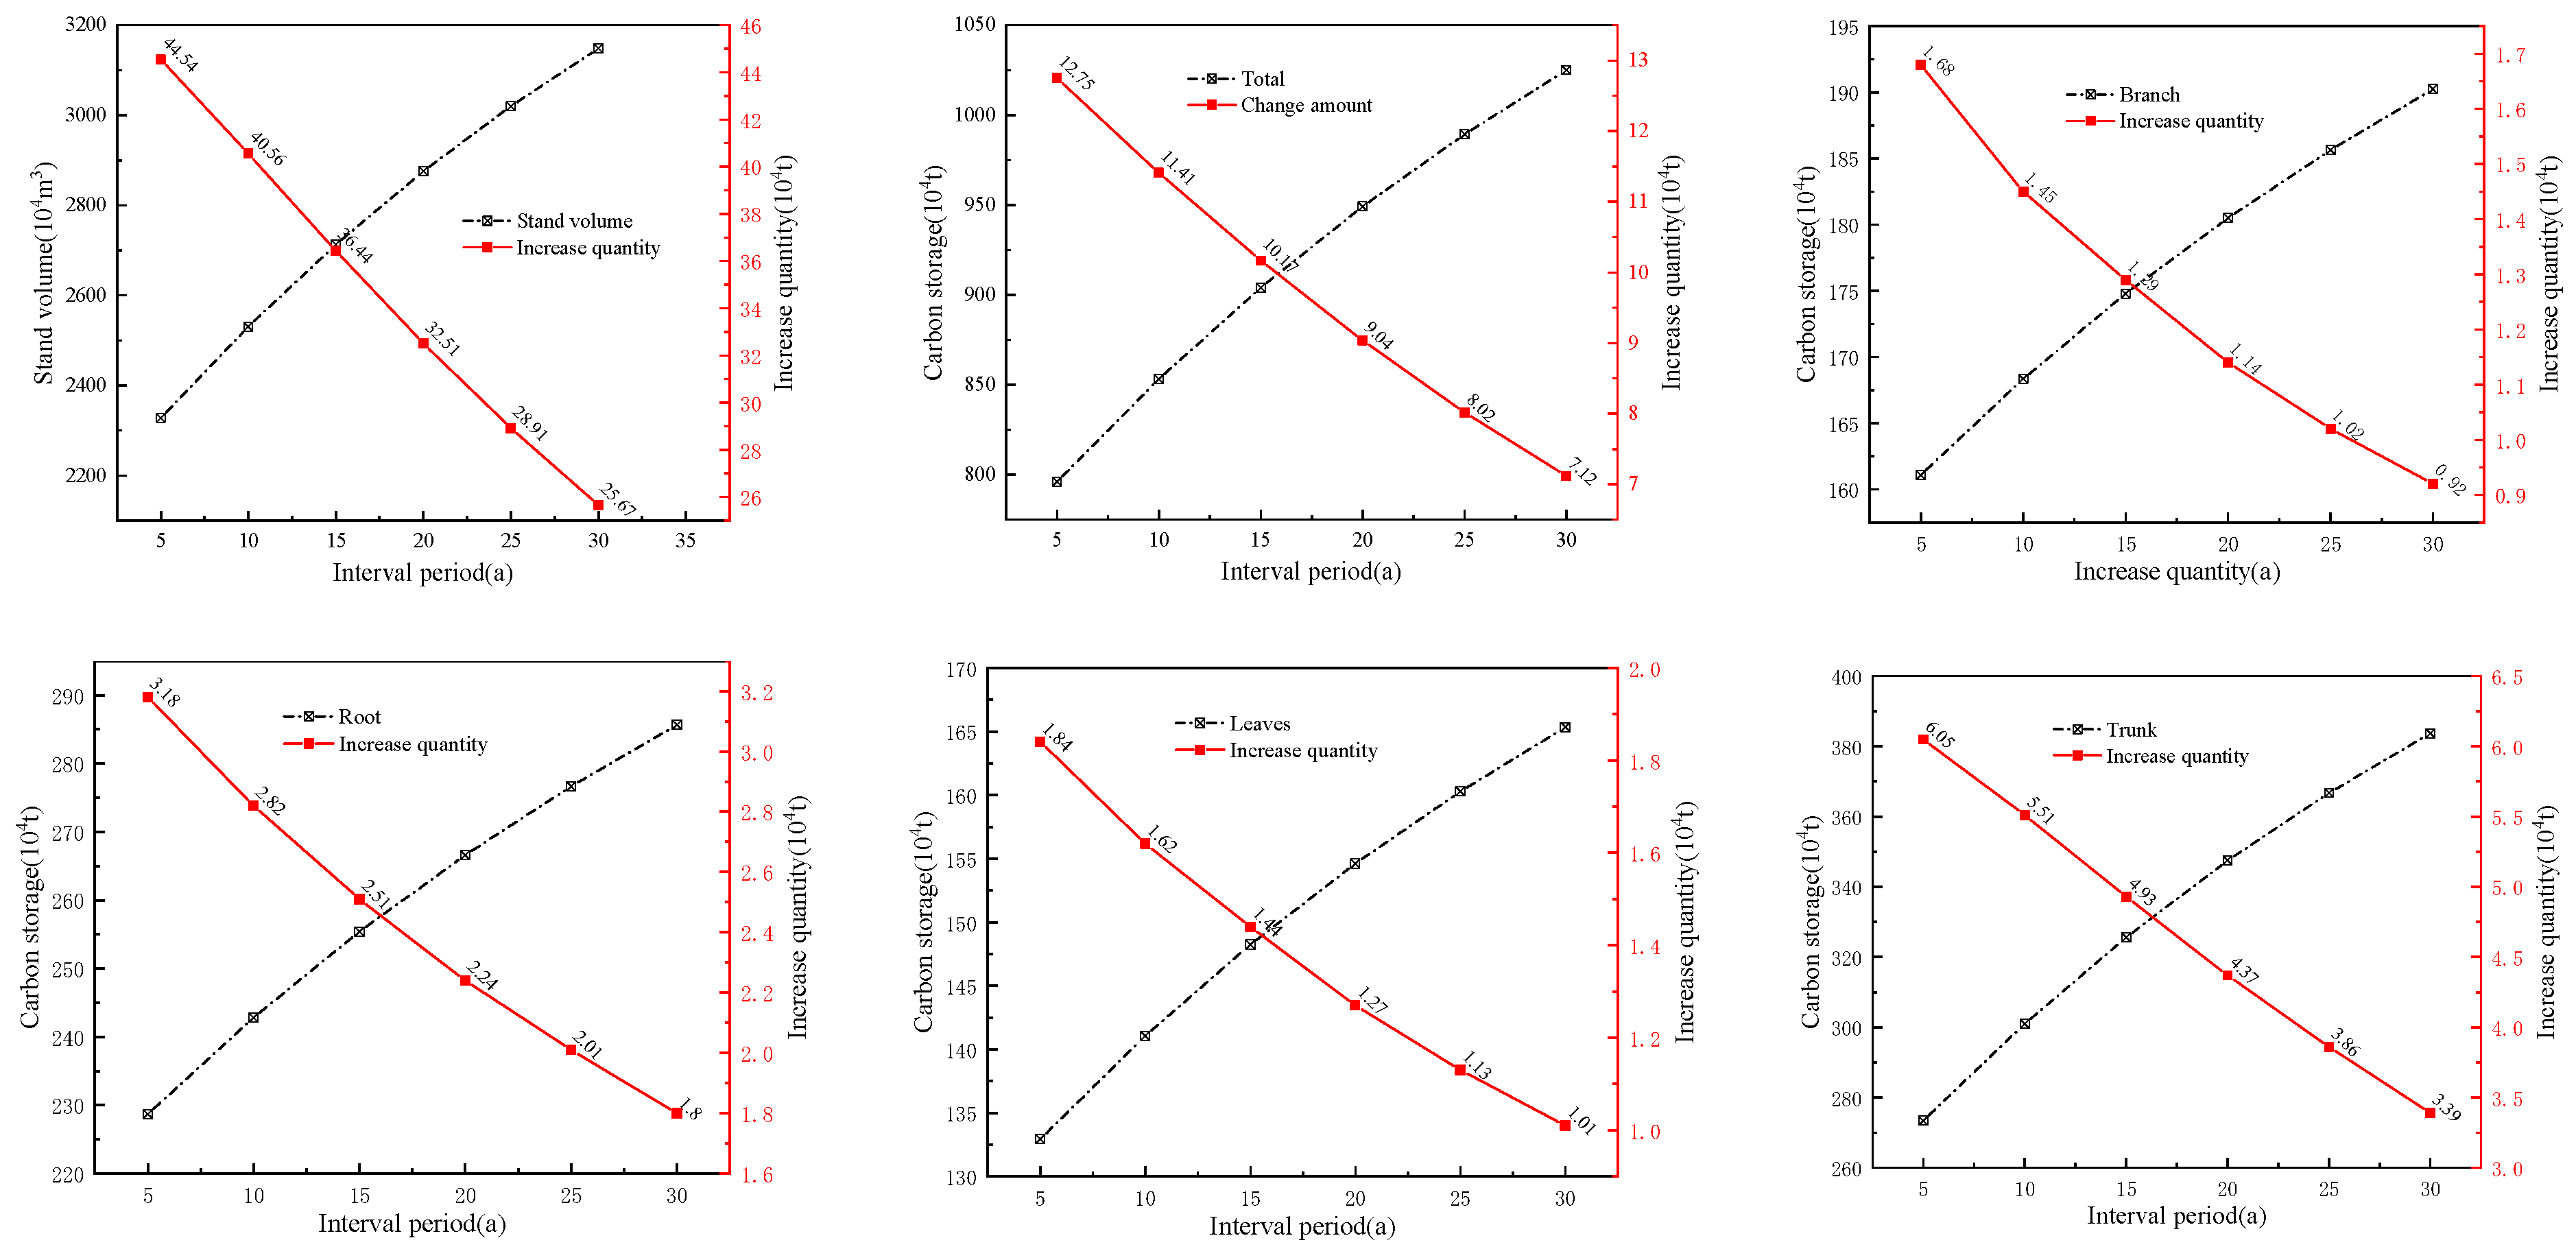
The calculations indicate that the current volume in the case area is 21.0521 million cubic meters, and the carbon storage is 7.3238 million tons. The carbon storage capacities of the stand branches, roots, leaves, and trunks were 0.1527, 0.2128, 0.12376, and 0.24311 million tons, respectively. Given interval periods of 5, 10, 15, 20, 25, and 30 years, without considering the theoretical logging volume, the calculated volumes and carbon storage, along with their corresponding changes for different interval periods, are shown (Figure 5). It can be observed that both the volume and carbon storage of each part increase with the extension of the interval period, but the magnitude of the increase shows a similar directional change, primarily because of the resistance induced by the stand volume estimation model.
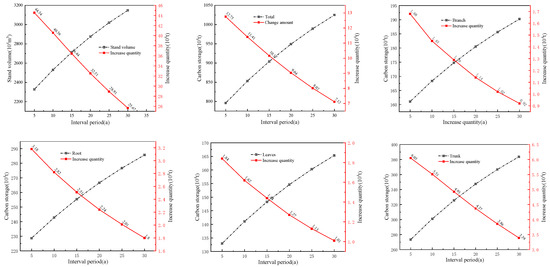
Figure 5.
Changes in stand volume and carbon storage over different interval periods.
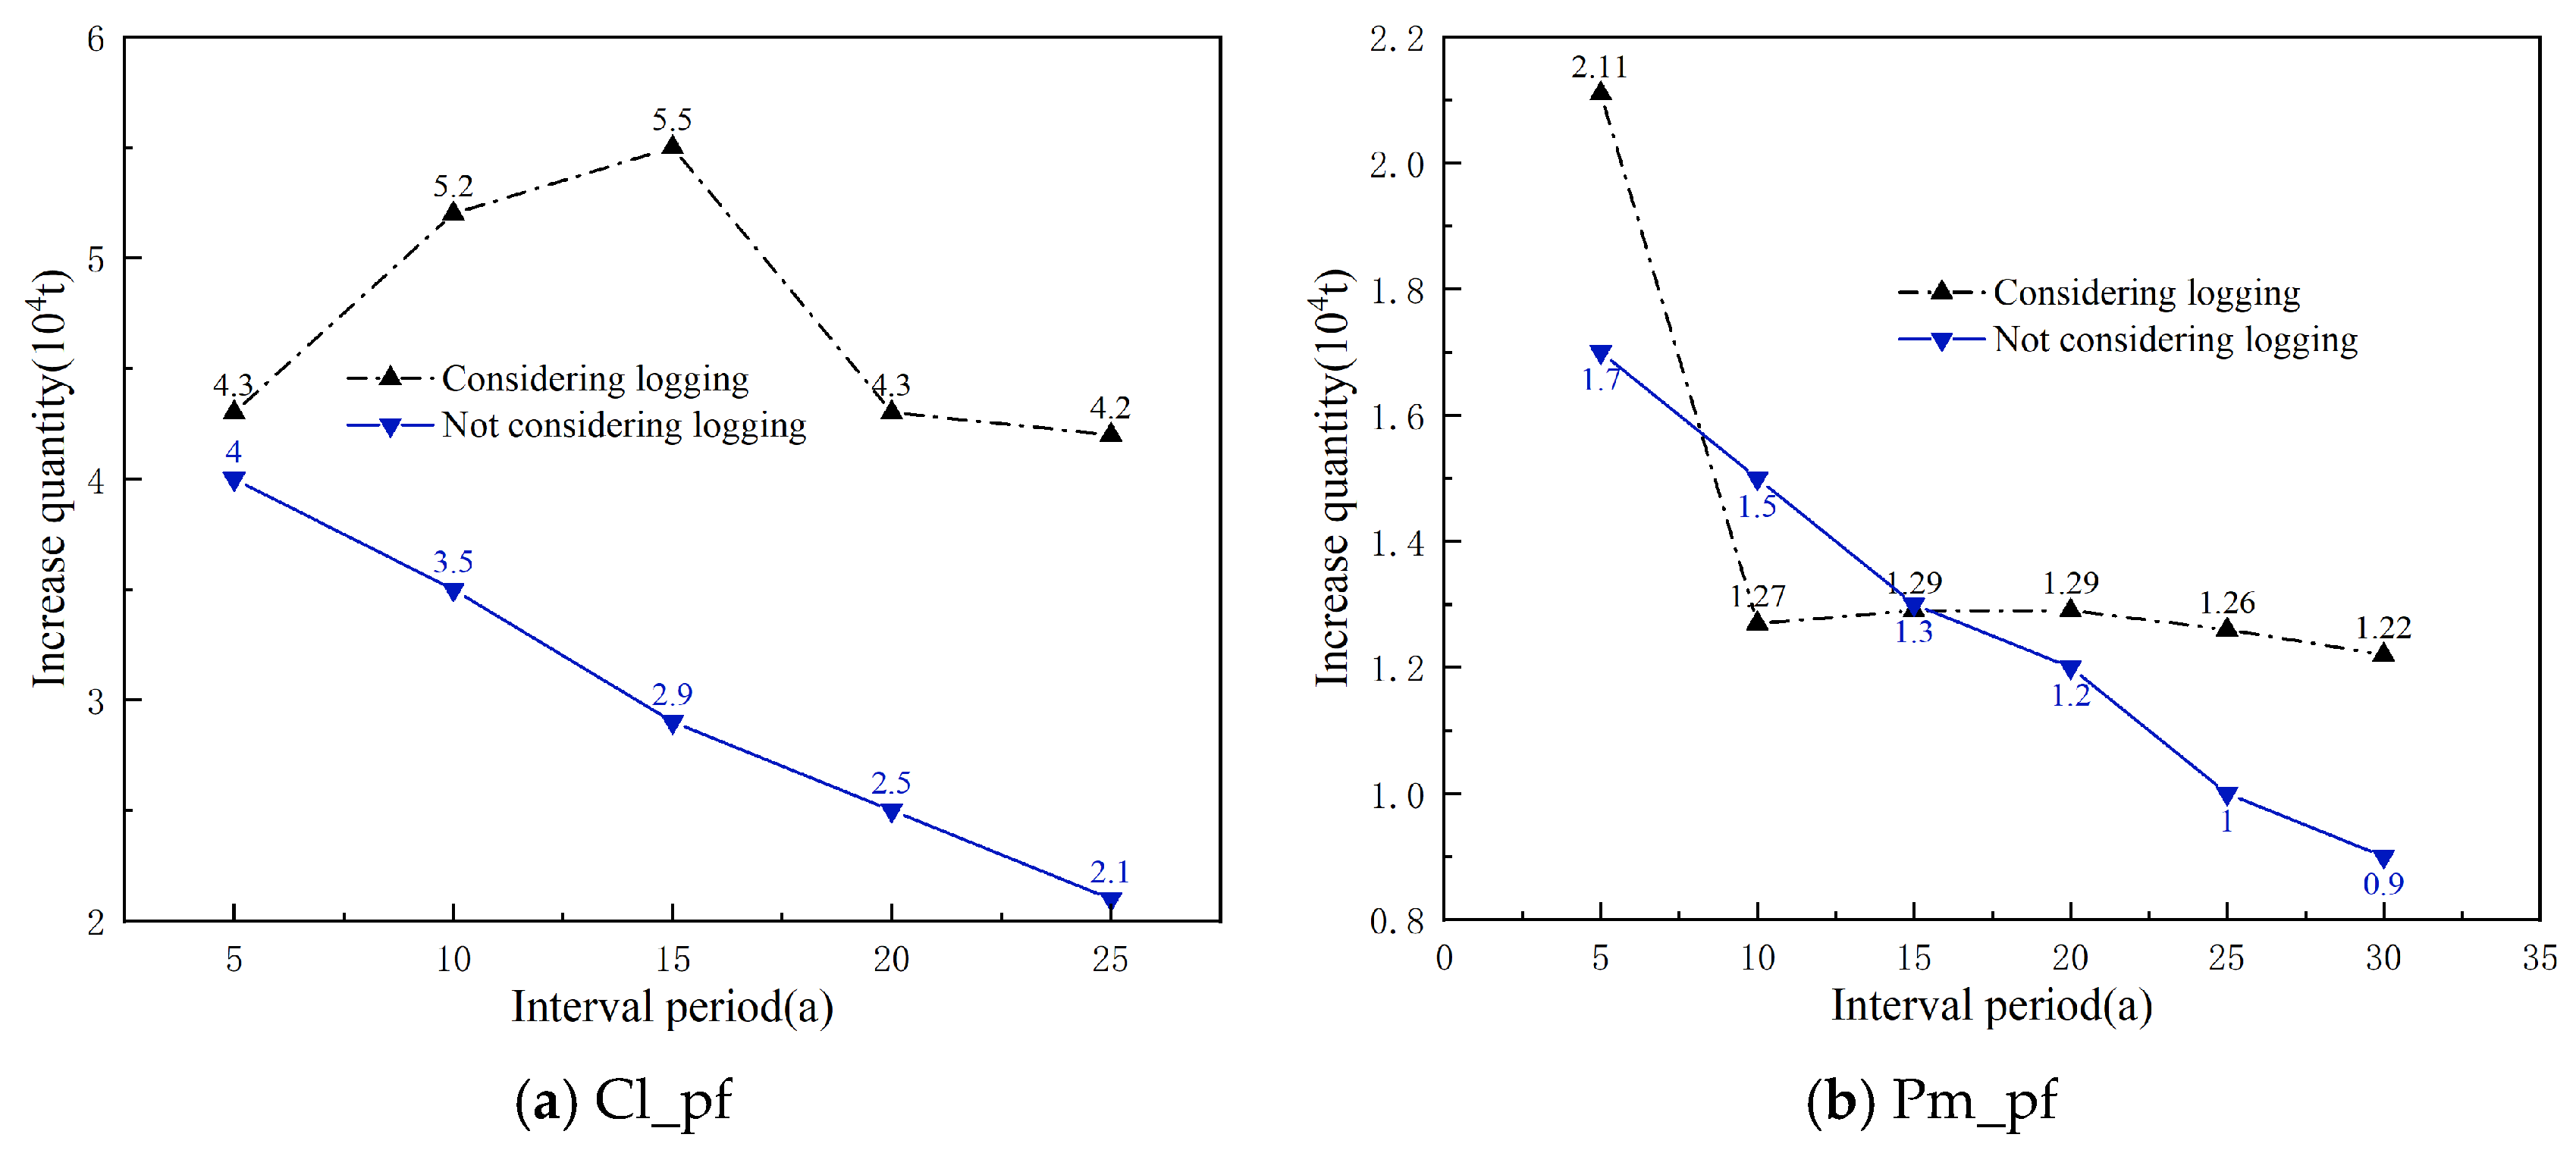
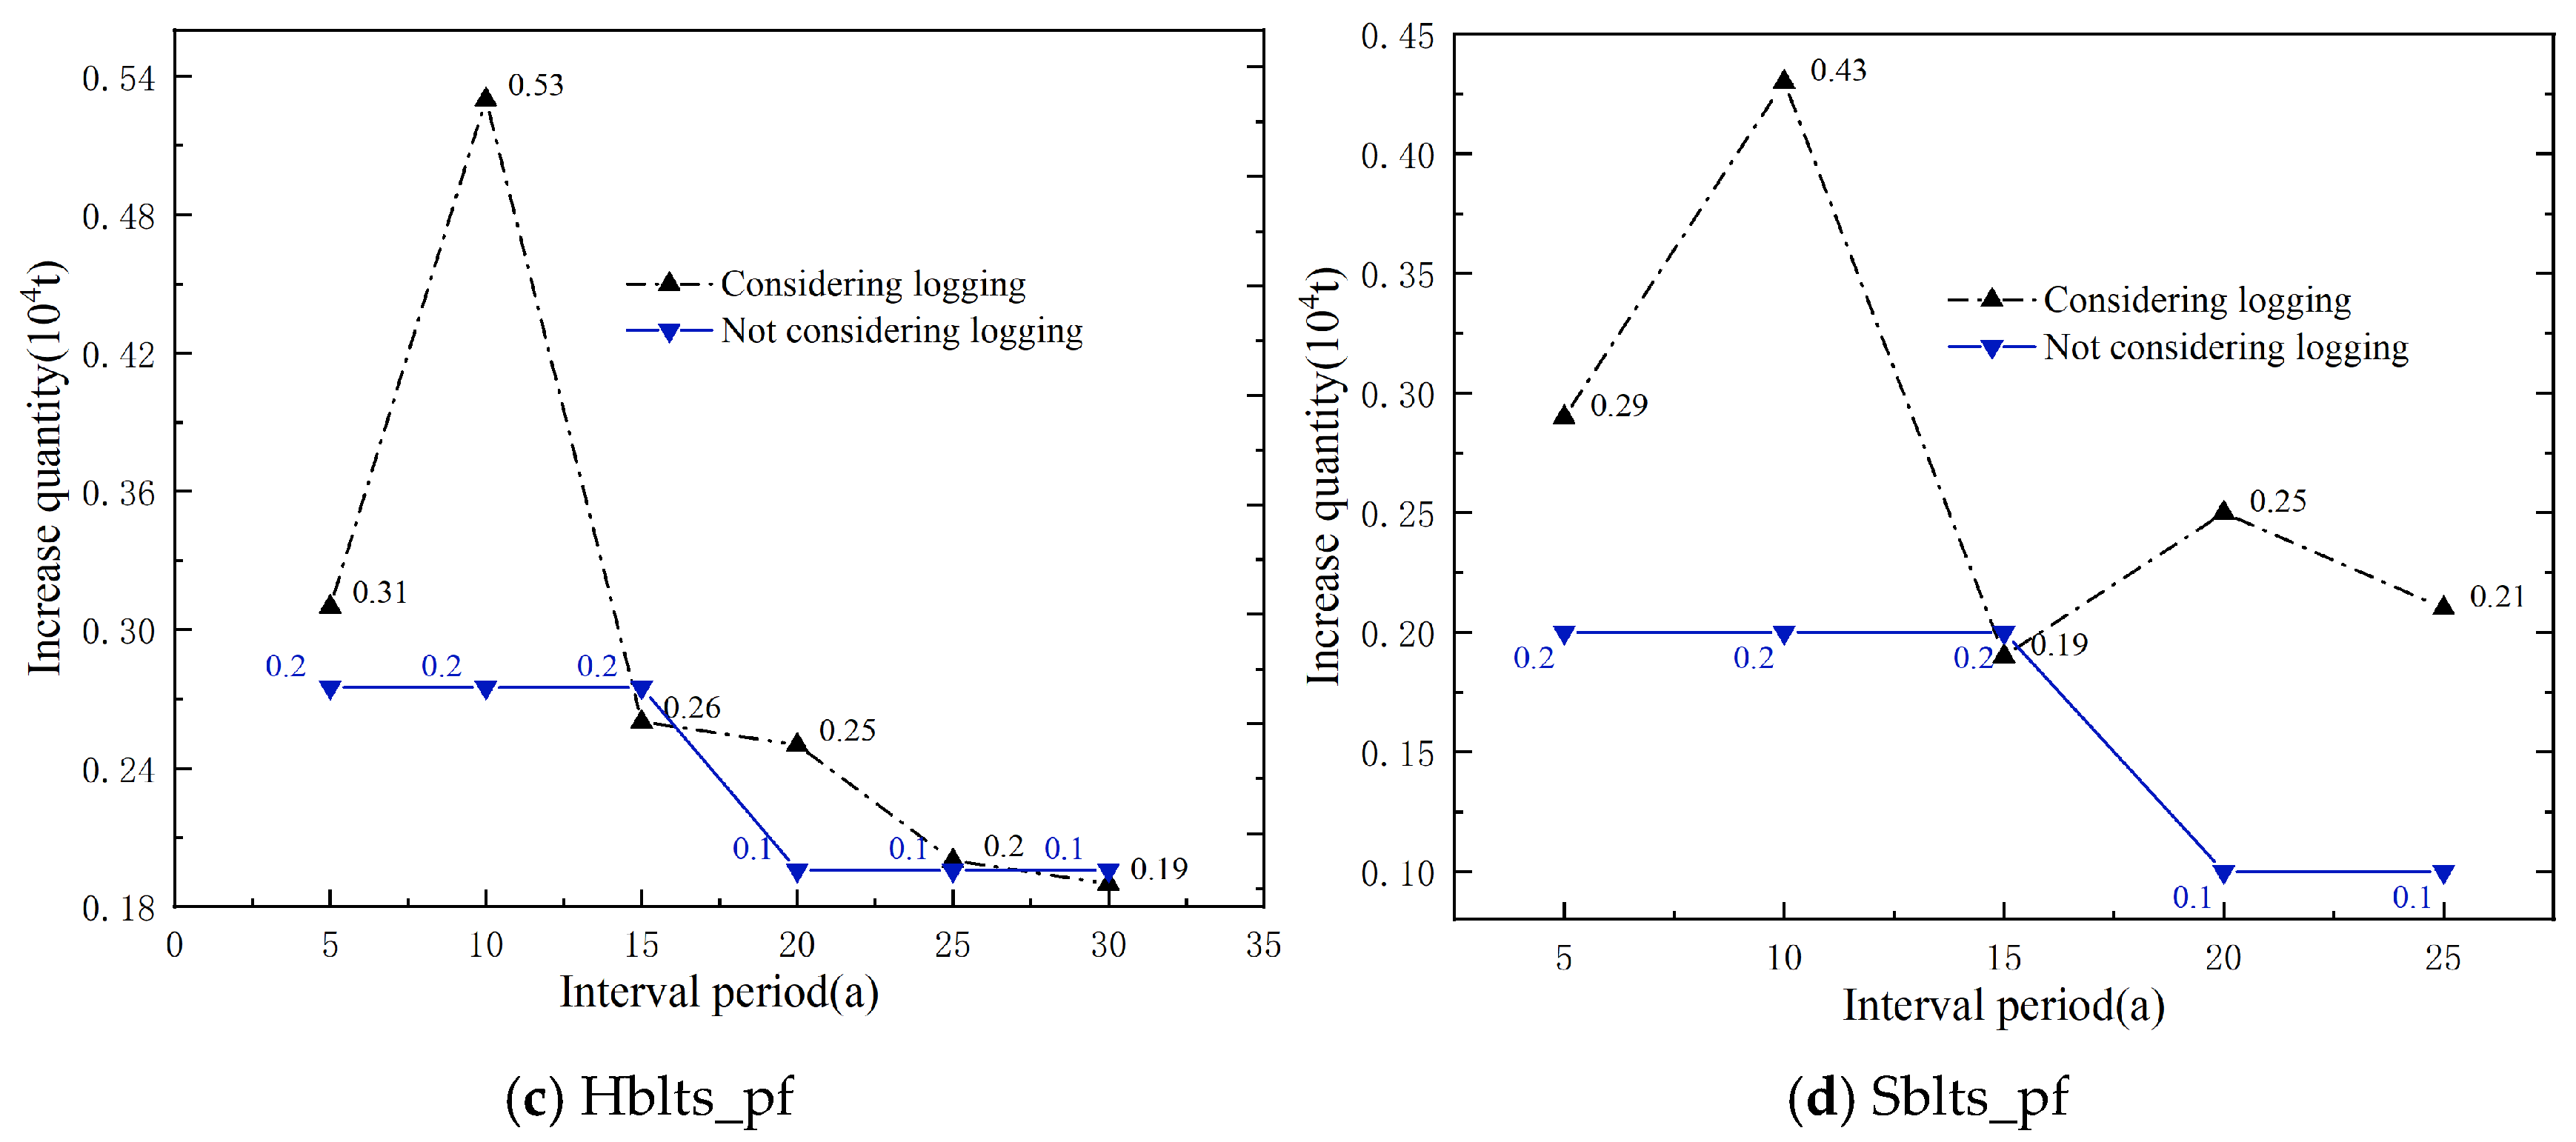
Using the simulation calculation method, the theoretical logging volumes for each dominant tree species (group and origin) over different interval periods were calculated, and the increases were then determined (Figure 6). It is evident that, without considering the logging volume, the increases (carbon sequestration) for each dominant tree species (group, origin) decrease with the lengthening of the interval period, especially apparent in Cl_pf and Pm_pf. When considering the logging volumes, the increases for each dominant tree species (group and origin) fluctuated with the extension of the interval period, and the increases for all four types of plantations at the time of the main felling were higher than those without logging volume, particularly for Cl_pf, Pm_pf, and Sblts_pf.
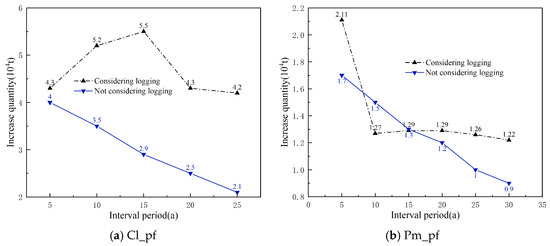
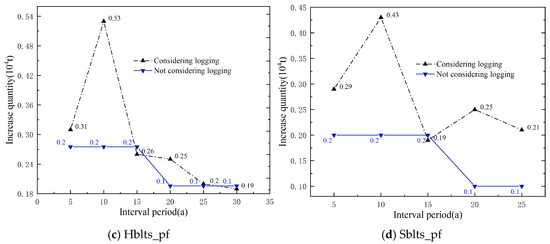
Figure 6.
Increases in carbon storage over interval periods with and without considering logging volume.
5. Discussion
Our study demonstrates that the development of a compatible carbon storage model enables the rapid estimation of carbon storage in various parts of a forest stand, saving substantial human, material, and financial resources [23,24]. Furthermore, it achieves compatibility (additivity) between the individual and total organs, thereby addressing the discrepancy between the organ-specific and total carbon storage found in non-additive carbon storage models. This approach effectively mitigates potential errors in practical applications. Cross-modeling and testing demonstrate that the compatible carbon storage model has good fit accuracy and can provide relatively accurate predictions for carbon storage in various parts of the forest. This makes it the optimal choice for model establishment.
By constructing compatible carbon storage models for the total volume, branches, roots, leaves, and trunks and comparing these with carbon storage calculations using a standard carbon content rate (e.g., 0.50), the former exhibits higher predictive accuracy [25]. Other studies have shown that using a fixed carbon content rate to calculate carbon storage in Cunninghamia lanceolata forests can result in errors of up to 5.4% compared with actual measurements [26]. Errors arise because a fixed carbon content obscures variations in carbon content across different species and organs, leading to significant deviations. Widagdo et al. also found significant differences in carbon content among different origins and the organs of larch trees. Therefore, carbon storage models developed separately for different origins, parts, and tree species (groups) to accurately estimate the forest carbon storage.
Conventional modeling processes that typically represent a forest with dominant species to construct yield models and estimate carbon and volume do not address expression issues in mixed forests. Forrester et al. (2016) suggested that forest productivity might decline as the number of species increases [27]. In some forest types, increasing the heterogeneity in tree size can reduce forest productivity by 20% [28]. This is because the negative effect of smaller trees on forest growth outweighs that of larger trees. Estimating forest carbon storage and productivity based on dominant species without distinguishing the species composition can lead to overestimation. Research has also shown that mature, even aged, and mixed coniferous forests do not necessarily have higher productivity than pure stands [29]. Thus, incorporating tree species composition coefficients into the model not only addresses species expression issues in mixed forests but also enhances the accuracy of productivity estimates through ecological complementarity.
Carbon storage in forest stands is influenced by both biotic and abiotic factors [6], and the allocation of carbon storage among different parts is affected by external environmental conditions, species differences, and forest age. In this study, carbon storage in various parts was ranked as trunks > roots > branches > leaves, with trunks accounting for over 33% and leaves accounting for only 16%, similar to the findings of Ma (2023), He et al. (2023), and Guo et al. (2023) [30,31,32]. This distribution occurs because more carbon is allocated to trunks as trees grow, stabilizing the trees and transporting more water and nutrients to the parts required for photosynthesis [33]. This further demonstrated that the carbon storage estimation model developed in this study was consistent with the distribution of carbon storage across different parts of the stand. Combined with the volume estimation model developed in this study, it provides an accurate and quick prediction method for estimating total forest carbon storage.
6. Conclusions
By incorporating tree species composition coefficients into the model, we developed a carbon storage estimation model using stand volume as the independent variable, and a stand volume prediction model that utilized tree species composition coefficients, site quality grades as dummy variables, and interval periods as independent variables. This approach addresses issues such as the complex expression of tree species and the uncertain determination of age, providing technical support for accurate productivity estimates in mixed forests.
Through synchronized cross-modeling and testing, the compatible carbon storage estimation models for the eight dominant tree species (group and origin) achieved an R value greater than 0.9620, RSD values ranging from 4.80 to 215.39, RS and MSE values within ±0.6%, RMA values below 5%, and EA values above 99.50%. The stand volume prediction models for these species (group and origin) showed an R value greater than 0.9840, RSD values between 0.29 and 0.57, RS and MSE values within ±1%, RMA values below 6%, and EA values above 99.40%. These results also reflect the effectiveness of the parameter estimation approach, where the IEA and improved simplex method contributed to stable convergence and an enhanced model fitting performance compared with traditional optimization routines. These models can be used to predict the total stand carbon storage and volume across Fujian Province.
Using Wuyishan City as a case study, stand carbon storage and volume estimation models were applied to calculate current and future carbon storage and volume over different interval periods. The results showed that the current volume in the area was 21.0521 million cubic meter, and the carbon storage was 7.3238 million tons. However, as the interval period increased, the added amount decreased. After introducing the simulation calculation method and considering the logging volume, the increase in carbon storage for the four plantation types was significantly higher than in stands where logging was not considered, effectively resolving the resistivity issues encountered during the model estimation.
Author Contributions
Conceptualization, X.J., W.H. and B.L.; methodology, B.L. and W.H.; software, W.H. and T.Q.; validation, X.J., B.L. and J.P.; formal analysis, X.J., W.H. and B.L.; investigation, B.L., W.H., T.Q. and J.P.; resources, W.H., T.Q. and J.P.; data curation, J.P.; writing—original draft preparation, W.H.; writing—review and editing, B.L., W.H. and T.Q.; visualization, X.J., W.H. and B.L.; supervision, X.J., W.H. and B.L.; project administration, W.H. and B.L.; and funding acquisition, W.H. All authors have read and agreed to the published version of the manuscript.
Funding
This research was funded by the Fujian Philosophy and Social Sciences Planning Project (FJ2022X019), Fujian Provincial Department of Finance Project (CR-2304), Fujian Forestry Science and Technology Project (2023FKJ21), Nanping City Resource Chemistry Industry Technology Innovation Joint Project (N2021Z010), and Wuyi University Talent Introduction and Research Start-up Fund Project (YJ202435).
Data Availability Statement
Data are contained within the article.
Acknowledgments
The authors express their gratitude and appreciation to Fujian Provincial Forestry Survey and Planning Institute for the finance, facilities, and opportunity to conduct this research.
Conflicts of Interest
The authors declare that they have no competing interests.
References
- Wang, X.K.; Feng, Z.W. Potential of plant carbon sequestration in China’s forest ecosystems. J. Ecol. 2000, 19, 72–74. [Google Scholar]
- Lü, Z.Q.; Duan, A.G. Biomass and carbon storage models of Cunninghamia lanceolata in different production areas. J. For. Sci. 2024, 60, 1–11. [Google Scholar]
- Yang, J.H.; Zhang, H.D.; Li, Y.C.; Liu, S.M. Construction of carbon storage models for Pinus yunnanensis and Pinus armandii based on additive models. J. Kunming Univ. Sci. Technol. (Nat. Sci. Ed.) 2024, 49, 140–150. [Google Scholar]
- Sileshi, G.W. A critical review of forest biomass estimation models, common mistakes and corrective measures. For. Ecol. Manag. 2014, 329, 237–254. [Google Scholar] [CrossRef]
- Luo, Y.J.; Wang, X.K.; Ouyang, Z.Y.; Lu, F.; Tao, J. A review of biomass equations for China’s tree species. Earth Syst. Sci. Data 2020, 12, 21–40. [Google Scholar] [CrossRef]
- Guo, Q.; Zhao, H.B.; Zhou, G.Y.; Long, W.G.; Gan, G.L.; Wu, S.Y.; Meng, M.Y.; Chen, J.L. Biomass and distribution patterns of four tree species plantations in the south subtropics. For. Res. 2022, 35, 182–189. [Google Scholar]
- Khan, N.I.; Shil, M.C.; Azad, M.S.; Sadath, M.N.; Feroz, S.M.; Mollick, A.S. Allometric relationships of stem volume and stand level carbon stocks at varying stand density in Swietenia macrophylla King plantations, Bangladesh. For. Ecol. Manag. 2018, 430, 639–648. [Google Scholar] [CrossRef]
- Jagodziński, A.M.; Dyderski, M.K.; Gęsikiewicz, K.; Horodecki, P. Tree and stand level estimations of Abies alba Mill. aboveground biomass. Ann. For. Sci. 2019, 76, 56. [Google Scholar] [CrossRef]
- Aguirre, A.; del Río, M.; Ruiz-Peinado, R.; Condés, S. Stand-level biomass models for predicting C stock for the main Spanish pine species. For. Ecosyst. 2021, 8, 29. [Google Scholar] [CrossRef]
- Lin, W.; Bai, Q.S.; Chen, X.M.; Liang, D.C.; Chen, Y.; Xue, K.; He, B.X.; Wen, S.N.; Lian, H.M.; Tang, C.L. Construction of carbon sink capacity evaluation system and selection of superior carbon sink tree species for major afforestation species in South China. J. Southwest For. Univ. (Nat. Sci.) 2020, 40, 28–37. [Google Scholar]
- Zeng, W.S.; Sun, X.N.; Wang, L.R.; Wang, W.; Pu, Y. Development of volume, biomass, and carbon storage models for 10 major forest types in the northeast forest region. J. Beijing For. Univ. 2021, 43, 1–8. [Google Scholar]
- Yue, C.Y. Estimation of Forest Carbon Storage and Carbon Sequestration Potential in Shaanxi Province. Master’s Thesis, Northwest A&F University, Xianyang, China, 2023. [Google Scholar]
- Wang, Z.; Lu, L.L.; Zhang, X.Q.; Zhang, J.G.; Jiang, L.; Duan, A.G. Construction of a Stand Volume Growth Model for Cunninghamia lanceolata Based on Bayesian Model Averaging. For. Res. 2021, 34, 64–71. [Google Scholar]
- Wu, H.W.; Zhang, W.Z.; Tian, Y.; Yan, M.H.; Zhuang, C.Y.; Jiang, X.D. Stand basal area growth model for Pinus elliottii based on dummy variables. J. Cent. South Univ. For. Technol. 2021, 41, 117–123+150. [Google Scholar]
- Wan, M.; Sun, Y.J.; Sun, Z.; Pang, R.R. Application of the 3-PG model to predict biomass and stand volume of Cunninghamia lanceolata plantations. J. Northeast For. Univ. 2023, 51, 74–79+94. [Google Scholar]
- Hua, W.P.; Wu, J.W.; Yu, L.Y.; Wang, Y.N.; Wu, C.Z.; Zhuang, C.Y.; Chi, S.P.; Jiang, X.D. Classification and application of forest land based on forest potential productivity evaluation model. For. Resour. Manag. 2023, 51, 29–37. [Google Scholar] [CrossRef]
- Li, X.J. Analysis of Wood Structure and Growth Yield Estimation Model of Natural Broadleaf Forests in Northern Fujian. Ph.D Thesis, Fujian Agriculture and Forestry University, Fuzhou, China, 2013. [Google Scholar]
- Mirjalili, S.; Lewis, A. The whale optimization algorithm. Adv. Eng. Softw. 2016, 95, 51–67. [Google Scholar] [CrossRef]
- Abdelaziz, M.; Eweesc, A.A.; Hassanien, A.E. Whale optimization algorithm and moth-flame optimization for multilevel thresholding image segmentation. Expert Syst. Appl. 2017, 83, 242–256. [Google Scholar]
- Hua, W.P.; Qiu, T.; Gai, X.M.; Huang, Y.Z.; Xu, M.Z.; Jiang, X.D. Modeling techniques for the binary volume model of Pinus hwangshanensis based on cross-modeling validation. J. Wuyi Univ. 2015, 34, 13–17. [Google Scholar]
- Gao, X.L. Application of the simulation calculation method in determining the reasonable annual logging volume during the eleventh five-year plan period. For. Resour. Manag. 2006, 1, 38–42. [Google Scholar]
- Hua, W.P.; Jiang, X.D.; Qiu, T.; Li, P.; Jiang, H.; Huang, S.Y. Determining logging volume using the simulation calculation method and its impact on value. J. Northwest AF Univ. (Nat. Sci. Ed.) 2016, 44, 79–84+92. [Google Scholar]
- Sierra, C.A.; del Valle, J.I.; Orrego, S.A. Total carbon stocks in a tropical forest landscape of the Porce region, Colombia. For. Ecol. Manag. 2007, 243, 299–309. [Google Scholar] [CrossRef]
- Bi, H.; Murphy, S.; Volkova, L. Additive biomass equations based on complete weighing of sample trees for open eucalypt forest species in south-eastern Australia. For. Ecol. Manag. 2015, 349, 106–121. [Google Scholar] [CrossRef]
- Dong, L.H.; Liu, Y.S.; Song, B.; Zhou, Y.F.; Li, F.R. Comparison of methods for estimating carbon content in standing trees. J. For. Sci. 2020, 56, 46–54. [Google Scholar]
- Zeng, W.S.; Chen, X.Y.; Pu, Y.; Yang, X.Y. Comparative analysis of different methods for estimating biomass and carbon storage based on national forest inventory data. For. Res. 2018, 31, 66–71. [Google Scholar]
- Forrester, D.I.; Bauhus, J. A review of processesbehind diversity-productivity relationships in forests. Curr. For. Rep. 2016, 2, 45–61. [Google Scholar] [CrossRef]
- Soares, A.A.V.; Leite, H.G.; Souza, A.L.; Silva Sérgio, R.; Lourenço, H.M.; Forrester, D.I. Increasing stand structuralheterogeneity reduces productivity in Brazilian Eucalyptus monoclonal stands. For. Ecol. Manag. 2016, 373, 26–32. [Google Scholar] [CrossRef]
- Chen, H.Y.; Klinka, K.; Mathey, A.H.; Wang, X.; Varga, P.; Chourmouzis, C. Are mixed-species stands more productive thansingle-species stands: An empirical test of threeforest types in British Columbia and Alberta. Can. J. For. Res. 2003, 33, 1227–1237. [Google Scholar] [CrossRef]
- Ma, Y. Characteristics and Distribution of Biomass and Plant Carbon Storage in Cunninghamia lanceolata Plantations in Hubei Province. Master’s Thesis, Central South University of Forestry and Technology, Changsha, China, 2023. [Google Scholar]
- He, L.; Yan, J.X.; Duan, L.L.; Liu, J.; Wang, Y. Allometric growth models of biomass for major forest types in the Shanxi plateau. Sci. Soil Water Conserv. (Chin. Engl.) 2023, 21, 102–111. [Google Scholar]
- Guo, Z.X.; Hu, Z.Y.; Cao, C.; Liu, P. Development of biomass and carbon storage models for major forest types in guangdong. J. For. Sci. 2023, 59, 37–50. [Google Scholar]
- Altanzagas, B.; Luoy Altansukh, B.; Dorjsuren, C.; Fang, J.; Hu, H. Alometric equations for estimating the above-ground biomass of five forest tree species in Khangai, Mongolia. Forests 2019, 10, 661. [Google Scholar] [CrossRef]
Disclaimer/Publisher’s Note: The statements, opinions and data contained in all publications are solely those of the individual author(s) and contributor(s) and not of MDPI and/or the editor(s). MDPI and/or the editor(s) disclaim responsibility for any injury to people or property resulting from any ideas, methods, instructions or products referred to in the content. |
© 2025 by the authors. Licensee MDPI, Basel, Switzerland. This article is an open access article distributed under the terms and conditions of the Creative Commons Attribution (CC BY) license (https://creativecommons.org/licenses/by/4.0/).