Article

Integrated Metabolome and Transcriptome Analysis Reveals New Insights into the Walnut Seed Coat Coloration

by
Ruiqi Wang
1,
Xin Huang
1,
Xueqin Wan
1,
Shuaiying Zhang
1,
Xiandan Luo
1,
Jianghong Qian
1,
Fang He
1,
Lianghua Chen
1,
Fan Zhang
2 and
Hanbo Yang
1,*
1
Forestry Ecological Engineering in the Upper Reaches of the Yangtze River Key Laboratory of Sichuan Province, National Forestry and Grassland Administration Key Laboratory of Forest Resource Conservation and Ecological Safety on the Upper Reaches of the Yangtze River, College of Forestry, Sichuan Agricultural University, Chengdu 611130, China
2
College of Landscape Architecture, Sichuan Agricultural University, Chengdu 611130, China
*
Author to whom correspondence should be addressed.
Forests 2025, 16(4), 691; https://doi.org/10.3390/f16040691
Submission received: 2 March 2025 / Revised: 11 April 2025 / Accepted: 12 April 2025 / Published: 16 April 2025
(This article belongs to the Special Issue Genetic Diversity and Gene Analysis in Forest Tree Breeding)

Abstract

:
The color of the walnut seed coat is a critical determinant of its market value; however, research into the mechanisms responsible for seed coat color formation is yet to be determined. Using two walnut clones with contrasting pale-yellow and light purple seed coats, we characterized pigmentation, particularly anthocyanin content, using spectrophotometry. We then conducted integrated transcriptomic and metabolomic analyses to identify the molecular mechanisms and pathways underlying their formation. The anthocyanin content in the light purple seed coat clone was significantly greater than that in the clone with a white seed coat. The results of comparative metabolomics indicated that four anthocyanins (delphinidin, cyanidin-3-(caffeoylglucoside), pelargonidin-3-(6″-caffeoylglucoside), and delphinidin-3-O-sophoroside) were significantly more abundant in the light purple seed coat clone. These anthocyanins were the key pigments responsible for the light purple coloration of the walnut seed coat. Furthermore, comparative transcriptomics revealed that structural genes in the anthocyanin biosynthesis pathway (e.g., phenylalanine ammonia-lyase, 4-coumarate-CoA ligase, chalcone isomerase, and bronze-1) were significantly upregulated in the purple seed coat clone. Coexpression network analysis revealed that several transcription factors (e.g., ARF, bHLH, and MYB-related) were significantly correlated with the upregulation of these structural genes and the accumulation of four key anthocyanins. These transcription factors may serve as critical regulators influencing seed coat color formation. In conclusion, these findings establish a strong theoretical foundation for walnut breeding aimed at developing diverse seed coat colors.

1. Introduction

Walnuts (Juglans spp.) are economically important trees with oil and economic benefits; they are widely distributed across regions in the United States, Europe, and Asia and are considered one of the “four major nuts” along with almonds, cashews, and hazelnuts [1]. By 2011, the walnut cultivation region in the United States had expanded to 107,600 hectares, yielding an annual output of 525,300 tons [2]. Walnuts are considered to have notable economic advantages. The grade of the walnut seed coat is primarily determined by color, which is a key sensory attribute for consumers [3,4]. Walnuts with different seed coat colors may achieve higher market premiums compared with traditional varieties [5]. Anthocyanins play a crucial role in pigment deposition, and their accumulation in vacuoles is responsible for the pink to purple coloration observed in various organs, such as leaves, flowers, and fruits [5,6]. In addition to anthocyanins, other pigments, such as flavonoids, also contribute to the color of walnut seed skins; however, this study focused exclusively on anthocyanins. Previous studies have shown that the accumulation of pelargonidin-3-O-β-galactoside, cyanidin-3-O-β-galactoside, and petunidin-3-O-arabinoside results in the red coloration of cashew apple skins [7]. Similarly, cyanidin-3-O-rhamnoside and peonidin-3-O-rhamnoside cause the purple-black coloration of Osmanthus fruit skins [8].
The biosynthetic pathway of anthocyanins in plants has been well elucidated. First, phenylalanine is converted to 4-coumaroyl-CoA via phenylalanine ammonia-lyase (PAL), cinnamate-4-hydroxylase (C4H), and 4-coumarate-CoA ligase (4CL). In the second stage, 4-coumaroyl-CoA is converted to dihydroflavonol via chalcone synthase (CHS), chalcone isomerase (CHI), and flavanone-3-hydroxylase (F3H). Finally, dihydroflavonol is converted into pelargonidin, cyanidin, and delphinidin via the catalysis of flavonoid-3′-hydroxylase (F3′H), flavonoid-3′,5′-hydroxylase (F3′5′H), dihydroflavonol-4-reductase (DFR), and anthocyanidin synthase (ANS) [9,10,11] (Figure S1). Regulatory mechanisms differ across plant species; however, the mechanisms underlying walnut seed coat color formation remain unclear. With the advancement of sequencing technologies, integrated analysis methods based on metabolomics and transcriptomics have been widely used to study plant development [12]. The combined use of metabolomics and transcriptomics has also been widely applied to analyze anthocyanin biosynthesis pathways in plants [13,14]. Wang Xin et al. (2022) revealed the regulatory mechanism of color accumulation in peanut seed coats through metabolomics and transcriptomics [15]. Ma et al. (2023) elucidated the molecular mechanisms underlying anthocyanin accumulation in the seed coats of Vigna radiata, which results in their coloration, based on a joint analysis of transcriptomics and metabolomics data [13]. By integrating metabolomics and transcriptomics, the genetic regulatory mechanisms underlying pigment compound formation in walnut seed coats can be elucidated providing insights into the mechanisms of walnut seed coat color formation. In this study, we analyzed the seed coats of two walnut clones, one with a pallid yellow seed coat, and the other with a light purple seed coat, at different developmental stages, to elucidate the molecular regulatory networks involved in seed coat coloration. This work offers novel perspectives into seed coat color development in walnuts, potentially guiding future walnut breeding efforts focused on nut enhancement.

2. Materials and Methods

2.1. Plant Materials

The nut samples of ‘JS71’ (Juglans sigillata) and ‘Chuanzao2’ ((J. regia × J. sigillata) × (J. regia ‘Shahe’)) were collected from the Chongzhou Modern Agriculture Research and Development base of Sichuan Agricultural University. Compared with the pallid yellow seed coats of ‘Chuanzao2’, the seed coats of ‘JS71’ presented a distinct light purple color. Both ‘JS71’ and ‘Chuanzao2’ were grown under the same environmental conditions. The nuts from ‘JS71’ and ‘Chuanzao2’ were collected at two different stages of maturity, in July and September, and labeled JS0721, JS0931, CZ0721, and CZ0931, respectively. Three biological replicates were collected for each time period, each sourced from a different clone. The collected samples were frozen in liquid nitrogen and stored at −80 °C for subsequent analysis.

2.2. Sample Preparation

The 5 g tissue sample was accurately weighed and placed into a 2 mL centrifuge tube. Next, 1000 μL of 60% methanol solution (containing 0.1 mol/L hydrochloric acid and 0.1% disodium ethylenediaminetetraacetate) was added, and the mixture was vortexed for 60 s. Two steel beads were added, and the mixture was ground in a tissue grinder at 50 Hz for 120 s. The sample was then subjected to ultrasonic treatment at 60% power and 40 °C for 10 min. After centrifugation at 12,000 rpm and 4 °C for 10 min, the supernatant was filtered through a 0.22 μm membrane, and the filtrate was transferred to a detection vial for LC-MS analysis.

2.3. Determination of Total Anthocyanin Content by Spectrophotometry

A 0.5 g tissue sample was added to 10 mL of 1.5 mol/L HCl in methanol (3:1, v/v) and stored in the dark at 4 °C for 24 h. The extract was then centrifuged at 4000 rpm for 20 min. The supernatant was removed, and the absorbance at 530, 620, and 657 nm was measured using a spectrophotometer. Afterward, the anthocyanin content was calculated. The formula for calculating the ODλ was as follows: ODλ= (A530 − A620) − 0.1 × (A650 − A620) (ODλ represents the corrected optical density reflecting anthocyanin absorbance, with background interference subtracted.). The anthocyanin content was calculated using the following formula: ODλλ × V/m × 106 (nmol/g fresh weight; V: volume; m: weight; ξλ: 4.62 × 10⁴) [16].

2.4. Anthocyanin Targeted Metabolomics Analysis

The raw mass spectrometry data were converted to mzML format using the MSConvert tool from Proteowizard software (v3.0.8789) [17]. Peak detection, filtering, and alignment were performed with the R XCMS package (Navarro-Reig M, et al. 2015) [18], generating a list of compound peak areas. The parameters were set as follows: bw = 2, ppm = 15, peakwidth = c(10,40), mzwid = 0.015, mzdiff = 0.01, method = “centWave”. Compound identification was performed via public databases (KNApSAcK, HMDB, LipidMaps, PubChem, and KEGG) and a self-constructed library with a tolerance of < 30 ppm. The QC-SVRC normalization method was applied to correct the data and remove systematic errors. Compounds with an RSD > 30% in the QC samples were excluded [19]. Principal component analysis (PCA), partial least squares discriminant analysis (PLS-DA), and orthogonal partial least squares discriminant analysis (OPLS-DA) were performed using the R package Ropls [20]. Score plots, loading plots, and S-plots were generated to show anthocyanin composition differences. A permutation test was used to check for model overfitting. Values closer to 1 indicate a better model fit and a more accurate classification of training samples. The p value, VIP (calculated by OPLS-DA), and fold change were used to assess the significance and differences between groups. The anthocyanins were deemed statistically significant when the p value was less than 0.05 and the VIP score exceeded 1.

2.5. Transcriptomic Analysis

RNA was extracted from the samples according to the method described by Dossa Komivi et al. [21,22]. cDNA libraries were constructed and sequenced following the standard procedure of the Illumina HiSeq™2500 platform. DESeq2 (Version 1.10.1) software (San Diego, CA, USA) was used to determine gene/transcript expression at the gene level according to the FPKM method based on the raw count data. The differentially expressed genes (DEGs) were defined according to an |FC| ≥ 2 and FDR ≤ 0.05 and subjected to KEGG and GO enrichment analyses. The hub genes were analyzed based on time series samples to construct a DEG regulatory network. A standard method based on WGCNA was used to detect specific coexpressed gene modules related to the key anthocyanins (delphinidin, cyanidin-3-(caffeoylglucoside), pelargonidin-3-(6″-caffeoylglucoside), and delphinidin-3-O-sophoroside). The associations among the differentially expressed transcription factors, structural genes in the modules, and key anthocyanins were subsequently analyzed via Pearson correlation analysis. The Pearson correlation coefficient (PCC) was calculated, and screening was conducted according to the criterion of a |PCC| ≥ 0.8 (p < 0.05). The interaction networks among transcription factors, structural genes, and anthocyanins were mapped by Cytoscape version 3.10.0 [23].

2.6. RT-qPCR Analysis

To conduct RT-qPCR analysis, 15 differentially expressed genes (DEGs) were selected as targets. GAPDH was used as the internal control gene for normalization. Primers for RT-qPCR were designed using Primer Premier 5 software based on the gene sequence information (Table S1). The RNA was reverse transcribed and subjected to quantitative PCR using a 2 × SYBR Green qPCR Mix (Takara, Code No. RR820A), and quantitative analysis was performed using a GFX96 qPCR system. The reaction conditions were as follows: 95 °C for 300 s, 95 °C for 20 s, 55 °C for 20 s, and 72 °C for 20 s, with 40 cycles of amplification. After the final amplification cycle, the temperature was decreased to 60 °C, followed by a heat ramp to 95 °C for DNA denaturation. Relative expression levels were determined using the 2−ΔΔCT method. Three biological replicates were established, and each experiment included three technical replicates.

3. Results

3.1. Morphology and Anthocyanin Content of the Seed Color Development

Juglans sigillata × J. regia ‘Chuanzao 1’ (CZ) is a widely cultivated walnut clone in Sichuan Province, China, characterized by its pallid yellow seed coat (Figure 1A). J. sigillata ‘71’ (JS) is a clone that is distinguished by its light purple seed coat. We measured the anthocyanin content difference in the seed coat of two clones at different developmental stages and analyzed it with ANOVA. The anthocyanin content in the seed coat of ‘JS’ at full maturity (JS0931) was significantly greater than that in the seed coat of ‘CZ’ during both its growth (CZ0721) and maturity periods (CZ0931), as well as during the growth period of ‘71’ (JS0721) (Figure 1B). These results indicate that anthocyanins are key pigments contributing to seed coat color in walnut kernels.

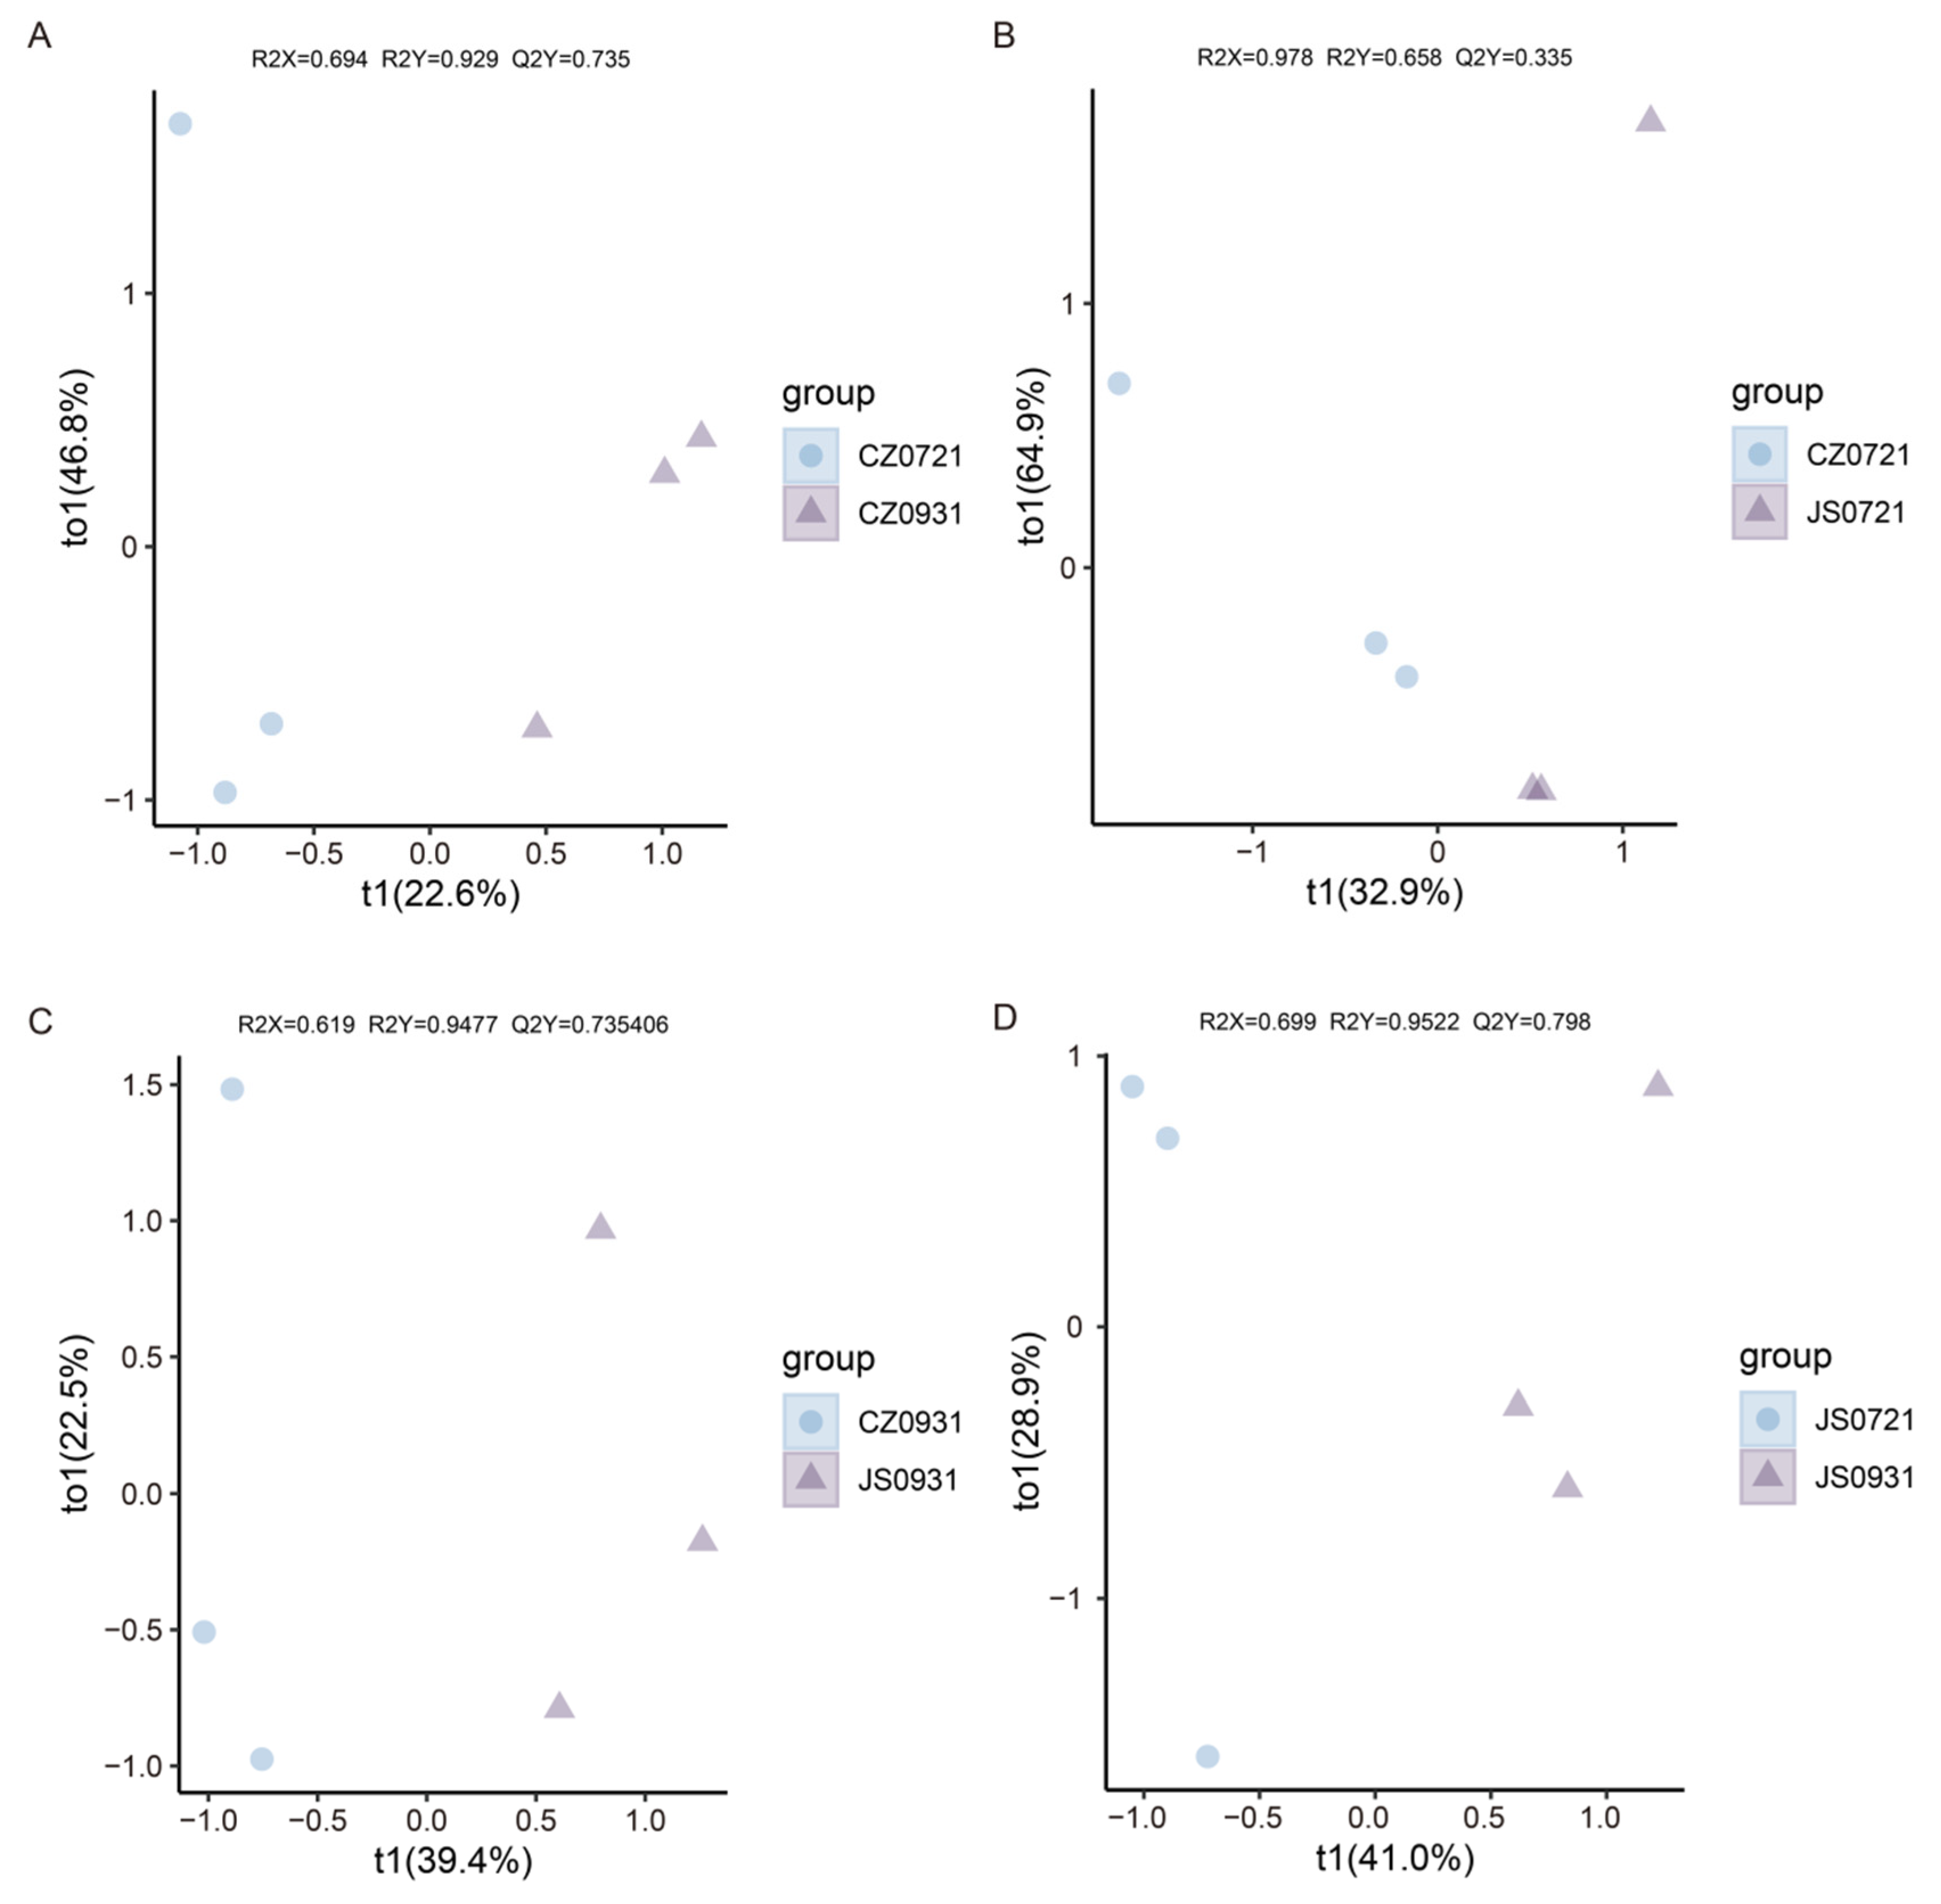
3.2. Comparison of Metabolites Among Clones at Different Developmental Stages

We performed a targeted metabolomic analysis of the anthocyanins in the samples and identified 69 anthocyanins, which were classified into six categories: cyanidin, delphinidin, malvidin, pelargonidin, petunidin, and peonidin (Table S2 and Table S3, Figure S2). The PCA results revealed that PC1 and PC2 contributed 25.5% and 18.6%, respectively, to the total variance, and significant differences were observed among the groups (Figure S3). The results of the permutation test revealed that the R2X and R2Y values for the comparisons of CZ0721 vs. JS0721, CZ0931 vs. JS0931, and JS0721 vs. JS0931 were all greater than 0.6, with Q2 values exceeding 0.3. These findings indicate that the OPLS-DA model has a good fit and high reliability (Figures S4–S6). Differences in the composition and content of anthocyanin metabolites were observed between different clones at various developmental stages. These results corresponded well with the findings from the principal component analysis and multiple comparisons (Figure 2A–D). A total of 16 differentially accumulated anthocyanins (DAAs) with VIP > 1 were selected through OPLS-DA from the comparisons of CZ0721 vs. JS0721, CZ0931 vs. JS0931, and JS0721 vs. JS0931. Among the detected DAAs, 2, 8, and 12 compounds with VIP > 1 were identified from the comparisons of CZ0721 vs. JS0721, CZ0931 vs. JS0931, and JS0721 vs. JS0931, respectively (Figure 3A–C, Tables S4–S6). Additionally, DAAs with a fold change (FC > 2, p < 0.05) were screened by analyzing the relative content of metabolites in each group (Figure 3D, Table S7). There were 8, 13, and 3 DASs that increased in JS0721 (CZ0721 vs. JS0721), JS0931 (JS0721 vs. JS0931), and JS0931 (CZ0931 vs. JS0931), respectively. Ultimately, the DAAs identified through OPLS-DA and fold changes were combined to pinpoint the key anthocyanin responsible for light purple seed coat color formation (Figure 3E). The integrated analysis of these anthocyanins revealed four anthocyanins, delphinidine, cyanidin 3-(caffeoylglucoside), pelargonidin 3-(6″-caffeylglucoside), and delphinidin 3-O-sophoroside, which are the key pigments contributing to the light purple coloration of the JS seed coat.

3.3. Transcriptome Sequencing and Differential Gene Expression Analysis

Transcriptome analysis of the 12 samples yielded a total of 85.66 Gb of clean data (6.23 Gb per sample). The percentage of Q30 bases was above 93.3%, and the GC content ranged from 45% to 47% for each sample. The clean reads from each sample were aligned to the reference genome, with alignment rates ranging from 94.95% to 95.99% (Table S8). A total of 32,599 expressed genes were identified, including 29,878 known genes and 2721 novel genes. Additionally, 72,947 expressed transcripts were detected, comprising 45,504 known transcripts and 27,443 novel transcripts (Table S9). The PCA plot and heatmap revealed a significant correlation in gene expression between replicates within samples, and a marked difference between groups, which indicated that the experimental data were reliable and suitable for further analysis (Figure S7 and Figure S8). A total of 24,636 genes (82.46%), 29,399 genes (98.4%), and 12,476 genes (41.76%) were successfully annotated in the Gene Ontology (GO), nonredundant (NR), and Kyoto Encyclopedia of Genes and Genomes (KEGG) databases, respectively (Table S10).
A total of 1462 (606 upregulated and 856 downregulated), 4981 (3070 upregulated and 1911 downregulated), and 3822 (1772 upregulated and 2050 downregulated) differentially expressed genes (DEGs) were identified in the comparison groups JS0931 vs. CZ0931, JS0931 vs. JS0721, and JS0721 vs. CZ0721, respectively (Figure S9). The plot revealed 210, 1196, and 1250 unique genes in JS0931 vs. CZ0931, JS0931 vs. JS0721, and JS0721 vs. CZ0721, respectively (Figure S10). To further investigate the functions of the DEGs, KEGG pathway enrichment analysis was performed (Table S11). The DEGs from the JS0721 vs. CZ0721, JS0931 vs. CZ0931, and JS0721 vs. JS0721 groups were annotated to 125 (1181 unigenes), 102 (513 unigenes), and 125 (1767 unigenes) KEGG pathways, respectively, with significant enrichment in flavonoid biosynthesis, flavone and flavonol biosynthesis, phenylalanine biosynthesis, and anthocyanin synthesis (Tables S12–S14, Figure S11 and Figure S12).

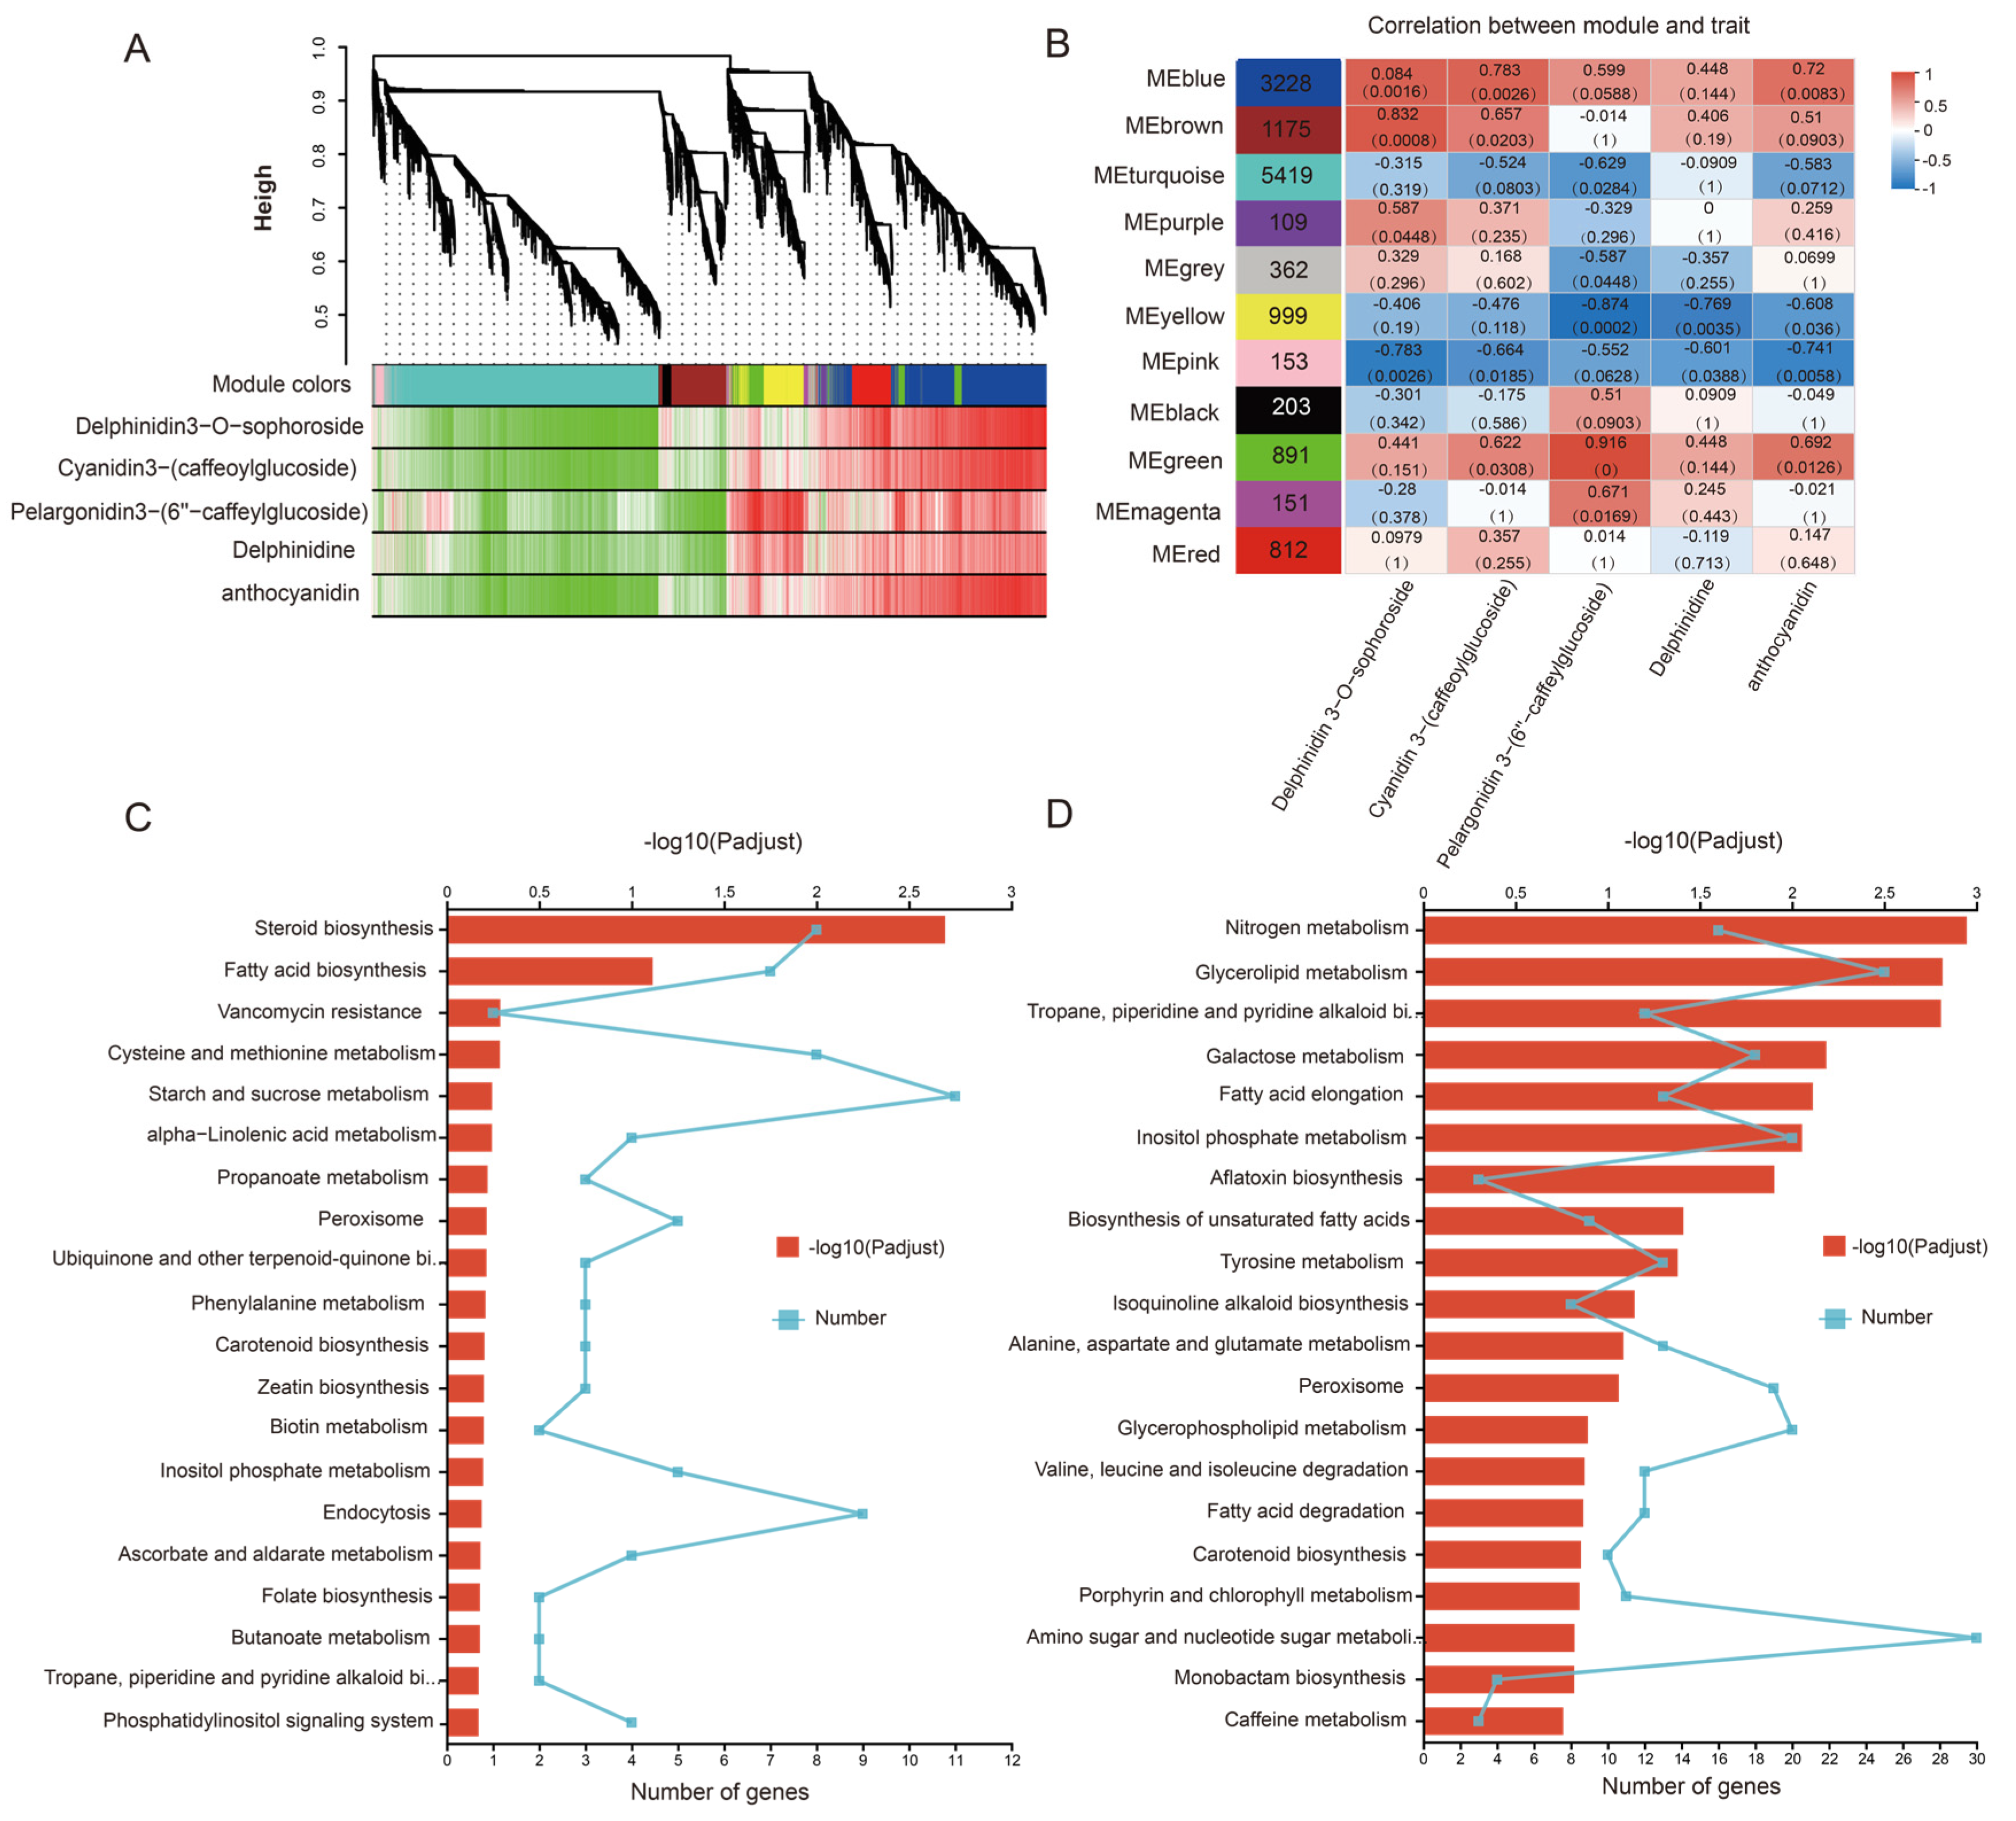
3.4. Weighted Gene Coexpression Network Analysis (WGCNA)

To identify key genes closely associated with the formation of light purple seed coats, weighted gene coexpression network analysis (WGCNA) was conducted. Gene modules significantly correlated with the major anthocyanins responsible for the light purple color in seed coats were analyzed. By employing a scale-free topology criterion, we determined a suitable soft threshold and identified 11 modules, each consisting of more than 100 genes (Figure 4A). The heatmap revealed that two modules (blue and green) were notably positively associated with the four key anthocyanins and the total anthocyanin content, whereas three modules (pink, yellow, and turquoise) were negatively correlated with the four key anthocyanins and the total anthocyanin content (Figure 4B). Thus, it can be deduced that genes within the blue and green modules are significantly associated with the formation of the light purple seed coat. The genes within the blue and green modules are expressed in the biosynthetic pathways of various secondary metabolites, including anthocyanins, flavonoids, and flavonols (Figure 4C,D). Within the green module, three genes linked to phenylalanine metabolism and two genes involved in flavonoid biosynthesis were identified. The blue module contained twelve genes associated with phenylalanine biosynthesis, ten genes involved in flavonoid biosynthesis, nine genes related to phenylalanine metabolism, and one gene linked to anthocyanin biosynthesis. These findings indicated that the DEGs in the green and blue modules were associated with the formation of the light purple color seed coat in walnuts.

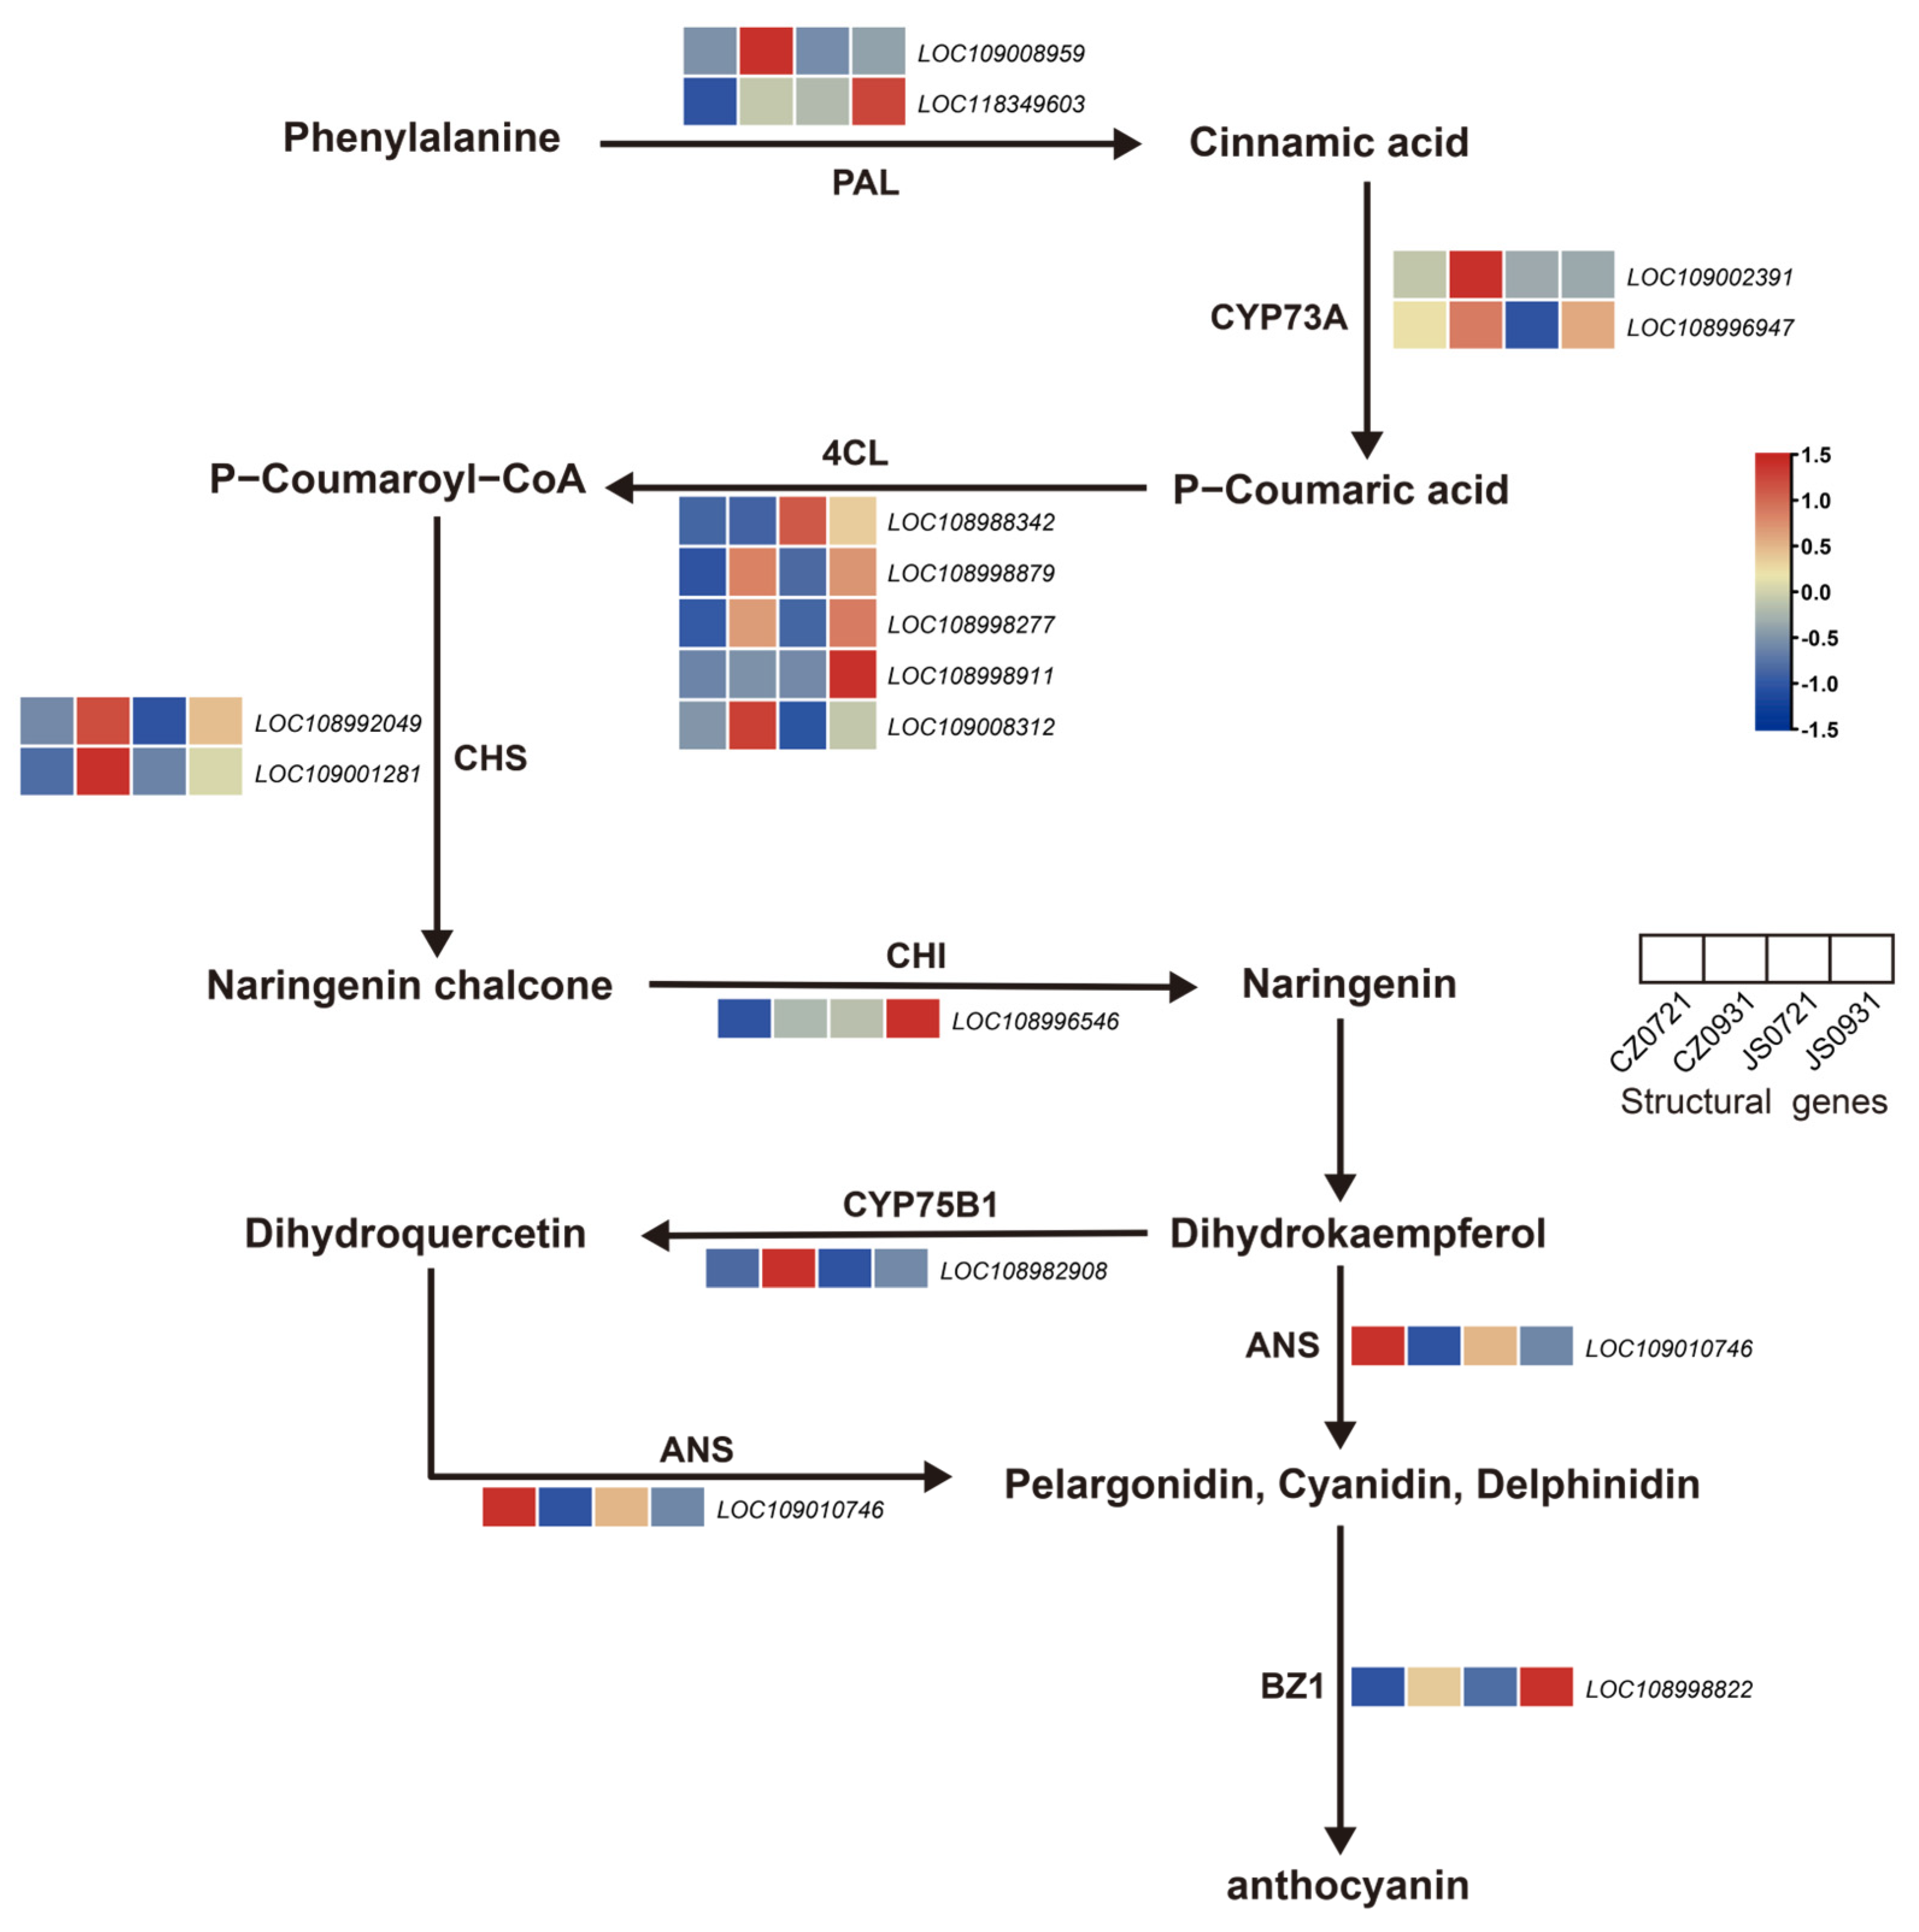
3.5. Anthocyanin Pathway of Seed Coat Coloration

Based on transcriptomic and metabolomic analyses, we constructed the anthocyanin biosynthesis pathway for the light purple color seed coat (Figure 5). In this metabolic pathway, key structural genes such as PAL, CYP73A, 4CL, CHS, CHI, ANS, and BZ1 are involved in the biosynthesis of seed coat pigments. According to the transcriptomics data, the final gene involved in anthocyanin biosynthesis, BZ1 (LOC108998822), was significantly upregulated in the seed coat of JS. Therefore, we propose that BZ1 may be a key structural gene responsible for the light purple color seed coat formation. Furthermore, we also found that two 4CL genes (LOC108988342 and LOC108998911) were upregulated in the seed coat of JS. Additionally, one CHI gene (LOC108996546) and one PAL gene (LOC118349603) were upregulated only in JS0931. The upregulation of these genes in the walnut clone with a light purple color seed coat led to the accumulation of anthocyanin precursors, which subsequently promoted the synthesis of anthocyanins such as cyanidin-3-(caffeoylglucoside), pelargonidin-3-(6″-caffeoylglucoside), and delphinidin-3-O-sophoroside, resulting in a light purple color seed coat.

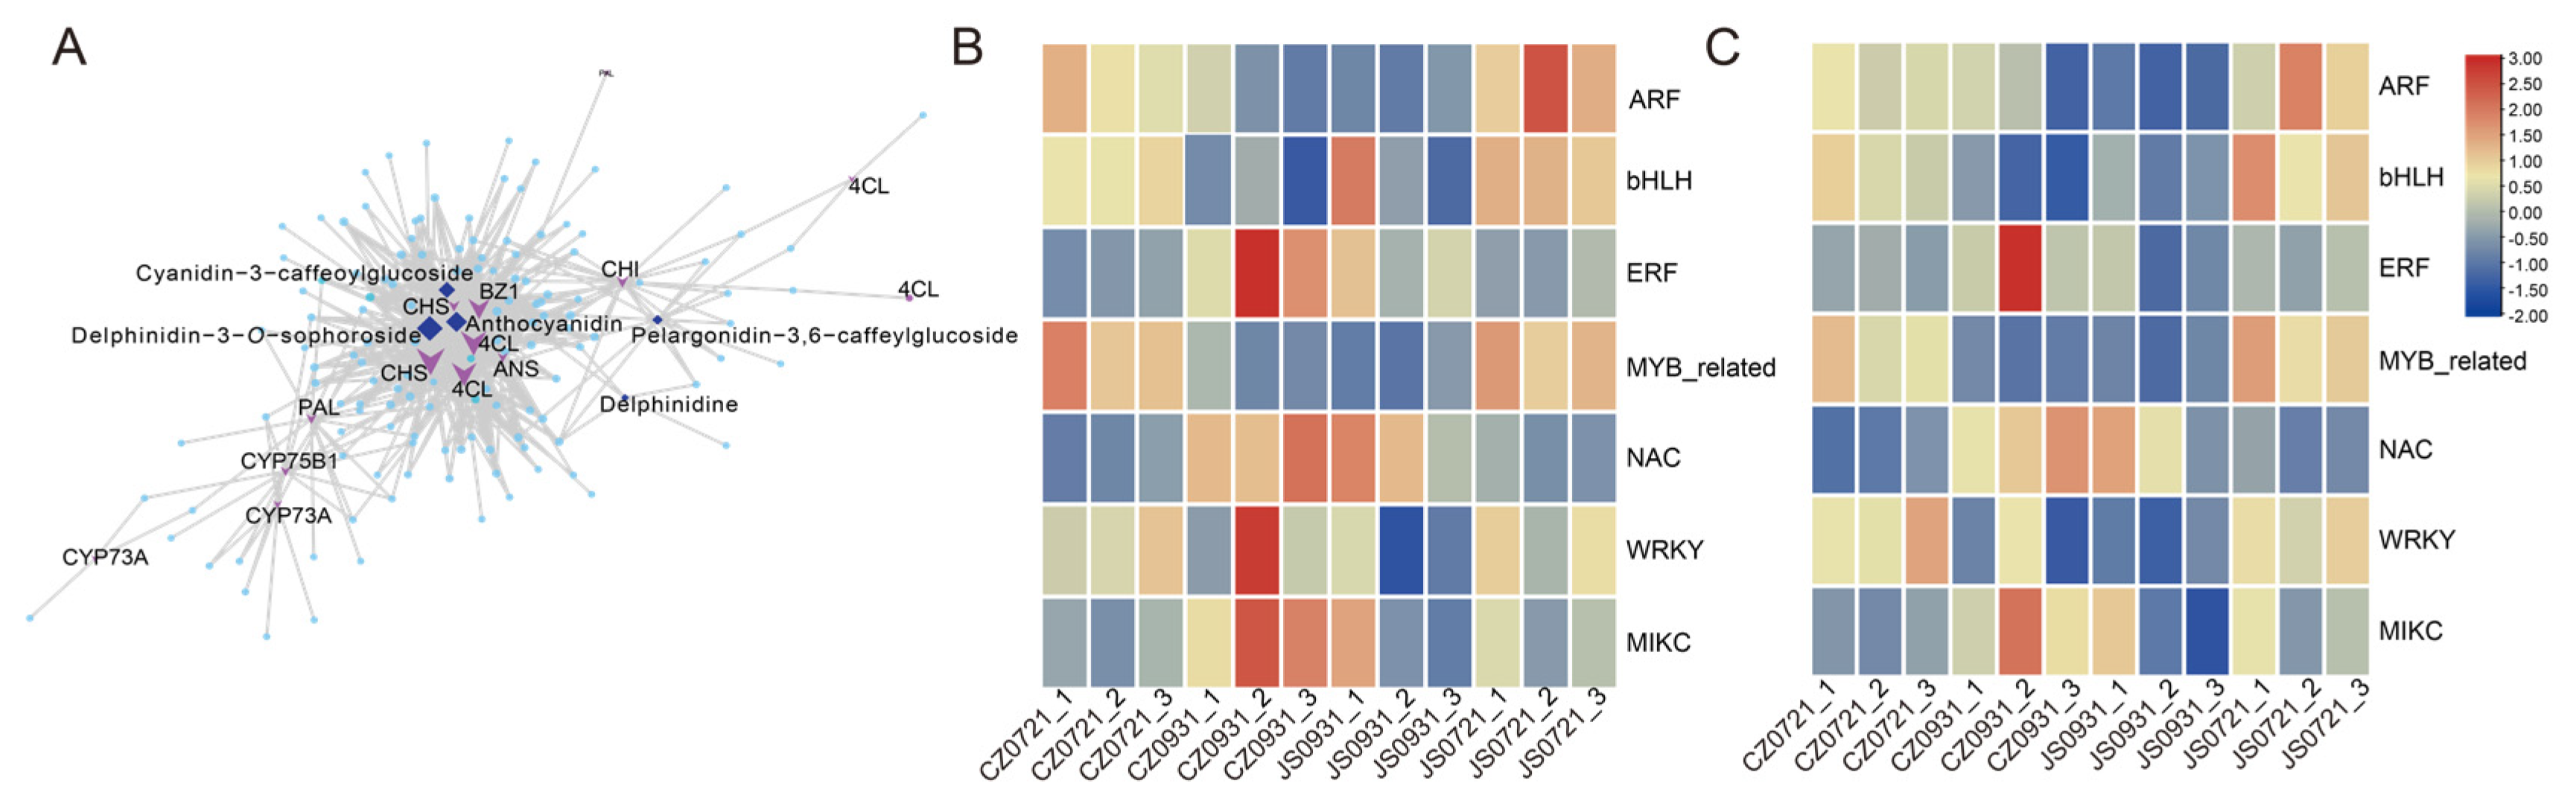
3.6. Transcriptional Regulatory Network

A total of 192 and 191 transcription factors (TFs) were identified in the green and blue modules, respectively (Table S15). Among these genes, MYB, bHLH, WD40, NAC, WRKY, and ERF are the major TF families that regulate anthocyanin synthesis. Furthermore, we conducted a network analysis of TFs, structural genes, and key anthocyanins based on expression/content correlation data (Table S16, Figure 6A). Thirty-eight TFs were significantly correlated with the relative contents of anthocyanin 3-caffeoylglucoside, cyanidin 3-glucoside, cyanidin, and pelargonidin 36-caffeoylglucoside, as well as with the expression levels of PAL, 4CL, CHS, and BZ1. Among them, thirteen MYB-related genes (e.g., LOC109001935, LOC108985255, and LOC109010727), ten MIKC genes (e.g., LOC108990764, LOC108996826, and LOC108991307), and nine NAC genes (e.g., LOC109001443, LOC108998959, and LOC109019714) presented significant positive correlations with the relative contents of key anthocyanins and the expression levels of structural genes. We then analyzed the expression levels of these seven transcription factors in the green and blue modules across samples (Figure 6B,C). We found that the expression levels of ARF (e.g., LOC109003095, LOC109001894, and LOC108992128), bHLH (e.g., LOC109007083, LOC109020529, and LOC109002700), and MYB-related genes (e.g., LOC109001935, LOC108985255, and LOC109010727) were significantly increased in JS0721 (Figure 6B,C). Therefore, we propose that these TFs are the key TFs responsible for the light purple color seed coat. To validate the transcriptome data, fifteen DEGs (nine key enzyme-encoding genes and six transcription factors) were selected for RT-qPCR verification. The results demonstrated that the expression levels of the selected genes were in agreement with the transcriptome data. (Figure 7 and Figure S13).

4. Discussion

The coloration of fruits and nuts serves as a visual cue for their ripeness and is a critical determinant of their market value [24,25]. For example, the color of pecan kernels is considered a primary quality indicator [26]. Walnuts with unique seed coat colors could achieve higher market prices compared with traditional varieties [5]. Flavonoids play crucial roles in determining the color of flowers and fruits. Yufang Wang et al. revealed that the reddish-brown discoloration in the seed coat of Carya illinoensis was likely caused by the oxidation of endogenous, colorless anthocyanins into phthalides, cyanidin, and delphinidin [27]. Similarly, Wang Xin et al. reported that cyanidin-3-O-sophoroside was more abundant in the seed coat of black peanuts, whereas petunidin-3-O-(coumaryl)-glucoside was more prevalent in white peanuts [15]. Notably, the phenolic compounds found in the seed coat may enhance immune function and serve as an important indicator for evaluating the nutritional components of walnuts [28]. In the present study, we conducted targeted metabolomics analyses focused on anthocyanins, identifying 69 involved in the coloration of walnut seed coats. The six most prevalent anthocyanins found in plants are cyanidin, delphinidin, peonidin, pelargonidin, malvidin, and petunidin. The varying concentrations of these anthocyanins in different plant species result in the manifestation of distinct colors across various plant types [29,30,31]. Our findings indicated that the total anthocyanin content in walnut clones with light purple seed coats significantly differed from that in clones with pallid yellow-colored seed coats, with varying accumulation levels across different development stages. We also identified four anthocyanins produced through the phenylpropanoid pathway (delphinidin, cyanidin 3-(caffeoylglucoside), pelargonidin 3-(6″-caffeoylglucoside), and delphinidin 3-O-sophoroside). These anthocyanins were significantly increased in walnut clones with light purple seed coats [16]. Therefore, the increased accumulation of these key anthocyanins may be the primary factor underlying the observed color difference between walnut clones with light purple and pallid yellow seed coats.
Previous studies have demonstrated that PAL, CHS, CHI, CYP73A, CYP75B1, 4CL, DFR, BZ1, and ANS are key structural genes involved in anthocyanin biosynthesis [9]. Among these, PAL, 4CL, and CHI serve as critical enzymes during the initial stage of anthocyanin biosynthesis, catalyzing the conversion of phenylalanine into p-coumaroyl-CoA, a pivotal precursor for anthocyanin synthesis [32,33,34]. Additionally, BZ1 plays a crucial role in the anthocyanin biosynthesis pathway by converting unstable anthocyanins into more stable forms, such as pelargonidin-3-glucoside, cyanidin-3-glucoside, and delphinidin-3-glucoside. These compounds and their derivatives exhibit colors ranging from brick red to fuchsia, purple, and dark tones [32,35,36]. In this study, the expression levels of PAL, 4CL, CHI, and BZ1 were significantly greater in ‘JS71’ (light purple seed coat) compared with ‘Chuanzao 2’ (light yellow seed coat). The elevated gene expression observed in JS71 led to the accumulation of p-coumaroyl-CoA, a key intermediate, thereby promoting anthocyanin accumulation. Consequently, the anthocyanin content in JS71 was greater than that in ‘Chuanzao 2’. Furthermore, the substantial upregulation of BZ1 in JS71 facilitated the accumulation of pelargonidin-3-glucoside, cyanidin-3-glucoside, delphinidin-3-glucoside, and their derivatives in the seed coat, resulting in a distinctive light purple hue rather than the pale-yellow hue observed in ‘Chuanzao 2’.
Recent studies have demonstrated that transcription factors serve as critical regulators in signaling pathways. Specifically, transcription factors such as MYB, EFR, bHLH, and WD40 regulate genes associated with secondary metabolism [33,37,38,39]. MYB and bHLH play essential roles in the transcriptional regulation of genes involved in anthocyanin biosynthesis [40,41,42]. For example, bHLH was found to induce anthocyanin synthesis in the white petals of Dendrobium hybrids [43], whereas ARF participated in the regulatory processes of terpenoid and anthocyanin biosynthesis in microphyllum [44]. In our study, bHLH, MYB-related, and ARF genes were significantly upregulated in JS and strongly correlated with the expression of key genes involved in anthocyanin biosynthesis. Based on these findings, we propose that anthocyanin biosynthesis is regulated by the aforementioned transcription factors, thereby resulting in alterations in seed coat color.

5. Conclusions

This study revealed the regulatory network of anthocyanin biosynthesis in walnut seed coat coloration through comparative metabolomics and transcriptomics analysis. The accumulation of four anthocyanins (delphinidin, cyanidin-3-(caffeoylglucoside), pelargonidin-3-(6″-caffeoylglucoside), and delphinidin-3-O-sophoroside) directly contributed to the light purple color seed coat. The upregulation of the genes BZ1, PAL, 4CL, and CHI in JS, characterized by a light purple seed coat, was associated with anthocyanin accumulation in the seed coat. Furthermore, ARF, bHLH, and MYB-related transcription factors serve as crucial transcriptional regulators in the modulation of anthocyanin biosynthesis. Overall, the color of the walnut seed coat is an important criterion for consumer evaluation, and the results of this study provide a theoretical basis for breeding walnuts with unique seed coat colors.

Supplementary Materials

The following supporting information can be downloaded at: https://www.mdpi.com/article/10.3390/f16040691/s1, Table S1: Primer; Table S2: Summary of anthocyanin identification and quantification; Table S3: Anthocyanins primary and secondary identification quantitative summary table; Table S4: CZ0721_VS_JS0721_OPLS-DA analysis result; Table S5: CZ0931_VS_JS0931_OPLS-DA analysis result; Table S6: JS0721_VS_JS0931_OPLS-DA analysis result; Table S7: The accumulation of anthocyanins in samples is log2fc value; Table S8: Transcriptome sequencing data statistics table; Table S9: Gene expression in samples _FPKM_ table; Table S10: Function Annotated statistical table; Table S11: KEGG functional comments; Table S12: JS0721_vs_CZ0721_KEGG enrichment analysis results; Table S13: JS0931_vs_CZ0931_KEGG enrichment analysis results; Table S14: JS0721_vs_JS0931_KEGG enrichment analysis results; Table S15: Expression of transcription factors in green and blue modules; Analysis of correlation network between transcription factors and key anthocyanins and structural genes; Figure S1: Schematic diagram of anthocyanin synthesis pathway; Figure S2: Anthocyanin classification; Figure S3: Anthocyanin PCA analysis diagram; Figure S4: CZ0721_VS_JS0721_OPLS-DAP ermutation test diagram; Figure S5: CZ0931_VS_JS0931_OPLS-DAP ermutation test diagram; Figure S6: JS0721_vs_JS0931_OPLS-DAP ermutation test diagram; Figure S7: Sample group transcriptome data PCA diagram; Figure S8: Heat map for correlation analysis between sample groups; Figure S9: Statistical map of expression difference; Figure S10: Venn map of gene sets; Figure S11: JS0721_vs_CZ0721_KEGG enrichment analysis; Figure S12: JS0931_vs_CZ0931_ KEGG enrichment analysis; Figure S13: Correlation analysis between RT-qPCR and transcriptome data.

Author Contributions

R.W. and H.Y. designed the experiment and wrote the manuscript. F.H., F.Z. and L.C. reviewed and revised the manuscript. X.H., X.W. and S.Z. were selected for experimental data analysis, and J.Q. and X.L. were selected for sampling. All authors have read and agreed to the published version of the manuscript.

Funding

This study was funded by the Key Research and Development Project of Sichuan Province (2021YFYZ0032), the University Students’ Innovation and Entrepreneurship Training Program Project (202410626053), and Research Interest Group Project of SICAU (20251910).

Data Availability Statement

The RNA-seq data are available in the Genome Sequence Archive (GSA) under accession no. subCRA036776.

Conflicts of Interest

The authors declare no conflicts of interest.

References

  1. Liu, M.; Li, C.; Cao, C.; Wang, L.; Li, X.; Che, J.; Yang, H.; Zhang, X.; Zhao, H.; He, G.; et al. Walnut Fruit Processing Equipment: Academic Insights and Perspectives. Food Eng. Rev. 2021, 13, 822–857. [Google Scholar] [CrossRef]
  2. Li, Z.; Yang, L.; Abuliz, B.; Basti, A.; Yan, S.; Liu, K.; Zhu, Z. Research on the development of walnut industry in China. Chin. J. Agric. Mech. 2013, 34, 23–28. [Google Scholar] [CrossRef]
  3. Marrano, A.; Sideli, G.M.; Leslie, C.A.; Cheng, H.; Neale, D.B. Deciphering of the Genetic Control of Phenology, Yield, and Pellicle Color in Persian Walnut (Juglans regia L.). Front. Plant Sci. 2019, 10, 1140. [Google Scholar] [CrossRef]
  4. Fuentealba, C.; Hernández, I.; Saa, S.; Toledo, L.; Burdiles, P.; Chirinos, R.; Campos, D.; Brown, P.; Pedreschi, R. Colour and in vitro quality attributes of walnuts from different growing conditions correlate with key precursors of primary and secondary metabolism. Food Chem. 2017, 232, 664–672. [Google Scholar] [CrossRef]
  5. Li, Y.; Luo, X.; Wu, C.; Cao, S.; Zhou, Y.; Jie, B.; Cao, Y.; Meng, H.; Wu, G. Comparative Transcriptome Analysis of Genes Involved in Anthocyanin Biosynthesis in Red and Green Walnut (Juglans regia L.). Molecules 2017, 23, 25. [Google Scholar] [CrossRef]
  6. Ma, H.; Yang, T.; Li, Y.; Zhang, J.; Wu, T.; Song, T.; Yao, Y.; Tian, J. The long noncoding RNA MdLNC499 bridges MdWRKY1 and MdERF109 function to regulate early-stage light-induced anthocyanin accumulation in apple fruit. Plant Cell 2021, 33, 3309–3330. [Google Scholar] [CrossRef]
  7. Huang, H.; Zhao, L.; Zhang, B.; Huang, W.; Zhang, Z.; An, B. Integrated analysis of the metabolome and transcriptome provides insights into anthocyanin biosynthesis of cashew apple. Food Res. Int. 2024, 175, 113711. [Google Scholar] [CrossRef]
  8. Han, Y.; Lu, M.; Yue, S.; Li, K.; Shang, F. Transcriptome and metabolome profiling revealing anthocyanin and phenolic acid biosynthetic mechanisms in sweet osmanthus pericarp. Sci. Hortic. 2021, 289, 110489. [Google Scholar] [CrossRef]
  9. Wu, Y.; Han, T.; Lyu, L.; Li, W.; Wu, W. Research progress in understanding the biosynthesis and regulation of plant anthocyanins. Sci. Hortic. 2023, 321, 112374. [Google Scholar] [CrossRef]
  10. Liu, H.; Su, J.; Zhu, Y.; Yao, G.; Allan, A.C.; Ampomah-Dwamena, C.; Shu, Q.; Lin-Wang, K.; Zhang, S.; Wu, J. The involvement of PybZIPa in light-induced anthocyanin accumulation via the activation of PyUFGT through binding to tandem G-boxes in its promoter. Hortic. Res. 2019, 6, 134. [Google Scholar] [CrossRef]
  11. Sunil, L.; Shetty, N.P. Biosynthesis and regulation of anthocyanin pathway genes. Appl. Microbiol. Biotechnol. 2022, 106, 1783–1798. [Google Scholar] [CrossRef] [PubMed]
  12. Yu, X.; Liu, Z.; Sun, X. Single-cell and spatial multi-omics in the plant sciences: Technical advances, applications, and perspectives. Plant Commun. 2023, 4, 100508. [Google Scholar] [CrossRef] [PubMed]
  13. Ma, C.; Feng, Y.; Zhou, S.; Zhang, J.; Guo, B.; Xiong, Y.; Wu, S.; Li, Y.; Li, Y.; Li, C. Metabolomics and transcriptomics provide insights into the molecular mechanisms of anthocyanin accumulation in the seed coat of differently colored mung bean (Vigna radiata L.). Plant Physiol. Biochem. 2023, 200, 107739. [Google Scholar] [CrossRef] [PubMed]
  14. Yang, B.; He, S.; Liu, Y.; Liu, B.; Ju, Y.; Kang, D.; Sun, X.; Fang, Y. Transcriptomics integrated with metabolomics reveals the effect of regulated deficit irrigation on anthocyanin biosynthesis in Cabernet Sauvignon grape berries. Food Chem. 2020, 314, 126170. [Google Scholar] [CrossRef]
  15. Wang, X.; Liu, Y.; Ouyang, L.; Yao, R.; He, D.; Han, Z.; Li, W.; Ding, Y.; Wang, Z.; Kang, Y.; et al. Metabolomics combined with transcriptomics analyses of mechanism regulating testa pigmentation in peanut. Front. Plant Sci. 2022, 13, 1065049. [Google Scholar] [CrossRef]
  16. Zhang, X.; Wang, J.; Li, P.; Sun, C.; Dong, W. Integrative metabolome and transcriptome analyses reveals the black fruit coloring mechanism of Crataegus maximowiczii C. K. Schneid. Plant Physiol. Biochem. 2023, 194, 111–121. [Google Scholar] [CrossRef]
  17. Liu, B.; Zhu, J.; Lin, L.; Yang, Q.; Hu, B.; Wang, Q.; Zou, X.-X.; Zou, S.-Q. Genome-Wide Identification and Co-Expression Analysis of ARF and IAA Family Genes in Euscaphis konishii: Potential Regulators of Triterpenoids and Anthocyanin Biosynthesis. Front. Genet. 2022, 12, 737293. [Google Scholar] [CrossRef]
  18. Gowda, H.; Ivanisevic, J.; Johnson, C.H.; Kurczy, M.E.; Benton, H.P.; Rinehart, D.; Nguyen, T.; Ray, J.; Kuehl, J.; Arevalo, B.; et al. Interactive XCMS Online: Simplifying Advanced Metabolomic Data Processing and Subsequent Statistical Analyses. Anal. Chem. 2014, 86, 6931–6939. [Google Scholar] [CrossRef]
  19. Navarro-Reig, M.; Jaumot, J.; García-Reiriz, A.; Tauler, R. Evaluation of changes induced in rice metabolome by Cd and Cu exposure using LC-MS with XCMS and MCR-ALS data analysis strategies. Anal. Bioanal. Chem. 2015, 407, 8835–8847. [Google Scholar] [CrossRef]
  20. Gagnebin, Y.; Tonoli, D.; Lescuyer, P.; Ponte, B.; de Seigneux, S.; Martin, P.-Y.; Schappler, J.; Boccard, J.; Rudaz, S. Metabolomic analysis of urine samples by UHPLC-QTOF-MS: Impact of normalization strategies. Anal. Chim. Acta 2017, 955, 27–35. [Google Scholar] [CrossRef]
  21. Thévenot, E.A.; Roux, A.; Xu, Y.; Ezan, E.; Junot, C. Analysis of the Human Adult Urinary Metabolome Variations with Age, Body Mass Index, and Gender by Implementing a Comprehensive Workflow for Univariate and OPLS Statistical Analyses. Am. Chem. Soc. 2015, 14, 1535–3893. [Google Scholar] [CrossRef] [PubMed]
  22. Komivi, D.; Marie, A.M.; Rong, Z.; Qi, Z.; Mei, Y.; Ndiaga, C.; Diaga, D.; Linhai, W.; Xiurong, Z. The contrasting response to drought and waterlogging is underpinned by divergent DNA methylation programs associated with transcript accumulation in sesame. Plant Sci. 2018, 277, 207–217. [Google Scholar] [CrossRef] [PubMed]
  23. Dossa, K.; Mmadi, M.A.; Zhou, R.; Zhang, T.; Su, R.; Zhang, Y.; Wang, L.; You, J.; Zhang, X. Depicting the Core Transcriptome Modulating Multiple Abiotic Stresses Responses in Sesame (Sesamum indicum L.). Int. J. Mol. Sci. 2019, 20, 3930. [Google Scholar] [CrossRef]
  24. Otasek, D.; Morris, J.H.; Bouças, J.; Pico, A.R.; Demchak, B. Cytoscape Automation: Empowering workflow-based network analysis. Genome Biol. 2019, 20, 185. [Google Scholar] [CrossRef]
  25. Ma, T.; Sun, X.; Zhao, J.; You, Y.; Lei, Y.; Gao, G.; Zhan, J. Corrigendum to “Nutrient Compositions and Antioxidant Capacity of Kiwifruit (Actinidia) and their relationship with flesh color and commercial value” [Food Chem. 218 (2017) 294–304]. Food Chem. 2017, 224, 439. [Google Scholar] [CrossRef]
  26. Iglesias, I.; Alegre, S. The Effects of Reflective Film on Fruit Color, Quality, Canopy Light Distribution, and Profitability of ‘Mondial Gala’ Apples. HortTechnology 2024, 14, 488–498. [Google Scholar] [CrossRef]
  27. Zhang, C.; Wang, K.; Ren, H.; Chang, J.; Yao, X. Variation in pigments in pecan testa during kernel development and storage. Food Chem. 2024, 438, 137989. [Google Scholar] [CrossRef]
  28. Wang, Y.; He, W.; Wang, L.; Lan, Y.; Wu, M. TCP transcription factor identification in pecan (Carya illinoensis) and salt tolerance function analysis of CiTCP8. Sci. Hortic. 2024, 330, 113051. [Google Scholar] [CrossRef]
  29. Huang, R.; Zhou, Y.; Jin, F.; Zhang, J.; Ji, F.; Bai, Y.; Pei, D. Metabolome and Transcriptome Profiling Unveil the Mechanisms of Polyphenol Synthesis in the Developing Endopleura of Walnut (Juglans regia L.). Int. J. Mol. Sci. 2022, 23, 6623. [Google Scholar] [CrossRef]
  30. Lu, J.; Zhang, Q.; Lang, L.; Jiang, C.; Wang, X.; Sun, H. Integrated metabolome and transcriptome analysis of the anthocyanin biosynthetic pathway in relation to color mutation in miniature roses. BMC Plant Biol. 2021, 21, 257. [Google Scholar] [CrossRef]
  31. Fernández-García, E.; Carvajal-Lérida, I.; Jarén-Galán, M.; Garrido-Fernández, J.; Pérez-Gálvez, A.; Hornero-Méndez, D. Carotenoids bioavailability from foods: From plant pigments to efficient biological activities. Food Res. Int. 2012, 46, 438–450. [Google Scholar] [CrossRef]
  32. Gao, Y.-F.; Zhao, D.-H.; Zhang, J.-Q.; Chen, J.-S.; Li, J.-L.; Weng, Z.; Rong, L.-P. De novo transcriptome sequencing and anthocyanin metabolite analysis reveals leaf color of Acer pseudosieboldianum in autumn. BMC Genom. 2021, 22, 383. [Google Scholar] [CrossRef]
  33. Liu, W.; Feng, Y.; Yu, S.; Fan, Z.; Li, X.; Li, J.; Yin, H. The Flavonoid Biosynthesis Network in Plants. Int. J. Mol. Sci. 2021, 22, 12824. [Google Scholar] [CrossRef] [PubMed]
  34. Naing, A.H.; Kim, C.K. Roles of R2R3-MYB transcription factors in transcriptional regulation of anthocyanin biosynthesis in horticultural plants. Plant Mol. Biol. 2018, 98, 1–18. [Google Scholar] [CrossRef] [PubMed]
  35. Brugliera, F.; Tao, G.-Q.; Tems, U.; Kalc, G.; Mouradova, E.; Price, K.; Stevenson, K.; Nakamura, N.; Stacey, I.; Katsumoto, Y.; et al. Violet/Blue Chrysanthemums—Metabolic Engineering of the Anthocyanin Biosynthetic Pathway Results in Novel Petal Colors. Plant Cell Physiol. 2013, 54, 1696–1710. [Google Scholar] [CrossRef]
  36. Peng, J.; Dong, X.; Xue, C.; Liu, Z.; Cao, F. Exploring the Molecular Mechanism of Blue Flower Color Formation in Hydrangea macrophylla cv. “Forever Summer”. Front. Plant Sci. 2021, 12, 585665. [Google Scholar] [CrossRef]
  37. Liu, Y.; Lv, J.; Liu, Z.; Wang, J.; Yang, B.; Chen, W.; Ou, L.; Dai, X.; Zhang, Z.; Zou, X. Integrative analysis of metabolome and transcriptome reveals the mechanism of color formation in pepper fruit (Capsicum annuum L.). Food Chem. 2020, 306, 125629. [Google Scholar] [CrossRef]
  38. Feng, X.; Yu, Q.; Li, B.; Kan, J. Comparative analysis of carotenoids and metabolite characteristics in discolored red pepper and normal red pepper based on non-targeted metabolomics. Lwt 2022, 153, 112398. [Google Scholar] [CrossRef]
  39. Yu, M.; Bai, M.; Chen, M.; Zhang, G.; Zhao, Y.; Ma, Q.; Yang, L.; Gu, C. Identification of bHLH transcription factors and screening of anthocyanin-related genes in Lagerstroemia indica. Genetica 2024, 152, 179–197. [Google Scholar] [CrossRef]
  40. Liu, X.; Zhao, T.; Yuan, L.; Qiu, F.; Tang, Y.; Li, D.; Zhang, F.; Zeng, L.; Yang, C.; Nagdy, M.M.; et al. A Fruit-Expressed MYB Transcription Factor Regulates Anthocyanin Biosynthesis in Atropa belladonna. Int. J. Mol. Sci. 2024, 25, 4963. [Google Scholar] [CrossRef]
  41. Zhuo, M.-G.; Wang, T.-Y.; Huang, X.-M.; Hu, G.-B.; Zhou, B.-Y.; Wang, H.-C.; Abbas, F. ERF transcription factors govern anthocyanin biosynthesis in litchi pericarp by modulating the expression of anthocyanin biosynthesis genes. Sci. Hortic. 2024, 337, 113464. [Google Scholar] [CrossRef]
  42. Zhao, L.; Gao, L.; Wang, H.; Chen, X.; Wang, Y.; Yang, H.; Wei, C.; Wan, X.; Xia, T. The R2R3-MYB, bHLH, WD40, and related transcription factors in flavonoid biosynthesis. Funct. Integr. Genom. 2012, 13, 75–98. [Google Scholar] [CrossRef] [PubMed]
  43. Wang, D.; Liu, G.; Yang, J.; Shi, G.; Niu, Z.; Liu, H.; Xu, N.; Wang, L. Integrated metabolomics and transcriptomics reveal molecular mechanisms of corolla coloration in Rhododendron dauricum L. Plant Physiol. Biochem. 2024, 207, 108438. [Google Scholar] [CrossRef] [PubMed]
  44. Li, C.; Qiu, J.; Ding, L.; Huang, M.; Huang, S.; Yang, G.; Yin, J. Anthocyanin biosynthesis regulation of DhMYB2 and DhbHLH1 in Dendrobium hybrids petals. Plant Physiol. Biochem. 2017, 112, 335–345. [Google Scholar] [CrossRef]
Figure 1. Phenotypic analysis of fruits from two walnut clones. (A). Comparison of inner seed coat colors between the two walnut clones. JS0721 and JS0931, respectively, represent JS fruits harvested in July and September, while CZ0721 and CZ0931 represent CZ fruits picked in July and September. (B). Comparison of total anthocyanin content in the inner seed coats of the two walnut clones, single factor ANOVA, n = 3, The error bars represent the standard error of the sample data for each group. Different letters denote significant differences at p < 0.05.
Forests 16 00691 g001
Figure 2. OPLS-DA score scatter plots among different groups. (A). CZ0721 vs. CZ0931, (B). CZ0721 vs. JS0721, (C). CZ0931 vs. JS0931, (D). JS0721 vs. JS0931. R2X and R2Y represent the explained variance for the X and Y matrices, while Q2 indicates predictive ability. t1 represents the predictive component score, to1 represents the orthogonal component score, and percentage represents the interpretation of the component to the data set.
Forests 16 00691 g002
Figure 3. The identification of key anthocyanins contributing to light purple color seed coat based on comparative metabolomics. (AC). The S-plot of CZ0721 vs. JS0721, CZ0931 vs. JS0931, and JS0721 vs. JS0931, respectively. The red points indicate anthocyanins with VIP > 1, and the opposite is true for green points. (D). Inter-group comparison volcano plot. The red dots indicate the top five metabolites with fold change > 2, green dots indicate anthocyanins with no significant difference. (AD). The abbreviations stand for anthocyanins. DP, delphinidine, Dp 3-(2″-GalloylGal), delphinidin 3-(2″-galloylgalactoside), Cy 3-(CaffGlc), cyanidin 3-(caffeoylglucoside), Dp 3-O-Arab,delphinidin 3-O-arabinoside, Dp 3-O-Soph, delphinidin 3DiMal-Awb-O-sophoroside, Dp 3-CaffGlc,Delphinidin 3-caffeylglucoside, Dp 3-Glc 5-CaffGlc, delphinidin 3-glucoside 5-caffoyl-glucoside, Mv 3-(6″-MalGlc),malvidin 3-(6″-malonylglucoside), Pg 3-(6-p-CouGlc), pelargonidin 3-(6-p-coumaroyl)glucoside, Pn 3-O-Arab, peonidin 3-O-arabinoside, Mv 3-(6-MalGlc) 5-Glc, malvidin 3-(6-malonylglucoside) 5-glucoside, Cy 4′-Glc, cyanidin 4′-glucoside, Pl 3-Glc, pulchellidin 3-glucoside, Pt 3-(4‴-p-CouRha), petunidin 3-(4‴-p-coumarylrutinoside), Mv 5-Glc, malvidin 5-glucoside (E). Venn diagram of anthocyanin with VIP > 1 and FC > 2 identified in CZ0721 vs. JS0721, CZ0931 vs. JS0931, and JS0721 vs. JS0931.1, 2, and 3 correspond to CZ0721_vs_JS0721, CZ0931_vs_JS0931, and JS0721_vs_JS0931, respectively.
Forests 16 00691 g003
Figure 4. Correlations of structural genes with seed coat coloration attributes based on WGCNA. (A). Clustering dendrogram for identifying structural gene coexpression modules. Blue, brown, turquoise, purple, grey, yellow, pink, black,green,magenta and red represent different genetic modules (B). Relationship between module genes and four key anthocyanins and the total anthocyanin content. In the heat map, red signifies a strong correlation between genes and anthocyanins, whereas blue denotes a weak correlation. (C,D). KEGG enrichment analysis of the genes in the green and blue modules, respectively.
Forests 16 00691 g004
Figure 5. Anthocyanin biosynthesis pathway in the seed coat coloration of JS and CZ. PAL, phenylalanine ammonia-lyase, CYP73A, Cinnamate-4-hydroxylase, 4CL, 4-Coumarate-CoA Ligas, CHS, chalcone Synthase, CHI, chalcone Isomerase, CYP75B1, flavonoid 3′-Hydroxylase, ANS, anthocyanidin synthase, BZ1, anthocyanidin 3-O-glucosyltransferase. Red denotes a relatively high level of gene expression, while blue signifies a relatively low level of gene expression.
Forests 16 00691 g005
Figure 6. Transcriptional regulatory network of walnut seed coat coloration. (A). network of transcription factors, key anthocyanins, and structural genes. The blue dots represent key transcription factors (B). heatmap of the key transcription factors in the green module. (C). heatmap of the key transcription factors in the blue module. Red indicates relatively high levels of transcription factor expression and blue indicates low levels of transcription factor expression.
Forests 16 00691 g006
Figure 7. The relative expression levels of RNA-seq and qPCR of 12 key DEGs in CZ0721, CZ0931, JS0721, and JS0931. Three replicates were performed for each group, and the error line represents the standard deviation of the three replicates. Black represents RNA-seq data, while gray corresponds to qPCR data.
Forests 16 00691 g007
Disclaimer/Publisher’s Note: The statements, opinions and data contained in all publications are solely those of the individual author(s) and contributor(s) and not of MDPI and/or the editor(s). MDPI and/or the editor(s) disclaim responsibility for any injury to people or property resulting from any ideas, methods, instructions or products referred to in the content.

