Abstract
Highland bamboo (Oldeania alpina) plays a vital role in supporting local livelihoods, fostering biodiversity conservation and sustainable land management. Despite these benefits, its significant potential for carbon sequestration remains underutilized within Ethiopia’s climate mitigation strategies. In this study, we developed site-specific allometric equations to assess the biomass and carbon storage potential of highland bamboo. Data were collected from the Garamba natural bamboo forest and Hula homestead bamboo stands in the Sidama Regional State, Southern Ethiopia. Data on stand density and structure were gathered using systematically laid transects and sample plots, while plant samples were analyzed in the laboratory to determine the dry-to-fresh weight ratios. We developed allometric models to estimate the aboveground biomass (AGB) and carbon stock. The study results indicated that homestead bamboo stands exhibited higher biomass accumulation than natural bamboo stands. The AGB was estimated at 92.3 Mg ha⁻1 in the natural forest and 118.3 Mg ha⁻1 in homestead bamboo stands, with total biomass carbon storage of 52.1 Mg ha⁻1 and 66.7 Mg ha⁻1, respectively. The findings highlight the significant potential of highland bamboo for carbon sequestration in both natural stands and homesteads. Sustainable management of natural highland bamboo stands and integrating bamboo into farms can contribute to climate change mitigation, support ecosystem restoration, and enhance the socio-economic development of communities.
1. Introduction
Bamboo is a woody, perennial grass that belongs to the Poaceae family [1]. As a critical component of the global forest and landscapes, bamboo plays an important role in maintaining ecological biodiversity, providing local livelihoods, and enhancing carbon sequestration, primarily due to its rapid growth rate and high biomass production [2,3]. Moreover, bamboo ecosystems act as significant carbon sinks, storing substantial carbon stocks, both aboveground in culms and branches and belowground in rhizome root systems and soil organic pools, underscoring their importance in climate change mitigation strategies [4,5,6].
Bamboo as a biological, regenerative, and biodegradable resource lends itself to annual harvesting without the need for replanting, adds value to diverse products along the value chain, and is reusable for multiple products, perfectly fitting into the circular economy and providing climate change mitigation benefits [7,8]. In addition to mitigation, bamboo helps in building the resilience of communities impacted by climate change, offering alternative livelihoods and income and diversifying food and fodder sources [9,10]. In recent years, with increasing technological development and innovation, a diverse set of products ranging from bio-construction material, bio-energy, fiber, pulp and paper, woven products, furniture, daily use products, plastic substitutes, and a wide range of engineered products are gaining attention as eco-friendly alternatives to highly energy intensive materials [11,12].
There are over 1600 species of bamboo widely growing in 35 million hectares across tropical and sub-tropical regions of the world [13,14]. With increasing global attention on bamboo as a tool for climate change mitigation, a number of studies on the biomass and carbon stock of Asian bamboo species have been conducted and published [15,16,17,18,19,20,21,22,23,24,25,26,27,28]. Biomass, carbon stock, and sequestration rates in woody bamboos are quite comparable with those in agroforestry and forest ecosystems [2,8,29]. Bamboo forests, when optimally managed and adopting sustainable management practices, can sequester more carbon than fast growing trees such as a Chinese fir and Eucalyptus [29]. Sustainable management practices such as selective harvesting of mature bamboo poles enhance benefits by optimizing carbon sequestration across pools, including aboveground biomass, belowground rhizomes, and critically, soil organic carbon [30]. This approach not only deepens carbon sinks but also reinforces the interconnected ecological and socio-economic roles of bamboo, positioning it as a crucial resource for restoring degraded landscapes and bolstering climate resilience in Ethiopia and in other bamboo growing countries [15,30].
In Ethiopia, despite alarming carbon stock losses driven by deforestation [31], bamboo has emerged as a nature-based solution for climate change, offering a permanent carbon sink and providing socio-economic benefits, along with delivering multiple ecosystem services [15]. Ethiopia has one of the largest bamboo resources in Africa and bamboo grows in about 1.4 million hectares [32]. It hosts two indigenous bamboo species, namely highland bamboo (Oldeania alpina K. Schum Stapleton) and lowland bamboo (Oxytenanthera abyssinica (A. Rich.) Munro), which thrive in distinct agro-ecological zones at 2400–3500 m and 500–1800 m elevations, respectively. Highland bamboo (Oldeania alpina) stands out as a fast-growing species that thrives in both natural forests and smallholder plantations, underpinning ecological resilience and diverse livelihood applications [33]. This species is distributed across Ethiopia’s southern, southwestern, central, and northwestern highlands at elevations of 2200–4000 m AMSL, achieving its optimal productivity between 2400 and 3500 m AMSL under conditions of >1200 mm annual rainfall, moderate slopes (0%–60%), and temperatures of 6–30 °C [33]. Despite its ecological adaptability and socio-economic benefits, highland bamboo (Oldeania alpina) remains underutilized across Ethiopia and Africa [9,34]. Locally, highland bamboo is a vital resource for household, micro-, small-, and medium-scale enterprises producing craft and utility products, furniture, construction materials, and bio-energy products [11,35], aligning with global trends in circular economies that prioritize renewable materials. Industries are now emerging to process bamboo into high-end value-added products, such as engineered timber substitute products, stick-based products, plastic substitutes, and bioenergy fuels (e.g., charcoal and briquettes). Enlarging value addition and utilization not only mitigates deforestation pressures but also amplifies Ethiopia’s potential to leverage bamboo as a dual engine for ecological restoration and inclusive growth, reinforcing its strategic importance in regional and global sustainability agendas.
Accurate estimation of carbon stored in bamboo in living biomass, litterfall, and soil organic carbon pools is vital to better integrate bamboo into climate change mitigation strategies, particularly in tropical and subtropical regions where it forms a key component of forest ecosystems [2,15]. More specifically, quantifying carbon stocks enhances their integration into global carbon credit mechanisms, such as REDD+, and global climate policies, underscoring bamboo’s role in achieving net-zero targets [14,36,37]. Estimation of bamboo biomass and carbon stocks requires robust methodologies, combining species-specific allometric equations, remote sensing, and field measurements to account for bamboo’s unique growth patterns and spatial distribution [38,39]. However, knowledge of the role of bamboo in carbon sequestration and climate mitigation remains limited, hindering its integration into national and global sustainability frameworks [30,40]. In particular, with wide species diversity and growing range, there is a need for species-specific allometric models for estimating biomass and carbon stock, which is lacking in the case of highland bamboo in Ethiopia.
The objectives of this study are specifically to (1) develop species-specific allometric models for estimating highland bamboo biomass, and (2) study stand structure and quantify the biomass and carbon storage capacity of highland bamboo stands in both natural forests and homestead farms in the Arbegona and Hula districts of the Sidama Regional State, Ethiopia.
2. Materials and Methods
2.1. Study Area
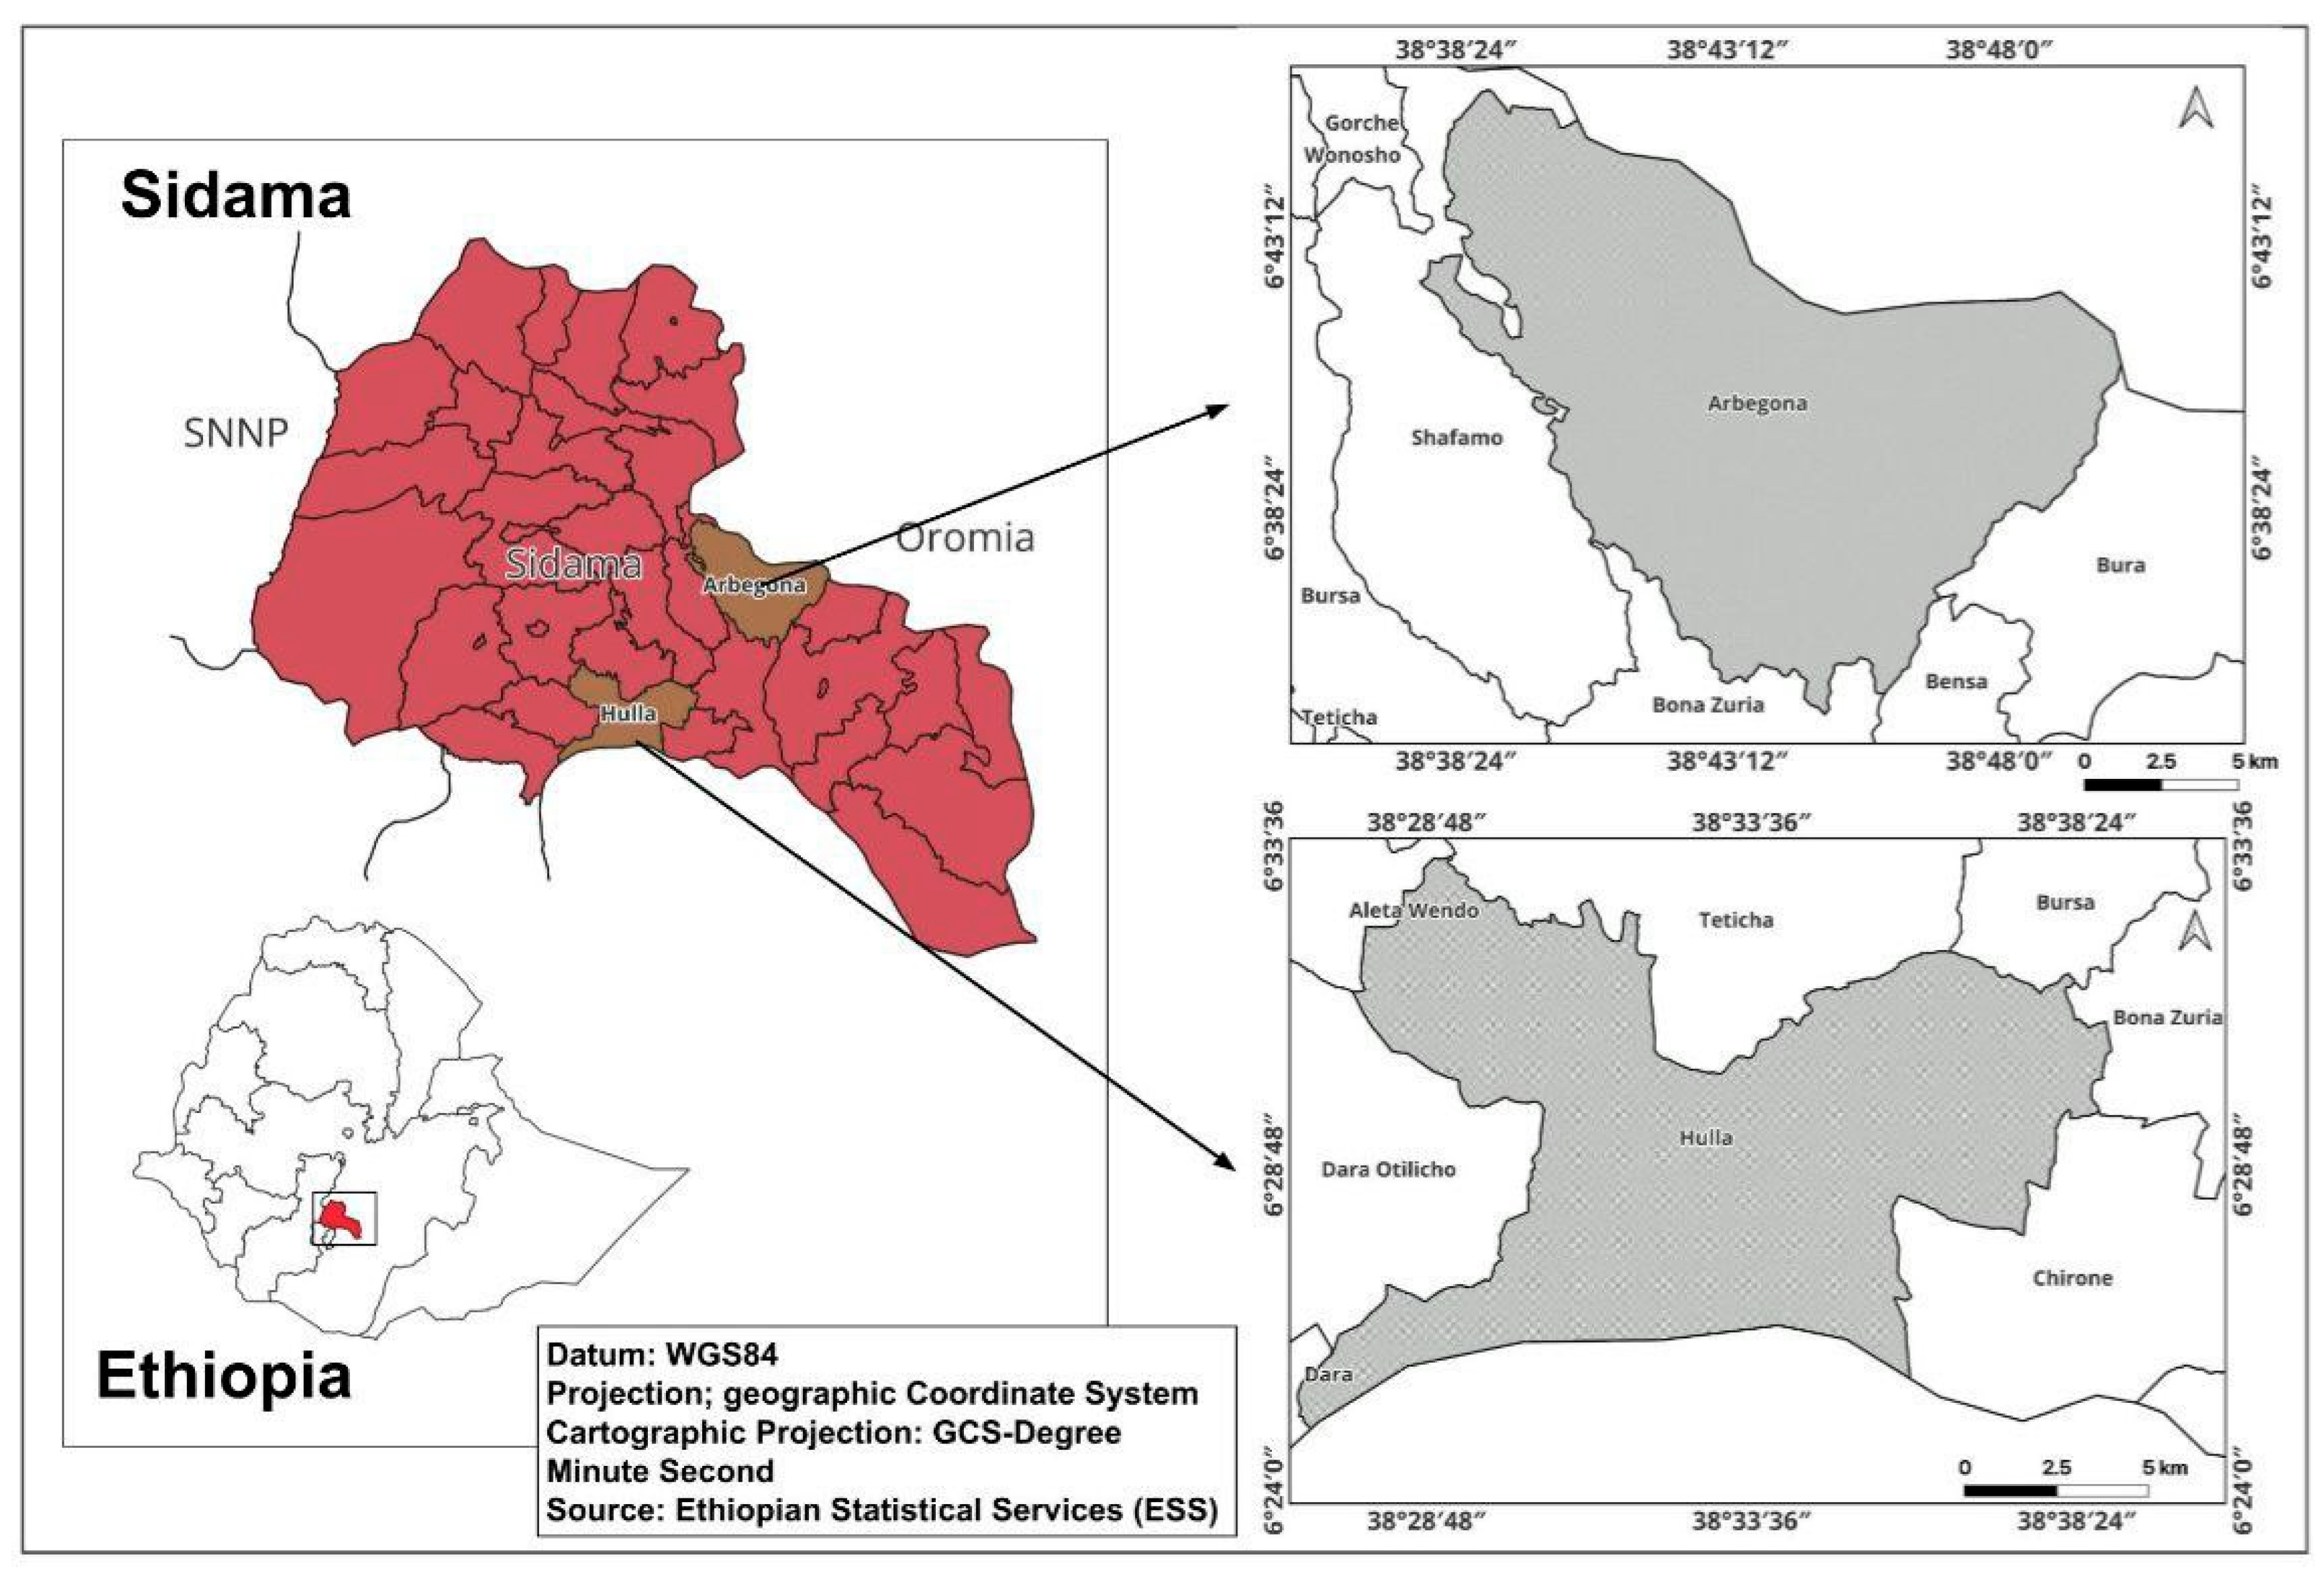
This study was conducted in the Arbegona and Hula districts of the Sidama Regional State, Ethiopia (Figure 1). These districts were selected due to the availability of bamboo resources, with Arbegona featuring natural bamboo forests and Hula encompassing homestead bamboo plantations established by local communities.

Figure 1.
Map of the study areas.
Arbegona is one of 36 districts in the Sidama National Regional Government, located 77 km from Hawassa, the regional capital. The district lies between 6°35′18″ to 6°56′37″ N latitude and 38°35′60″ to 38°53′36″ E longitude [41]. It borders the Bura and Kokosa districts of the Oromia Regional Government. The district comprises 32 kebeles or villages, 30 of which are rural and 2 are urban settlements. The total land area of the district is 235.51 km2, with 80% of the terrain being mountainous and 20% of the land flat. Of the 32 kebeles, 8 are classified as highland and 24 as sub-alpine climates. The district’s total population is 174,731, with 87,336 males and 87,395 females. According to the district’s forestry department, Arbegona is home to 235 ha of natural bamboo forests and 3975.5 ha of bamboo plantations, equating to 4210.5 ha of total bamboo forests. The study site was situated at an altitude of 2780 m AMSL, with annual rainfall ranging from 1400 to 1800 mm and temperatures between 14 °C and 21 °C. Mount Garamba, located in Fode Folish kebele (12 km from the district capital), spans 250 ha at an altitude of 3360 m AMSL. Approximately 95% of the mountain is covered in natural highland bamboo, with a few indigenous tree species scattered throughout. The mountain is a crucial source of natural water springs and provides numerous environmental and social benefits to the local community.
Hula is located in the Southern Sidama Zone of the Sidama Regional State, Ethiopia at approximately 6°35′ N latitude and 38°35′ E longitude. It shares borders with the Bura district (Oromia Region) to the south, the Dara district to the west, the Bursa district to the north, and the Bona Zuria district to the east. Hula’s capital, Agere Selam, is situated 24 km from the zonal capital, Aleta Wendo, and 94 km from the regional capital, Hawassa. Covering a total area of 159.61 km2, Hula comprises 18 kebeles (16 rural and 2 urban). The district’s terrain is predominantly mountainous, accounting for about 80% of the land area, while the remaining 20% is flat. Key agricultural crops include corn, wheat, barley, local cabbage, and potatoes. Hula experiences a bimodal rainfall pattern, with most precipitation occurring during the Kiremt (June–September) and Belg (March–May) seasons. The average annual rainfall is approximately 1331 mm, and the mean annual temperature is 13.4 °C, indicating a cool, temperate climate [42]. According to the district forestry department, 59.6% of the land is arable, while 36.2% of the land is pastureland, 2.3% is forest, and the remaining 1.8% consists of swampy, degraded, or otherwise unusable land. Of the total forest cover of the district, 38% (1400 ha) consists of highland bamboo, primarily cultivated on homestead farmlands. Based on the 2007 census by Ethiopia’s Central Statistical Agency [43], the district has a total population of 129,263, with 64,551 males and 64,712 females. Urban residents make up 4.96% of the total population.
2.2. Survey and Sampling
A survey was conducted in the Garamba natural bamboo forest in Arbegona district to obtain data on the stand density, structure, biomass, and carbon sequestration potential of the bamboo stands. Transects were laid down systematically from the top ridges of the mountain to the bottom edge. The first transect was aligned randomly on one side of the forest using a compass. Then, the other transects were laid at intervals of 300 m from each other in the bamboo stands. Sample quadrants measuring 10 × 10 m were laid down at 200 m distances apart along line transects following a sampling methodology developed earlier [30]. A total of 12 plots (4 plots per transect) were established in the study area.
2.3. Data Collection
Within the sample plots, data were collected on structural attributes—including diameter at breast height (DBH), basal diameter, total height, culm density, and culm age—as well as environmental factors such as slope, aspect, and altitude [38]. Bamboo culms were categorized into four age groups: Group 1 (1-year-old culms), Group 2 (2- and 3-year-old culms), Group 3 (4- and 5-year-old culms), and Group 4 (culms older than 5 years) based on specific indicators [38]). Then, stand basal area was calculated from DBH. A total of 96 culms were randomly selected and harvested—two from each age group per plot—for biomass estimation [12,30]. Destructive sampling was employed to obtain data on the fresh weight of highland bamboo for aboveground biomass (AGB) estimation following the methods outlined by Singnar et al. [44]. A summary of the field data collected from the bamboo stands is presented in Table 1.

Table 1.
Summary statistics of the field data gathered from the bamboo stands in the study areas.
2.4. Bamboo Sample Collection and Analysis
Bamboo subsamples (stems, branches, and leaves) were collected and transported to the Forest Products Innovation Center of Excellence at the Ethiopian Forestry Development in Addis Ababa, Ethiopia. In the laboratory, the subsamples were dried at 85 °C until a constant weight was achieved [12]. The mean absolute dry-to-fresh weight ratio was then calculated to estimate the dry biomass of the various bamboo parts across age groups, following Yebeyen et al. [30].
2.5. Modeling Allometric Relationships
2.5.1. Height–Diameter Allometry
Various functions were explored to model the height–diameter (H–D) relationships of the bamboo samples to identify the best functional form that predicts asymptotic height (Hmax). Several non-linear models have previously been considered for H–D relationship prediction, of which the following functions were chosen to identify the best model. In all but the Power law model, a is asymptotic height (Hmax):
These models were compared using the common model selection criteria, namely the root mean square error (RMSE), the bias-corrected Akaike information criterion (AICc) [44], and the mean normalized bias (MNB). The best H–D model was deemed to be the one with the smallest RMSE, AICc, and MNB.
2.5.2. Biomass Estimation Models
The two models (Models 1 and 2) were tested to estimate bamboo AGB. Model 1 used the natural logarithm of DBH alone [ln(D)], while Model 2 used the natural logarithm of volume [ln(D2H)] as a predictor. Model 1 followed a simple allometric function using DBH:
Previous studies (e.g., Singnar et al. [44,45]) have demonstrated that D2H is a better predictor of bamboo AGB than D or H alone. Strictly speaking, a model with D2H is not allometric in nature, as it involves a compound variable [46], shown in the following form:
where AGB is aboveground biomass, D is diameter at breast height, and H is plant height.
The models were compared using the common model selection criteria, namely R2, root mean square error (RMSE), and the bias-corrected Akaike information criterion (AICc) [44]. The best species-specific model for AGB was deemed to be that with the largest R2 and the smallest RMSE and AICc.
2.5.3. Estimating Plant Biomass and Carbon Stocks
AGB was estimated using the developed allometric equation based on DBH, whereas biomass density (kg ha−1) was calculated by adding together all bamboo biomass values within the sample unit area and converting to hectares [30]. Belowground biomass (BGB) was determined by multiplying AGB using a ratio of 0.20, as prescribed by the Intergovernmental Panel on Climate Change and previous studies [47,48]. Total plant biomass was then computed by summing aboveground and belowground biomass.
The amount of carbon in each biomass was determined by multiplying the default carbon fraction of 0.47 provided by the Intergovernmental Panel on Climate Change (IPCC) by oven-dried biomass conversion [47]. The carbon storage of all bamboo within a unit area according to age group was added to determine carbon stock. Finally, one-way analysis of variance was used to compare aboveground and total biomass carbon among the age groups. When p < 0.05, the differences between age groups were deemed significant. Tukey’s HSD (Honestly Significant Difference) test was used to compare the means of the various age groups post-hoc when an omnibus F-test revealed significance.
3. Results
3.1. Stand Structure
Highland bamboo displays distinct growth patterns in pure stands in the Garamba natural forest, thriving at elevations higher than those of other tree species (Figure 2). Conversely, in Hula homestead farmlands, it grows in discrete stands within each farm for bamboo pole production. Stand characteristics, such as age-specific mean DBH, basal area, height, and culm density, are presented in Table 1.
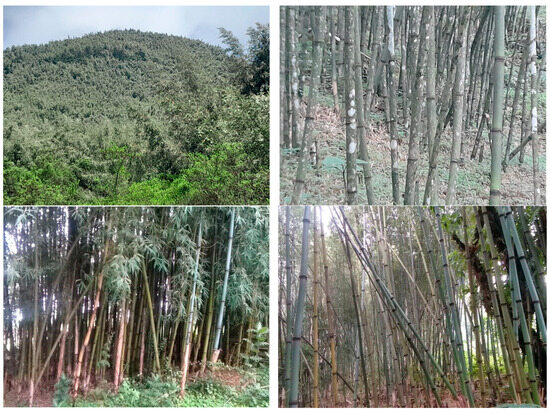
Figure 2.
Bamboo stands in Garamba’s natural bamboo forest (top) and Hula’s homestead bamboo farms (bottom).
In the natural forest, the proportion of bamboo culms within the total stand density for Age Groups 1, 2, 3, and 4 was 5.2%, 13.3%, 19.6%, and 61.9%, respectively, resulting in a stand density ratio of 1:1:2:6. In turn, in homestead bamboo farms, the proportions were 32.2%, 35.6%, 30.1%, and 2.1% for the same age groups, leading to a stand density ratio of 3:4:3:0. These differences highlight distinct growth patterns, with natural forests favoring older culms and homestead farms maintaining a more balanced age distribution for optimal pole harvesting.
Culm density (culms ha⁻1) varies across age groups, with natural forest stands again dominated by older bamboo and homestead farms having a more balanced age distribution. In forest stands, density increases with age, ranging from 1008 culms ha⁻1 in Age Group 1 to 12,017 culms ha⁻1 in Age Group 4, with a total stand density of 19,425 culms ha⁻1. In contrast, homestead farms exhibit higher culm densities in younger age groups, with 7008 culms ha⁻1 (Age Group 1), peaking at 7742 culms ha⁻1 (Age Group 2), before declining sharply to 467 culms ha⁻1 in Age Group 4, resulting in a total stand density of 21,775 culms ha⁻1. This indicates that culm density (ha−1) is higher in the homestead farms compared to natural stands in forests.
DBH varies between the two environments as well, with the natural forest showing a relatively stable trend (4.3–5.2 cm). In contrast, DBH increases with age in homestead farms from 4.5 cm (Age Group 1) to 5.6 cm (Age Group 4), suggesting active selection of larger culms for harvesting. The number of bamboo plants in diameter classes 2–4 cm, 4–6 cm, and 6–8 cm account for 29.1%, 57.3%, and 13.1% of the total samples for the natural bamboo forest and 16.2%, 64.4%, and 19.4% for the homestead bamboo farms, respectively.
Bamboo height in the natural forest decreases with age from 10.3 m (Age Group 1) to 9.0 m (Age Group 4), whereas in homestead farms, height data are not available for individual age groups, but they do show an overall average of 10.8 m. Basal area values show significant differences between the two environments, with higher values generally found in homestead farms compared to the natural forest (Table 1). The natural forest exhibits increasing basal area with age, reaching 18.56 m2 ha⁻1 in Age Group 4, contributing to a total basal area of 32.68 m2 ha⁻1. In homestead farms, basal area is significantly higher in younger age groups, peaking at 14.36 m2 ha⁻1 (Age Group 3) before dropping to 1.16 m2 ha⁻1 (Age Group 4), resulting in a total of 41.52 m2 ha⁻1.
3.2. Dry-to-Fresh Weight Ratio of Highland Bamboo Components
The dry-to-fresh weight ratio of highland bamboo varies across different age groups and plant components, as shown in Table 2. The culm exhibits a slightly higher dry-to-fresh weight ratio compared to branches and leaves, indicating a greater proportion of dry matter content in the main structural component. For culms, the dry-to-fresh weight ratios range from 0.53 (Age Group 1) to 0.55 (Age Group 3), with a slight decline to 0.54 in Age Group 4. This pattern suggests a gradual increase in dry matter accumulation with age, stabilizing in older culms. In contrast, the branch and leaf components have lower ratios, ranging from 0.42 (Age Group 1) to 0.46 (Age Group 3), before slightly decreasing to 0.45 in Age Group 4.
Table 2.
Average dry-to-fresh weight ratio for different parts of highland bamboo per age group.
3.3. Allometric Scaling for Quantifying Bamboo Biomass and Carbon
3.3.1. Height–Diameter Allometry
The H–D relationships using different predictive models are presented in Table 3 and Figure 3. The algorithms for most models we tested did not converge, so we were unable to identify a suitable model for the asymptotic height of highland bamboo in the natural forest at Arbegona. However, among the models tested, the Exponential (2-parameter) model performed best with the lowest AICc (15.8) and RMSE (1.06), indicating superior predictive accuracy and efficiency. The Logistic (3-parameter) model and Gompertz model also showed strong performance, with AICc values of 18.0 and 18.4, respectively and identical RMSE values (1.07). These models could serve as alternative options, particularly in scenarios where a logistic growth pattern is expected. Conversely, the Hyperbolic model exhibited the weakest performance, with the highest RMSE (1.14) and AICc (30.1), suggesting poor predictive capability. The Power law model, while widely used in forestry, had a moderate fit with an AICc of 19.0, performing similarly to the Weibull, Monomolecular, and Richard models.
Table 3.
Comparison of height–diameter (H–D) models using the pseudo R2, bias-corrected Akaike information criterion (AICc), root mean square error (RMSE), and the mean normalized bias (MNB).
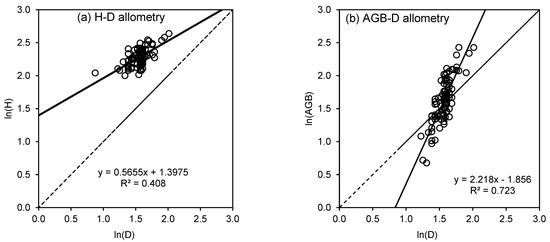
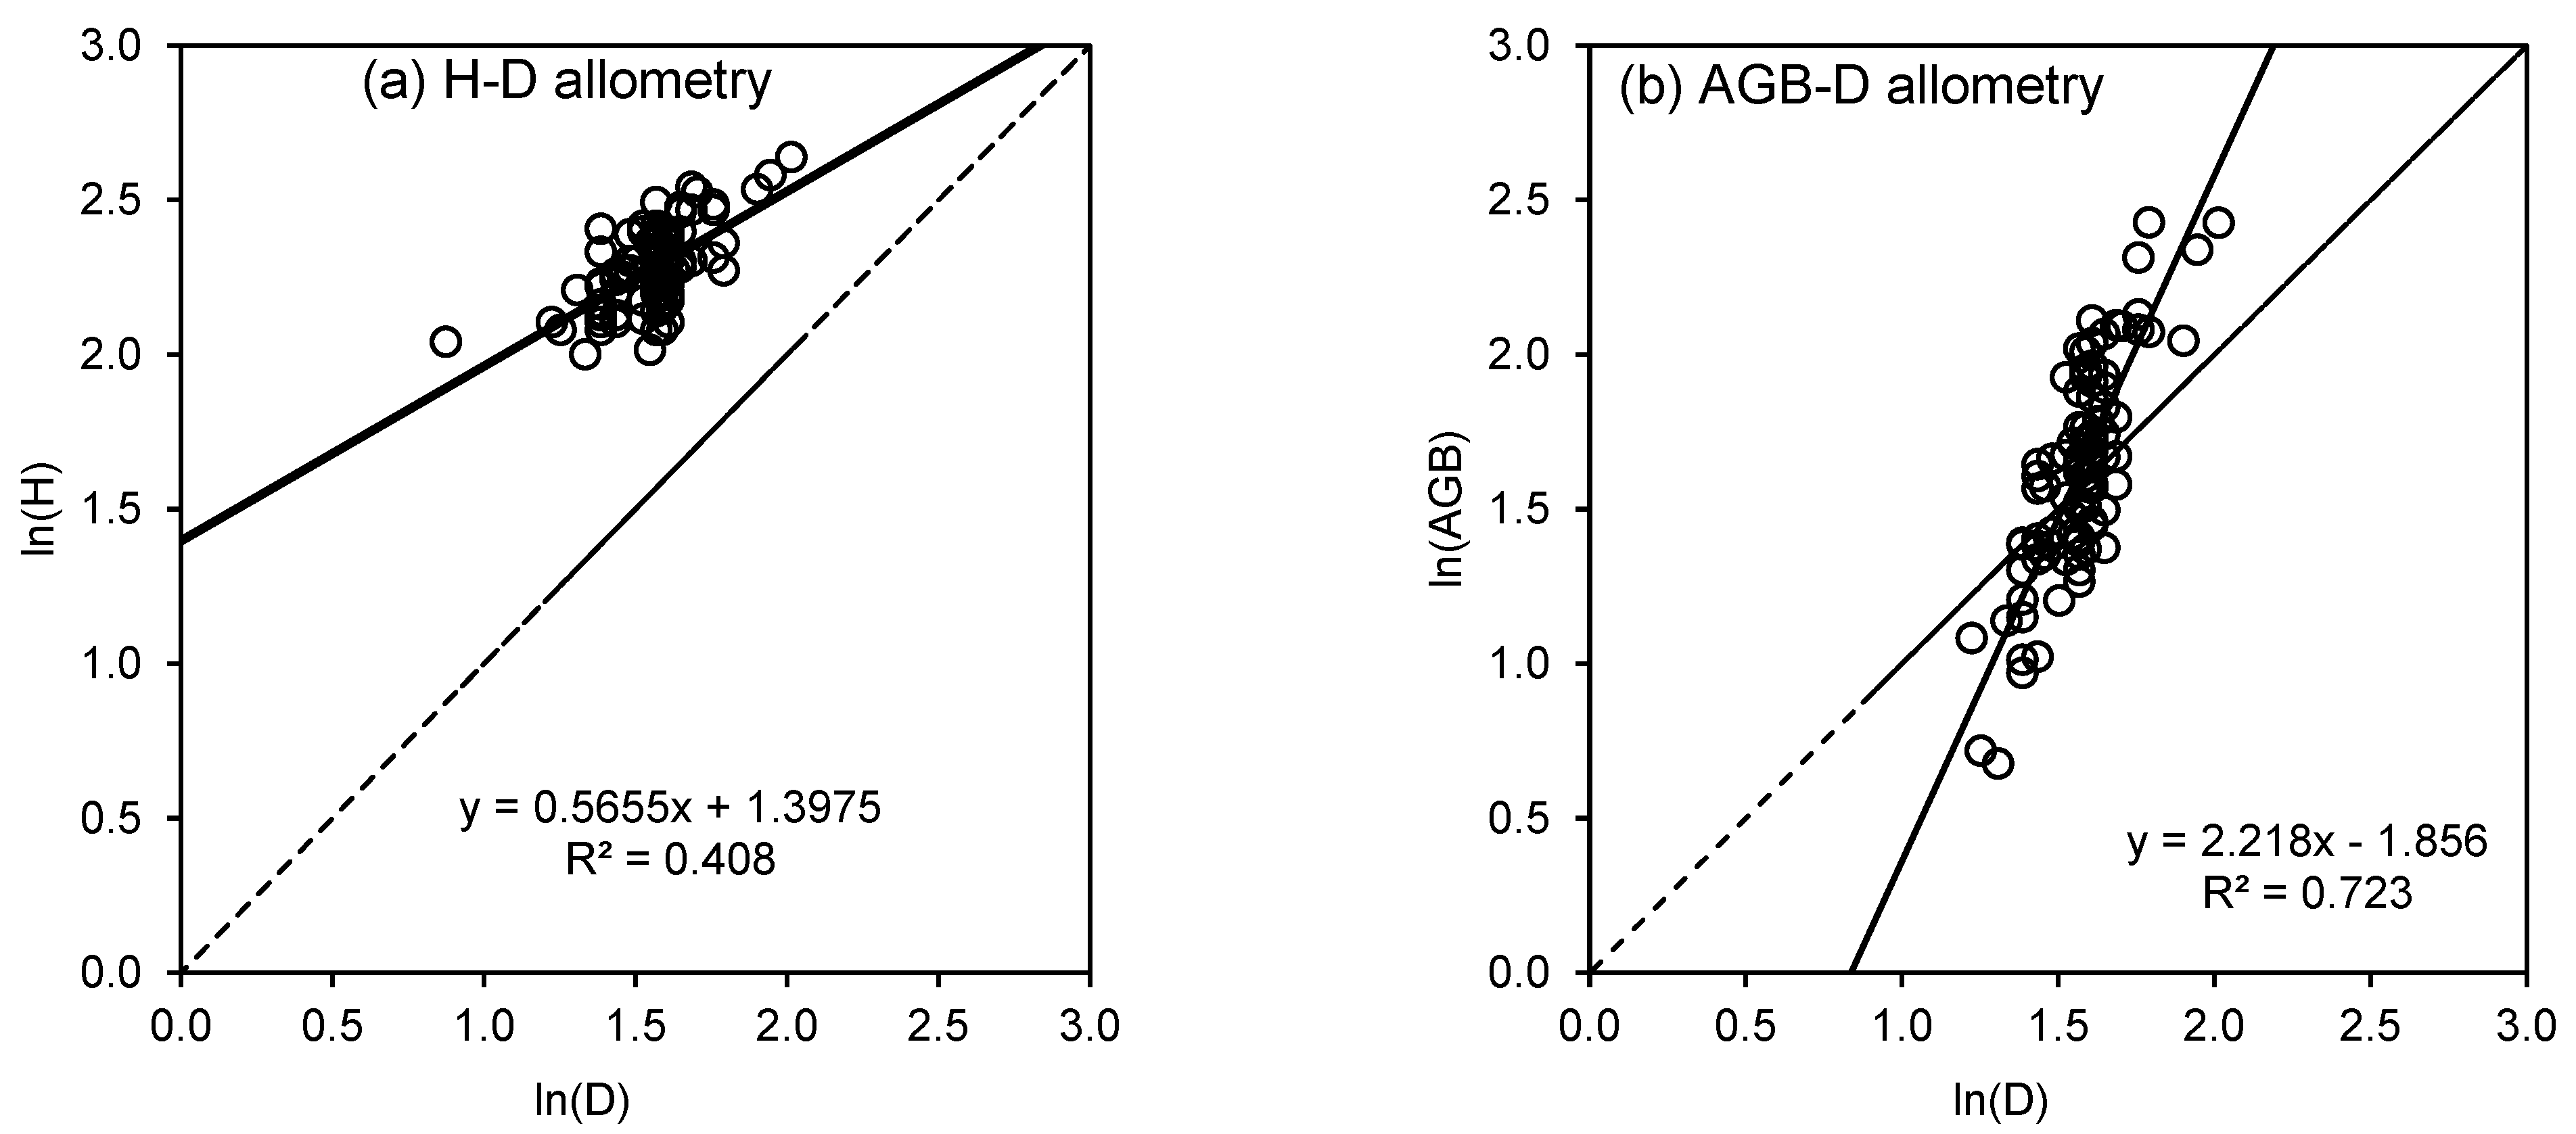
Figure 3.
Allometric scaling of bamboo (a) stem height (H) and (b) aboveground biomass (AGB) with diameter at breast height (D) in the logarithmic domain. Solid lines represent fitted lines and dashed lines represent 1:1 lines.
When the difference between the AICc of two models is less than 10, one model is not considered better than the other. Thus, we further explored and refined the Power law model using three different regression techniques, namely ordinary least squares, reduced major axis, and major axis regression. We regressed H against ln(D) after removing two outliers and estimated the uncertainty around the coefficients using bootstrapping. Table 4 presents the coefficients and their 95% confidence intervals.
Table 4.
Comparison of H–D models after removing two outliers.
3.3.2. Biomass Estimation Models
We compared the two biomass estimation models (Model 1 and Model 2) for bamboo AGB estimation. For Model 1, Bartlett’s test of equality of variances does not reveal significant differences between the age groups (χ2 = 1.40; p = 0.706). The test of equality of slopes also does not reveal significant differences between the exponents (F = 0.88; p = 0.453), but the test for quality of elevations shows differences between age groups (F = 3.12; p = 0.0297). Similarly, for Model 2, Bartlett’s test of equality of variances does not reveal significant differences between the age groups (χ2 = 2.66; p = 0.447). The test of equality of slopes also does not reveal significant differences between the exponents (F = 1.48; p = 0.2245), but the test for quality of elevations shows differences between age groups (F = 4.51; p = 0.0054). Since the variances were homogeneous and the slopes were equal in Models 1 and 2, separate data analyses for each age group were not warranted. The models and their parameters are provided in Table 5 and Figure 3. Based on the model evaluation criteria (lowest RMSE and AIC), Model 1 is more appropriate than Model 2 for estimating highland bamboo AGB in the study areas:
where AGB is aboveground biomass, D is diameter at breast height, and H is plant height.
Table 5.
Comparison of age-specific biomass models (Model 1 and Model 2) using the R2 and RMSE.
Table 5.
Comparison of age-specific biomass models (Model 1 and Model 2) using the R2 and RMSE.
| Model * | Intercept | Slope | R2 | RMSE | AIC |
|---|---|---|---|---|---|
| 1 | −1.85 (−2.30, −1.41) | 2.22 (1.93, 2.50) | 0.723 | 0.208 | −288.0 |
| 2 | −2.90 (−3.49, −2.30) | 0.83 (0.72, 0.94) | 0.708 | 0.213 | −283.1 |
* The models were fitted after removing three outliers with standardized residuals > 2.
3.4. Bamboo Biomass and Carbon Stocks on Homestead and Natural Bamboo Stands
The distribution of biomass across different age groups in highland bamboo stands varies significantly between natural forests and homestead farms (Table 6). AGB is significantly higher in farmland bamboo stands compared to natural forest stands across age groups except for Age Group 4 (Figure 4). In the natural forest, AGB increases with age from 5.7 Mg ha⁻1 in Age Group 1 to 51.9 Mg ha⁻1 in Age Group 4, culminating in a total AGB of 92.33 Mg ha⁻1. Conversely, in farmland stands, younger age groups (Age Groups 1–3) have higher AGB values ranging from 33.2 Mg ha⁻1 to 41.4 Mg ha⁻1, but there is a sharp decline to 3.4 Mg ha⁻1 in Age Group 4, resulting in a total AGB of 118.28 Mg ha⁻1. We record a similar trend in BGB, with forest stands accumulating 1.1 Mg ha⁻1 in Age Group 1 and increasing to 10.4 Mg ha⁻1 in Age Group 4, contributing to a total BGB of 18.47 Mg ha⁻1. In farmland stands, BGB is higher in younger age groups, ranging from 6.6 Mg ha⁻1 (Age Group 1) to 8.3 Mg ha⁻1 (Age Group 3), but sharply declining to 0.7 Mg ha⁻1 in Age Group 4. The total BGB in farmland stands is 23.7 Mg ha⁻1, exceeding that of the forest stands (Table 6). The total highland bamboo biomass (AGB + BGB) in natural forest stands follows a continuous accumulation pattern, increasing from 6.8 Mg ha⁻1 (Age Group 1) to 62.3 Mg ha⁻1 (Age Group 4), resulting in a total of 110.79 Mg ha⁻1. In contrast, farmland stands exhibit a biomass peaking in younger age groups (reaching 49.7 Mg ha⁻1 in Age Group 3) before dramatically declining to 4.1 Mg ha⁻1 in Age Group 4. However, farmland stands still maintain a higher total biomass of 142.0 Mg ha⁻1 compared to natural forest stands.
Table 6.
Variation in aboveground, belowground, and total biomass carbon per age group in forest and farmland bamboo stands.
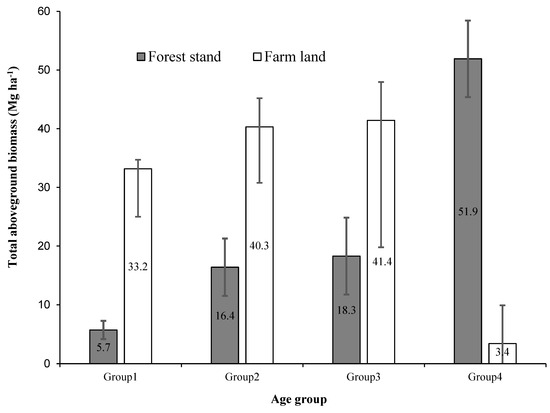
Figure 4.
Variation in total aboveground biomass (Mg ha−1) per age group in forest and farmland bamboo stands. The error bars represent the 95% confidence intervals.
The distribution of biomass carbon in highland bamboo varies between natural forests and farmland stands across different age groups (Table 7). AGB carbon (AGBC) is significantly higher in farmland compared to forest stands in younger age groups. In forests, AGBC increases progressively with age, from 2.7 Mg ha⁻1 (Age Group 1) to 24.4 Mg ha⁻1 (Age Group 4), leading to a total AGBC of 43.4 Mg ha⁻1. In contrast, farmland stands accumulate more AGBC in early stages, with values peaking at 19.5 Mg ha⁻1 (Age Group 3) before experiencing a sharp decline to 1.6 Mg ha⁻1 in Age Group 4. The total AGBC in farmland stands is 55.07 Mg ha⁻1, surpassing that of forest stands. A similar trend occurs in BGB carbon (BGBC). In forest stands, BGBC increases gradually from 0.5 Mg ha⁻1 (Age Group 1) to 4.9 Mg ha⁻1 (Age Group 4), contributing to a total of 8.7 Mg ha⁻1. In farmland stands, BGBC follows an early peak, reaching 3.9 Mg ha⁻1 in Age Group 3 before dropping to 0.3 Mg ha⁻1 in Age Group 4, resulting in a total BGBC of 11.1 Mg ha⁻1. Total biomass carbon (AGBC + BGBC) in forest stands steadily accumulates, increasing from 3.2 Mg ha⁻1 (Age Group 1) to 29.3 Mg ha⁻1 (Age Group 4), leading to an overall total of 52.07 Mg ha⁻1. Conversely, farmland stands show rapid carbon accumulation in younger age groups, peaking at 23.4 Mg ha⁻1 in Age Group 3 before declining sharply to 1.9 Mg ha⁻1 in Age Group 4, resulting in a total of 66.71 Mg ha⁻1 (Table 7).
Table 7.
Variation in aboveground, belowground, and total biomass carbon per age group in forest and farmland bamboo stands.
4. Discussion
4.1. Highland Bamboo Stand Characteristics
The present study revealed higher stand density, DBH, height, basal area, and biomass in homestead bamboo stands compared to bamboo stands in natural forests. The greater density in homestead stands suggests intensive management practices such as removal of older bamboo culms, mulching, watering, weeding, and soil loosening. On the other hand, bamboo stands in natural forests follow more self-sustaining growth influenced by ecological factors and anthropogenic pressures. Well-managed bamboo stands in homesteads had higher biomass, highlighting the role of farmers’ active cultivation and care. The culm density (per hectare) recorded in the study area was comparable or even higher than values reported so far for highland bamboo in Ethiopia (e.g., [12,30,49,50,51]). The average DBH observed in this study was lower than the reported values of highland bamboo in other studies in southwest Ethiopia [12,40,51], but greater than for Oxytenanthera abyssinica, the other indigenous bamboo species in Ethiopia [40,52,53].
Variations in the dry-to-fresh weight ratio of highland bamboo components indicated that as bamboo matures, the proportion of dry matter in both culms and foliage increases, with culms showing a more consistent trend. The relatively lower dry-to-fresh weight ratio in branches and leaves suggests higher moisture content, which may influence drying and utilization processes for different bamboo products. This provides useful insights for bamboo management, particularly in estimating dry biomass yields and optimizing harvesting strategies for different age classes.
4.2. Allometric Scaling, Biomass, and Carbon Stock Potential
By optimizing the Power law model with various regression techniques, we effectively captured the H–D relationship, demonstrating allometric scaling between culm height and stem diameter in highland bamboo. This finding aligns with previous studies [30] and provides valuable insights for improving bamboo growth modeling and forest management strategies. The Chapman–Richards, Weibull, Monomolecular, Gompertz, Richards, and Logistic (3-p) models failed to produce parameter estimates, apparently due to overparameterization relative to the available data and the small variability in height. The limitation of these non-linear models is that their parameters are computed using asymptotic formulae. The Levenberg—Marquardt–Nash algorithm used for estimating the parameters of these models takes large, uncontrolled steps and fails to converge unless the starting values are very good. Therefore, we recommend the use of simpler models such as the Power law model. In this analysis, we have not explored mixed-effects modeling given the small and more uniform stands. In situations where plot characteristics are expected to vary widely, we recommend the use of plots as the rand variable in mixed effects models. The Power law model (Model 1) was also more appropriate than Model 2 for estimating highland bamboo AGB in the study area. This is consistent with findings from other parts of Ethiopia on highland bamboo [30]. Our findings also suggest that volume (Model 2) provides more accurate biomass predictions than diameter (D) or height (H) alone (Model 1).
This study established that AGB and biomass carbon stocks are higher in bamboo stands on homesteads than in natural forest stands. This may be due to higher stand density, particularly in Age Groups 1–3, which benefit from improved stand management by farmers. The exception was in Age Group 4, where the reverse was true. This is likely to indicate that bamboo stands in the natural forest are dominated by large, mature culms and low recruitment. AGB in Age Group 4 was lower in bamboo stands on homesteads than in forest stands. This is probably because culms are harvested in the first 3–5 years of bamboo growth [54]. The low biomass in Age Group 4 reflects frequent removal of mature culms for commercial purposes. Taken together, the results suggest that bamboo on farmland accumulates biomass more rapidly during early growth. In contrast, forest stands exhibit a more gradual and continuous biomass accumulation. These findings highlight the trade-off between biomass productivity and sustainability in managed versus natural bamboo ecosystems, providing insights for optimizing bamboo cultivation and carbon sequestration strategies.
The AGBC stocks recorded in this study are comparable to values reported for highland bamboo in other parts of Ethiopia and elsewhere in Africa [2,12,30]. For example, Yebeyen et al. [30] estimated aboveground and belowground biomass carbon stocks at 43.7 Mg ha−1 and 8.7 Mg ha−1 in highland bamboo in southwestern Ethiopia. Elsewhere in Ethiopia and in Kenya, highland bamboo was reported to store 68.4 Mg ha−1 in AGBC and 12.8 Mg ha−1 in BGBC [2,12]. According to a global review, plausible carbon storage in bamboo ranges from 16 to 128 Mg ha−1 in AGB and from 8 to 64 Mg ha−1 in BGB [2]. The total biomass carbon stock recorded in this study (52–67 Mg ha−1) is also comparable to values reported for highland bamboo in southwestern Ethiopia [30]. In addition to biomass, bamboo stores significant amounts of soil organic carbon. For example, in southwestern Ethiopia, highland bamboo stands were previously reported to store 263–581.5 Mg C ha−1, with an average value of 388.1 Mg C ha−1 [30].
4.3. Opportunities for Climate Change Mitigation
Bamboo rapidly colonizes degraded lands, demonstrating adaptability and nutrient conservation [55,56]. The plant’s dense root network stabilizes soil, preventing erosion and landslides, particularly in steep and degraded areas. Additionally, bamboo improves soil fertility by increasing organic matter content and promoting microbial activity [55]. It also plays a crucial role in regulating water cycles by enhancing soil permeability and reducing surface runoff.
The results of the present study have demonstrated the high potential of bamboo stands to sequester carbon and mitigate climate change. Unlike traditional plantation forestry, loss of bamboo biomass carbon due to harvesting is balanced by the production of new culms in each stand every year [57]. Bamboo also produces a stable form of carbon known as phytolith-occluded carbon, which results from decomposing vegetation [58]. Phytolith-occluded carbon is highly resistant to decomposition and remains in the soil for several thousand years. In addition, harvested bamboo is often used to produce durable products such as furniture, flooring, and construction materials, which results in the long-term storage of carbon [5,58]. This highlights the potential role of bamboo in the long-term sequestration of carbon to mitigate climate change. It is a highly effective renewable and sustainable carbon sink and landscape restoration plant, contributing to climate change mitigation by absorbing significant amounts of carbon dioxide, reducing pressure on natural forests through the provisioning of ecosystem services, and strengthening climate resilience by improving microclimates and water retention. Bamboo’s full potential can be harnessed for both ecological and economic benefits in current development scenarios to achieve broader socioeconomic development goals, climate change mitigation, and environmental sustainability [59].
5. Conclusions and Recommendations
This study developed species-specific allometric equations using diameter and height as two parameters for quantification of aboveground biomass and carbon. Specifically, different predictive models such as the Exponential model, Logistic (3-parameter) model, Gompertz model, Hyperbolic model, and Power law model were developed. The study concludes that the Exponential (2-parameter) model performed best, with high accuracy and efficiency. Comparison of the two species-specific biomass equations, one utilizing diameter alone and the other incorporating both diameter and height, demonstrates that diameter alone is a more effective predictor. This is supported by a higher coefficient of determination (R2), along with lower values of root mean square error (RMSE) and Akaike information criterion (AIC). Hence, DBH is a better predictor of biomass and aboveground carbon. This species-specific allometric equations will aid in enhancing the accuracy of aboveground biomass prediction in bamboo forests and farms in Ethiopia and also in highland bamboo (Oldeania alpina) forests and farms in the rift valley regions of Africa, where the species is predominantly found.
This study has also provided novel insights into the variations in stand structure–age composition (Years 1, 2, 3, and 4+) of highland bamboo in forests and farms in the Sidama Region, Ethiopia. This study demonstrated that the stand structure of bamboo farms compared to bamboo forests is better for optimal clump productivity and carbon sequestration due to fewer older bamboo poles (above Age 3) which eventually deteriorate, decay and release carbon. Further, the study demonstrates that the aboveground biomass of bamboo in farmlands that are managed and regularly harvested is higher compared to natural forest stands. Effective silvicultural management of bamboo stands in both forests and farmlands is key to maximizing bamboo biomass production and supporting the development of diverse bamboo-based products.
Integrating highland bamboo into development initiatives like sustainable land management, watershed development, enterprise promotion, and REDD+ is crucial for encouraging communities to effectively use bamboo for their livelihood and economic development as well as using it as a tool for climate change mitigation and building the resilience of communities. Based on our findings, we propose the following recommendations to enhance the management and utilization of highland bamboo for effective climate change mitigation and adaptation: (a) Implement silvicultural practices in natural highland bamboo forests to enhance the recruitment of new culms and biomass accumulation as well as improving the health of bamboo forests; and (b) conduct further studies on soil carbon storage in highland bamboo forests to gain a comprehensive understanding of bamboo’s carbon sequestration potential.
Author Contributions
Conceptualization, D.Y.B. and J.D.; Methodology, D.Y.B. and G.W.S.; Formal analysis, G.W.S.; Investigation, D.Y.B., M.A.C., F.H.D. and K.T.W.; Writing—original draft, D.Y.B.; Writing—review & editing, J.D., G.W.S., Y.S.R., B.G. and S.R. All authors have read and agreed to the published version of the manuscript.
Funding
This research was funded by the International Bamboo and Rattan Organization (INBAR) through the Spanish Agency for International Development Cooperation (AECID) project “Building Circular Economy and Climate Change Resilience through Bamboo Supply Chain Development in Ethiopia”, and the APC was funded by INBAR.
Data Availability Statement
Data are contained within the article.
Conflicts of Interest
The authors declare no conflict of interest.
References
- Seethalakshmi, K.K.; Kumar, M.S.M. Bamboos of India—A Compendium; Kerala Forest Research Institute and International Network for Bamboo and Rattan: New Delhi, India, 1998. [Google Scholar]
- Yuen, J.Q.; Fung, T.; Ziegler, A.D. Carbon stocks in bamboo ecosystems worldwide: Estimates and uncertainties. For. Ecol. Manag. 2017, 393, 113–138. [Google Scholar] [CrossRef]
- IPCC. Climate Change and Land: An IPCC Special Report on Climate Change, Desertification, Land Degradation, Sustainable Land Management, Food Security, and Greenhouse Gas Fluxes in Terrestrial Ecosystems; Intergovernmental Panel on Climate Change: Geneva, Switzerland, 2019. [Google Scholar]
- Kaushal, R.; Subbulakshmi, V.; Tomar, J.; Alam, N.; Jayaparkash, J.; Mehta, H.; Chaturvedi, O. Predictive models for biomass and carbon stock estimation in male bamboo (Dendrocalamus strictus L.) in Doon valley, India. Acta Ecol. Sin. 2016, 36, 469–476. [Google Scholar] [CrossRef]
- Song, X.; Zhou, G.; Jiang, H.; Yu, S.; Fu, J.; Li, W.; Wang, W.; Ma, Z.; Peng, C. Carbon sequestration by Chinese bamboo forests and their ecological benefits: Assessment of potential, problems, and future challenges. Environ. Rev. 2011, 19, 418–428. [Google Scholar] [CrossRef]
- Huy, B.; Long, T. A Manual for Bamboo Forest Biomass and Carbon Assessment; International Bamboo and Rattan Organization: Beijing, China, 2019. [Google Scholar]
- Lugt, P.V.; King, C. Bamboo in the Circular Economy: Potential of Bamboo in Zero-Waste Low–Carbon Future; INBAR Policy Synthesis Report 6; INBAR: Beijing, China, 2019. [Google Scholar]
- King, C.; Lugt, P.V.; Long, T.T.; Yanxia, L. Integration of Bamboo Forestry in Carbon Markets; INBAR Policy Brief; INBAR: Beijing, China, 2021. [Google Scholar]
- Bahru, T.; Ding, Y. A review on bamboo resource in the African region: A call for special focus and action. Int. J. For. Res. 2021, 2021, 8835673. [Google Scholar] [CrossRef]
- Lobovikov, M.; Paudel, S.; Piazza, M.; Ren, H.; Wu, J. World Bamboo Resources: A Thematic Study Prepared in the Framework of the Global Forest Resources Assessment 2005; FAO Forestry Paper 147; FAO: Rome, Italy, 2007. [Google Scholar]
- Embaye, K. The indigenous bamboo forests of Ethiopia: An overview. Ambio 2000, 29, 518–521. [Google Scholar] [CrossRef]
- Embaye, K.; Weih, M.; Ledin, S.; Christersson, L. Biomass and nutrient distribution in a highland bamboo forest in southwest Ethiopia: Implications for management. For. Ecol. Manag. 2005, 204, 159–169. [Google Scholar] [CrossRef]
- Vorontsova, M.S.; Clark, L.G.; Dransfield, J.; Govaerts, R.; Baker, W.J. World Checklist of Bamboo and Rattan; INBAR and Kew Botanic Gardens, Kew: Beijing, China, 2016. [Google Scholar]
- FAO. Global Forest Resources Assessment 2020: Main Report; FAO: Rome, Italy, 2020. [Google Scholar] [CrossRef]
- Yiping, L.; Yanxia, L.; Buckingham, K.; Henley, G.; Guomo, Z. Bamboo and Climate Change Mitigation: A Comparative Analysis of Carbon Sequestration; International Network for Bamboo and Rattan: Beijing, China, 2010. [Google Scholar]
- Camargo, G.J.C.; Arango, A.M.; Trinh, L. The potential of bamboo forests as a carbon sink and allometric equations for estimating their aboveground biomass. Environ. Dev. Sustain. 2024, 26, 20159–20187. [Google Scholar] [CrossRef]
- Inoue, A.; Miyazawa, Y.; Sato, M.; Shima, H. Allometric Equations for Predicting Culm Surface Area of Three Bamboo Species (Phyllostachys spp.). Forests 2018, 9, 295. [Google Scholar] [CrossRef]
- Nath, A.J.; Das, G.; Das, A.K. Above ground standing biomass and carbon storage in village bamboos in North East India. Biomass Bioenergy 2009, 33, 1188–1196. [Google Scholar] [CrossRef]
- Nath, A.J.; Das, A.K. Carbon pool and sequestration potential of village bamboos in the agroforestry system of northeast India. Trop. Ecol. 2012, 53, 287–293. [Google Scholar]
- Nath, A.J.; Lal, R.; Das, A.K. Managing woody bamboos for carbon farming and carbon trading. Glob. Ecol. Conserv. 2015, 3, 654–663. [Google Scholar] [CrossRef]
- Li, L.; Lin, Y.J.; Yen, T.M. Using allometric models to predict the aboveground biomass of thorny bamboo (Bambusa stenostachya) and estimate its carbon storage. Taiwan J. For. Sci. 2016, 31, 37–47. [Google Scholar]
- Li, P.; Zhou, G.; Du, H.; Lu, D.; Mo, L.; Xu, X.; Shi, Y.; Zhou, Y. Current and potential carbon stocks in Moso bamboo forests in China. J. Environ. Manag. 2015, 156, 89–96. [Google Scholar] [CrossRef]
- Lv, Y.; Han, N.; Du, H. Estimation of Bamboo Forest Aboveground Carbon Using the RGLM Model Based on Object-Based Multiscale Segmentation of SPOT-6 Imagery. Remote Sens. 2023, 15, 2566. [Google Scholar] [CrossRef]
- Shanmughavel, P.; Francis, K. Above ground biomass production and nutrient distribution in growing bamboo (Bambusa bambos (L.) Voss). Biomass Bioenergy 1996, 10, 383–391. [Google Scholar] [CrossRef]
- Thokchom, A.; Yadava, P.S. Biomass, carbon stock and sequestration potential of Schizostachyum pergracile bamboo forest of Manipur, north east India. Trop. Ecol. 2017, 58, 23–32. [Google Scholar]
- Xayalath, S.; Hirota, I.; Tomita, S.; Nakagawa, M. Allometric equations for estimating the aboveground biomass of bamboos in northern Laos. J. For. Res. 2019, 24, 115–119. [Google Scholar] [CrossRef]
- Xu, M.; Ji, H.; Zhuang, S. Carbon stock of Moso bamboo (Phyllostachys pubescens) forests along a latitude gradient in the subtropical region of China. PLoS ONE 2018, 13, e0193024. [Google Scholar] [CrossRef]
- Zhuang, S.; Ji, H.; Zhang, H.; Sun, B. Carbon storage estimation of Moso bamboo (Phyllostachys pubescens) forest stands in Fujian, China. Trop. Ecol. 2015, 56, 383–391. [Google Scholar]
- INBAR. The Climate Change Challenge and Bamboo: Mitigation and Adaptation; Working Paper 65; International Bamboo and Rattan Organization: Beijing, China, 2011. [Google Scholar]
- Yebeyen, D.; Nemomissa, S.; Sileshi, G.W.; Zewdie, W.; Hailu, B.T.; Rodríguez, R.L.; Desalegne, F.H.; Woldie, T.M. Allometric scaling, biomass accumulation and carbon stocks in natural highland bamboo (Oldeania alpina (K. Schum.) Stapleton) stands in Southwestern Ethiopia. Carbon Manag. 2022, 13, 482–496. [Google Scholar] [CrossRef]
- FAO. Global Forest Resources Assessment 2020—Ethiopia; Food and Agriculture Organization of the United Nations: Rome, Italy, 2020. [Google Scholar]
- INBAR. Remote Sensing Based Regional Bamboo Resource Assessment Report of Ethiopia, Kenya and Uganda; INBAR: Beijing, China, 2018. [Google Scholar]
- Kidane, B.; Anjulo, A.; Mulatu, Y.; Reza, S.; Getahun, A.; Mulat, S.; Teshome, U.; Abere, M. Species site matching of highland bamboo (Oldeania alpina) in Ethiopia. Heliyon 2023, 9, e13593. [Google Scholar] [CrossRef] [PubMed]
- Mulatu, Y.; Fetene, M. The effect of silvicultural management on regeneration, growth and yield of Arundinaria alpina (highland bamboo) at Choke Mountain, East Gojam, Northwest Ethiopia. Ethiop. J. Agric. Sci. 2013, 23, 11–27. [Google Scholar]
- Desalegn, G.; Tadesse, W. Resource potential of bamboo, challenges and future directions towards sustainable management and utilization in Ethiopia. For. Syst. 2014, 23, 294–299. [Google Scholar] [CrossRef]
- Chazdon, R.L. Beyond Deforestation: Restoring Forests and ecosystem Services on Degraded Lands. Science 2008, 320, 1458–1460. [Google Scholar] [CrossRef]
- FAO. FAO’s Work on Climate Change. United Nations Climate Change Conference 2018; Food and Agricultural Organization of the United Nations: Katowice, Poland, 2018. [Google Scholar]
- Xu, L.; Shi, Y.; Zhou, G.; Xu, X.; Liu, E.; Zhou, Y.; Zhang, F.; Li, C.; Fang, H.; Chen, L. Structural development and carbon dynamics of Moso bamboo forests in Zhejiang Province, China. For. Ecol. Manag. 2018, 409, 479–488. [Google Scholar] [CrossRef]
- Al Kafy, A.; Saha, M.; Fattah, M.A.; Rahman, M.T.; Duti, B.M.; Rahaman, Z.A.; Bakshi, A.; Kalaivani, S.; Rahaman, S.N.; Sattar, G.S. Integrating forest cover change and carbon storage dynamics: Leveraging Google Earth Engine and InVEST model to inform conservation in hilly regions. Ecol. Indic. 2023, 152, 110374. [Google Scholar] [CrossRef]
- Abebe, S.; Gebeyehu, G.; Teketay, D.; Long, T.T.; Jayaraman, D. Allometric models for estimating biomass storage and carbon stock potential of Oldeania alpina (K. Schum.) Stapleton forests of south-western Ethiopia. Adv. Bamboo Sci. 2023, 2, 100008. [Google Scholar] [CrossRef]
- Girma, T.; Beyene, S.; Biazin, B. Effect of organic and inorganic fertilizer application on soil phosphorous balance and phosphorous uptake and use efficiency of potato in Arbegona District, Southern Ethiopia. J. Fertil. Pestic. 2017, 8, 185. [Google Scholar] [CrossRef]
- Yona, Y.; Matewos, T.; Sime, G. Analysis of rainfall and temperature variabilities in Sidama regional state, Ethiopia. Heliyon 2024, 10, e28184. [Google Scholar] [CrossRef]
- CSA. Summary and Statistical Report of the 2007 Population and Housing Census of Ethiopia; Central Statistical Agency: Addis Ababa, Ethiopia, 2008.
- Singnar, P.; Sileshi, G.W.; Nath, A.; Nath, A.J.; Das, A.K. Modelling the scaling of belowground biomass with aboveground biomass in tropical bamboos. Trees For. People 2021, 3, 100054. [Google Scholar] [CrossRef]
- Singnar, P.; Das, M.C.; Sileshi, G.W.; Brahma, B.; Nath, A.J.; Das, A.K. Allometric scaling, biomass accumulation and carbon stocks in different aged stands of thin-walled bamboos Schizostachyum dullooa, Pseudostachyum polymorphum and Melocanna baccifera. For. Ecol. Manag. 2017, 395, 81–91. [Google Scholar] [CrossRef]
- Sileshi, G.W. A critical review of forest biomass estimation models, common mistakes and corrective measures. For. Ecol. Manag. 2014, 329, 237–254. [Google Scholar] [CrossRef]
- Eggleston, H.S.; Buendia, L.; Miwa, K.; Ngara, T.; Tanabe, K. (Eds.) IPCC Guidelines for National Greenhouse Gas Inventories; Intergovernmental Panel on Climate Change: Geneva, Switzerland, 2006; Volume 4. [Google Scholar]
- Meragiaw, M.; Woldu, Z.; Martinsen, V.; Singh, B.R. Carbon stocks of above-and belowground tree biomass in Kibate Forest around Wonchi Crater Lake, Central Highland of Ethiopia. PLoS ONE 2021, 16, e0254231. [Google Scholar] [CrossRef] [PubMed]
- Mulatu, Y. Growth, Morphology and Biomass of Arundinaria alpina (Highland Bamboo) (Poaceae) as Affected by Landrace, Environment and Silvicultural Management in the Choke Mountain, Northwestern Ethiopia. Ph.D. Dissertation, Addis Ababa University, Addis Ababa, Ethiopia, 2012. [Google Scholar]
- Nigatu, A.; Wondie, M.; Alemu, A.; Gebeyehu, D.; Workagegnehu, H. Productivity of highland bamboo (Yushania alpina) across different plantation niches in West Amhara, Ethiopia. For. Sci. Technol. 2020, 16, 116–122. [Google Scholar] [CrossRef]
- Teshoma, U. Carbon storage potential of Ethiopian highland bamboo (Arundinaria alpina (K. schum): A case study of Adiyo woreda, South West Ethiopia. Int. J. Environ. Sci. Nat. Res. 2019, 16, 109–119. [Google Scholar] [CrossRef]
- Gurmessa, F.; Gemechu, T.; Soromessa, T.; Kelbessa, E. Allometric equations to estimate the biomass of Oxytenanthera abyssinica (A. Rich.) Munro. (Ethiopian lowland bamboo) in Dicho Forest, Oromia Region, Western Ethiopia. Int. J. Res. Stud. Biosci. 2016, 4, 33–48. [Google Scholar]
- Darcha, G.; Birhane, E. Biomass and carbon sequestration potential of Oxytenanthera abyssinica in the homestead agroforestry system of Tigray, Ethiopia. J. Nat. Sci. Res. 2015, 5, 69–77. [Google Scholar]
- Durai, J.; Long, T.T. Manual for Sustainable Management of Clumping Bamboo; INBAR Technical Report 41; International Bamboo and Rattan Organization: Beijing, China, 2020. [Google Scholar]
- Mishra, G.; Giri, K.; Panday, S.; Kumar, R.; Bisht, N.S. Bamboo: Potential resource for eco-restoration of degraded lands. J. Biol. Earth Sci. 2014, 4, B130–B136. [Google Scholar]
- Peprah, T.; Essien, C.; Owusu-Afriyie, K.; Foli, E.G.; Govina, J.; Oteng-Amoako, A.A. Exploring the Use of Bamboo for Accelerated Reclamation of Degraded Mined Sites in Ghana. J. Bamboo Ratt. 2014, 13, 55–66. [Google Scholar]
- Nath, A.J.; Das, A.K. Carbon storage and sequestration in bamboo-based smallholder homegardens of Barak Valley, Assam. Curr. Sci. 2011, 100, 229–233. [Google Scholar]
- Huang, Z.T.; Jiang, P.K.; Chang, S.X.; Zhang, Y.; Ying, Y.Q. Production of carbon occluded in phytolith is season-dependent in a bamboo forest in subtropical China. PLoS ONE 2014, 9, e106843. [Google Scholar] [CrossRef] [PubMed]
- Silie, G.; Rawat, Y.S.; Nebiyu, M.; Bachheti, R.K.; Kelemwork, S. The effects of age and height on the physical properties of Bambusa vulgaris var. Green in Chagni, Northwest Ethiopia. J. Indian Acad. Wood Sci. 2024, 21, 88–99. [Google Scholar] [CrossRef]


Disclaimer/Publisher’s Note: The statements, opinions and data contained in all publications are solely those of the individual author(s) and contributor(s) and not of MDPI and/or the editor(s). MDPI and/or the editor(s) disclaim responsibility for any injury to people or property resulting from any ideas, methods, instructions or products referred to in the content. |
© 2025 by the authors. Licensee MDPI, Basel, Switzerland. This article is an open access article distributed under the terms and conditions of the Creative Commons Attribution (CC BY) license (https://creativecommons.org/licenses/by/4.0/).