Article

Moisture-Dependent Transverse Isotropic Elastic Constants of Wood S2 Secondary Cell Wall Layers Determined Using Nanoindentation

1
Department of Materials Science and Engineering, University of Wisconsin—Madison, 1509 University Avenue, Madison, WI 53706, USA
2
Forest Biopolymers Science and Engineering, Forest Products Laboratory, USDA Forest Service, One Gifford Pinchot Drive, Madison, WI 53726, USA
3
Department of Mechanical Engineering, University of Wisconsin—Madison, 1513 University Avenue, Madison, WI 53706, USA
*
Author to whom correspondence should be addressed.
Forests 2025, 16(5), 712; https://doi.org/10.3390/f16050712
Submission received: 13 March 2025 / Revised: 12 April 2025 / Accepted: 18 April 2025 / Published: 22 April 2025
(This article belongs to the Special Issue Wood Quality and Mechanical Properties: 2nd Edition)

Abstract

:
Moisture- and orientation-dependent mechanical properties of the S2 secondary cell wall layer are needed to better understand wood mechanical properties and advance wood utilization. In this work, nanoindentation was used to assess the orientation-dependent elastic moduli and Meyer hardness of the loblolly pine (Pinus taeda) S2 layer under environmental conditions ranging from 0% to 94% relative humidity (RH). The elastic moduli were fit to a theoretical transverse isotropic elasticity model to calculate the longitudinal elastic modulus, transverse elastic modulus, axial shear modulus, and transverse shear modulus for the S2 layer at 0%, 33%, 75%, and 94% RH and 26 °C. The longitudinal elastic modulus was consistently higher than the transverse elastic modulus because of the orientation of the stiff cellulose microfibrils in the S2 layer. The axial shear modulus was consistently higher than the transverse shear modulus. The Meyer hardness had a much smaller orientation dependence than the elastic properties. Moisture generally plasticized the S2 layer. Over the range of RH tested, the longitudinal elastic modulus decreased by 30%, the transverse elastic modulus and transverse shear modulus decreased by 83%, the axial shear modulus did not have an observable trend with RH, and the hardness decreased by 68% to 82% with the hardness in the longitudinal direction softening less than in the transverse direction.

1. Introduction

As a multiscale cellular material, the mechanical properties of wood derive from the properties and organization of its smaller-scale components [1,2]. Within a wood cell wall, the S2 secondary cell wall layer is the thickest (Figure 1), and its properties often have a dominating influence on bulk wood properties [2]. The S2 layer is a nanofiber-reinforced composite with stiff cellulose fibrils oriented parallel to each other and helically embedded in a more compliant matrix of amorphous cellulose, hemicelluloses, and lignin [2,3]. The angle between the longitudinal axis of the fibrils and the longitudinal axis of the wood cell is called the microfibril angle (MFA). Because of the orientation of the cellulose fibrils, the elastic properties of the S2 layer are anisotropic, and the longitudinal stiffness in the direction along the fibrils is much higher than the transverse stiffness in the direction perpendicular to the fibrils [4,5,6].
A thorough characterization of the S2 layer mechanical properties, especially their dependence on moisture, is a prerequisite for improving our understanding of wood mechanical properties [1,2]. Wood is a hygroscopic material, and absorbed water generally has a plasticizing effect. Mechanical properties of bulk wood [8,9] as well as the S2 layer [10,11,12,13,14] are strongly moisture-dependent, with a general trend of decreasing properties with increasing moisture. A better understanding of mechanical properties would also advance wood utilization. For example, although bulk wood is widely used in engineering applications because of its exceptional strength-to-weight ratio [15], many modern wood-based structural materials are often composites with multiple pieces of wood bonded together by adhesives [16]. Efforts to improve wood-adhesive bondlines and their moisture durability would be accelerated by an improved understanding of the S2 layer mechanical properties in the cells nearest to the bondlines. Additionally, wood modifications that aim to improve resistance to fungal degradation in high moisture conditions, such as thermal treatments [17], also tend to embrittle wood, which can limit the structural utility of the modified wood. The development of better wood modifications would also be accelerated by an improved understanding of the wood S2 layer’s mechanical properties.
The S2 layer must be tested in multiple directions to characterize its anisotropic elastic properties. Jäger and coworkers [18,19] identified nanoindentation as the only method available to experimentally determine the S2 layer anisotropic elastic constants. In a nanoindentation experiment, a carefully shaped probe is pressed into a material following a prescribed loading protocol. The resulting load-depth trace is then used to determine mechanical properties like elastic modulus and hardness [20]. Jäger and coworkers used Berkovich probe nanoindentation experiments and a theoretical model developed by Vlassak and coworkers [21]. This model provides relationships between measured nanoindentation moduli, indentation direction relative to the longitudinal axes of the cellulose fibrils, and the S2 layer anisotropic elastic constants. Jäger and coworkers assumed that the anisotropy of the S2 layer elastic properties could be approximated by transverse isotropy, in which the axis of rotational symmetry is parallel to the longitudinal axes of the cellulose fibrils. A transverse isotropic elastic solid is described by five independent elastic constants, such as the longitudinal elastic modulus, the transverse elastic modulus, the axial shear modulus, and two Poisson’s ratios. To determine the S2 layer transverse isotropic elastic constants, Jäger and coworkers [18,19] first experimentally measured nanoindentation elastic moduli across the full range of indentation directions relative to the cellulose fibrils. Then, they made the simplifying assumption of setting both Poisson’s ratios equal to 0.3. Finally, an error minimization procedure was employed to fit the nanoindentation elastic moduli to the Vlassak and coworkers’ model to calculate the longitudinal elastic modulus, transverse elastic modulus, and axial shear modulus.
Jäger and coworkers [18,19] tested under an unreported humidity condition, and furthermore embedded their wood samples with a low-viscosity epoxy to facilitate sample preparation. Epoxy embedment has been shown to affect the mechanical properties of wood cell walls tested with nanoindentation [22,23]. Nanoindentation experiments on wood can also be performed under humidity control [12]. In this work, we build upon the previous work of Jäger and coworkers [18,19] to experimentally determine the moisture-dependent transverse isotropic elastic material parameters for the S2 layer in unembedded wood over the hygroscopic relative humidity (RH) range of 0% to 94%. The Meyer hardness across all orientations and RH conditions was also measured. These nanoindentation experiments are part of a larger study on how moisture affects the mechanical and volumetric swelling properties of wood cell walls. In recent studies on wood from the same growth ring studied in this work, the moisture-dependent free volume was characterized using positron annihilation loss spectroscopy (PALS) [24], and the moisture swelling of the cell wall and cellular structures were studied with micro-X-ray-computed tomography (µXCT) [25]. Therefore, the materials and RH conditions were chosen to match those of the other experiments that are being performed in the larger study.

2. Materials and Methods

2.1. Materials

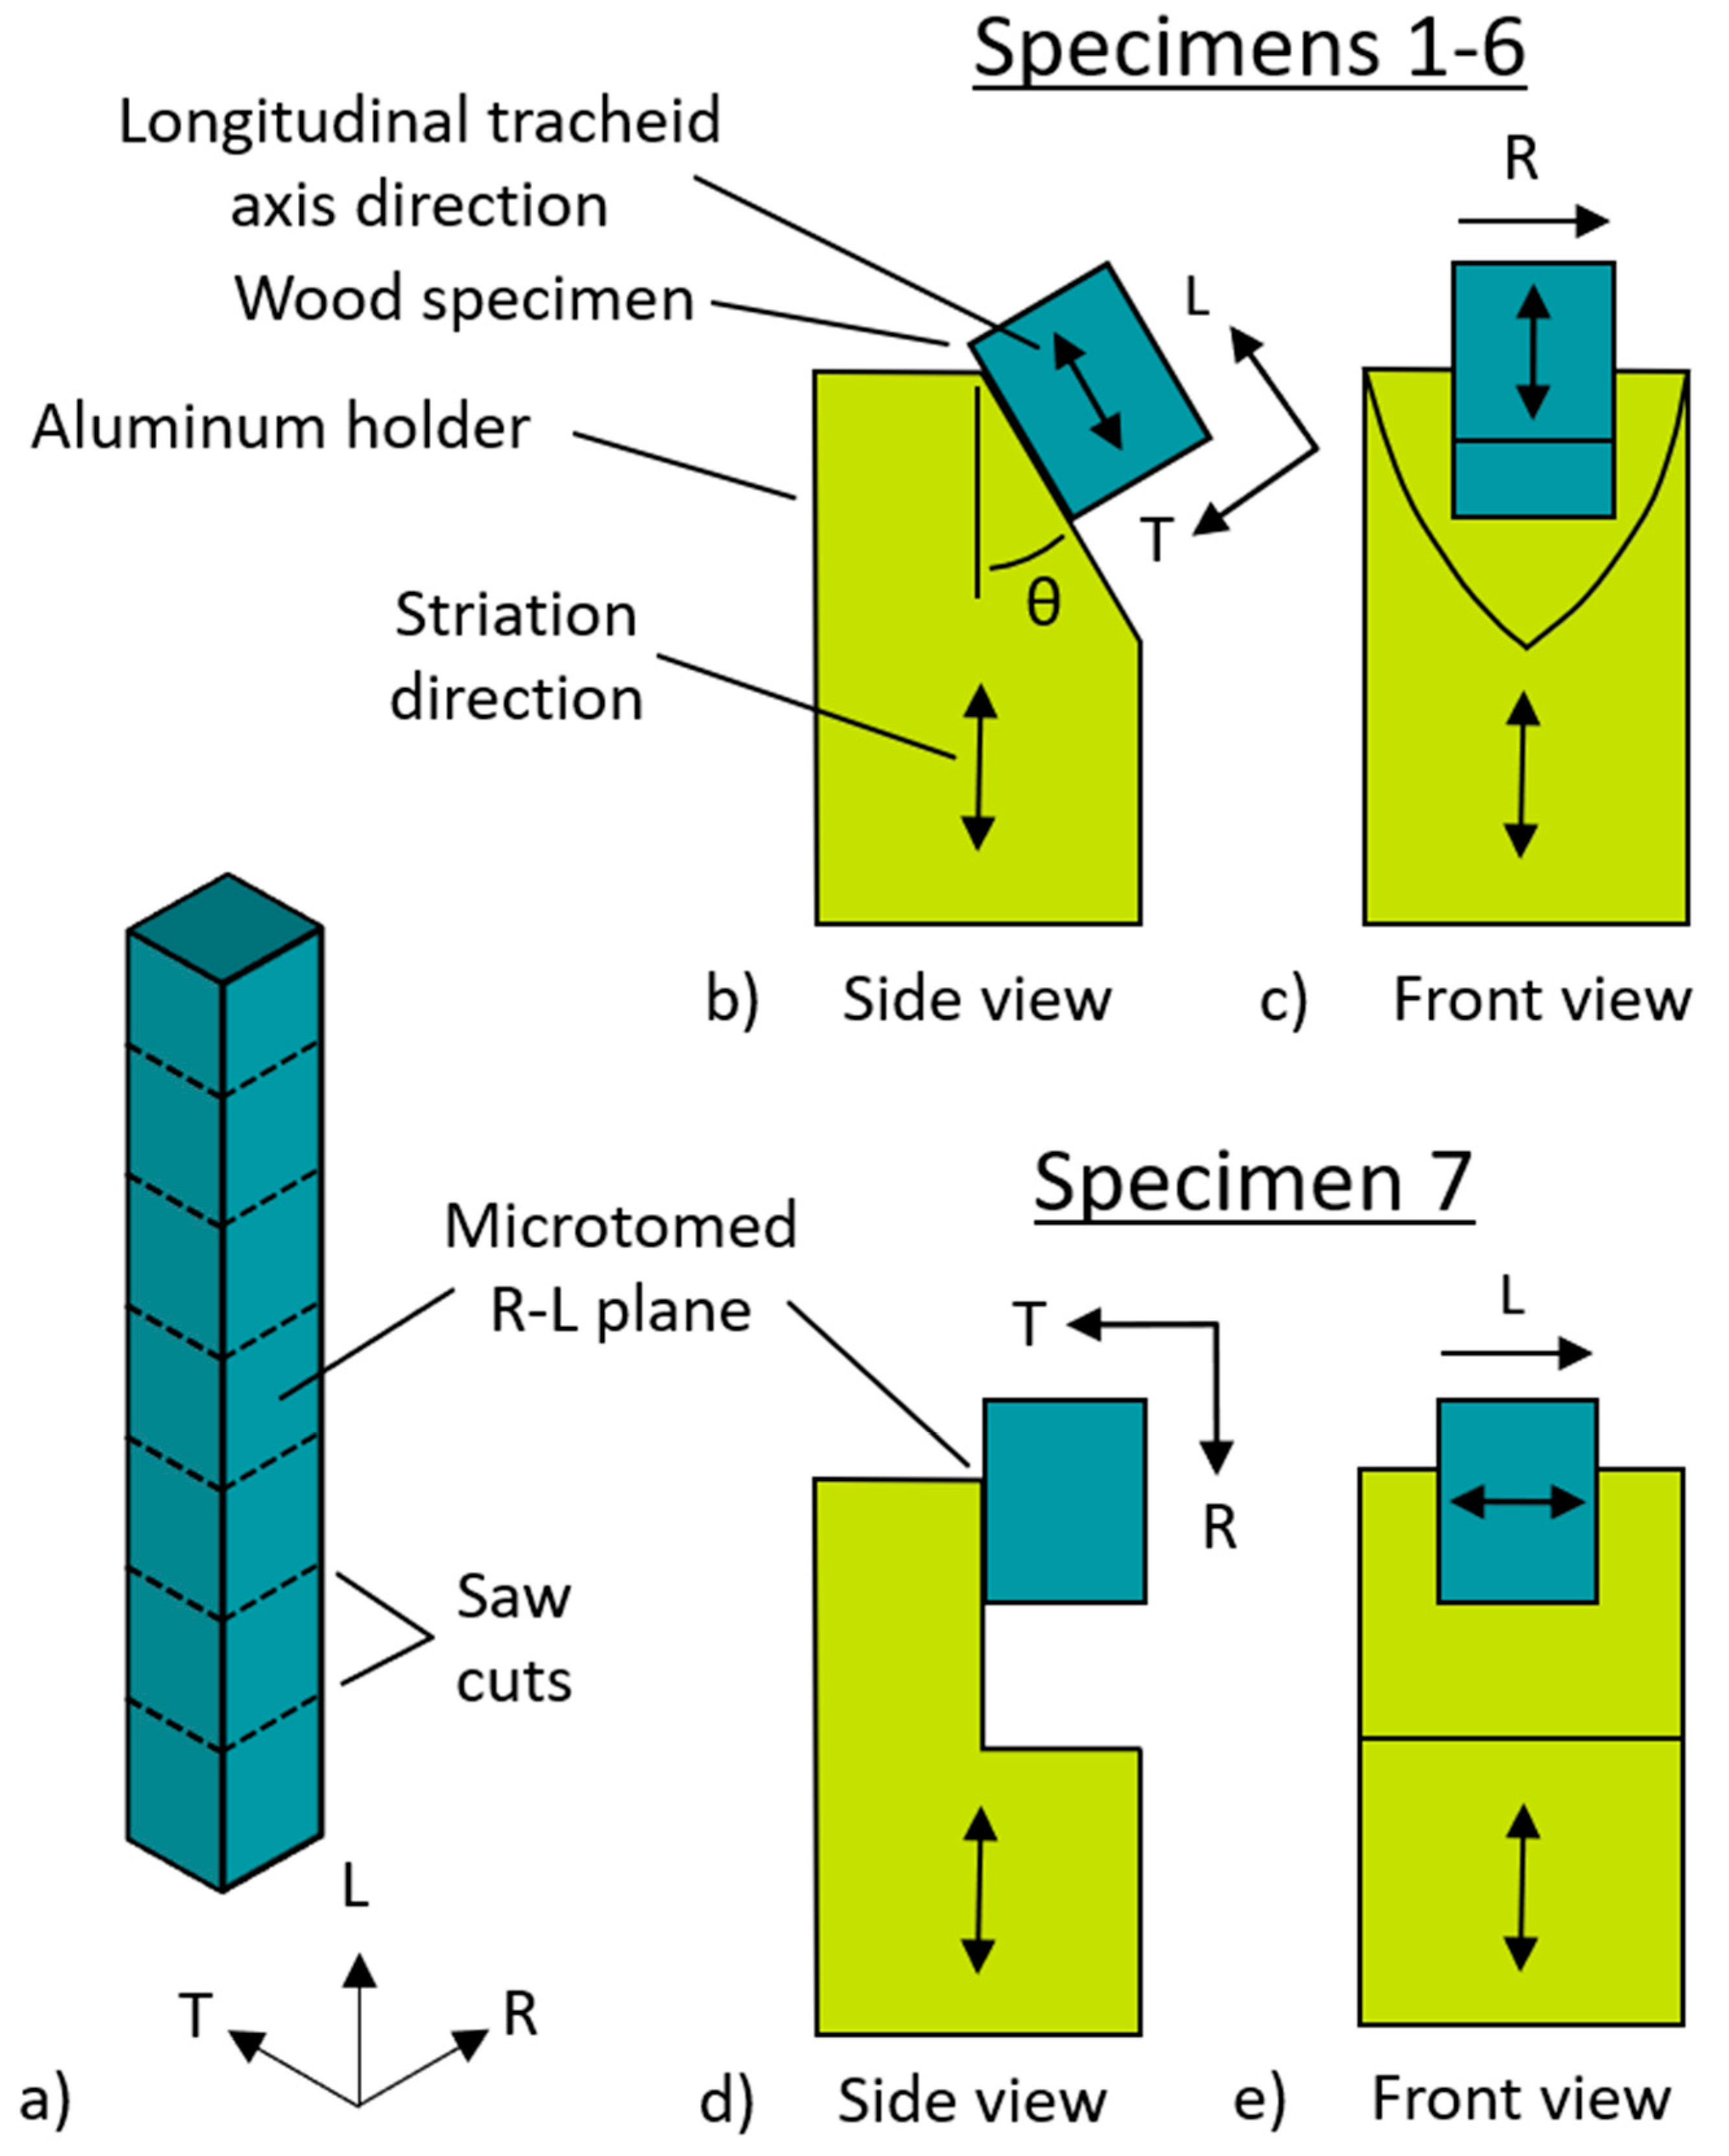
The angle between the nanoindentation direction and the longitudinal axes of the cellulose microfibrils is termed δ. The experimental nanoindentation data needed to calculate the S2 layer transverse isotropic elasticity tensor required performing experiments over a wide range of δ. For this purpose, a series of latewood loblolly pine (Pinus taeda) specimens were prepared from a single growth ring. Latewood was chosen because of its thicker S2 layer. The loblolly pine was obtained from a sawmill in Shagualak, MS, USA, as a kiln-dried board measuring 3.8 cm thick, 28.6 cm wide, and 4.88 m long. A 2.5 cm long piece of the board was cut, and a growth ring without compression wood, approximately 17 cm from the pith, was chosen. From this cut piece of wood, a section of latewood about 3 mm in the radial direction and 15 mm in the tangential direction was removed using a chisel. The latewood section was then fit into a sliding microtome equipped with a disposable blade, and a smooth radial-longitudinal surface was prepared on one face. After reducing the piece to about 3 mm in the tangential direction, it was cut into seven pieces along the wood’s longitudinal direction (Figure 2a) using a fine-tooth saw and a small miter box. Aluminum cylinders (9.5 mm diameter, 16 mm long) were machined such that one end had a surface with angle θ = 0°, 11°, 22.5°, 45°, 67.5°, or 79° with respect to the longitudinal axis of the cylinder (Figure 2b). A thin layer of five-minute epoxy was then used to adhere the microtomed radial-longitudinal surface to the angled cylinder face. For specimens 1–6, the specimens were bonded such that when viewed from the front (Figure 2c), the longitudinal wood axis was parallel to the aluminum cylinder longitudinal axis. Specimen 7 (Figure 2d,e) was prepared using another θ = 0° aluminum cylinder. For this specimen, the microtomed radial-longitudinal surface was bonded with the wood longitudinal axis perpendicular to the cylinder longitudinal axis.
A dissecting microscope was used to check and measure any misalignment of the bonded specimens. The cylinder surfaces had striations that were parallel to the cylinder’s longitudinal axis (Figure 2b–e). Optical microscopy images were taken from the front and side of the bonded specimens. FIJI [26] was then used to measure the angle between the striations and tracheid longitudinal axes. The angle between the striations and wood longitudinal axes measured from the radial-longitudinal block face was called α, and the angle measured with respect to the tangential-longitudinal block face was called β. As described in Section 3.2, α and β were used in the calculation of δ for the S2 layers tested with nanoindentation.

2.2. Nanoindentation

Nanoindentation surfaces were prepared in wood cell walls without epoxy embedment following previously established procedures [27]. In brief, a hand razor was used to carefully trim a pyramid with an apex in the region of interest. Then, the aluminum cylinders were fitted into a Leica EM UC7 ultramicrotome (Wetzlar, Germany) equipped with a diamond knife such that the prepared surface in the wood specimen was cut normal to the mounting cylinder’s longitudinal axis. Surfaces were prepared by removing 200-nm-thick sections from the apex until an appropriately sized surface was prepared, typically a few 100’s micrometers on a side. For specimens 1–6, the prepared surfaces with respect to the wood anatomical orientation varied from the transverse plane (θ = 0) towards the radial-longitudinal plane as the cylinder angle increased. Specimen 7 had a nanoindentation surface prepared in the tangential-longitudinal plane. It was not possible to create a nanoindentation surface in a radial-longitudinal plane because inevitably there would be a ray near the apex of the pyramid cut with the hand razor, and the peak of the pyramid would flake off in the ultramicrotome at the weak plane caused by the ray.
A Bruker-Hysitron (Minneapolis, MN, USA) TriboIndenter equipped with a diamond Berkovich probe was used. The machine compliance, probe area function, and tip roundness effects were determined from a series of 80 nanoindentations in a fused silica standard using the load function and the procedures in [28,29]. Following the calibration reporting procedure prescribed in [28]: Values for the square root of the Joslin-Oliver parameter of 1.196 ± 0.002 µm/N1/2, elastic modulus of 72.0 ± 0.2 GPa, and Meyer’s hardness of 8.82 ± 0.04 GPa (uncertainties are standard errors) were assessed for fused silica calibration nanoindentations with contact depths between 42 and 186 nm; no systematic variations of machine compliance or Joslin-Oliver parameter were observed in the systematic SYS plot analysis over this range of contact depths.
Nanoindentation was performed under dry conditions (0%), 33%, 75%, and 94% RH. The RH inside of the nanoindentation enclosure was maintained during the experiments using an InstruQuest (Coconut Creek, FL, USA) HumiSysTM HF RH generator. Experiments were performed in absorption beginning at 0% RH. Specimens were conditioned inside the nanoindenter enclosure for at least 48 h at each RH before experiments were performed. The temperature varied between 25 °C and 27 °C during the experiments. The calibration of the temperature and humidity sensor inside the nanoindentation enclosure was verified using a Control Company (Webster, TX, USA) 4085 Traceable® Hygrometer Thermometer Dew Point meter.
Scanning probe microscopy (SPM) images obtained using the Berkovich probe in the TriboIndenter were used to help position the nanoindentations in the S2. SPM images were obtained while the specimen was conditioned at a given RH using a 1 Hz scanning rate and 1 µN load setpoint. For specimens 1–6, SPM images were created of the double cell walls. Three to five nanoindentation locations were chosen on the tangential side of each of the S2 layers in the double cell wall using the SPM image and the piezo automation method. For specimen 7, SPM images were used to position the nanoindentations in the radial side of the S2 layers in double cell walls. Post-nanoindentation SPM images were used to verify the nanoindentation locations. Any nanoindentation that was not completely contained within the S2 layer was excluded from further analysis. In each specimen at each RH, two or three double cell walls were tested. The multiload load function described in [30] was used in this study. The maximum load depended on RH and decreased from 0.8 mN at dry conditions to 0.3 mN at 94% RH. The maximum load decreased with increasing RH to maintain approximately similar-sized nanoindentations.
Following the analysis algorithm described in Jakes and Stone [27], unloading segments with contact depths less than 42 nm, which were those found to be affected by tip roundness effects in the fused silica calibrations, were excluded from the analysis. The remaining unloading segments for each nanoindentation were then used with the structural compliance method [31] to remove artifacts caused by edge effects and specimen-scale flexing at each nanoindentation location. After correcting the data for structural compliance, the indentation modulus (M) of contact was calculated using the following:
M = π 2 S A 0
where A 0 is the is the contact area and S is the contact stiffness calculated by fitting the Oliver–Pharr [32] power law function to 40%–95% of the maximum load of each unloading segment. For comparison to the transverse isotropic elastic constants, the indentation Young’s modulus E s I S O , which assumes the material tested is an isotropic material, was also calculated using the following:
E s I S O = 1 ν s 2 2 π A 0 S 1 ν d 2 E d 1
where E d and ν d are the Young’s modulus (1137 GPa) and the Poisson’s ratio (0.07) of diamond, and ν s is the Poisson’s ratio of the material tested. In this work, ν s = 0.3 was used. The Meyer hardness ( H ) was determined using the following:
H = P 0 A 0
where P 0 is the maximum load immediately prior to unloading. After excluding data affected by tip roundness, no data exhibited any systematic size dependence. Therefore, from each nanoindentation, all results from the remaining unloading slopes were included when calculating averages and standard deviations.
Using the protocols of Jäger and coworkers [18,19], the M–δ results at each RH were fit to the transverse isotropic model developed by Vlassak and coworkers [21]. The model assumes the S2 secondary cell wall layer can be represented by the stiffness matrix C = C i j , defined in a right-hand Cartesian coordinate system x 1 ,   x 2 ,   x 3 as shown in Figure 1, where x 3 is oriented parallel to the cellulose fibrils. The elastic constants are related to C as follows:
C = 1 E t ν t t E t ν t l E l 0 0 0 ν t t E t 1 E t ν t l E l 0 0 0 ν t l E l ν t l E l 1 E l 0 0 0 0 0 0 1 G t l 0 0 0 0 0 0 1 G t l 0 0 0 0 0 0 1 G t t = 2 1 + ν t t E t
where E l is the longitudinal elastic modulus in the direction parallel to the longitudinal axes of the cellulose fibrils, E t is the transverse elastic modulus perpendicular to the cellulose fibrils, G t l is the out-of-plane axial shear modulus in a transverse-longitudinal plane, G t t is the in-plane shear modulus in the transverse plane, and ν t l and ν t t are the two Poisson’s ratios. A transverse isotropic material only has five independent elastic constants. G t t can be calculated from E t and ν t t as shown in Equation (4). For this work, both Poisson’s ratios were assumed to be 0.3 for all RH conditions. Setting the Poisson’s ratios to a constant value was justified in previous work by Jäger and coworkers, who performed a parametric study of how varying ν t l and ν t t from 0 to 0.5 affected M [18,19]. They found that varying the Poisson’s ratios had a negligible effect on M compared to the effects of E l , E t , and G t l .
The transverse isotropic model was numerically fit to the experimental M–δ results by minimizing the error function [19] as follows:
R = i = 1 n M e x p δ i M p r e d E t , E l , G t l , δ i   2 i = 1 n M e x p δ i 2 1 2
where M e x p δ i is the experimental M at δ i and M p r e d E t , E l , G t l , δ i   is the M predicted by the model for the given values of E t , E l , G t l , and δ i . For each RH, maps of R as functions E t , E l , G t l were created to check that the solution was at the only global minimum over a large material property parameter space and to provide insights into the sensitivity of the model fit to changes in E t , E l , or G t l .

2.3. Wide Angle X-Ray Diffraction Measurements

The cellulose microfibril angle (MFA) of the same loblolly pine latewood growth ring tested with nanoindentation was measured as a function of RH using wide-angle X-ray diffraction (WAXD). Six 50-µm-thick tangential-longitudinal sections were microtomed using a sled microtome fit with a disposable blade and stacked to form a combined thickness of 300 µm. Preliminary experiments showed that carefully stacked sections produced similar results as an intact section of equivalent thickness. The stack of sections was chosen because the thinner sections should equilibrate faster in changing RH conditions. The WAXD data were collected in transmission mode using a Bruker (Billerica, MA, USA) D8 diffractometer with a Cu-Kα micro X-ray source (λ = 1.5418 Å), VANTEC-500 two-dimensional detector (2048 × 2048 pixels with square 68 × 68 µm pixel size), 0.5 × 0.5 mm beam spot size, and 300 s exposure time. The sample detector distance used was approximately 100 mm, and the sample was calibrated using both silver I behenate (Fisher Scientific, Pittsburgh, PA, USA) and a silicon powder standard from NIST [33]. The wood samples were placed inside a custom-built RH chamber with KaptonTM film (DuPont, Wilmington, DE, USA) windows, where the RH inside of chamber was controlled using either a desiccant, or aqueous salt solutions made with magnesium chloride, sodium chloride, or potassium nitrate. Specimens were conditioned in the chamber for at least 24 h before testing. The RH in the chamber was measured using a Sensirion (Staefa, Switzerland) SHT31 humidity sensor. At least two WAXD measurements were performed per sample, and two samples from the same growth ring were measured at 1%, 33%, 73%, and 93% RH conditions.
Data reduction and analysis were implemented using the FabIO [34] and lmfit 1.0 [35] Python 3.10 libraries [36]. The detector images were imported using FabIO [34], then transformed into polar coordinates and azimuthally averaged over the 200-diffraction peak. These azimuthal profiles were then corrected for background contributions by fitting the profiles to a model that consisted of a Gaussian peak and a cubic background. The background was then subtracted from the data. The cellulose MFA was determined by fitting the corrected 200 azimuthal profiles to a model with three Gaussian peaks [37].

3. Results and Discussion

3.1. Microfibril Angle (MFA) Measurement

The MFA results obtained from wide-angle X-ray diffraction measurements are shown in Table 1. No systematic effects of RH were detected in the MFA determination. Previous studies quantifying moisture-induced changes in the MFA are few and have mostly focused on drying effects. At room temperature, reported drying effects on MFA have been considered negligible [38] or very minimal, with changes of less than 1° between wet and dried samples [39]. Drying wet wood at elevated temperatures of 60 °C or 70 °C to 8% MC resulted in a 2–3° increase in MFA [40]. The moisture-dependent MFA results in this study were similar to those reported in the literature at room temperature. The average MFA value of 21.3° was used in this study to calculate δ .

3.2. Calculation of δ

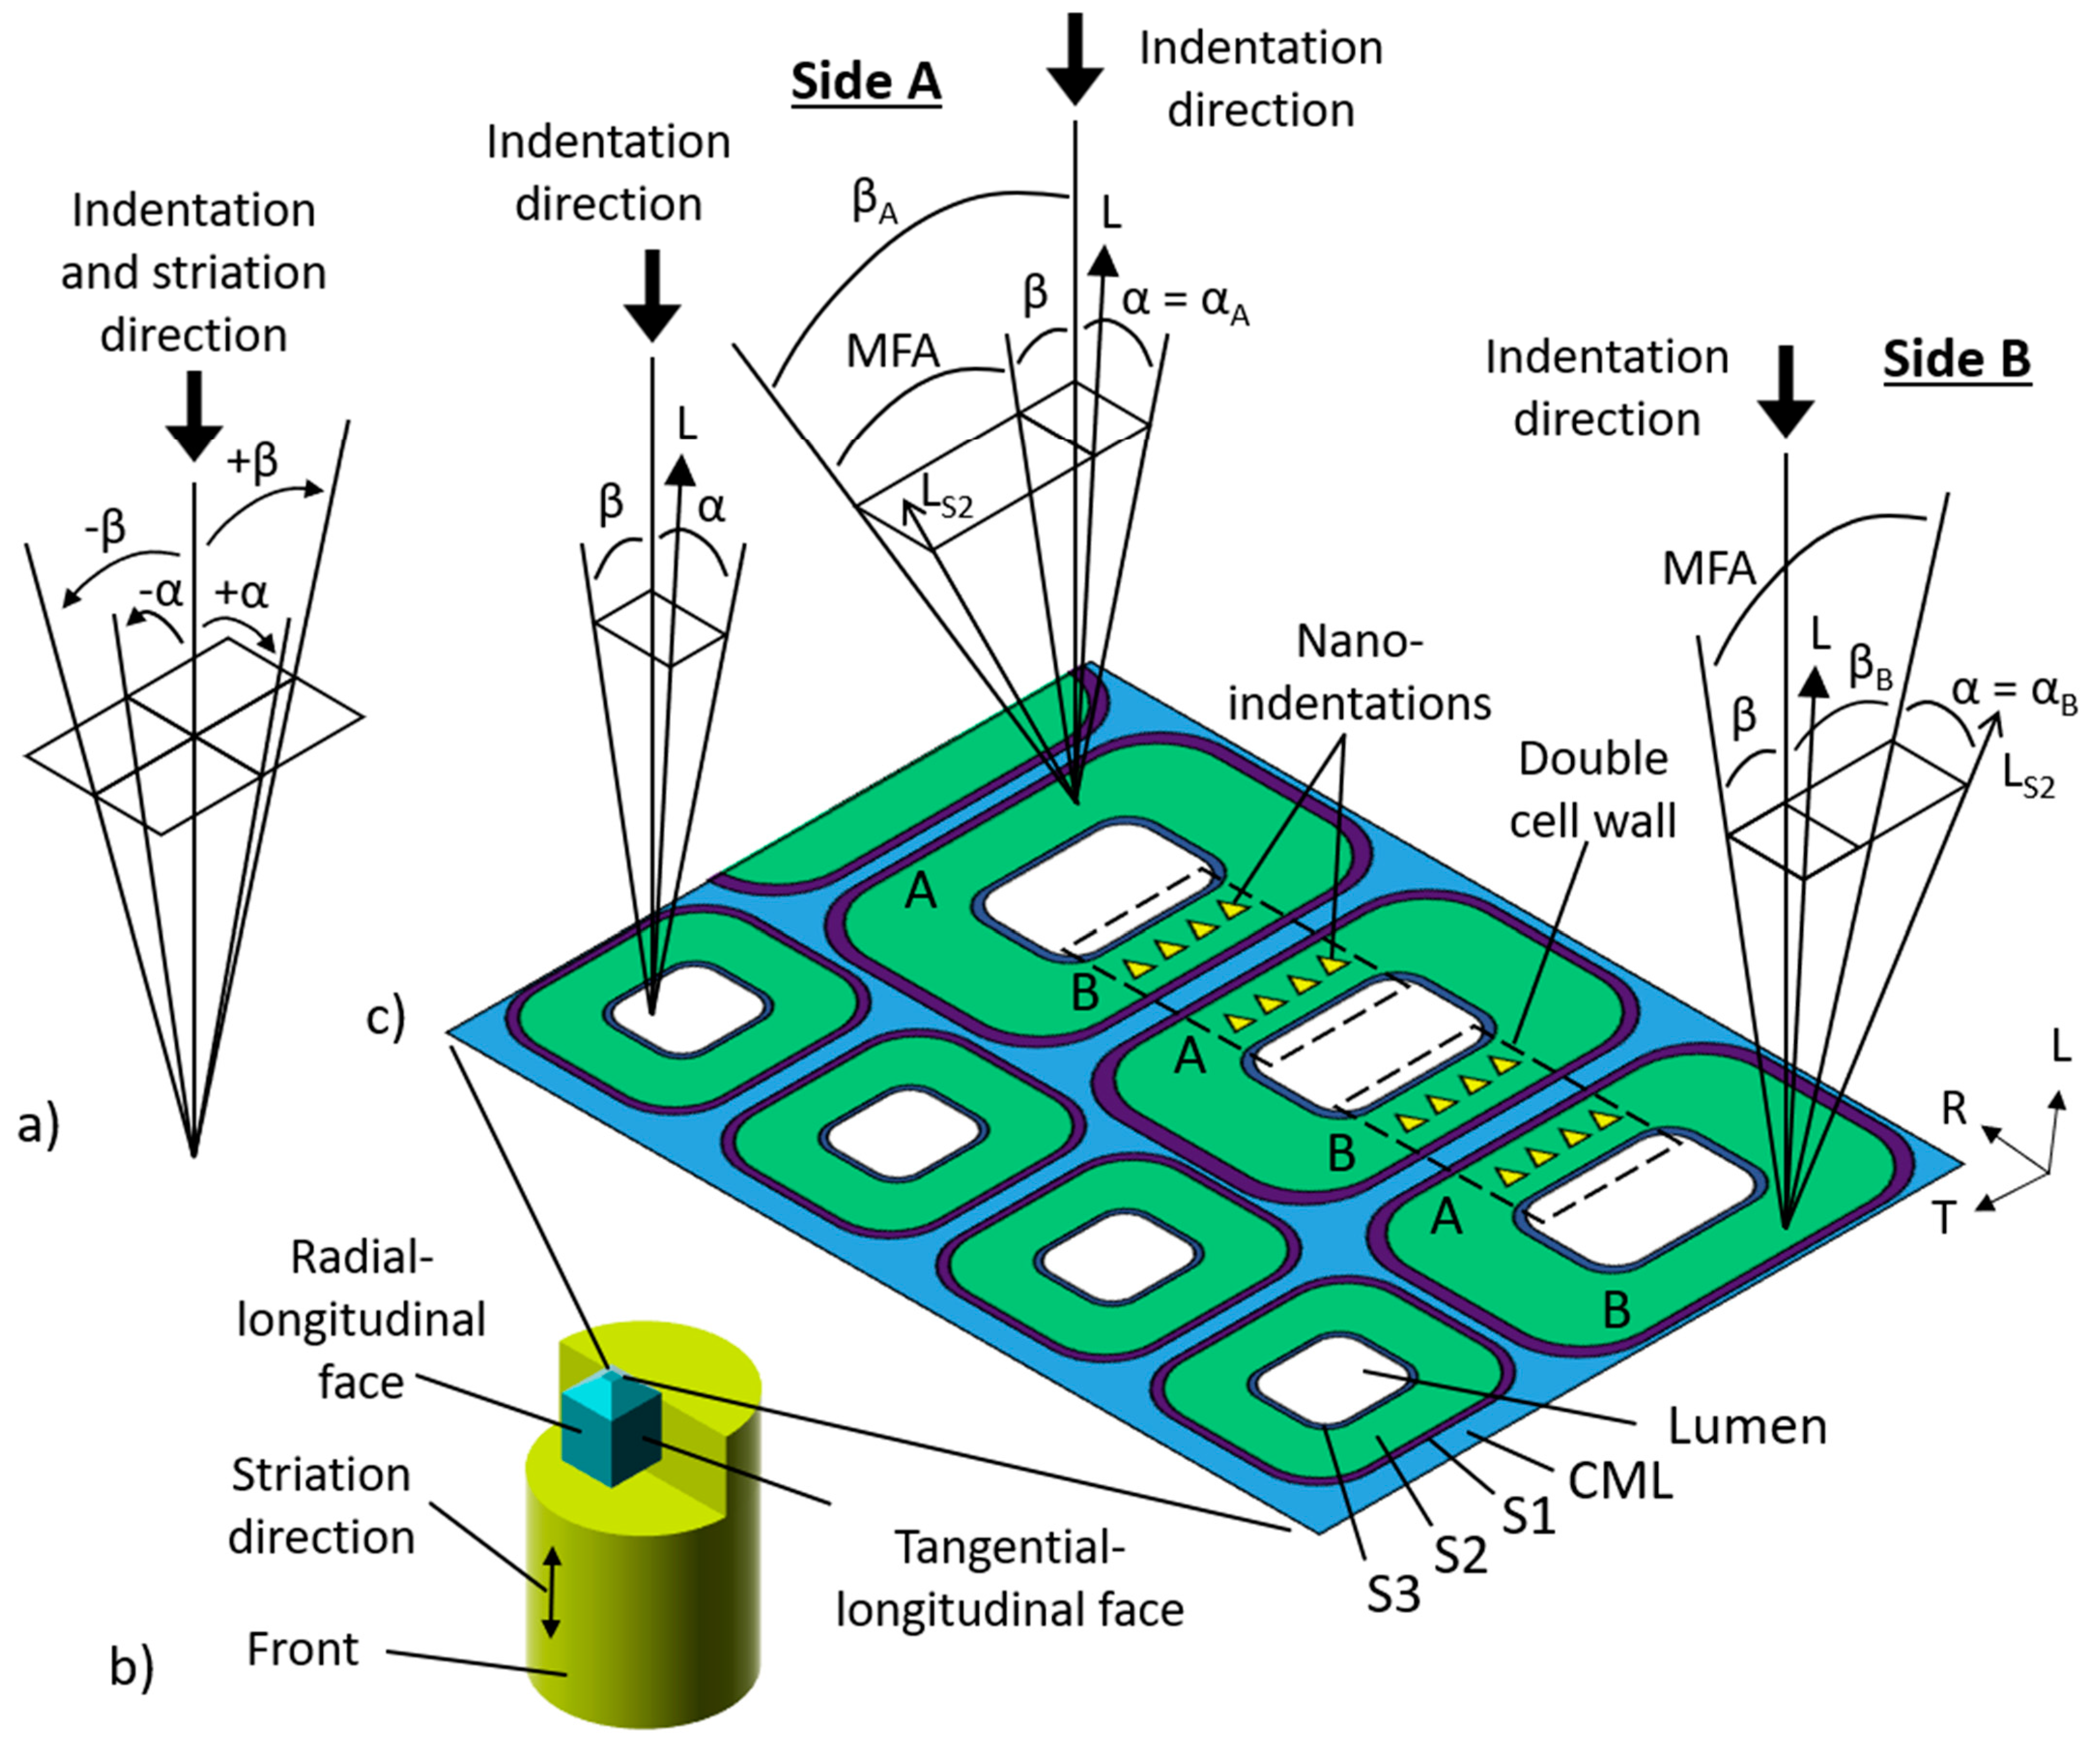
Figure 3 illustrates how sides A and B of the double cell wall were defined for specimens 1–6 and how the α i and β i angles for sides A and B were calculated. The specimen holders were designed to fit into the nanoindenter so that the striations visible on their surface were parallel to the indentation direction. Using an optical microscope, the angles α and β were measured between the striations and the wood longitudinal axis from the radial-longitudinal and tangential-longitudinal block faces, respectively. In the S2, the microfibrils have a right-handed helical orientation. For specimens 1–6, the values of α were the same for sides A and B in a double cell wall. The values of β depended on the MFA of the helically wound cellulose fibrils. For the S2 layer side A, β A = β + M F A , and for side B, β B = β M F A . For specimen 7, β was the same for sides A and B in the double cell wall, whereas α A = α + M F A and α B = α M F A . For each S2, the value of δ can be calculated using the following:
δ = arctan tan 2 α i + tan 2 β i 1 2
where i is either A or B, indicating the side [19]. The measured values of α and β , along with the calculated values of δ , are in Table 2. For specimens 5 and 6, it was not possible to measure α because the radial-longitudinal face was tilted too far to be viewed from an image taken from the front. Similarly, it was not possible to measure β for specimen 7. However, it should be noted that the angles that were unable to be measured from specimens 5, 6, and 7 should have minimal impact on the results. A tilt of 5°—which would be visible to the human eye—would change δ by less than only 0.1°, and there was no tilt that could be observed in the specimens.

3.3. S2 Layer Elastic Properties

Representative optical and scanning probe microscopy (SPM) images of a prepared surface and nanoindentations placed in the S2 layers are shown in Figure 4. The surface prepared with the diamond knife appears bright in the optical image (Figure 4a) because the exceptionally smooth surface reflects light like a mirror. SPM images of the double cell walls revealed prepared S2 layer surfaces suitable for nanoindentation under all RH conditions tested, including the initial 0% RH condition (Figure 4b) and at higher RH, like the experiments at 75% RH (Figure 4c). The visible compound middle lamella (CML) and lumen edges in the SPM images were used to place nanoindentations in the center of the S2 layer. Post-nanoindentation SPM images (Figure 4b,c) were used to verify the nanoindentation placement.
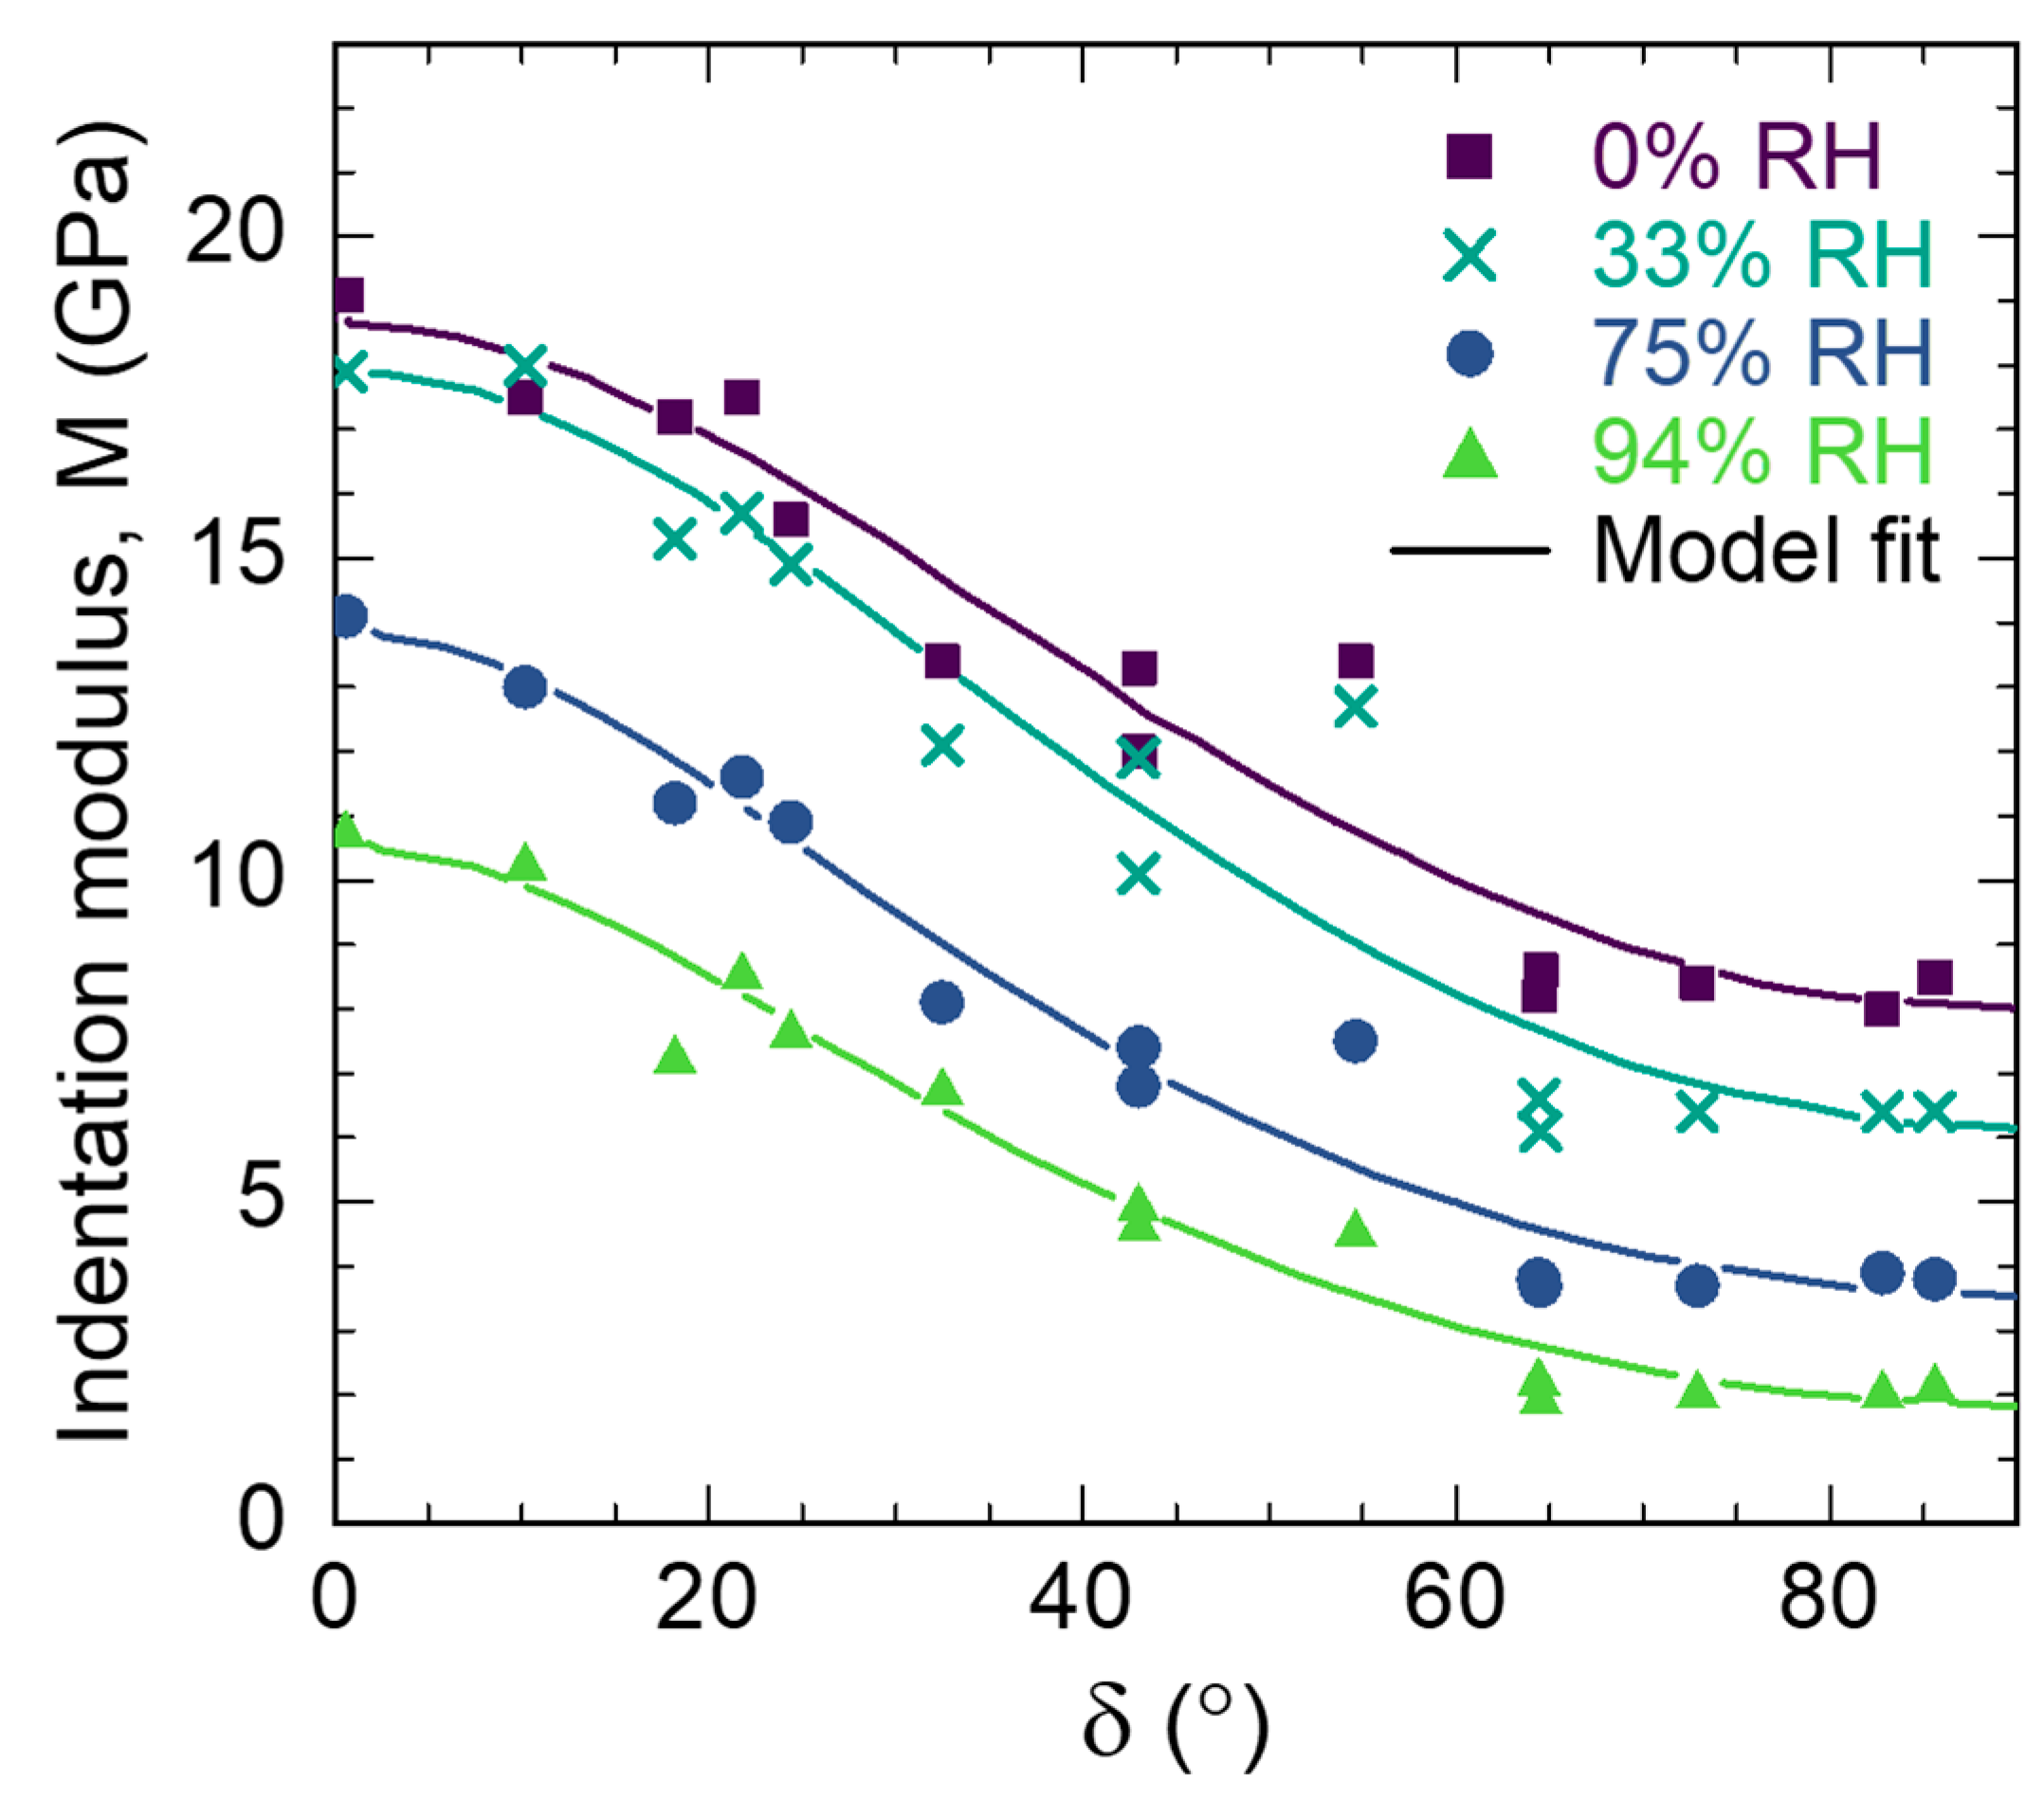
The S2 secondary cell wall layer has a fiber-reinforced composite structure with stiff cellulose fibrils embedded in a more compliant matrix of amorphous cellulose, hemicelluloses, and lignin (Figure 1). Indentation elastic modulus M results as a function of δ and RH are in Table 3 and Figure 5. Similar to what was reported by Jager and coworkers [19], M decreased with increasing δ because of the orientation of the stiff longitudinal axes of the cellulose fibrils with respect to the indentation direction. At δ = 0°, nanoindentations were placed in the transverse plane of the S2 layer (Figure 1b,c), and the stiff fibrils were oriented parallel to the applied force. In this orientation, the stiff cellulose fibrils were supporting more of the force and the measured M was higher. However, at δ = 90° the stiff cellulose fibrils were oriented perpendicular to the applied force. The M at high δ was lower because the more compliant matrix phase had a larger effect. M also decreased with increasing RH because wood cell walls absorbed more water at higher RH and the water generally acted as a plasticizer to lower mechanical properties. The amount of softening depended on δ . From 0% RH to 94% RH, M decreased about 40% for lower δ and decreased up to about 75% at the higher δ .
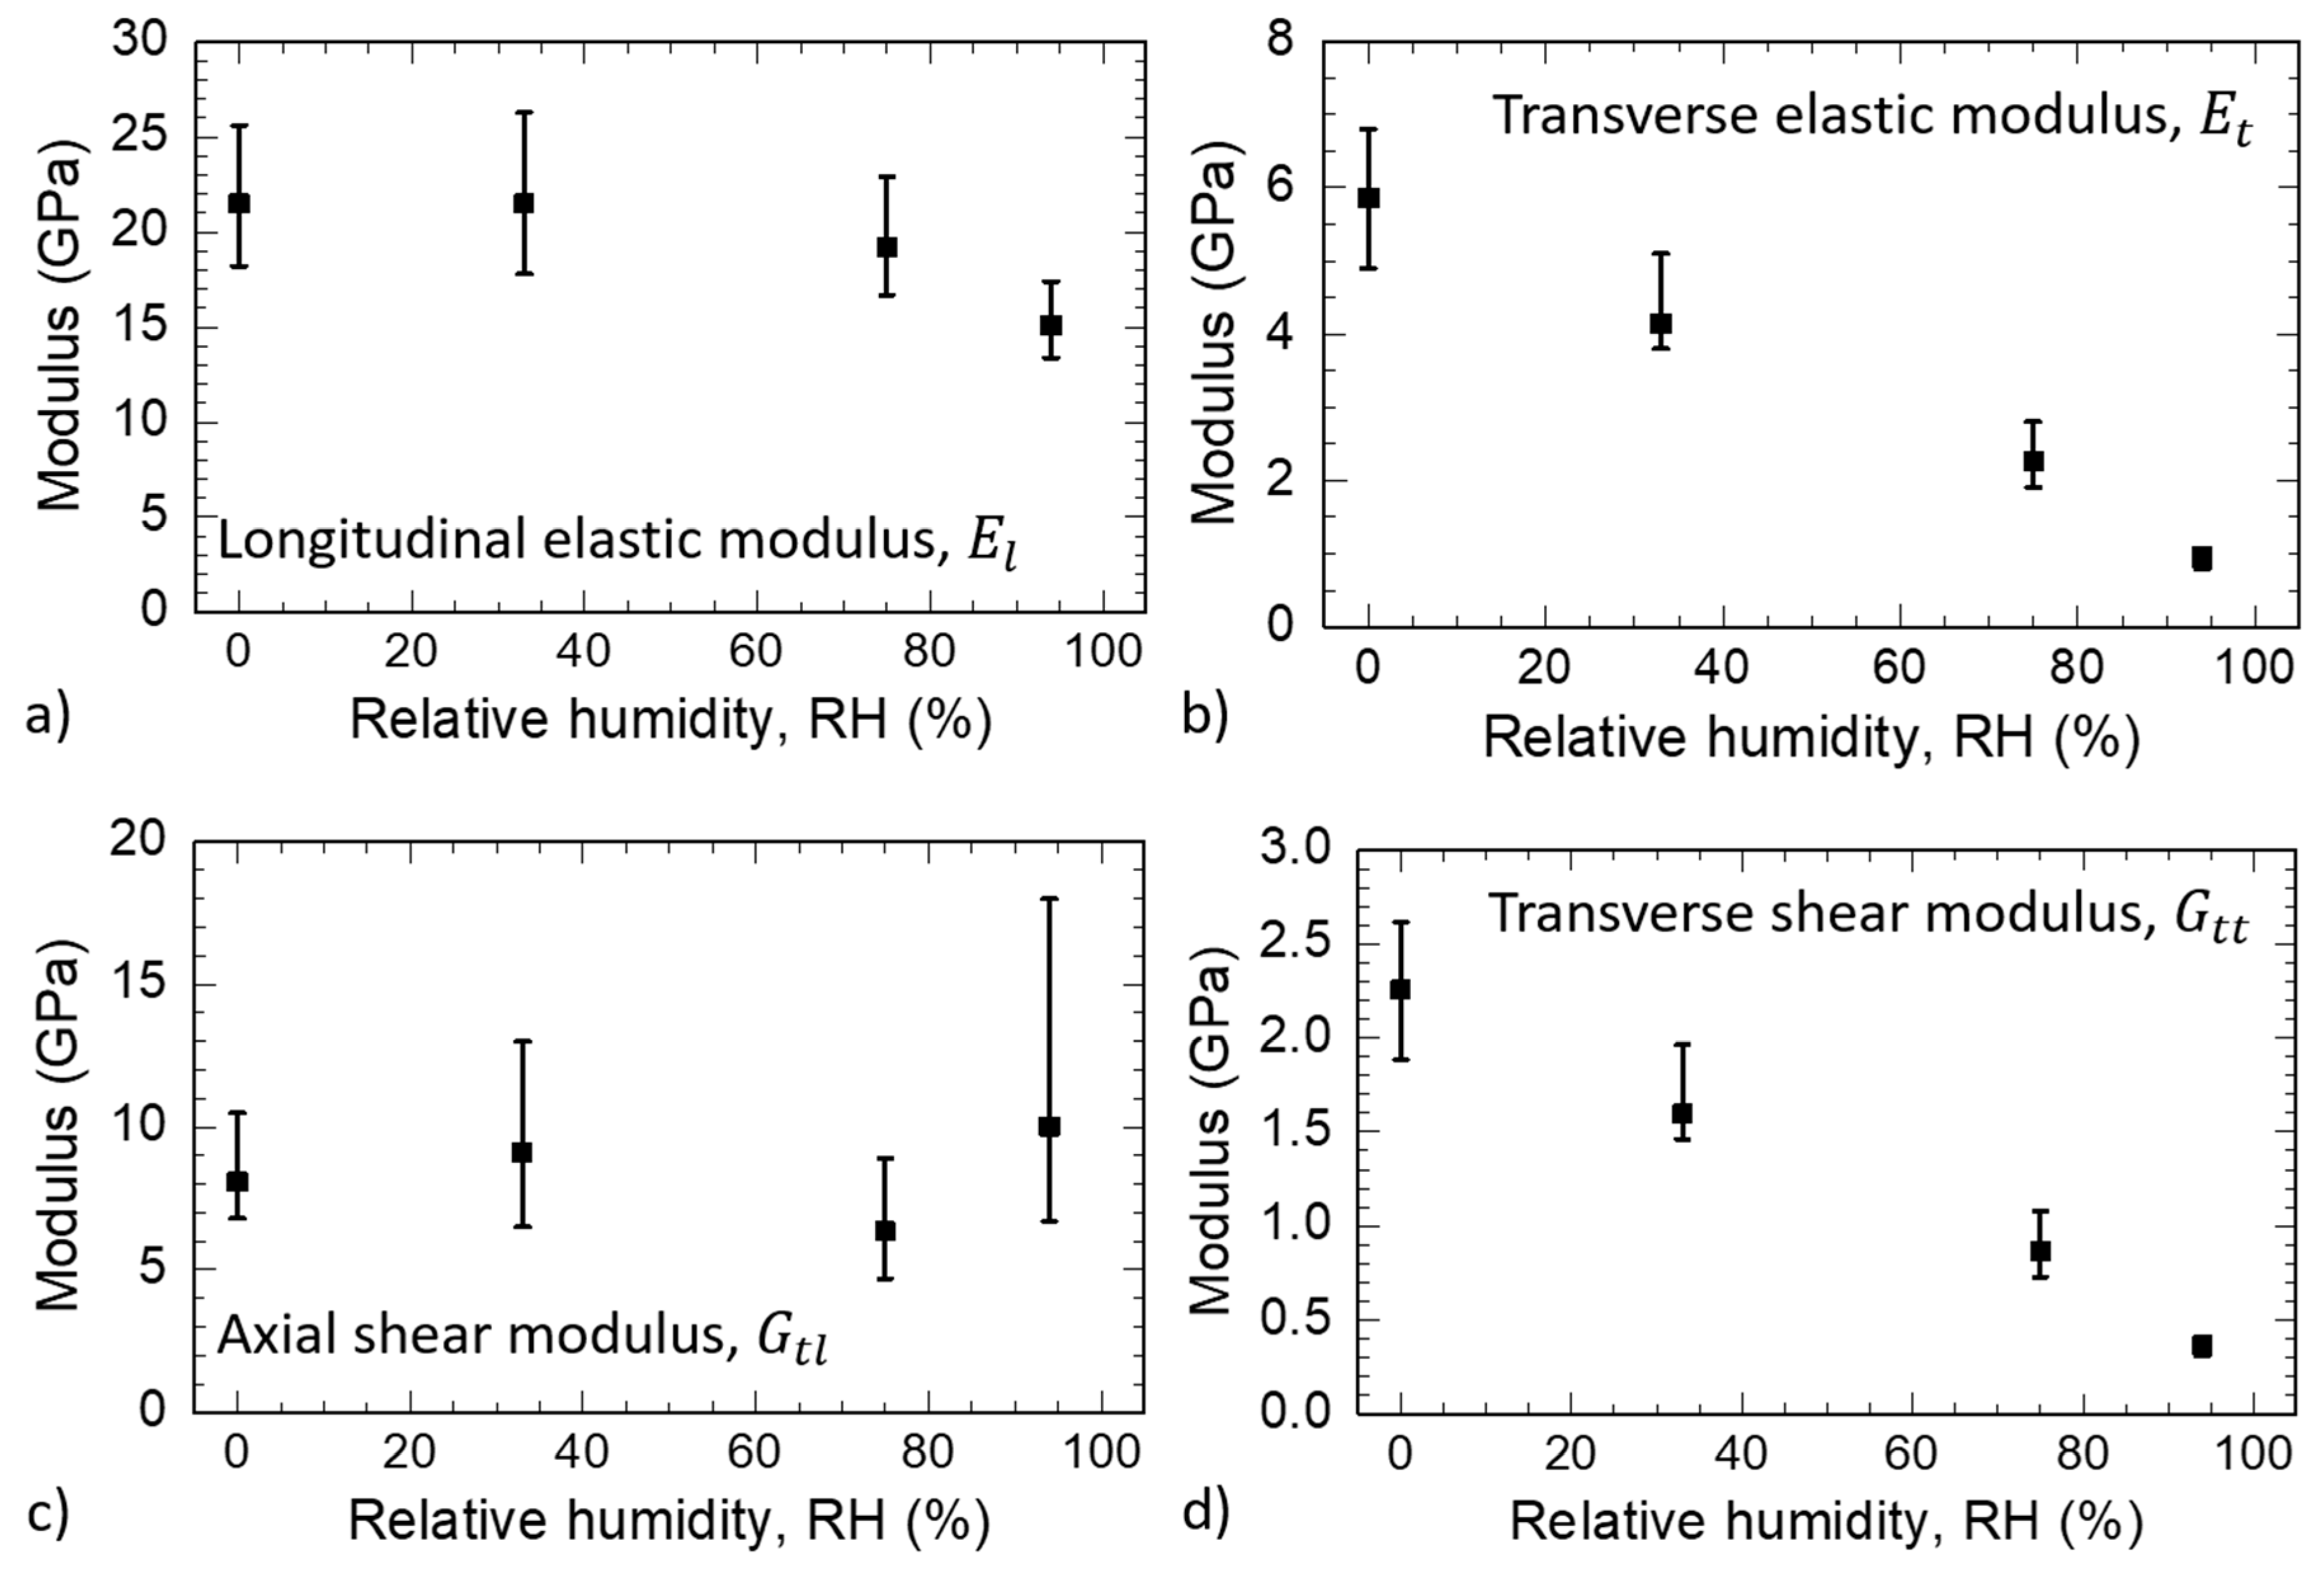
Following Jager and coworkers [19], Poisson’s ratios ν t l and ν t t were set equal to 0.3 and the M–δ results in Figure 5 were numerically fit to a transverse isotropic elasticity model to determine E l , E t , and G t l . The E l , E t , and G t l values at the minimum error R for each RH are shown in Table 4. G t t calculated using Equation (4) is also included. The 0.074 to 0.101 range of R values in this study were similar in magnitude to the 0.079 R value reported by Jager and coworkers, which indicated a similar amount of scatter in the experimental M δ data from both studies. For each RH, uniqueness was checked by mapping R over large ranges of E l , E t , and G t l . Two-dimensional R contour maps are shown in the Supplementary Materials Figures S1–S4. The parameter ranges mapped were 5 GPa < E l < 30 GPa, 0 < E t 10 GPa, and 0 < G t l < 15 GPa. For each contour map, either E l , E t , or G t l were held constant at its best-fit value while the other two parameters were varied over their parameter ranges. The fits were determined to be unique because only one global minimum was found in calculated R maps. The shapes and spacing of the contour lines provide insights into how sensitive the model fits were to changes in the different parameters. Larger spacing between contour lines indicates that larger changes in the varied property values have only a small impact on the calculated values of R , which would suggest less confidence in the fitted modulus value. In Figure 6a–d, E l , E t , G t l , and G t t are plotted as a function of RH. The error bars in Figure 6a–d represent the ranges of property values estimated from the error plots in Figures S1–S4 at a contour corresponding to the best-fit value of R listed in Table 4 plus 0.01. Error bars for G t t were calculated from the E t error bars and Equation (4). For E l , E t , and G t t , the sizes of the error bars relative to the modulus values were relatively consistent. Comparatively, the G t l error bars in Figure 6c were much larger, especially at 33% RH and 94% RH. The experimental factors contributing to these larger error bars for G t l are not currently known.
These elastic constants were determined using the simplifying assumption that the S2 layer could be approximated by a transversely isotropic material model. An S2 layer with the proposed concentric lamella structure [7] in Figure 1b would violate this assumption because the transverse plane has anisotropy caused by the fibrils organized in the lamella structure. The elastic transverse stiffnesses in the parallel and perpendicular directions are expected to be different. An orthotropic model with nine independent elastic constants is likely more precise. For instance, an orthotropic model would have two axial shear moduli and two transverse elastic moduli with one in each of the parallel and perpendicular S2 layer directions defined in Figure 1. The simpler transversely isotropic material model used in this work assumed that the two axial shear moduli and two transverse elastic moduli were equal. Although no experimental measurements of the orthotropic S2 layer elastic constants are available to test this assumption, modeling results are available. Harrington and coworkers modeled the S2 layer as an orthotropic material and reported that the values of two axial shear moduli were within about 10%, and that the two transverse elastic moduli were also within about 10% [41]. These 10% differences are much smaller than the differences between the longitudinal and transverse moduli or the axial and transverse shear moduli. Therefore, the transversely isotropic material approximation used in this work was sufficient for assessing the moisture-dependent anisotropic S2 layer elastic properties. The simpler transverse isotropy assumption was also justified in this study because implementing the more complex orthotropic model at each RH would have required a prohibitively large number of additional nanoindentation experiments that also tested in directions relative to the lamella structure. In principle, nanoindentation could also be used to study orthotropy in the S2 layer if additional sets of experiments, with indentation directions relative to the S2 layer lamella structure, could be performed. These experiments would be needed in addition to experiments varying the indentation directions relative to the longitudinal axis of the cellulose fibrils.
Substantial decreases in elastic moduli were observed at higher RH as the absorbed water plasticized the S2. Plasticizers are mechanistically understood to increase the free volume in polymers, which causes increases in polymer segment mobility and mechanical softening [42]. For polymers with hydrogen bonding, which includes the matrix wood polymers, water typically plasticizes by breaking polymer-polymer hydrogen bonds and pushing neighboring polymer chains apart to cause swelling [43,44,45]. From 0% RH to 94% RH, E l decreased 30%, E t and G t t both decreased by 83%, while G t l did not exhibit a change with RH. The smaller decrease in E l , as compared to E t , is consistent with bulk loblolly pine, in which longitudinal elastic moduli were less sensitive to changes in moisture content than transverse elastic moduli [8]. The longitudinal elastic moduli are likely less sensitive to changes in moisture because of the cellulose fibril orientation. Water cannot enter and plasticize the highly ordered domains of the cellulose fibrils [46]. Therefore, the mechanical properties of the cellulose fibrils are not expected to change with moisture. The softening in the matrix wood polymers still has a substantial effect on the longitudinal elastic modulus, but the effect is larger in the transverse direction where the fibrils and matrix are oriented closer to a mechanical series. The G t t decreased the same amount as the E t because in a transverse isotropic material with an assumed constant ν t t , the two moduli are directly proportional, as shown in Equation (4). The large decrease in G t t also indicated that the plasticization of the matrix wood polymers had a large effect on it.
Jäger and coworkers reported E l = 26.3 GPa, E t = 4.5 GPa, and G t l = 4.8 GPa for the S2 layer of late wood spruce wood (Picea abies). The current results compare relatively well considering Jäger and coworkers tested a different type of wood at an unknown RH condition. Before testing, they also embedded their wood in a low-viscosity epoxy resin to help with surface preparation, which may have substantially impacted their results. For instance, Meng and coworkers [23] reported a 15% increase in S2 layer nanoindentation elastic modulus caused by a similar epoxy embedment for nanoindentations performed in the transverse wood plane, which measured longitudinal properties. It is possible that a similar embedment effect caused an increased E l in the results of Jäger and coworkers.
There are no previous experimental measurements to directly compare the S2 layer moisture-dependent E l , E t , G t t , or G t l values. However, the observed trends in E l and E t with RH are consistent with previous elastic property measurements in the longitudinal and transverse directions of bulk wood. At low RH, the S2 layer E l was found to stay a constant 21.5 GPa value from 0% to 33% RH before then decreasing at higher RH. The E t exhibited a different trend, with the E t showing a consistently decreasing trend with increasing RH. These behaviors are like the previously observed anisotropy in the moisture-dependent elastic moduli in woody materials. When testing in the direction parallel to the wood longitudinal axis under increasing moisture conditions, both bulk wood [8] and bamboo fiber walls [11] have been observed to initially either stay constant or even increase in longitudinal elastic moduli at lower moisture levels before decreasing at higher moisture contents. In contrast, elastic moduli measured in the transverse direction consistently decrease with increasing moisture contents. The increase in elastic moduli at low RH is similar to the behavior observed in the moisture-dependent Young’s modulus measured in lignin [47]. In contrast, the Young’s modulus of hemicelluloses was found to consistently decrease with increasing moisture [48]. Insights into the molecular-level mechanisms responsible for these behaviors are provided by molecular dynamics simulations [11]. At low moisture contents, in lignin and lignin carbohydrate complexes, it was observed that the first water molecules enter molecular-scale holes in the lignin structure. This hole-filling mechanism is also supported by a recent positron annihilation loss spectroscopy (PALS) study of the moisture-dependent free volume in wood from the same growth ring studied in this work [24]. PALS found that when going from the dry state, the mean free volume element size in wood initially decreases at lower RH before increasing at higher RH, which is interpreted as the first water molecules filling molecular-scale holes in the wood matrix polymers. In the molecular dynamic simulations [11], the additional hydrogen bonds between the hole-filling water and lignin increase the overall elastic stiffness of the lignin structure. Then, at higher moisture contents, the water began to swell and break intermolecular hydrogen bonds, plasticizing the lignin structures and causing softening. In contrast, in the hemicelluloses, even the first water molecules swell the molecular structure, breaking hydrogen bonds and plasticizing the hemicelluloses. The similar trends with moisture for the elastic moduli measured in the directions parallel to the bulk material longitudinal axis [8,11] and the S2 layer E l measured here indicate that all these measured moduli are likely being affected more by the lignin than hemicelluloses. Similarly, measured transverse elastic properties are likely to be influenced more by the hemicelluloses than lignin. Therefore, when studying the effects of changes in wood polymer structures on changes in S2 layer mechanical properties, both transverse and longitudinal properties need to be studied.
Theoretical values for S2 layer elastic constants and their moisture dependence have been reported in modeling studies. Analytical models have been developed based on assumptions about the S2 layer composition, structure, and elastic properties of the individual wood polymer components [41,49,50,51,52]. Molecular dynamics models have also been constructed using assumed S2 layer compositions and structures, and then the models were studied computationally to assess S2 layer mechanical properties [53,54]. Results from the different modelling studies are inconsistent because they rely on different assumptions. Nevertheless, some useful insights can still be obtained through a general comparison of modeling results to the nanoindentation results in this paper.
Theoretical S2 layer elastic constants are typically reported at 12% moisture content, which corresponds closest to the 75% RH condition in this study. Models that assume a continuous cellulose fibril report S2 layer E l values that range from 41 to 87 GPa [41,49,50,52,53,54]. These modeling results are more than a factor of two higher than the E l = 19.2 GPa value found at 75% RH in this study. The much higher model E l values may be because the continuous fibril assumption is incorrect. Less-ordered regions every 150-400 nm along the longitudinal axis of cellulose fibrils have been proposed [55,56,57], which would suggest a discontinuous fibril in the S2. Horvath and coworkers also studied S2 layer models with discontinuous fibrils following a Halpin-Tsai model and fibrils that alternated between crystalline and amorphous cellulose along their length, like a Reuss composite model [50]. Values of 36 GPa and 15 GPa were reported for the S2 layer E l with Halpin-Tsai and Reuss fibril models, respectively. The lower experimental value of E l in this paper, which supports that a discontinuous cellulose fibril assumption may be more appropriate than the continuous fibril assumption. Numerous S2 layer axial and transverse shear moduli are also reported in the modeling literature. At 12% moisture content, reported axial shear moduli range from 0.6 to 3.4 GPa, and transverse shear moduli ranged from 0.4 to 3.0 GPa [41,50,51,52,53,54]. While the G t t value of 0.9 GPa at 75% RH falls within the range of the reported model results, the 6.1 GPa value for G t l is about a factor of two higher.
In modeling studies examining moisture-dependent S2 layer properties, the elastic constants E l , E t , G t t , or G t l all substantially decrease with increasing moisture [50,53,54]. Additionally, the model trends of E l and E t with moisture show that the E l is less sensitive to moisture than E t . As previously described, moisture has less of an impact on E l than E t because of the orientation of the stiff cellulose fibrils, which are not plasticized by water. The theoretical trends of E l , E t , and G t t with moisture, are generally consistent with the experimental results in Figure 6a, Figure 6b, and Figure 6d, respectively. However, the lack of an observable trend with moisture for the experimental G t l (Figure 6c) is inconsistent with the moisture dependence observed in the theoretical modeling. The fact that E l and G t l change by relatively small amounts (at most 25%) with increasing RH suggests that these properties reflect a strong constraint of deformation by the cellulose fibrils, which are relatively insensitive to moisture content. On the other hand, for E t and G t t , the drop by 83% suggests that deformation circumvents the constraint of the cellulose fibrils and follows the matrix polymers, which are quite sensitive to moisture content. These behaviors are physically reasonable and consistent with the behavior of a fiber-reinforced composite taken with the Voigt ( E l and G t l ) and Reuss ( E t and G t t ) averages.
It remains unknown whether these discrepancies in elastic constant values and trends with moisture arise from errors in the models or the nanoindentation protocols employed in this study. For example, in the comparison of experimental G t l to the modeling results, the experimental values were higher, and the moisture dependence was lower. These discrepancies may suggest that the stiff cellulose fibrils have a larger effect on G t l results with current models’ predictions. Therefore, future modeling and nanoindentation work should be executed simultaneously studying S2 layers with systematically different compositions and structures to refine the understanding of both the S2 layer models and nanoindentation results. Additional research to better understand the S2 layer nanostructure and moisture-dependent mechanical properties of individual wood polymer components would also help improve future models.
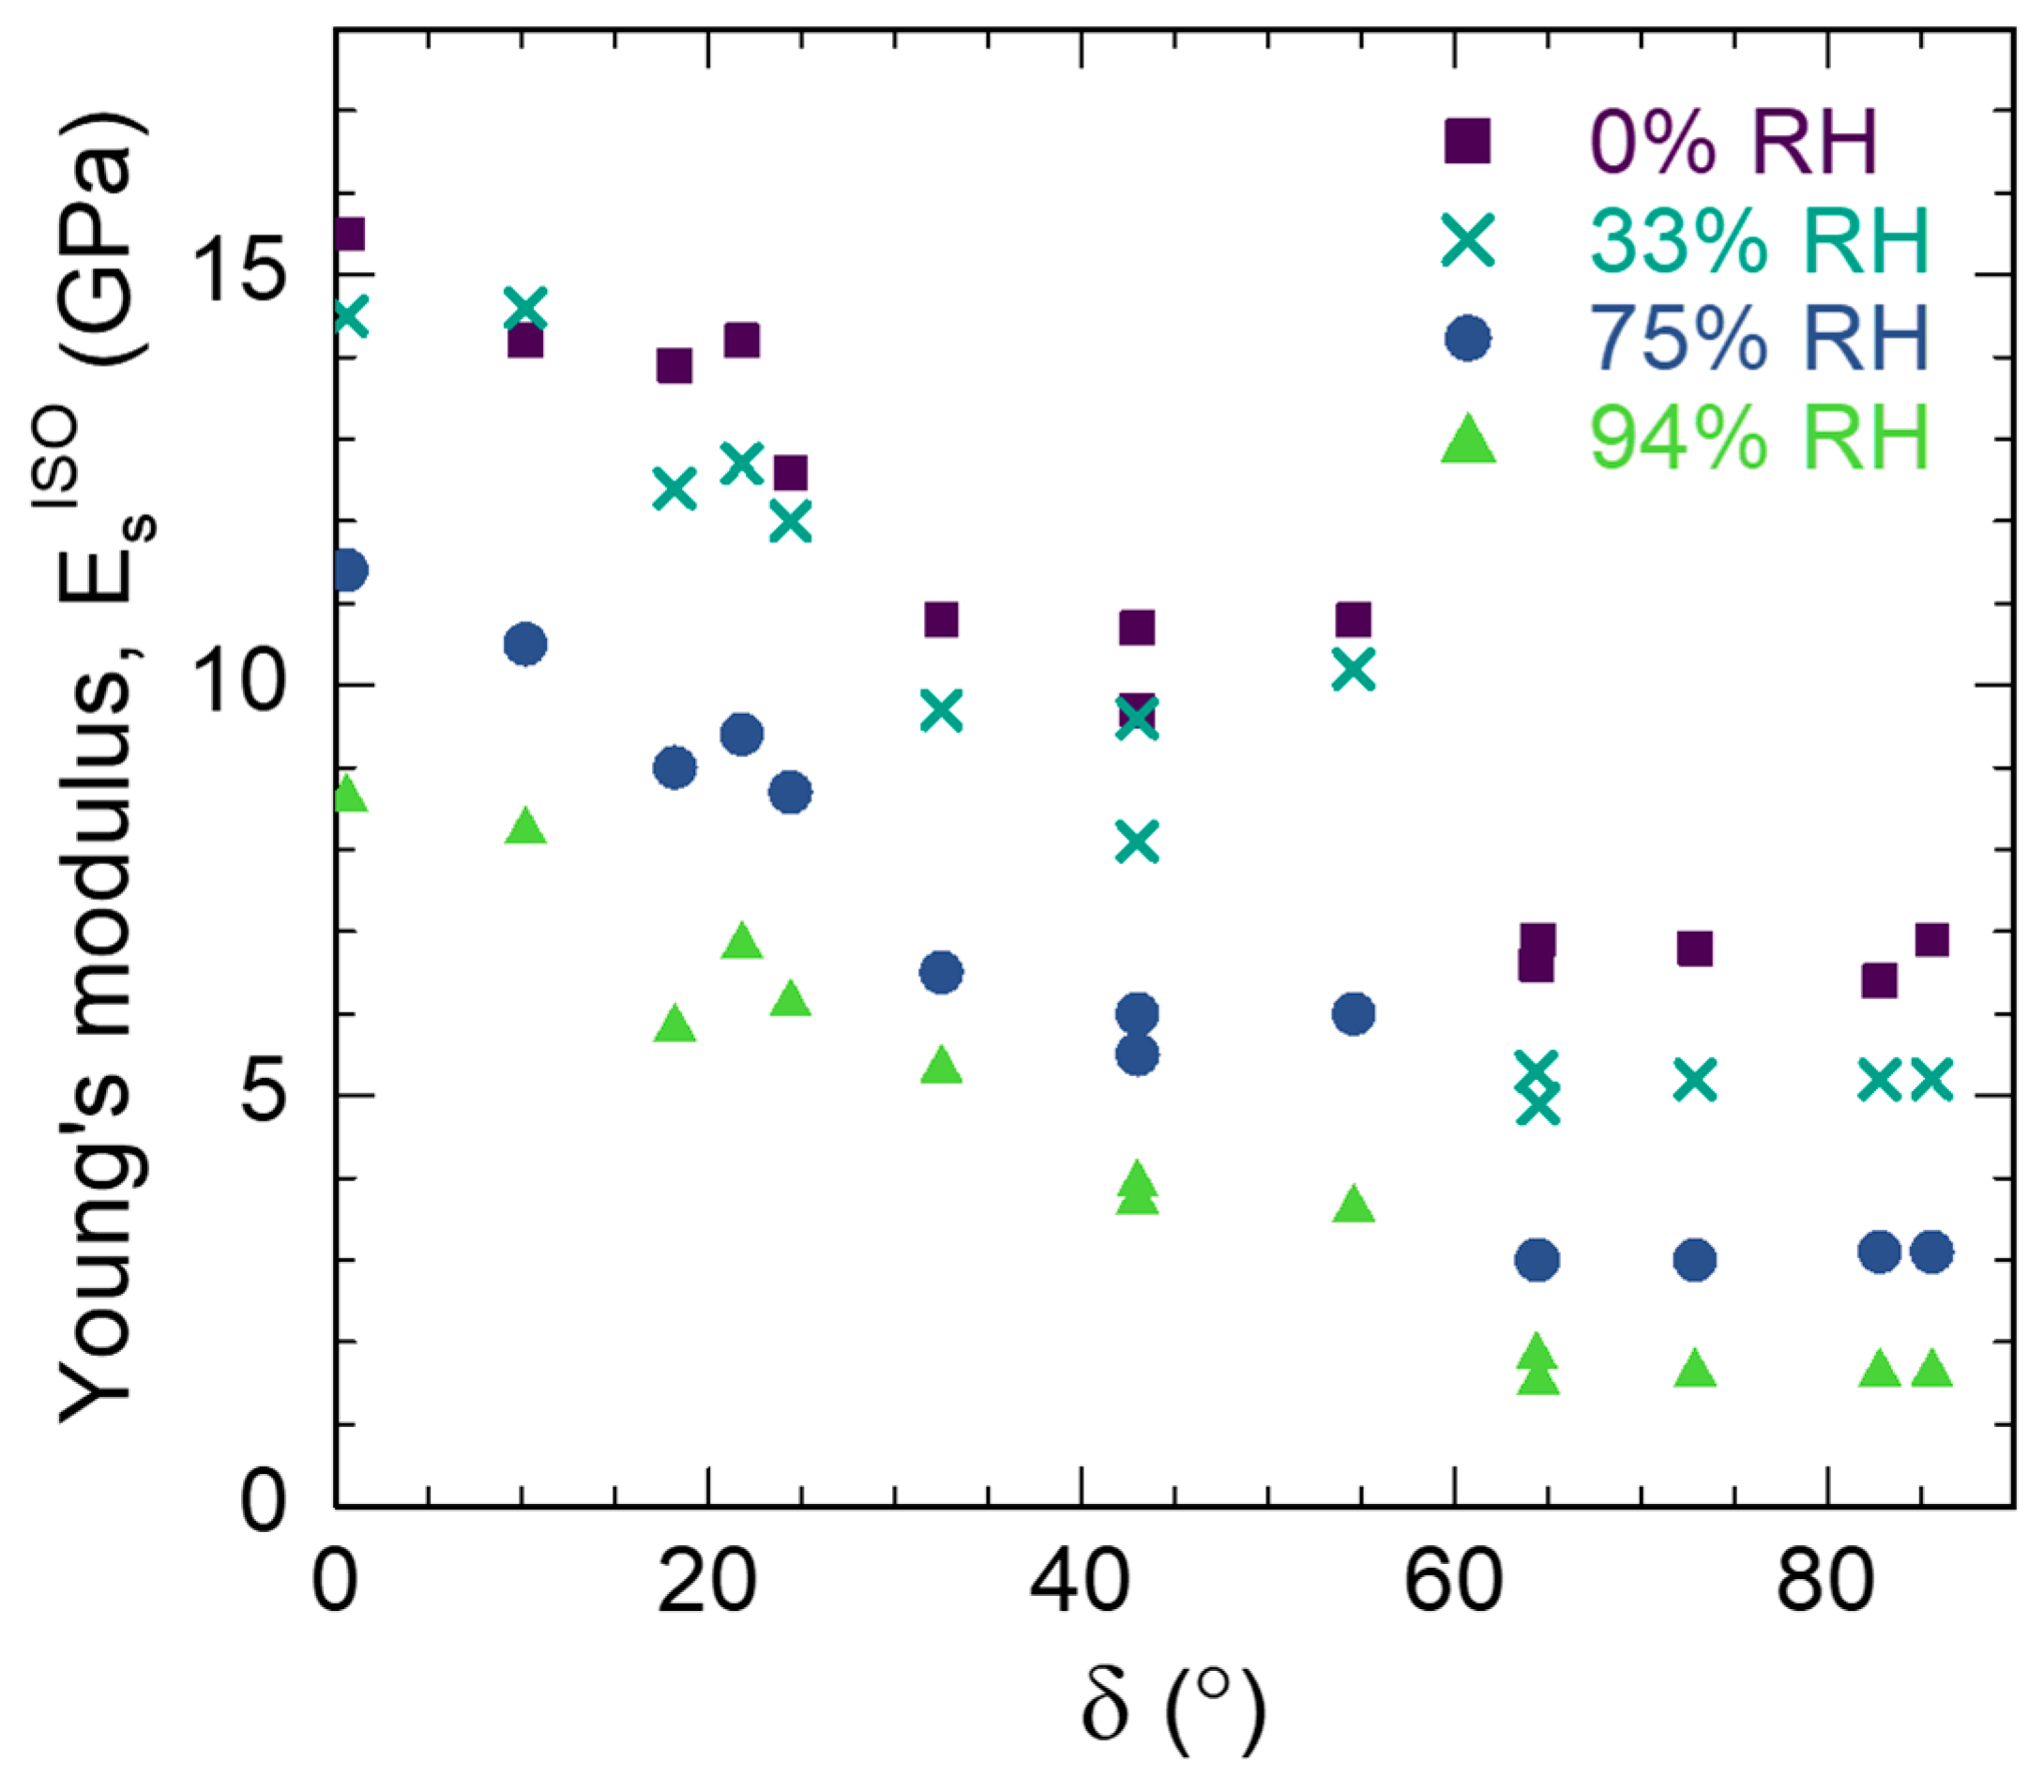
For comparison, E s I S O calculated using Equation (2) are given in Table 5 and plotted in Figure 7. The E s I S O assumes the material tested is elastically isotropic. E s I S O follows similar trends as M with regards to δ and RH but is systematically lower because E s I S O accounts for the S2 layer Poisson’s ratio and the elastic properties of the diamond indenter as shown in Equation (2). For the lowest value of δ , which would be closest to measuring in the direction parallel to the cellulose fibril longitudinal axis, the values of E l were 40%–75% higher than E s I S O across the different values of RH. For the transverse direction at the highest δ , E l were 15%–40% lower than E s I S O . These discrepancies demonstrate the necessity of measuring M − δ and fitting the results to a transverse isotropic elasticity model to more accurately obtain the S2 layer E l and E t . The fitting was necessary because even for carefully aligned experiments, individual values of E s I S O are not expected to measure a single elastic constant because of the Berkovich probe geometry. The Berkovich probe is a blunt three-sided pyramid with a 65.27° angle between its vertical axis and pyramid faces [21,52]. The forces exerted by the probe as it is pressed into a material are multidirectional. Therefore, when testing an anisotropic material like the S2 layer the E s I S O will be influenced by all the anisotropic elastic constants.
Nanoindentation experiments on wood cell walls in the literature typically report elastic modulus values calculated similar to how E s I S O was calculated in this study. Therefore, the E s I S O results in Table 5 and Figure 7 could be compared to results from previous studies on the S2 layer that examined the effects of changes in δ or moisture content. The trends with δ and moisture in this study were consistent with the literature results and our values compared generally well considering the differences between studies in wood types, sample preparation methods, and nanoindentation protocols. In the literature, all experiments discussed below were performed on surfaces prepared in the transverse plane of bulk wood. Therefore, the reported MFA values are equivalent to the δ defined in this study. Gindl and coworkers measured the effects of MFA on nanoindentation elastic modulus by testing both normal and reaction wood in spruce [58]. For S2 layers with MFA ranging from 0° to 50°, they reported a decrease in elastic modulus from 17.5 GPa to 8 GPa. Wanju and coworkers tested Masson pine (Pinus massoniana Lamb) specimens with an MFA of 16°, 27°, or 38° at 20% RH, 40% RH, and 60% RH [14]. They reported an elastic modulus decrease from 17.6 GPa to 13.8 GPa going from an MFA of 16° to 38° at 20% RH. From 20% RH to 60% RH, they reported decreases in elastic moduli of 7%, 12%, and 6% for MFAs of 16°, 27°, and 38°, respectively. Yu and coworkers tested Masson pine from 20% RH to 70% RH and reported a decrease in elastic modulus from 20 GPa to 17 GPa over that range [12]. Spruce wood was tested by Bertinetti and coworkers from 6% RH to 79% RH, and they reported that the elastic modulus decreased from 21 GPa down to 13 GPa [10]. Meng and coworkers tested loblolly pine from dry conditions to 36% RH and reported a decrease in elastic modulus from 13.9 GPa to 9.4 GPa [13].

3.4. S2 Layer Hardness Properties

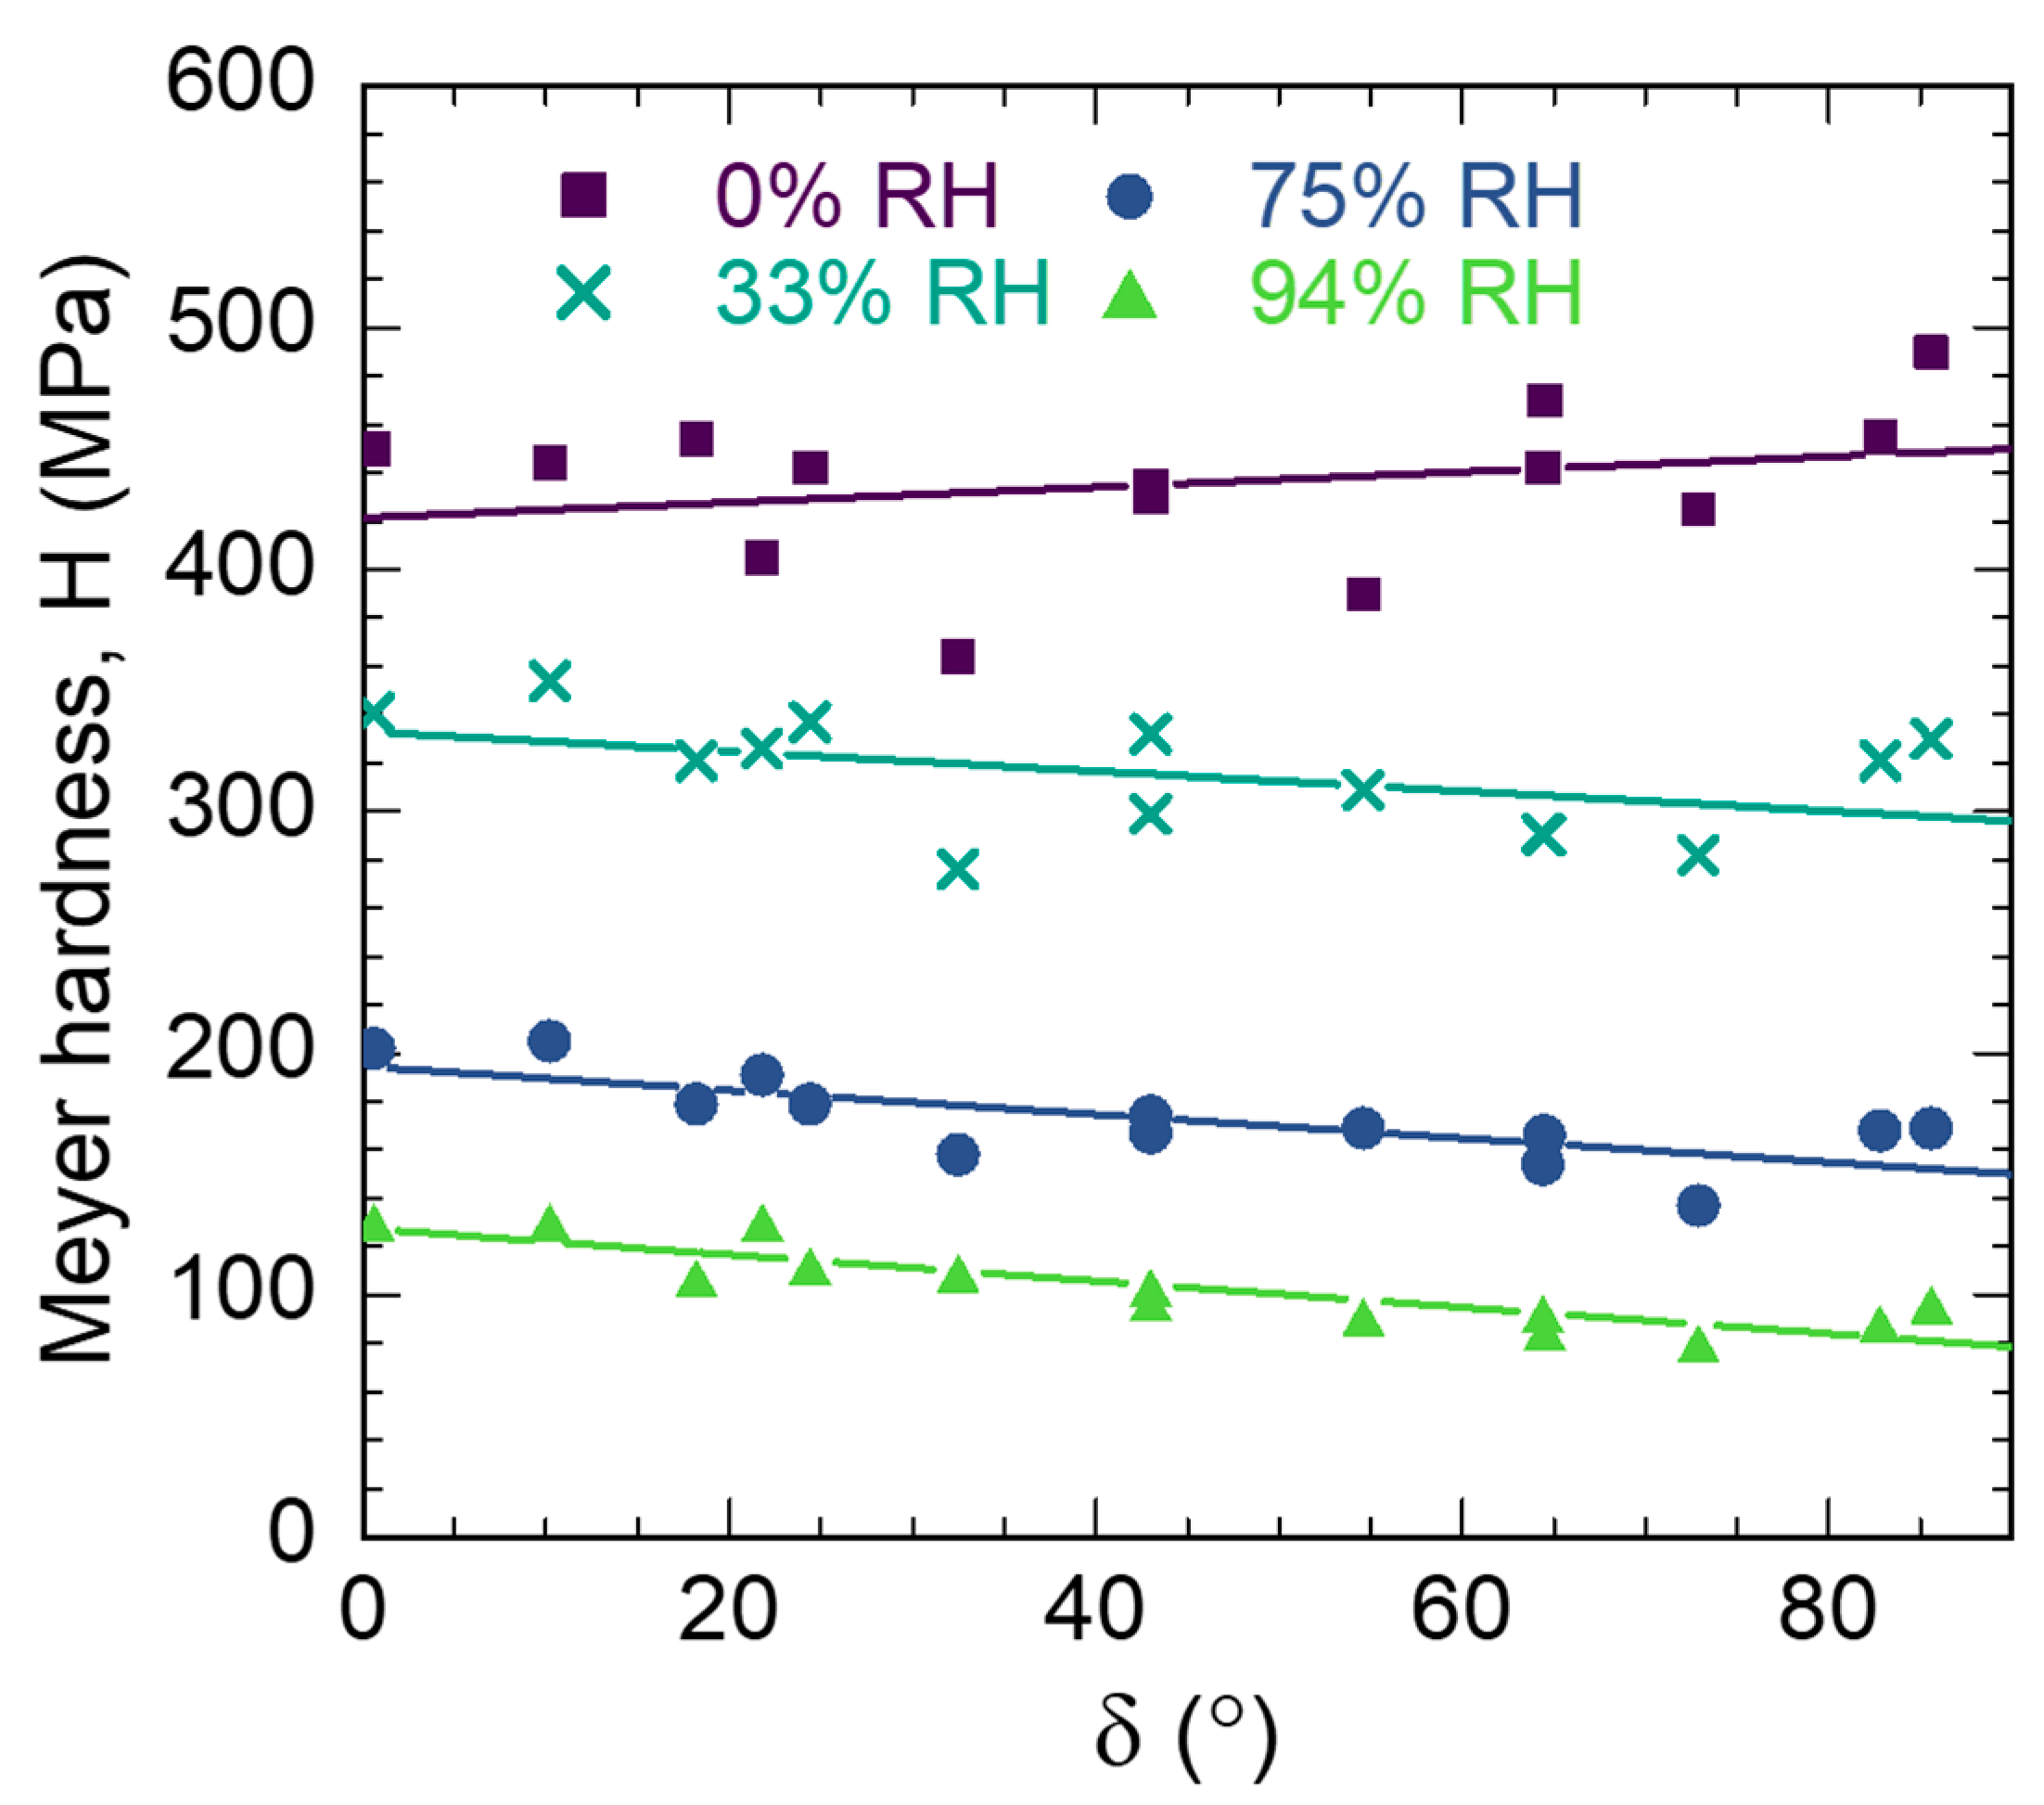
Meyer hardness H was also assessed during the Berkovich nanoindentation experiments. The H values as a function of δ and RH are in Table 6 and Figure 8. From 0% RH to 94% RH, moisture-induced plasticization caused softening and for a given δ the H decreased between 68% and 82% with the general trend of more softening at higher δ . The dependence of H on δ was not as obvious as for the elastic properties. This is consistent with previous work that could not detect an orientation dependence in H when testing wood on the transverse plane with MFAs between 0° and 50° [14,58]. The lack of orientation dependence has been attributed to the suggestion that plastic yielding, and therefore H , in the S2 layer is dominated by shear failures in the matrix polymers [59,60,61]. Plasticity has less orientation dependence compared to elasticity because the matrix polymers are often considered nearly isotropic compared to the highly anisotropic cellulose fibrils dominating the elastic properties. However, based on the standard error from a least squares analysis for straight-line fits to the H –δ data from each RH level, the data at 0% RH did not depend on δ whereas H did have meaningful decreases with increasing δ for the 33%, 74%, and 95% RH data. This suggests that there is some orientation dependence in the S2 layer plastic properties that should be studied in more detail in future studies.
The values of H and their moisture dependence reported in this study was within the ranges of values reported in previous studies. The hardness values discussed below are from the same studies that were used to compare to E s I S O in the previous section. The Masson pine specimens with an MFA of 16°, 27°, or 38° tested by Wanju and coworkers from 20% RH to 60% RH had an average decrease in H from 430 MPa to 350 MPa [14]. The hardness of Masson pine S2 layers tested from 20% RH to 70% RH by Yu and coworkers decreased from 650 to 450 MPa [12]. Bertinetti and coworkers tested Spruce wood from 6% RH to 79% RH and they found hardness to decrease from 600 MPa to 200 MPa over that range of RH [10]. The loblolly pine tested from dry conditions to 36% RH by Meng and coworkers decreased from 575 MPa to 300 MPa [13].

3.5. Coefficient of Variation Analysis

The coefficient of variation (COV), defined as the standard deviation divided by the average multiplied by 100%, is useful to better understand the variability in these nanoindentation measurements. To detect whether RH conditions affected variability, the average COV’s at each RH were calculated for M and H using the data in Table 3 and Table 6, respectively. For M , the average COV’s for 0%, 33%, 75%, and 94% RH were 9%, 9%, 12%, and 11%, respectively. And for H , the average COV’s for 0%, 33%, 75%, and 94% RH were 7%, 7%, 9%, and 10%, respectively. Only small increases in COV were observed at the higher RH values, which supported that reliable measurements could be made even under high RH conditions and that the experimental variability did not depend on the environmental conditions.

4. Conclusions

Nanoindentation was used to assess the S2 layer transverse isotropic elastic constants and orientation-dependent H at 0%, 33%, 75%, and 94% RH. The transvers isotropic elastic constants E l , E t and G t l were determined by numerically fitting the M − δ results to a theoretical model. An analysis of error plots revealed that over a large range of property values the best numerical fits determined by error minimization were unique. Furthermore, E t and E l were less sensitive to changes in its property value than G t l . G t t was also calculated using E t and the assumed 0.3 value for ν t t . Although no other experimental values are available to directly compare the RH-dependent elastic constants calculated in this work, the trends of S2 layer E l and E t with RH were consistent with those observed for the longitudinal and transverse directions in bulk wood. The results also found that G t l was much higher G t t . The H was greatly plasticized at higher RH, but showed much less orientation dependence than M. The H results supported that plasticity in the cell wall is mostly dominated by the properties of the matrix polymers and less sensitive than M to the orientation of the stiff cellulose microfibrils.

Supplementary Materials

The following supporting information can be downloaded at: https://www.mdpi.com/article/10.3390/f16050712/s1, Figures S1–S4: Error contour maps for 0%, 33%, 75%, and 94% RH experiments.

Author Contributions

Conceptualization, X.A.-V., J.E.J., R.L. and D.S.S.; methodology, X.A.-V., J.E.J. and N.Z.P.; formal analysis, X.A.-V., J.E.J., N.Z.P., D.S.S., N.J.B. and Y.W.; data curation, X.A.-V., N.Z.P. and J.E.J.; writing—original draft preparation, X.A.-V. and J.E.J.; writing—review and editing, X.A.-V., J.E.J., N.Z.P., N.J.B., Y.W., R.L. and D.S.S.; visualization, X.A.-V. and J.E.J.; supervision, J.E.J., R.L. and D.S.S.; funding acquisition, J.E.J., R.L. and D.S.S. All authors have read and agreed to the published version of the manuscript.

Funding

This research was supported in part by the U.S. Department of Agriculture, Forest Service. Support for X.A.-V. was provided by the Graduate Engineering Research Scholars (GERS) program at UW-Madison and USDA Forest Service grants 14-JV-11111129-063, 18-JV-11111129-036, and 22-JV-11111129-029.

Data Availability Statement

Data can be made available upon reasonable request to the corresponding author.

Acknowledgments

Thank you to Christopher Hunt of Forest Products Laboratory and Bill Thomas of Shuqualak Lumber for sourcing the Pinus taeda. The FPL Machine Shop is acknowledged for manufacturing the custom-built humidity chamber used in the WAXD experiments and the aluminum sample holders for the nanoindentation specimens. The authors also gratefully acknowledge use of facilities and instrumentation in the UW-Madison Wisconsin Center for Nanoscale Technology. The Center (wcnt.wisc.edu) is partially supported by the Wisconsin Materials Research Science and Engineering Center (NSF DMR-2309000) and the University of Wisconsin-Madison.

Conflicts of Interest

The authors declare no conflicts of interest. The funders had no role in the design of the study; in the collection, analyses, or interpretation of data; in the writing of the manuscript; or in the decision to publish the results.

Abbreviations

The following abbreviations are used in this manuscript:
CMLCompound middle lamella
LBulk wood longitudinal direction
LS2S2 layer longitudinal direction
MFAMicrofibril angle
RBulk wood radial direction
RHRelative humidity
SPMScanning probe microscopy
TS2 layer tangential direction
WAXDWide angle X-ray Diffraction

References

  1. Hofstetter, K.; Gamstedt, E.K. Hierarchical modelling of microstructural effects on mechanical properties of wood. A review COST Action E35 2004–2008: Wood machining—Micromechanics and fracture. Holzforschung 2009, 63, 130–138. [Google Scholar] [CrossRef]
  2. Salmen, L.; Burgert, I. Cell wall features with regard to mechanical performance. A review. COST Action E35 2004-2008: Wood machining—Micromechanics and fracture. Holzforschung 2009, 63, 121–129. [Google Scholar] [CrossRef]
  3. Terashima, N.; Kitano, K.; Kojima, M.; Yoshida, M.; Yamamoto, H.; Westermark, U. Nanostructural assembly of cellulose, hemicellulose, and lignin in the middle layer of secondary wall of ginkgo tracheid. J. Wood Sci. 2009, 55, 409–416. [Google Scholar] [CrossRef]
  4. Cramer, S.; Kretschmann, D.; Lakes, R.; Schmidt, T. Earlywood and latewood elastic properties in loblolly pine. Holzforschung 2005, 59, 531–538. [Google Scholar] [CrossRef]
  5. Mott, L.; Groom, L.; Shaler, S. Mechanical Properties Of Individual Southern Pine Fibers. Part II. Comparison Of Earlywood And Latewood Fibers With Respect To Tree Height And Juvenility. Wood Fiber Sci. 2002, 34, 221–237. [Google Scholar]
  6. Salmén, L. Wood morphology and properties from molecular perspectives. Ann. For. Sci. 2015, 72, 679–684. [Google Scholar] [CrossRef]
  7. Fahlén, J.; Salmén, L. On the Lamellar Structure of the Tracheid Cell Wall. Plant Biol. 2002, 4, 339–345. [Google Scholar] [CrossRef]
  8. Green, D.W.; Kretschmann, D.E. Moisture Content and the Properties of Clear Southern Pine; Forest Products Laboratory Research Paper; FPL–RP–531-FPL–RP–531; U.S. Department of Agriculture, Forest Service, Forest Products Laboratory: Madison, WI, USA, 1994.
  9. Kretschmann, D. Mechanical Properties of Wood. In Wood Handbook—Wood as an Engineering Material; GTR-190; USDA: Washington, DC, USA, 2010; pp. 1–46. Available online: https://research.fs.usda.gov/treesearch/37427 (accessed on 21 April 2025).
  10. Bertinetti, L.; Hangen, U.D.; Eder, M.; Leibner, P.; Fratzl, P.; Zlotnikov, I. Characterizing moisture-dependent mechanical properties of organic materials: Humidity-controlled static and dynamic nanoindentation of wood cell walls. Philos. Mag. 2015, 95, 1992–1998. [Google Scholar] [CrossRef]
  11. Youssefian, S.; Jakes, J.E.; Rahbar, N. Variation of Nanostructures, Molecular Interactions, and Anisotropic Elastic Moduli of Lignocellulosic Cell Walls with Moisture. Sci. Rep. 2017, 7, 2054. [Google Scholar] [CrossRef]
  12. Yu, Y.; Fei, B.; Wang, H.; Tian, G. Longitudinal mechanical properties of cell wall of Masson pine (Pinus massoniana Lamb) as related to moisture content: A nanoindentation study. Holzforschung 2011, 65, 121–126. [Google Scholar] [CrossRef]
  13. Meng, Y.; Xia, Y.; Young, T.M.; Cai, Z.; Wang, S. Viscoelasticity of wood cell walls with different moisture content as measured by nanoindentation. RSC Adv. 2015, 5, 47538–47547. [Google Scholar] [CrossRef]
  14. Wanju, L.; Wang, H.; Hao, W.; Yu, Y. Moisture dependence of indentation deformation and mechanical properties of Masson pine (Pinus massoniana lamb) cell walls as related to microfibril angle. Wood Fiber Sci. 2014, 46, 228–236. [Google Scholar]
  15. Gibson, L.J.; Ashby, M.F. Cellular Solids: Structure and Properties, 2nd ed.; Cambridge University Press: Cambridge, UK; New York, NY, USA, 1997. [Google Scholar]
  16. Hunt, C.G.; Frihart, C.R.; Dunky, M.; Rohumaa, A. Understanding Wood Bonds–Going Beyond What Meets the Eye: A Critical Review. Rev. Adhes. Adhes. 2018, 6, 369–440. [Google Scholar] [CrossRef]
  17. Esteves, B.; Pereira, H. Wood Modification by Heat Treatment: A Review. BioResources 2008, 4, 370–404. [Google Scholar] [CrossRef]
  18. Jäger, A.; Bader, T.; Hofstetter, K.; Eberhardsteiner, J. The relation between indentation modulus, microfibril angle, and elastic properties of wood cell walls. Compos. Part A Appl. Sci. Manuf. 2011, 42, 677–685. [Google Scholar] [CrossRef]
  19. Jäger, A.; Hofstetter, K.; Buksnowitz, C.; Gindl-Altmutter, W.; Konnerth, J. Identification of stiffness tensor components of wood cell walls by means of nanoindentation. Compos. Part A Appl. Sci. Manuf. 2011, 42, 2101–2109. [Google Scholar] [CrossRef]
  20. Fischer-Cripps, A.C. Nanoindentation, 2nd ed.; Springer: New York, NY, USA, 2004; p. 264. [Google Scholar]
  21. Vlassak, J.J.; Ciavarella, M.; Barber, J.R.; Wang, X. The indentation modulus of elastically anisotropic materials for indenters of arbitrary shape. J. Mech. Phys. Solids 2003, 51, 1701–1721. [Google Scholar] [CrossRef]
  22. Kim, J.-W.; Harper, D.P.; Taylor, A.M. Technical Note: Effect of Epoxy Embedment on Micromechanical Properties of Brown-Rot-Decayed Wood Cell Walls Assessed with Nanoindentation. Wood Fiber Sci. 2012, 44, 103–107. [Google Scholar]
  23. Meng, Y.; Wang, S.; Cai, Z.; Young, T.M.; Du, G.; Li, Y. A novel sample preparation method to avoid influence of embedding medium during nano-indentation. Appl. Phys. A 2012, 110, 361–369. [Google Scholar] [CrossRef]
  24. Majstorović, F.; Hirschmann, E.; Butterling, M.; Attallah, A.G.; Wagner, A.; Jakes, J.E. Positrons as microprobes to study water-dependent free volume of wood cell walls: A preliminary study. Cellulose 2025, 32, 2779–2791. [Google Scholar] [CrossRef]
  25. Arzola-Villegas, X.; Báez, C.; Lakes, R.; Stone, D.S.; O’Dell, J.; Shevchenko, P.; Xiao, X.; De Carlo, F.; Jakes, J.E. Convolutional Neural Network for Segmenting Micro-X-ray Computed Tomography Images of Wood Cellular Structures. Appl. Sci. 2023, 13, 8146. [Google Scholar] [CrossRef]
  26. Schindelin, J.; Arganda-Carreras, I.; Frise, E.; Kaynig, V.; Longair, M.; Pietzsch, T.; Preibisch, S.; Rueden, C.; Saalfeld, S.; Schmid, B.; et al. Fiji: An open-source platform for biological-image analysis. Nat. Methods 2012, 9, 676–682. [Google Scholar] [CrossRef]
  27. Jakes, J.E.; Stone, D.S. Best Practices for Quasistatic Berkovich Nanoindentation of Wood Cell Walls. Forests 2021, 12, 1696. [Google Scholar] [CrossRef]
  28. Jakes, J.E. Improved methods for nanoindentation Berkovich probe calibrations using fused silica. J. Mater. Sci. 2018, 53, 4814–4827. [Google Scholar] [CrossRef]
  29. Stone, D.S.; Yoder, K.B.; Sproul, W.D. Hardness and elastic modulus of TiN based on continuous indentation technique and new correlation. J. Vac. Sci. Technol. A (Vac. Surf. Film.) 1991, 9, 2543–2547. [Google Scholar] [CrossRef]
  30. Jakes, J.E.; Hunt, C.G.; Yelle, D.J.; Lorenz, L.F.; Hirth, K.; Gleber, S.-C.; Vogt, S.; Grigsby, W.; Frihart, C.R. Synchrotron-based X-ray fluorescence microscopy in conjunction with nanoindentation to study molecular-scale interactions of phenol-formaldehyde in wood cell walls. ACS Appl. Mater. Interfaces 2015, 7, 6584–6589. [Google Scholar] [CrossRef]
  31. Jakes, J.E.; Frihart, C.R.; Beecher, J.F.; Moon, R.J.; Stone, D.S. Experimental method to account for structural compliance in nanoindentation measurements. J. Mater. Res. 2008, 23, 1113–1127. [Google Scholar] [CrossRef]
  32. Oliver, W.C.; Pharr, G.M. Improved technique for determining hardness and elastic modulus using load and displacement sensing indentation experiments. J. Mater. Res. 1992, 7, 1564–1580. [Google Scholar] [CrossRef]
  33. SRM 640e; Line Position and Line Shape Standard for Powder Diffraction (Silicon Powder). National Institute of Standards and Technology; U.S. Department of Commerce: Gaithersburg, MD, USA, 2015.
  34. Knudsen, E.B.; Sørensen, H.O.; Wright, J.P.; Goret, G.; Kieffer, J. FabIO: Easy access to two-dimensional X-ray detector images in Python. J. Appl. Crystallogr. 2013, 46, 537–539. [Google Scholar] [CrossRef]
  35. Newville, M.; Stensitzki, T.; Allen, D.B.; Ingargiola, A. Non-Linear Least-Square Minimization and Curve-Fitting for Python. Version 1.0.3 Zenodo. Switzerland. 14 October 2021. Available online: https://zenodo.org/records/5570790 (accessed on 21 April 2025).
  36. Plaza, N. Automated Python Script for the Microfibril Angle Calculation from 2D Wide-Angle X-Ray Diffraction Data from Wood. Zenodo. Switzerland. 6 March 2020. Available online: https://zenodo.org/records/3699590 (accessed on 21 April 2025).
  37. Lichtenegger, H.C.; Reiterer, A.; Stanzl-Tschegg, S.E.; Fratzl, P. Comment about “The measurement of the micro-fibril angle in soft-wood” by K. M. Entwistle and N. J. Terrill. J. Mater. Sci. Lett. 2001, 20, 2245–2247. [Google Scholar] [CrossRef]
  38. Penttilä, P.A.; Altgen, M.; Carl, N.; van der Linden, P.; Morfin, I.; Österberg, M.; Schweins, R.; Rautkari, L. Moisture-related changes in the nanostructure of woods studied with X-ray and neutron scattering. Cellulose 2020, 27, 71–87. [Google Scholar] [CrossRef]
  39. Leppänen, K.; Bjurhager, I.; Peura, M.; Kallonen, A.; Suuronen, J.-P.; Penttilä, P.; Love, J.; Fagerstedt, K.; Serimaa, R. X-ray scattering and microtomography study on the structural changes of never-dried silver birch, European aspen and hybrid aspen during drying. Holzforschung 2011, 65, 865–873. [Google Scholar] [CrossRef]
  40. Lube, V.; Lazarescu, C.; Mansfield, S.D.; Avramidis, S. Wood microfibril angle variation after drying. Holzforschung 2016, 70, 485–488. [Google Scholar] [CrossRef]
  41. Harrington, J.J.; Astley, R.J.; Booker, R. Modelling the elastic properties of softwood. Eur. J. Wood Wood Prod. 1998, 56, 37–41. [Google Scholar] [CrossRef]
  42. Ferry, J.D. Viscoelastic Properties of Polymers, 3rd ed.; John Wiley & Sons Inc.: New York, NY, USA, 1980; p. 641. [Google Scholar]
  43. Apicella, A.; Tessieri, R.; de Cataldis, C. Sorption modes of water in glassy epoxies. J. Membr. Sci. 1984, 18, 211–225. [Google Scholar] [CrossRef]
  44. Frisch, H.L. Sorption and transport in glassy polymers-a review. Polym. Eng. Sci. 1980, 20, 2–13. [Google Scholar] [CrossRef]
  45. Hodge, R.M.; Bastow, T.J.; Edward, G.H.; Simon, G.P.; Hill, A.J. Free volume and the mechanism of plasticization in water-swollen poly(vinyl alcohol). Macromolecules 1996, 29, 8137–8143. [Google Scholar] [CrossRef]
  46. Fernandes, A.N.; Thomas, L.H.; Altaner, C.M.; Callow, P.; Forsyth, V.T.; Apperley, D.C.; Kennedy, C.J.; Jarvis, M.C. Nanostructure of cellulose microfibrils in spruce wood. Proc. Natl. Acad. Sci. USA 2011, 108, E1195–E1203. [Google Scholar] [CrossRef]
  47. Cousins, W.J. Elastic modulus of lignin as related to moisture content. Wood Sci. Technol. 1976, 10, 9–17. [Google Scholar] [CrossRef]
  48. Cousins, W.J. Young’s modulus of hemicellulose as related to moisture content. Wood Sci. Technol. 1978, 12, 161–167. [Google Scholar] [CrossRef]
  49. Salmén, L. Micromechanical understanding of the cell-wall structure. Comptes Rendus Biol. 2004, 327, 873–880. [Google Scholar] [CrossRef] [PubMed]
  50. Horvath, L.; Peralta, P.; Peszlen, I.; Csoka, L.; Horvath, B.; Jakes, J. Modeling hygroelastic properties of genetically modified aspen. Wood Fiber Sci. 2012, 44, 22–35. [Google Scholar]
  51. Müller, U.; Sretenovic, A.; Gindl, W.; Teischinger, A. Longitudinal shear properties of European larch wood related to cell-wall structure. Wood Fiber Sci. 2004, 36, 143–151. [Google Scholar]
  52. Gindl, W.; Schoberl, T. The significance of the elastic modulus of wood cell walls obtained from nanoindentation measurements. Compos. Part A Appl. Sci. Manuf. 2004, 35, 1345–1349. [Google Scholar] [CrossRef]
  53. Kulasinski, K.; Derome, D.; Carmeliet, J. Impact of hydration on the micromechanical properties of the polymer composite structure of wood investigated with atomistic simulations. J. Mech. Phys. Solids 2017, 103, 221–235. [Google Scholar] [CrossRef]
  54. Zhang, C.; Chen, M.; Keten, S.; Coasne, B.; Derome, D.; Carmeliet, J. Hygromechanical mechanisms of wood cell wall revealed by molecular modeling and mixture rule analysis. Sci. Adv. 2021, 7, eabi8919. [Google Scholar] [CrossRef]
  55. Bondeson, D.; Mathew, A.; Oksman, K. Optimization of the isolation of nanocrystals from microcrystalline cellulose by acid hydrolysis. Cellulose 2006, 13, 171–180. [Google Scholar] [CrossRef]
  56. Moon, R.J.; Martini, A.; Nairn, J.; Simonsen, J.; Youngblood, J. Cellulose nanomaterials review: Structure, properties and nanocomposites. Chem. Soc. Rev. 2011, 40, 3941–3994. [Google Scholar] [CrossRef]
  57. Nishiyama, Y. Structure and properties of the cellulose microfibril. J. Wood Sci. 2009, 55, 241–249. [Google Scholar] [CrossRef]
  58. Gindl, W.; Gupta, H.S.; Schoberl, T.; Lichtenegger, H.C.; Fratzl, P. Mechanical properties of spruce wood cell walls by nanoindentation. Appl. Phys. A Mater. Sci. Process. 2004, A79, 2069–2073. [Google Scholar] [CrossRef]
  59. Fratzl, P.; Burgert, I.; Keckes, J. Mechanical model for the deformation of the wood cell wall. Z. Für Met. 2004, 95, 579–584. [Google Scholar] [CrossRef]
  60. Hofstetter, K.; Hellmich, C.; Eberhardsteiner, J.; Mang, H.A. Micromechanical Estimates for Elastic Limit States in Wood Materials, Revealing Nanostructural Failure Mechanisms. Mech. Adv. Mater. Struct. 2008, 15, 474–484. [Google Scholar] [CrossRef]
  61. Keckes, J.; Burgert, I.; Fruhmann, K.; Muller, M.; Kolln, K.; Hamilton, M.; Burghammer, M.; Roth, S.V.; Stanzl-Tschegg, S.; Fratzl, P. Cell-wall recovery after irreversible deformation of wood. Nat. Mater. 2003, 2, 810–813. [Google Scholar] [CrossRef] [PubMed]
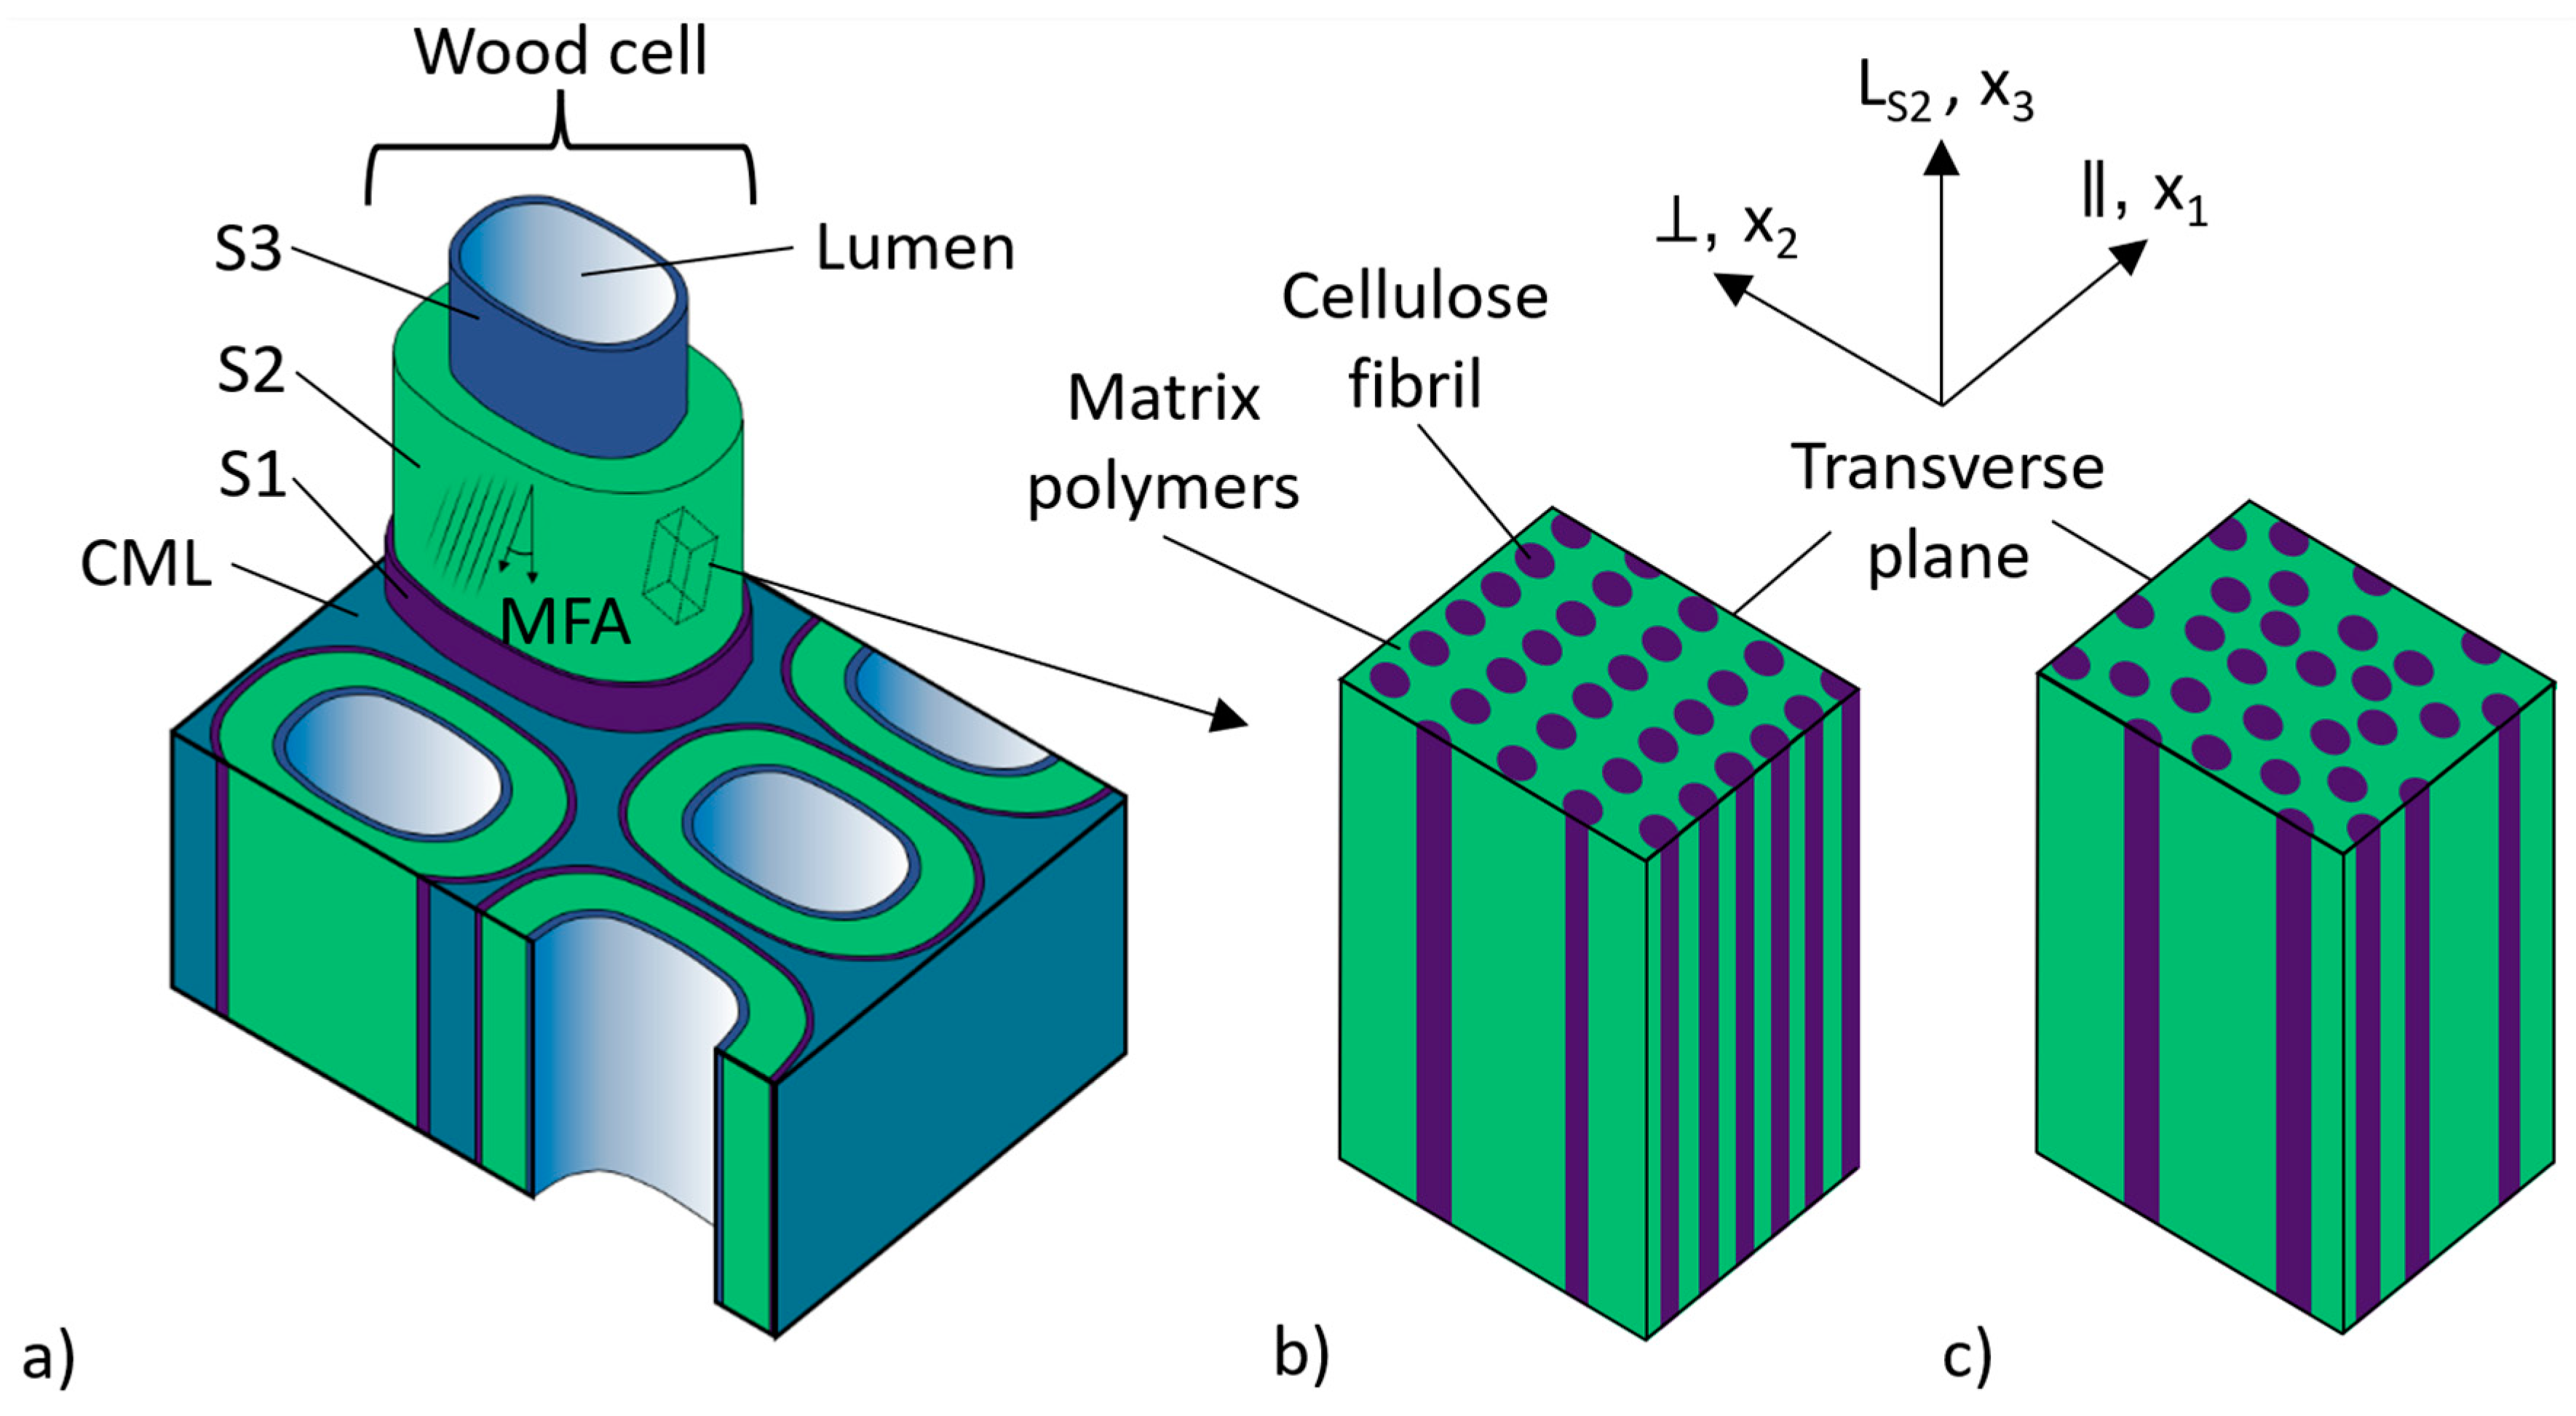
Figure 1. Schematics of (a) wood microstructure and the S2 secondary cell wall layer nanostructure with cellulose fibrils (b) organized in concentric lamellae [7] and (c) randomly distributed in the transverse plane. Normal wood cell walls, including tracheids in softwoods and fiber cells in hardwoods, consist of the three secondary cell wall layers S1, S2, and S3. Wood cells are held together by the lignin-rich compound middle lamella (CML). The microfibril angle (MFA) defines the angle at which the cellulose fibrils are helically wound in the secondary cell wall layers. In the S2 layer, the longitudinal direction is aligned with the cellulose fibrils’ longitudinal axes (LS2) and directions parallel (‖) and perpendicular (⊥) to the lumen surface in the transverse plane are indicated. In this work, the S2 layer was assumed to be a transversely isotropic material in a Cartesian coordinate system x 1 ,   x 2 ,   x 3 with the axis of rotational symmetry ( x 3 ) parallel to LS2. The plane of isotropy, defined by the x 1 and x 2 axes, was normal to the x 3 axis. The transversely isotropic material assumption implies that the cellulose fibrils were randomly distributed within the plane of isotropy, as shown schematically in (c).
Forests 16 00712 g001
Figure 2. Schematics of how wood specimens were cut and mounted for nanoindentation experiments relative to the wood longitudinal (L), radial (R), and tangential (T) directions. (a) Seven specimens were cut from a single piece of latewood, with the same microtomed R–L surfaces bonded to the holders. For specimens 1–6 (b,c), the L direction was bonded parallel to the striation direction when viewed from the front. The striation direction was parallel to the aluminum cylinder’s long axis. For specimen 7 (d,e), the wood L direction was perpendicular to the striation direction when viewed from the front.
Forests 16 00712 g002
Figure 3. Schematics showing how α i and β i angles were calculated for sides A and B in Specimens 1–6 using the experimentally measured values of microfibril angle (MFA), α , and β . (a) The indentation and striation directions on the aluminum cylinder were parallel and the positive and negative directions for α and β are defined as shown. (b) Anatomical orientations of the wood block bonded to a 0° specimen holder. (c) An approximately radial (R)-tangential (T) plane of wood showing the compound middle lamella (CML), lumina, and three secondary cell wall layers (S1, S2, and S3). The wood longitudinal (L) direction is approximately perpendicular to this plane. Nanoindentations were placed in the S2 layer on the tangential sides of neighboring tracheids within a row of daughter cells. Each side was consistently designated for specimens 1–6 as A or B. Looking at the front of the specimen, side A was the right-hand side of the double cell wall, and side B was at the left. The α i and β i were defined by the indentation direction and direction of the longitudinal axes of the cellulose fibrils in the S2 layer (LS2) and calculated as shown schematically for sides A and B.
Forests 16 00712 g003
Figure 4. Surface preparation and nanoindentations in Specimen 4 with a cylinder angle of θ = 45°. (a) Optical microscopy image of the prepared surface obtained using the top-down optics in the TriboIndenter. Scanning probe microscopy images of nanoindentations in the S2 layer of a double cell wall performed at (b) 0% RH and (c) 75% RH. The S2 layer, compound middle lamellae (CML), and empty lumina are indicated in the SPM images. SPM images show the slope shaded to better visualize the surface features.
Forests 16 00712 g004
Figure 5. Average indentation modulus ( M ) as a function of relative humidity (RH) and the angle between the nanoindentation direction and longitudinal axes of the cellulose microfibrils ( δ ). Lines are transverse isotropic elasticity model fits to the data at each RH.
Forests 16 00712 g005
Figure 6. The calculated S2 layer (a) longitudinal elastic modulus ( E l ), (b) transverse elastic modulus ( E t ), (c) axial shear modulus ( G t l ), and (d) transverse shear modulus ( G t t ) plotted as a function of relative humidity (RH). Error bars were determined from the error plots in Figures S1–S4 as described in the text. The upper limit of G t l at 94% RH was estimated based on the curvature of the contour because the R = 0.103 contour went out of range for G t l in Figure S4a.
Forests 16 00712 g006
Figure 7. Average indentation Young’s modulus ( E s I S O ) as a function of relative humidity (RH) and the angle between the nanoindentation direction and longitudinal axes of the cellulose microfibrils ( δ ). The E s I S O was calculated using the incorrect assumption that the S2 layer was elastically isotropic.
Forests 16 00712 g007
Figure 8. Average Meyer hardness ( H ) as a function of relative humidity (RH) and the angle between the nanoindentation direction and longitudinal axes of the cellulose microfibrils (δ). Lines are straight-line fits to the data at each RH. The slopes of the lines were 0.31 ± 0.33 (0% RH), −0.41 ± 0.22 (33% RH), −0.49 ± 0.13 (75% RH), and −0.54 ± 0.09 (94% RH) with uncertainties based on a least squares analysis for corresponding straight-line fits.
Forests 16 00712 g008
Table 1. Microfibril angle (MFA) measurements from the same latewood loblolly pine growth ring tested with nanoindentation. Uncertainties are standard deviations.
Relative Humidity
(%)
MFA
(°)
121.2 ± 1.3
3321.8 ± 0.6
7320.9 ± 1.5
9321.4 ± 1.2
Table 2. Measured values of α and β for each specimen and calculated values of α i , β i , and δ for sides A and B in each specimen.
SpecimenCylinder Angle (θ)
(°)
Side α (°) α i (°) β (°) β i (°) δ (°)
10A−1.4−1.4−3.1−24.424.4
B−1.4−1.4−3.118.218.2
211A1.71.711.2−10.110.2
B1.71.711.232.532.5
322.5A−0.5−0.521.70.40.6
B−0.5−0.521.74343.0
445A1.61.643.121.821.8
B1.61.643.164.464.4
567.5A0064.34343.0
B0064.385.685.6
679A0075.954.654.6
B0075.997.282.8
70A85.8107.10072.9
B85.864.50064.5
Table 3. Indentation modulus ( M ) as defined in Equation (1) for each RH condition and angle δ .
δ (°)0% RH33% RH75% RH94% RH
M (GPa) M (GPa) M (GPa) M (GPa)
n 1Ave 2Std 3nAveStdnAveStdnAveStd
0.66419.12.34817.91.46014.13.45210.81.2
10.26417.51.75618.02.46713.01.15010.31.1
18.26417.21.54815.31.56211.21.5637.31.3
21.85617.51.94815.71.88611.62.3718.61.3
24.48815.61.64814.91.46010.91.7617.71.0
32.56413.42.26412.12.1678.11.3716.81.2
43.05613.31.04011.90.6707.40.7365.00.4
43.05612.01.26510.11.2616.81.7454.70.5
54.66413.41.47212.72.3697.50.5544.60.9
64.4648.20.4656.60.5903.80.2542.30.2
64.5648.60.6586.10.3713.70.2452.00.2
72.9328.40.6326.40.5363.70.3182.10.1
82.8648.00.5726.40.3723.90.2632.10.2
85.6568.50.5566.40.2613.80.2902.20.1
1 n, number of unloading segments analyzed. 2 Ave, average. 3 Std, standard deviation.
Table 4. Transverse isotropic elastic constants E l , E t , G t l , and G t t determined at each relative humidity by fitting the experimental M–δ results to the theoretical model of Vlassak and coworkers [21]. G t t was calculated using Equation (4). The associated error R values for the best fits were calculated using Equation (5).
Relative Humidity
(%)
E l
(GPa)
E t
(GPa)
G t l
(GPa)
G t t
(GPa)
R
021.55.98.12.30.074
3321.54.19.11.60.101
7519.22.36.30.90.082
9415.11.010.00.40.093
Table 5. Indentation Young’s modulus ( E s I S O ) as defined in Equation (2) for each RH condition and angle δ . The E s I S O was calculated using the incorrect assumption that the S2 layer was elastically isotropic.
δ (°)0% RH33% RH75% RH94% RH
E s I S O (GPa) E s I S O (GPa) E s I S O (GPa) E s I S O (GPa)
n 1Ave 2Std 3nAveStdnAveStdnAveStd
0.66415.51.84814.51.16011.42.7528.71.0
10.26414.21.45614.61.96710.50.9508.30.8
18.26413.91.24812.41.2629.01.2635.91.0
21.85614.21.54812.71.5869.41.8716.91.1
24.48812.61.34812.01.2608.71.3616.20.8
32.56410.81.8649.71.7676.51.0715.41.0
43.05610.70.8409.60.5706.00.6364.00.3
43.0569.70.9658.11.0615.51.3453.80.4
54.66410.81.17210.21.8696.00.4543.70.7
64.4646.60.3655.30.4903.00.2541.90.2
64.5646.90.4584.90.2713.00.2451.60.1
72.9326.80.5325.20.4363.00.2181.70.1
82.8646.40.4725.20.3723.10.2631.70.1
85.6566.90.4565.20.1613.10.2901.70.1
1 n, number of unloading segments analyzed. 2 Ave, average. 3 Std, standard deviation.
Table 6. Meyer hardness ( H ) as defined in Equation (3) for each RH condition and angle δ .
δ (°)0% RH33% RH75% RH94% RH
H (MPa) H (MPa) H (MPa) H (MPa)
n 1Ave 2Std 3nAveStdnAveStdnAveStd
0.66445039483412060202355213023
10.26444419563543067205215013017
18.26445427483211962179236310714
21.85640543483262886191267113018
24.48844228483372360179226111211
32.56436454642763367158197110917
43.0564352540332167017413361038
43.056430256529923611672445979
54.66439045723094469169954918
64.46444214652911890154954925
64.56447040582902371166845859
72.93242518322821536137618803
82.86445530723211272168763887
85.656490255633011611691490965
1 n, number of unloading segments analyzed. 2 Ave, average. 3 Std, standard deviation.
Disclaimer/Publisher’s Note: The statements, opinions and data contained in all publications are solely those of the individual author(s) and contributor(s) and not of MDPI and/or the editor(s). MDPI and/or the editor(s) disclaim responsibility for any injury to people or property resulting from any ideas, methods, instructions or products referred to in the content.