Article

Unveiling Key Factors Shaping Forest Interest and Visits: Toward Effective Strategies for Sustainable Forest Use

1
Department of Forest Management, Forestry and Forest Products Research Institute, Tsukuba 305-8687, Japan
2
Kansai Research Center, Forestry and Forest Products Research Institute, Kyoto 612-0855, Japan
3
Tama Forest Science Garden, Forestry and Forest Products Research Institute, Hachioji 193-0843, Japan
4
Tohoku Research Center, Forestry and Forest Products Research Institute, Morioka 020-0123, Japan
5
Shikoku Research Center, Forestry and Forest Products Research Institute, Kochi 780-8077, Japan
*
Author to whom correspondence should be addressed.
Forests 2025, 16(5), 714; https://doi.org/10.3390/f16050714
Submission received: 8 February 2025 / Revised: 29 March 2025 / Accepted: 18 April 2025 / Published: 23 April 2025
(This article belongs to the Special Issue Multiple-Use and Ecosystem Services of Forests—2nd Edition)

Abstract

:
This study investigates the factors influencing urban residents’ interest in and visits to forests and explores strategies to promote forest space utilization. A survey was conducted among 5000 residents of Tokyo’s 23 wards, one of the world’s most densely populated urban areas, using an online questionnaire. The collected data were analyzed using least absolute shrinkage, selection operator (LASSO) logistic regression, and piecewise structural equation modeling (pSEM). The analysis revealed that nature experiences in current travel destinations, particularly scenic walks, had a significant positive effect on both forest interest (standardized path coefficient = 0.19) and forest visits (0.30). These experiences were also significantly influenced by childhood nature experiences and frequent local walks. Conversely, factors negatively affecting forest visits included the lack of private vehicle ownership (−0.13) and increasing age (−0.21). While previous studies suggest that older individuals tend to visit natural areas more frequently, our findings indicate the opposite trend. One possible explanation is the low car ownership rate among Tokyo residents, which may limit accessibility to forests. These findings provide valuable insights for policy design, particularly regarding strategies to enhance forest accessibility and engagement among urban populations.

1. Introduction

Forest management is shifting from timber production to multifunctional use, reflecting declining productivity and changing societal values [1]. Underlying this shift is urbanization, an increase in nonresident and female forest owners, and a growing emphasis on ecological and recreational forest values [2]. The definition of forest multifunctionality, which is deeply embedded in the nature of forests, has been proposed over the years from various perspectives, including biological, ecological, functional, and managerial aspects. In 1992, the United Nations Conference on Environment and Development positioned the multiple ecological, economic, social, and cultural roles of forests at the core of the definition of the Principles of Sustainable Forest Management, leading to the idea of multifunctionality gaining new political momentum [3]. Nevertheless, there remains a mismatch between the increasing demand for diverse forest ecosystem services and the ability of forest owners and managers to profit from their supply [4]. To address this gap, numerous studies have been conducted to explore potential solutions.
Sheppard et al. [5] reviewed studies of forest owners on four continents and reported that the importance of non-wood forest products (NWFPs) is increasingly recognized and needs to be integrated into sustainable forest management practices. Nordlund and Westin reported that Swedish forest owners are balancing timber production and forest protection goals, influenced by diverse forest values [2]. The shift to forest management with an eye on NWFPs as well as timber is in line with the concept of forests as places of consumption rather than only production [1]. For example, forest owners in Finland are increasingly emphasizing multi-purpose forestry, incorporating and benefiting from diverse forest uses such as procuring gibier, berries, and mushrooms [6].
Awareness of ecological and recreational functions is also increasing, with forest owners in Sweden prioritizing these functions over timber production [7]. Gundersen et al. [8] reviewed reports from the Nordics and Europe and found that recreation and tourism through forest visits can provide significant economic benefits to forest owners. A study conducted in Ireland by Murphy and Wall found a market value of €268 million and a non-market value of €97 million in mountain village areas through recreation [9]. These findings point to prospects for a more holistic forest management approach that balances economic benefits with ecological conservation considerations and social benefits such as improved well-being.
Let us now turn our attention to visitors as well as forest owners. Both urban and mountain residents visit mountain forests, with some differences in their motivations and preferences [10]. Urban residents generally view mountain villages positively and support their preservation and often seek mountain forest experiences as an alternative to scarce urban green space [11,12]. Visitors from urban areas tend to prioritize recreation and nature experiences, which correlates with a strong desire to preserve mountain village areas [11]. Forests close to cities attract both urban and mountain user groups, and understanding visitor characteristics, use patterns, and perceptions is critical to sustainable management [13]. In mountain forests, spatial factors such as accessibility have been suggested to have a stronger influence on visitors than the natural environment [12]. Building on our knowledge of the demands of urban residents who have a strong desire to visit forests and forests close to cities that attract both urban and mountain residents is crucial for the benefit of more people.
Visiting forests brings many benefits to visitors. For example, in addition to recreational opportunities, forests provide numerous benefits to urban residents, including psychological restoration and aesthetic enjoyment [14], contribute to a more pleasant and healthy environment, improve individual and community well-being, and reduce the cost of urban services [15]. Exposure to forest environments has been shown to reduce stress, promote relaxation, and provide opportunities for socialization and exercise [16]. Forest visits have been demonstrated to have beneficial psychological and physiological effects on human health, including stress reduction and recovery from work [17].
Even from the limited data available, billions of people worldwide use forests annually to take advantage of their multifaceted functions [18]. However, a gradual decline in people’s experience of nature has been reported, particularly in North America, Western Europe, and Japan, and it has been speculated that this may be due to the fact that the places where humans live have become more urbanized, away from the natural world [19]. Urbanization is accelerating worldwide, with the urban population projected to reach nearly 70% by 2040, up from around 55% in 2020 [20]. From the perspective of Robert Zajonc’s mere-exposure effect [21], which states that people are more likely to be interested in an object if they have more opportunities to come in contact with the object, people lose interest in forests as contact opportunities decline due to increasing urbanization. Soga et al. show that the loss of interaction with nature not only reduces various benefits related to health and well-being but also suppresses positive feelings, attitudes, and behaviors toward the environment, implying a cycle of aversion toward nature [22]. Since an increase in the number of urban residents who do not visit forests is likely to create a negative loop, whereby the benefits they receive from forests decrease, they lose interest in forests, and they lose the motivation to visit them, it is important to break this negative loop and restore their engagement with nature.
However, while studies have been accumulated that target the segment of the population that visits forests with interest, there are few findings that focus on segments that are either indifferent or do not visit forests at all. Of all the regions in the world with disproportionately reported declines in nature experiences, a study of urban residents in the metropolis of Tokyo, which has the world’s largest urban agglomeration by population (approximately 37 million in 2018) according to the United Nations [20], could provide important insights in an increasingly urbanized world. While Tokyo ranks highest in terms of urban agglomeration, other definitions of city size, such as “city proper” populations, may yield different rankings (e.g., Chongqing in China has the largest city proper population). The objectives of this study were to (1) investigate factors influencing interest in and visits to forests by residents of the 23 wards of Tokyo and (2) explore strategies to encourage urban residents to visit forests and increase their interest in forests. The study is based on data collected through a comprehensive online questionnaire survey of residents of the 23 wards of Tokyo. By focusing on this highly urbanized context, the study provides insights into how urban residents interact with forests and suggests ways to achieve inclusive and sustainable forest management that balances economic returns, ecological conservation, and enhanced social benefits represented by well-being.

2. Materials and Methods

2.1. Study Area: Overview of Tokyo’s 23 Wards

Tokyo, located in the Kanto region of Honshu, Japan, consists of 23 wards, 26 cities, 3 towns, and 1 village. As of January 2024, the total population of Tokyo’s 23 wards was 9,643,024, with 5,428,860 households. The 23 special wards, forming the administrative core of Japan’s capital, represent the country’s largest urban area and were the focus of this study.

2.2. Methods: Questionnaire Survey

This study employed an online questionnaire survey conducted in January 2024. Ethical approval and measures to ensure the protection of personal information were obtained from the Forestry and Forest Products Research Institute [23-M9], and informed consent was secured from all participants prior to their involvement. The distribution and collection of questionnaires were carried out through a web-based survey company.
The target population consisted of residents aged 20 years and older living in Tokyo’s 23 wards. The sample was stratified by age and gender ratios within each ward, and data collection continued until a total of 5000 responses were obtained. Responses were collected from monitors registered with the web-based survey company, which introduced a potential bias as individuals who do not use the internet were excluded.
A 2022 survey by the Ministry of Internal Affairs and Communications reported internet usage rates in Japan exceeding 95% among individuals aged 20–59, 85% for those aged 60–69, 65% for those aged 70–79, and 33.2% for those aged 80 and older. Therefore, while the survey data are highly representative of working-age populations, they may underrepresent older individuals, especially those aged 80 and above, for whom internet usage rates are significantly lower.
To clarify participants’ conceptualization of “forests”, the questionnaire included a question asking, “Which of the following do you consider to be a forest? Please select all that apply”. This question was not intended for detailed analysis but rather aimed to provide a general understanding of urban residents’ perceptions of forests in Japan’s metropolitan areas.

2.3. Methods: Analytical Approach and Statistical Analysis

2.3.1. Variables Used in the Statistical Analysis

The dependent variables analyzed in this study were the following: (1) Interest in Forests: Assessed on a four-point scale ranging from “not interested” to “interested”. (2) Forest Visits: Assessed on a seven-point scale, from “did not visit at all” to “visited several times a week”. Due to non-normal distributions and zero-inflation (e.g., over half of respondents reported no forest visits in the past year), these variables were transformed into binary indicators: interested/not interested and visited/did not visit.
The explanatory variables were grouped into the following four categories: (1) Socioeconomic Status: Basic demographic and financial information. (2) Nature Experiences: Based on the hypothesis that childhood exposure to nature influences later attitudes toward forests. (3) Childcare-Related Factors: Included due to their potential link with forest interest and visits in households with children. (4) Hobbies: Activities potentially associated with forest-related behaviors. Nominal variables with three or more categories were converted into binary dummy variables. Reference categories were selected based on the national median (e.g., household income) or the most frequent response (e.g., job, academic background, residence). These explanatory variables are summarized in Supplementary Table S1.

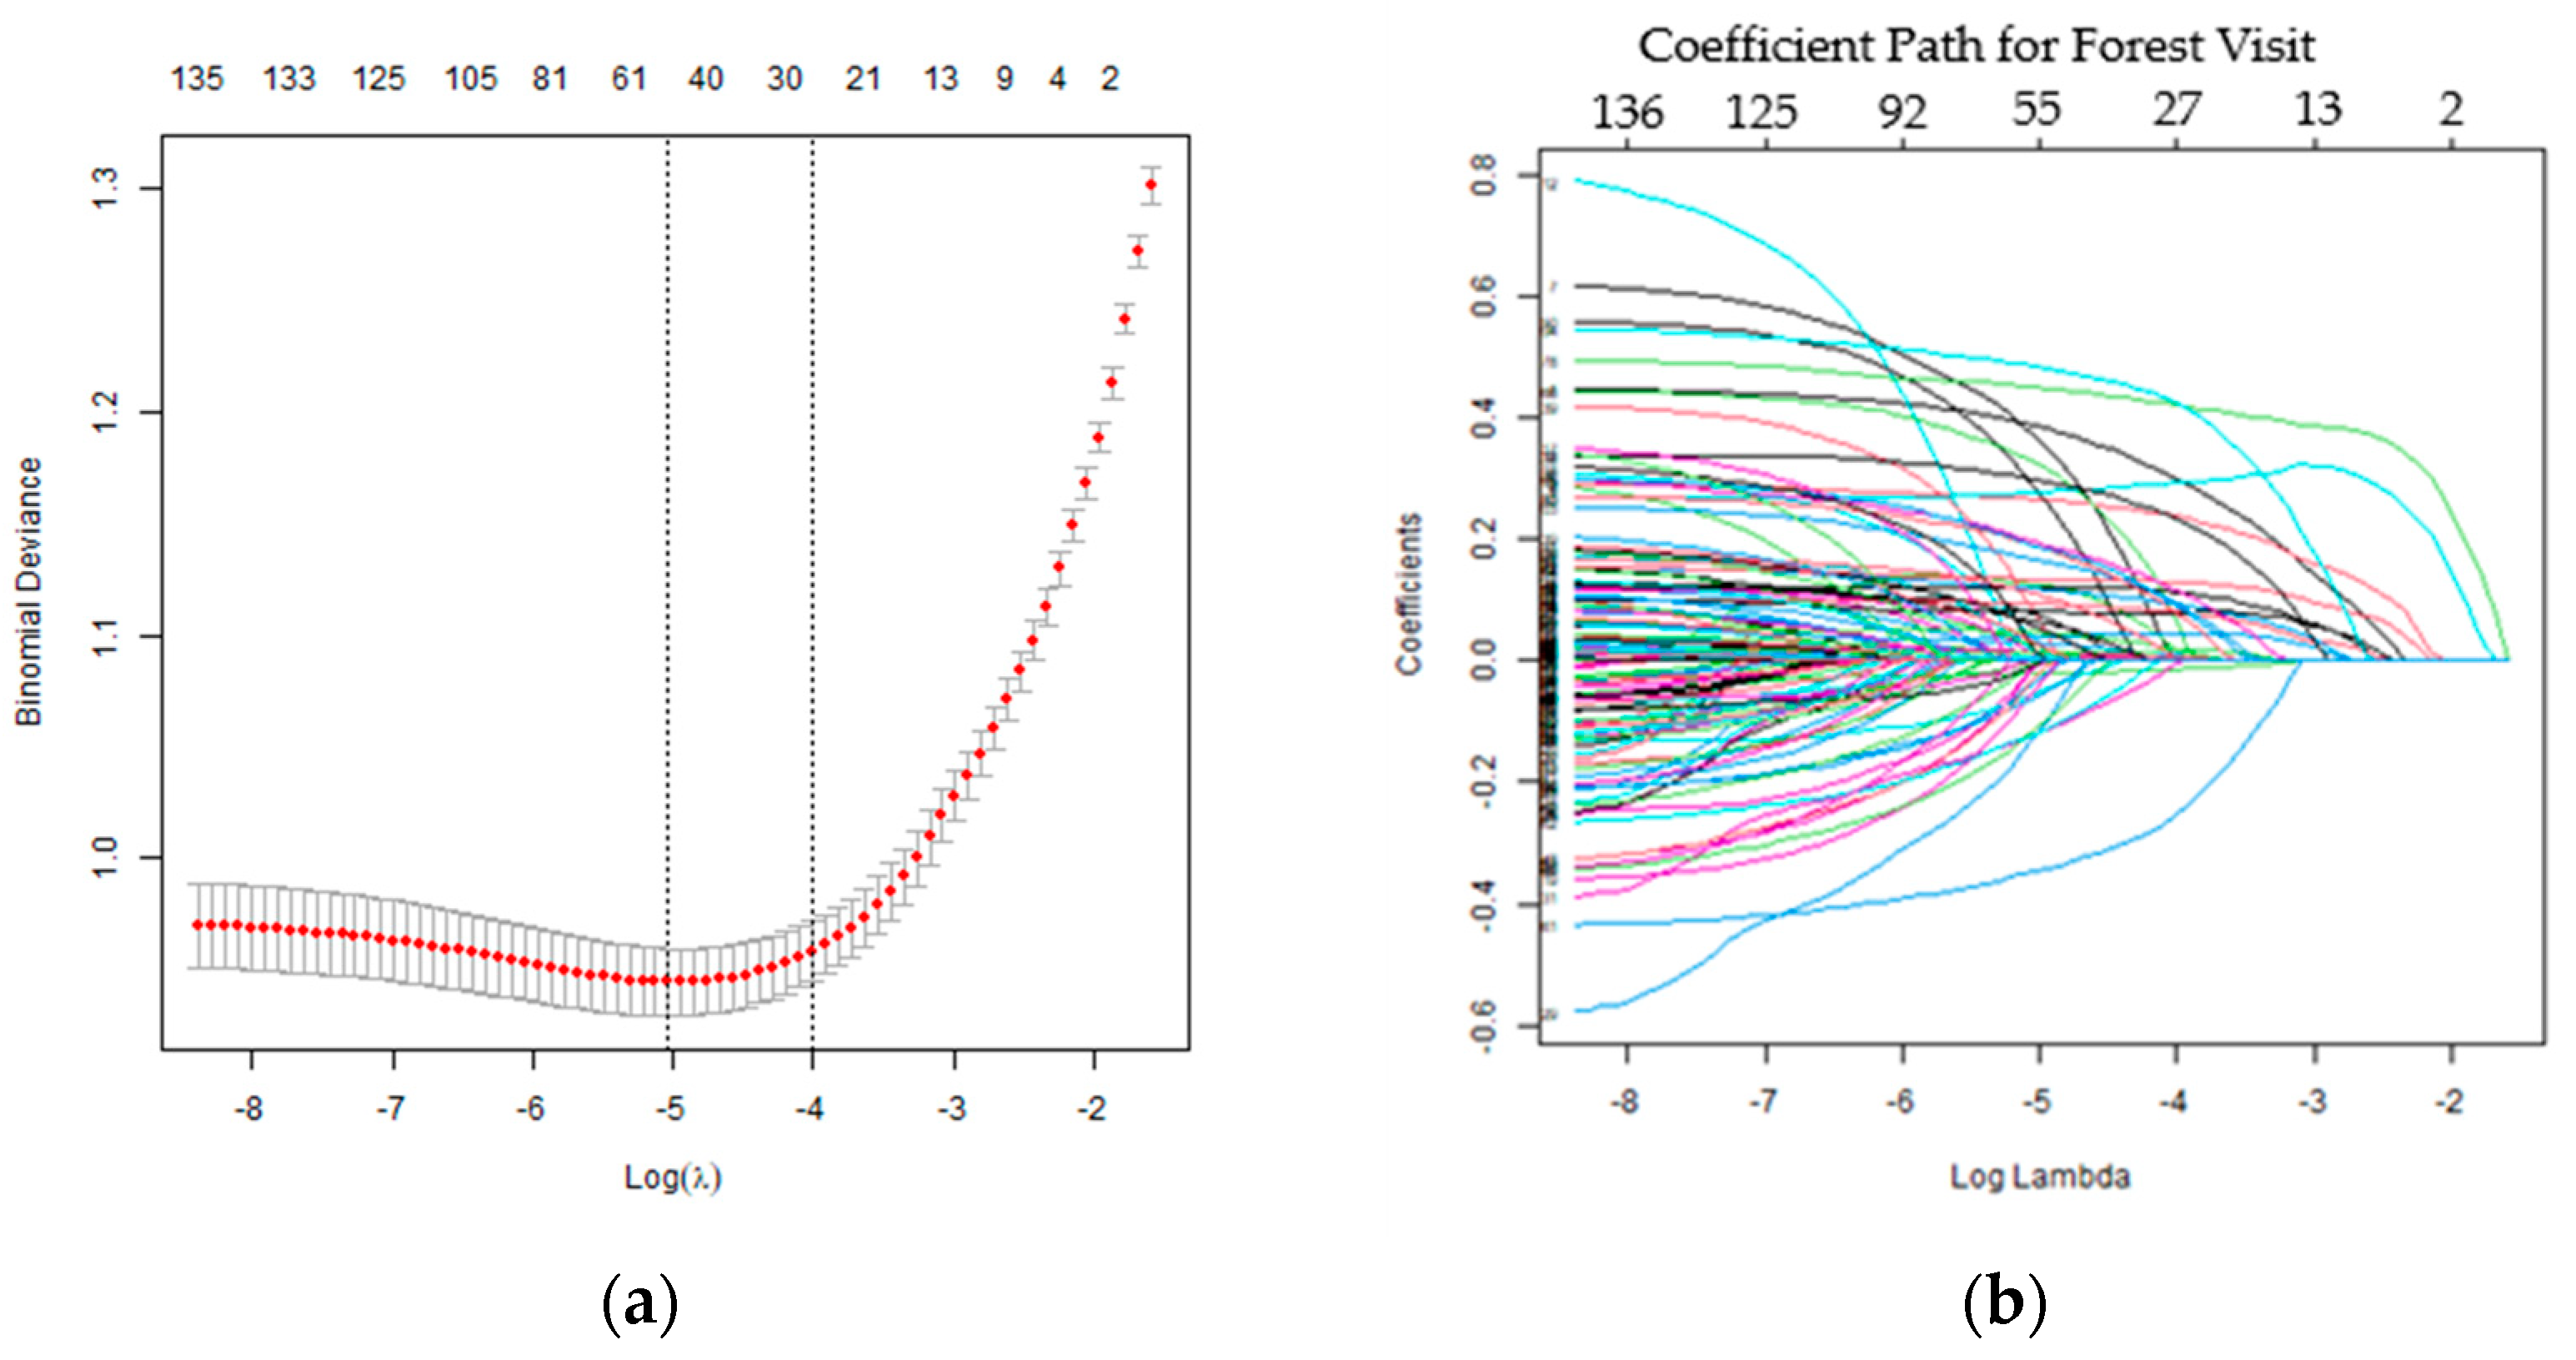
2.3.2. LASSO Logistic Regression Analysis

To identify explanatory variables influencing interest in forests and forest visits as dependent variables, least absolute shrinkage and selection operator (LASSO) logistic regression were employed [23]. In contrast to traditional variable selection approaches such as stepwise regression, the LASSO method stands out for its robust utility in data analysis and feature selection, boasting distinct advantages such as improved prediction accuracy, increased model interpretability, computational simplicity, and its ability to handle multicollinearity effectively [24,25,26]. By penalizing regression coefficients, LASSO regression effectively excludes variables with coefficients shrunk to zero, thereby reducing model complexity. The degree of regularization in LASSO regression is controlled by the lambda parameter, which determines the strength of penalization. The optimal lambda value was determined through 10-fold internal cross-validation, selecting the lambda-min that minimized binomial deviance. To ensure reproducibility, we recorded both the mean binomial deviance and its standard deviation across folds for each lambda value in the Supplementary Material (Tables S2 and S3). To assess the model’s performance on the data, the following metrics were calculated: Area Under the Receiver Operating Characteristic Curve (ROC-AUC), Area Under the Precision–Recall Curve (PR-AUC), Precision, Recall, and F1-score.

2.3.3. Post-LASSO Analysis

Although LASSO regression provides regression coefficients, it does not calculate 95% confidence intervals for these coefficients. To address this, a post-LASSO analysis was conducted. This method, which utilizes variables selected by LASSO, applies standard regression analysis to estimate coefficients, including their 95% confidence intervals [27]. It is applicable to both linear regression via least squares and logistic regression via maximum likelihood estimation. In this study, post-LASSO analysis was conducted using standard logistic regression with variables selected by LASSO. The regression coefficients, adjusted odds ratios, and their 95% confidence intervals were calculated to identify variables significantly influencing the dependent variables. To assess the model’s performance, the same metrics as in the LASSO analysis were calculated.

2.3.4. Piecewise SEM Analysis

Based on the significant variables identified by LASSO and post-LASSO analyses, further model refinement was performed using piecewise structural equation modeling (pSEM). pSEM extends traditional structural equation modeling by allowing for the use of non-linear models within individual components [28]. Logistic models were applied for binary dependent variables, while linear models were used for continuous dependent variables to construct structural equations. Prior to conducting piecewise SEM, we applied LASSO regression to identify the most influential predictors related to Forest Visit and Forest Interest. This selection step was necessary because SEM allows flexible model specifications, and an initial variable reduction process helps avoid overfitting while ensuring model interpretability. To address the concern regarding potentially omitted variables, we manually reintegrated certain theoretically important variables that were excluded by LASSO. These variables were systematically added to the structural equation model, and we monitored changes in model fit indices to assess their impact. The sequential LASSO-then-SEM approach has been employed in prior research to analyze complex causal mechanisms across different domains. For instance, Domínguez-Miranda et al. (2025) [29] integrated LASSO-based variable selection with SEM to examine the relationships between health habits and non-communicable diseases. Similarly, Kumagai et al. (2024) [30] applied LASSO to identify key environmental factors influencing black soybean yield and subsequently used SEM to investigate their interdependencies. These studies provide methodological precedent for our approach, demonstrating its applicability in uncovering complex relationships in diverse research contexts [29,30]. Furthermore, the directionality of relationships within the structural equation model was determined based on a time-sequential framework, wherein past experiences influence present behaviors. This approach is supported by previous studies in outdoor recreation and environmental psychology, which indicate that early life experiences with nature shape later environmental engagement [31,32].
The overall model performance was evaluated using Fisher’s C statistic, with a p-value greater than 0.05 indicating adequate model fit to the data. For individual models, R-squared was used to assess the performance of linear models, while Nagelkerke R-squared was adopted for logistic models. All computations for pSEM were conducted using the “piecewiseSEM” package in R version 4.3.2.

3. Results

3.1. Characteristics of Urban Residents (Simple Aggregation of Questionnaire Results)

A complete summary of all responses is provided in Tables S4 and S5 in Supplementary Materials. First, urban residents’ general perceptions of forests are presented in Table 1. Only a small percentage, less than 10%, considered small urban parks or walking paths with planted trees to be forests. In contrast, 23.5% of respondents perceived large urban parks as forests. The percentage of respondents who identified an area as a forest exceeded 50% only when referring to large parks located in suburban areas. Regarding interest in forests, the responses were as follows: 14.9% stated they had “no interest”, 33.2% were “not very interested”, 37.9% were “somewhat interested”, and 14.0% reported being “interested” (Table 2). Consequently, the “interested group” accounted for 51.9% of respondents, while the “uninterested group” made up 48.1%. For forest visits, 64.4% of respondents indicated they had “not visited even once in the past year”, categorizing them as non-visitors (Table 3). Meanwhile, 35.6% reported visiting forests at least once within the year, categorizing them as visitors.

3.2. Model Construction and Variable Selection Using LASSO Regression

Figure 1a,b and Figure 2a,b present the results of variable selection through LASSO regression. In Figure 1a,b, the red dots represent the binomial deviance values corresponding to each lambda, while the two vertical lines indicate special lambda values. The error bars represent the standard deviation. The first line represents the lambda value at which binomial deviance is minimized, and the second line represents the largest lambda within one standard error of the minimum binomial deviance. This study adopted the former, the lambda that yielded the best model evaluation.
For the Forest Interest Model, the selected lambda was 0.006310045, while for the Forest Visit Model, the lambda was 0.006530722. Figure 1b and Figure 2b illustrates the process of variable exclusion, where regression coefficients for each variable become zero as the lambda increases.
Through LASSO regression, 43 variables were preliminarily selected when using Forest Interest as the dependent variable, and 48 variables were selected when using Forest Visit as the dependent variable. Among these, 28 variables were common to both (Table S6).
Subsequently, a post-LASSO analysis was performed, conducting logistic regression with the Enter method using the variables selected by LASSO. The accuracy of each model in explaining the data is presented in Table 4, which show that the models yielded favorable results.

3.3. Results of Post-LASSO

In the model with Forest Interest as the dependent variable, variables such as Forest Preference, Forest Familiarity, Residence (Suginami Ward, Katsushika Ward), Nature experiences in the vicinity of the current home (Observation, Scenic Walk), Nature experiences in current travel destinations (Scenic Walk), and Hobbies for Relaxation (Walking, Trip, Gardening, Jogging and Sports, Museum) had significant positive effects on forest interest. Even in the same hobby category, unlike Hobbies for Relaxation, Hobbies for Refresh had no significant effect on either interest or visit. Conversely, Job (Homemaker) and Residence (Toshima Ward) had significant negative effects on Forest Interest.
For the model with Forest Visit as the dependent variable, variables such as Forest Preference, Forest Familiarity, Job (Civil Servant), Residence (Shibuya Ward), Childcare (Middle Elementary), Nature experiences in the vicinity of the current home (Activity), Nature experiences in current travel destinations (Observation, Scenic Walk, Activity), and Hobbies for Relaxation (Walking, Trip, Drive, Bathing, Jogging and Sports, Museum) had significant positive effects on visits. On the other hand, Age, Household Income (15–20 million JPY, Not aware of own household income), No Car ownership, and Childcare (No Children) had significant negative effects on visits. Details of these results are presented in Table 5 and Table 6.

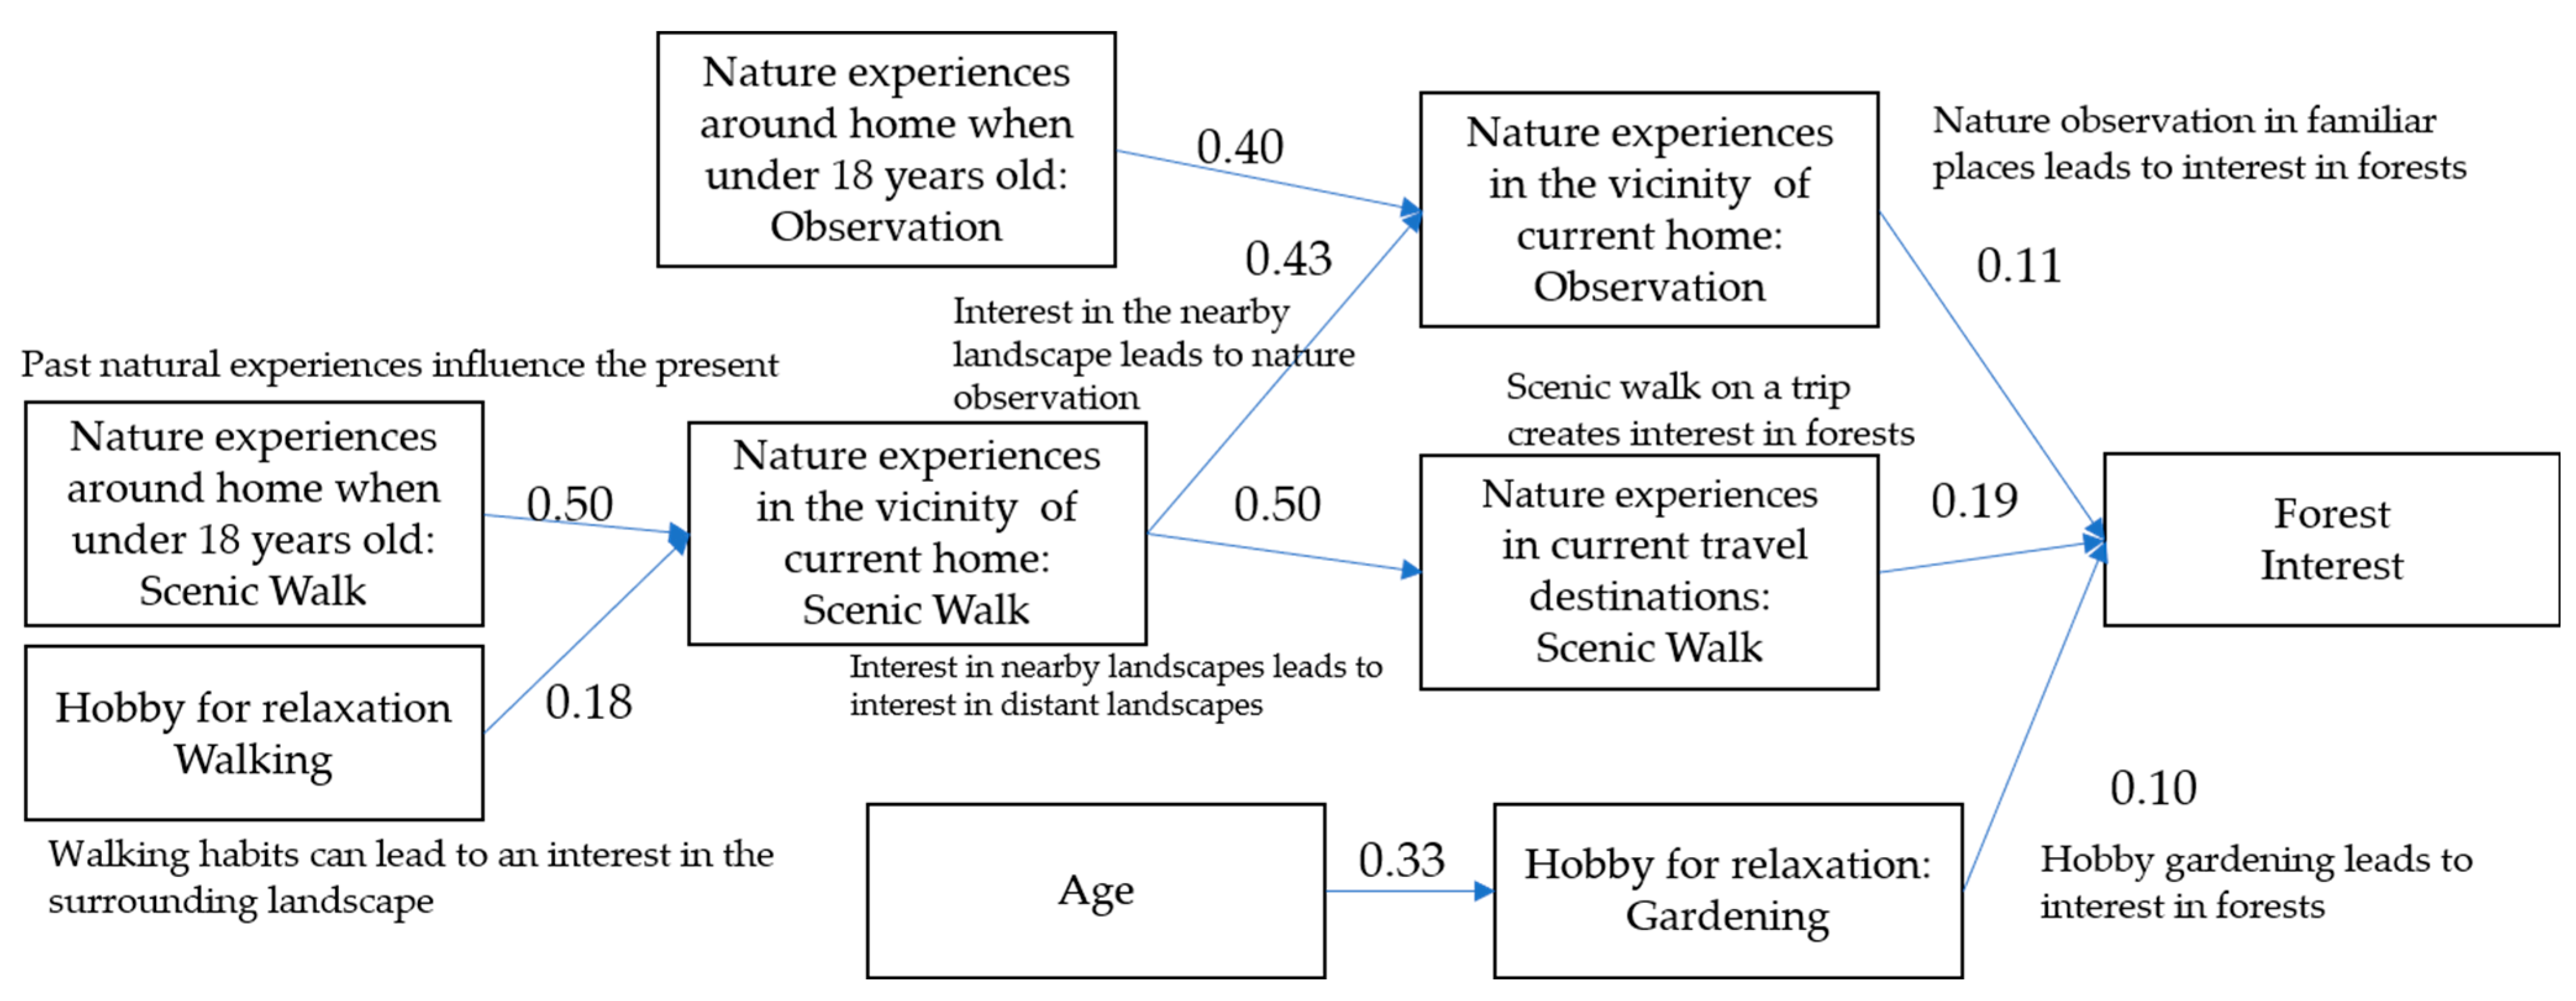
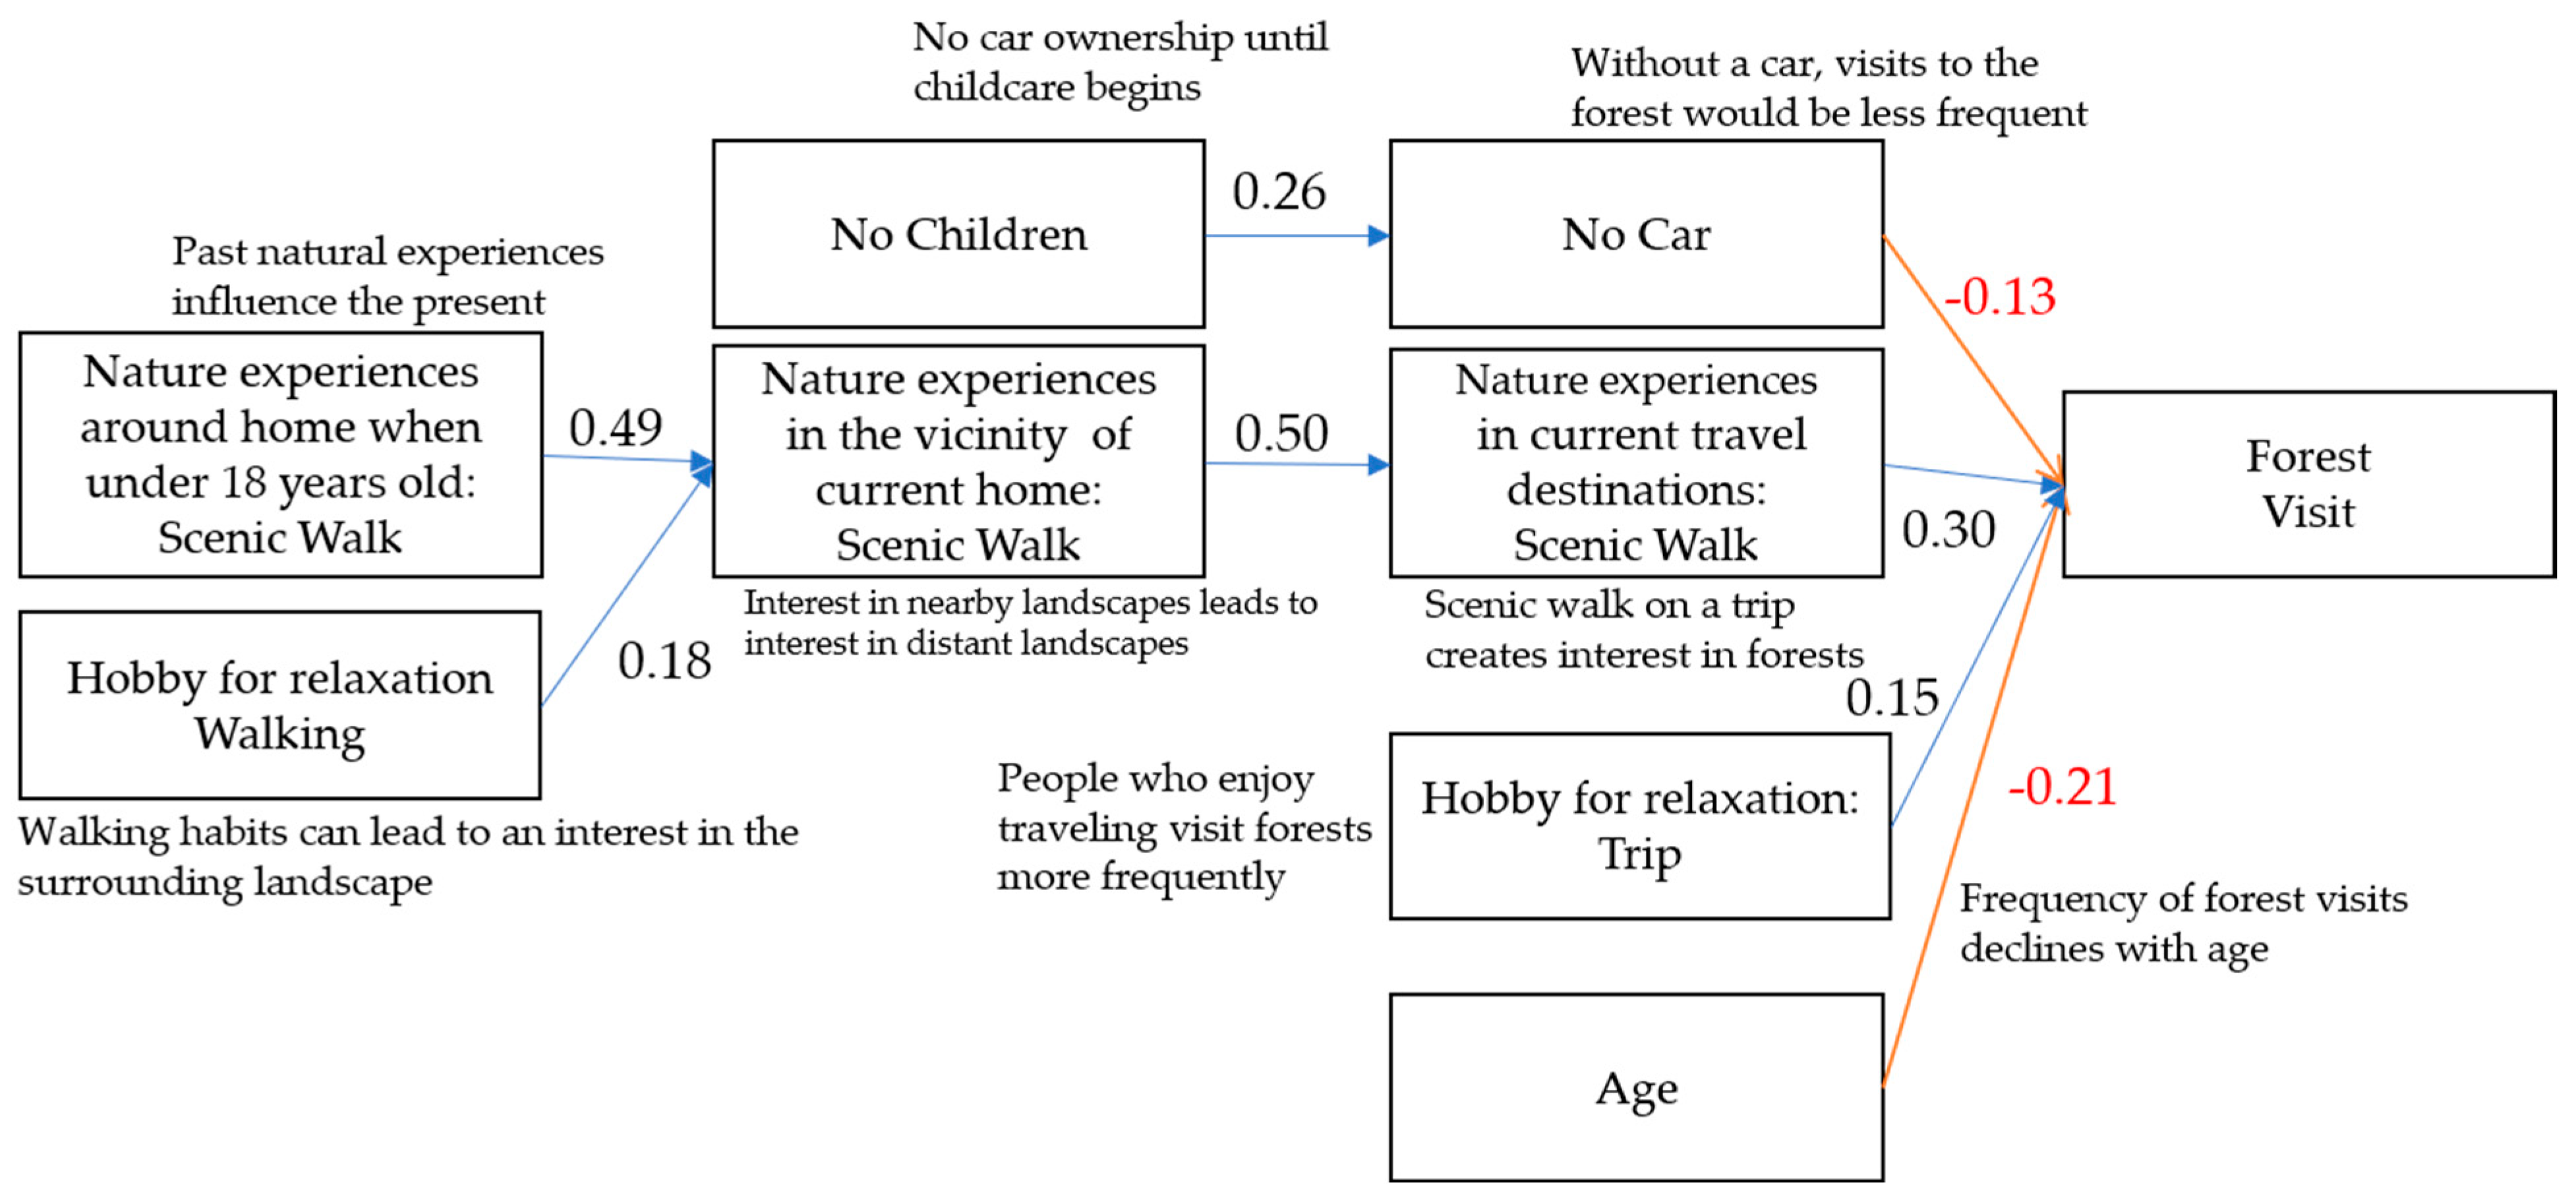
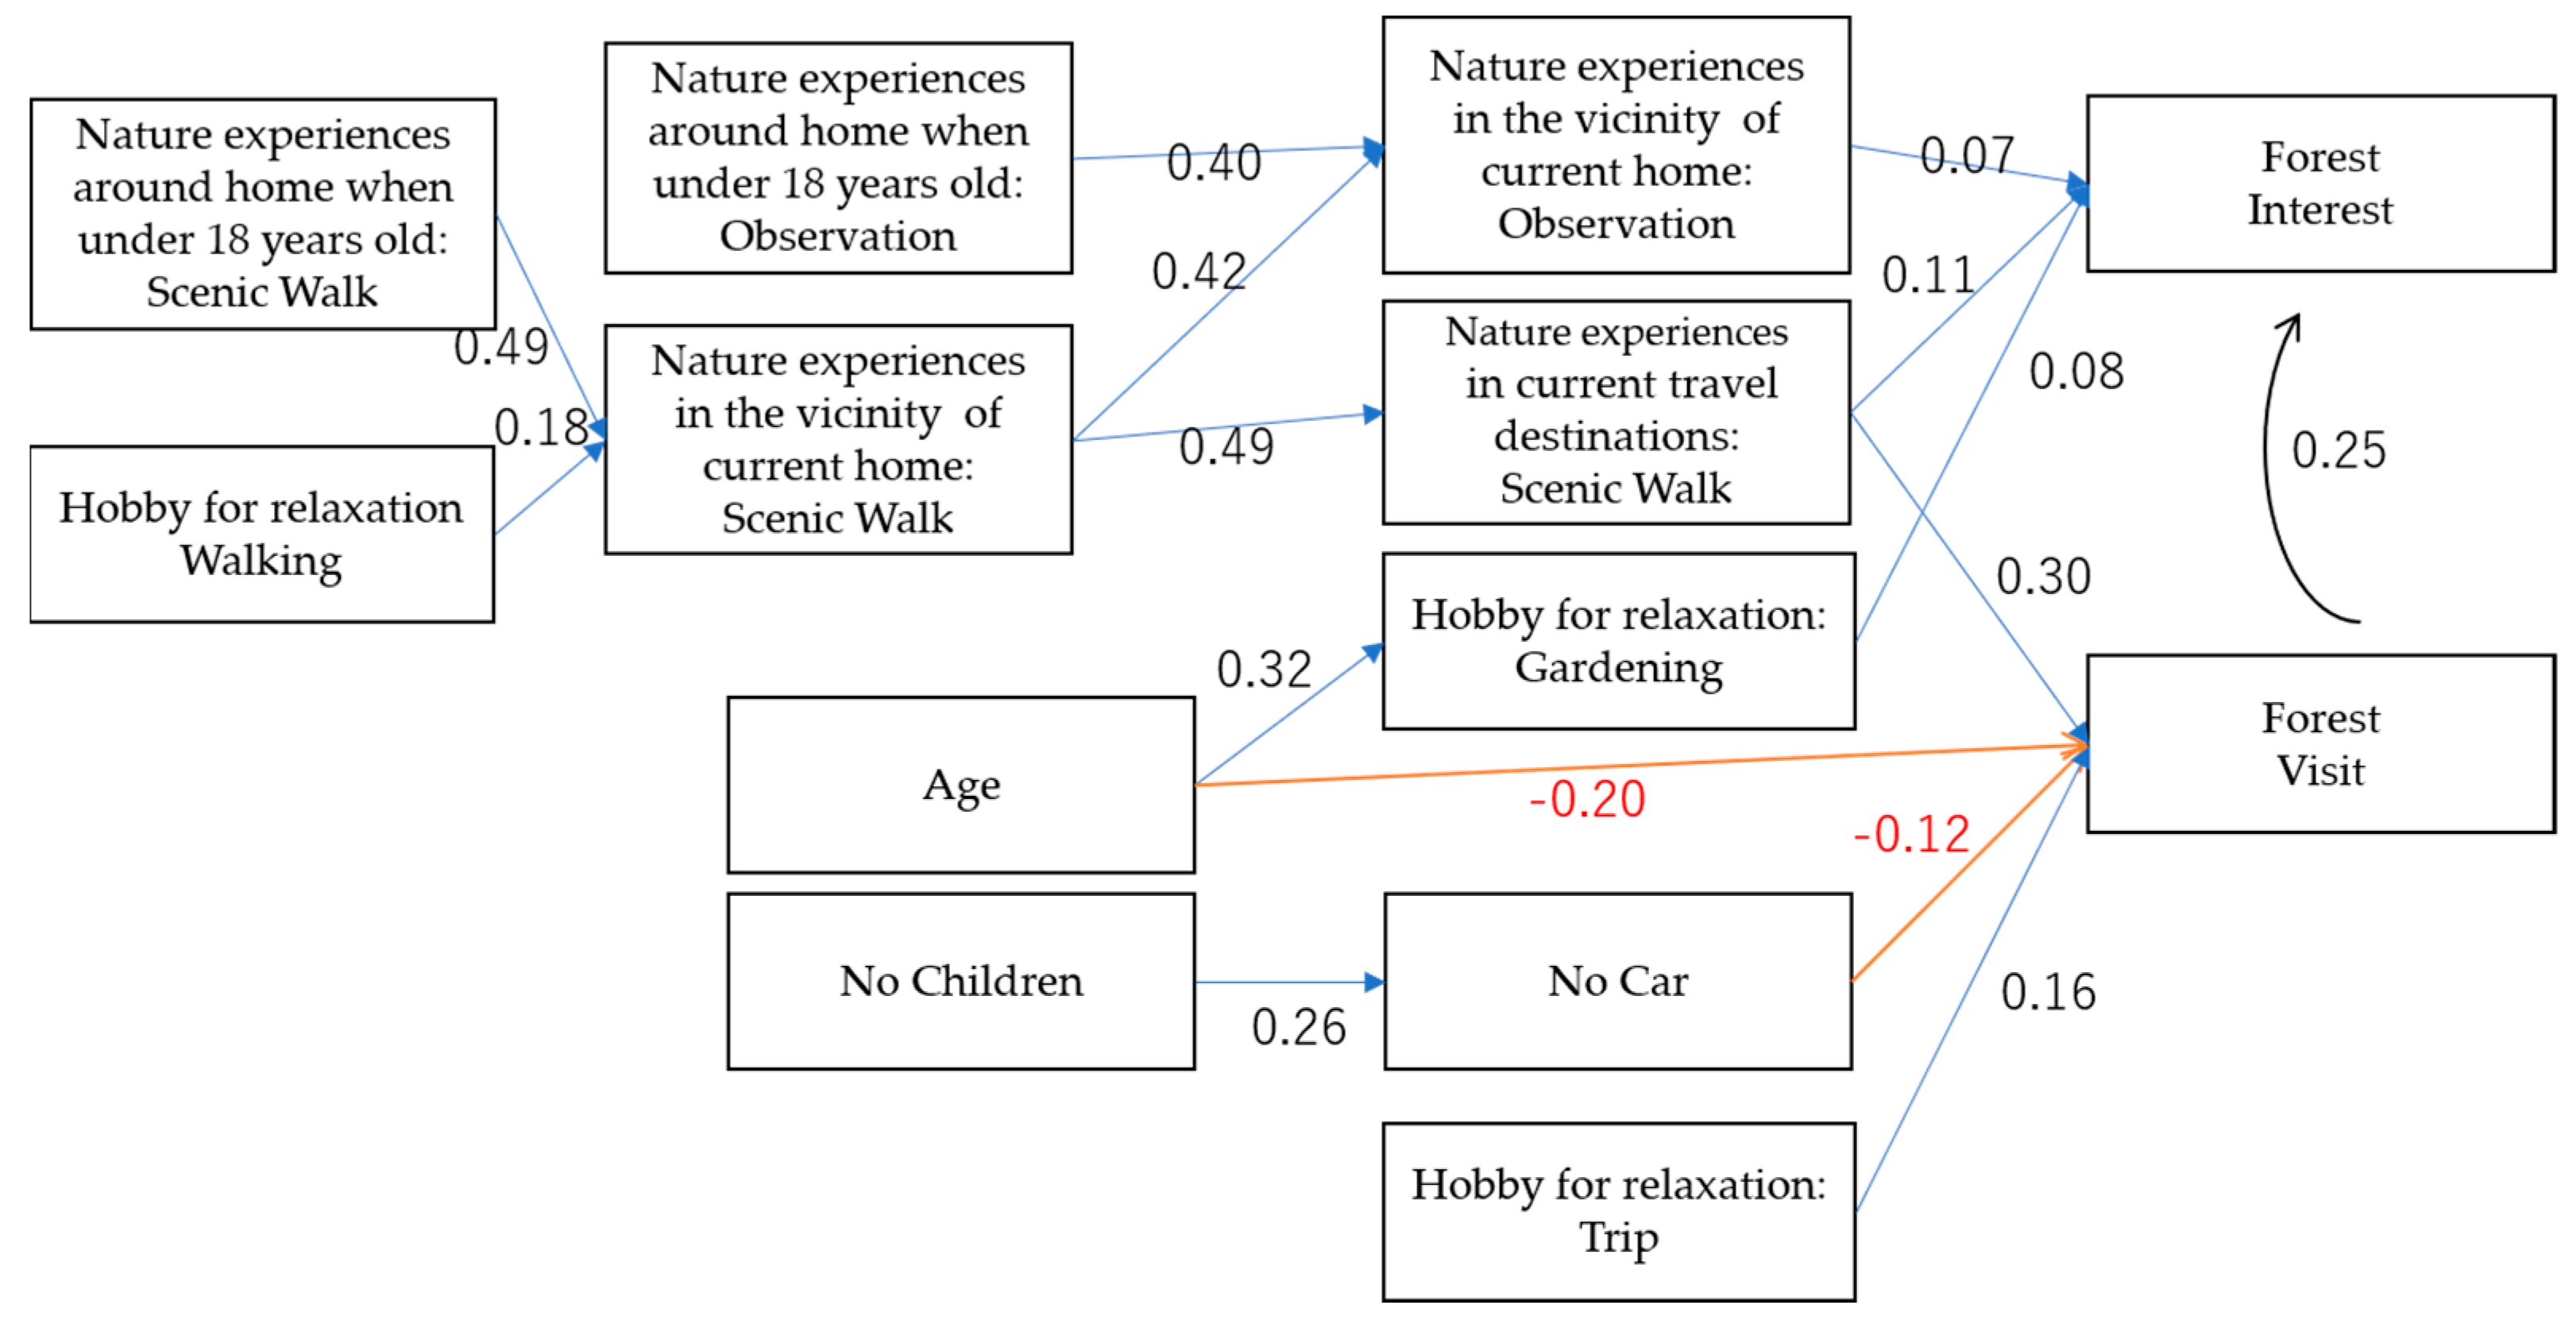
3.4. Results of Piecewise Structural Equation Modeling (pSEM)

As shown in Figure 3 (Model 1), Figure 4 (Model 2), Figure 5 (Model 3a), and Figure 6 (Model 3b):
  • Model 1 focuses on Forest Interest as the dependent variable.
  • Model 2 focuses on Forest Visit as the dependent variable.
  • Model 3 integrates Forest Interest and Forest Visit, where Model 3a sets Forest Interest as the dependent variable, and Model 3b sets Forest Visit as the dependent variable.
In the structural equation models, boxes represent variables, while arrows indicate one-directional effects between variables, expressed as standardized path coefficients. This section proposes a structural equation model centered on Nature Experiences, which had significant effects on both Forest Interest and Forest Visit.
Among all the models, “scenic walks in current travel destinations” showed the strongest standardized path coefficient (β) for the dependent variable (β = 0.19, p < 0.01 in Model M1; β = 0.30, p < 0.01 in Model M2; β = 0.30, p < 0.01 in Model M3a; β = 0.18, p < 0.01 in Model M3b), indicating its strong association with both Forest Interest and Forest Visit. Table 7 summarizes the goodness-of-fit indices for each model. Detailed standardized path coefficients among variables are listed in Tables S7–S10, and Table S11 for details of individual models, respectively, in the supplementary materials.
Several variables that were excluded by LASSO due to weaker statistical relationships but were considered theoretically significant were manually added to the structural equation model. Nature experiences around home when under 18 years old: observation, for instance, was not selected by LASSO but was manually added based on its theoretical relevance in understanding forest visits. After adding this variable, the model’s fit indices showed improvement. This improvement supports the importance of early nature experiences in influencing later forest visits.
Conversely, gender, which prior studies have identified as a significant factor influencing forest visits (with women visiting less frequently [33,34]), was excluded by LASSO and did not improve the model fit when added to the model. This suggests that in our study, the effect of gender on forest visits may be less pronounced, or other variables may better capture this relationship.

4. Discussion

In this section, we first discuss the results of the simplest constructed piecewise structural equation model despite it being introduced last in the Section 2 (Materials and Methods). Then, we discuss variables identified as significant in the post-LASSO analysis that were not included in the pSEM but demonstrated significant effects on the dependent variables. The first objective, factors influencing interest in and visits to forests, is discussed, focusing on variables that worked well in each analysis. The second objective, strategies to encourage urban residents to visit forests and increase their interest in forests, is discussed based on these findings, particularly in relation to accessibility, early life nature contact, and cultural infrastructure. Further implications for policy and practice are summarized in the conclusion.

4.1. Discussion of the Results of the Piecewise Structural Equation Modeling (pSEM)

4.1.1. Analysis of the Forest Interest Model (M1) and Forest Visit Model (M2)

The most influential variable in both models was the frequency of “scenic walks in current travel destinations”. This suggests that trips emphasizing beautiful scenery and aesthetics as their key appeal can positively influence both interest in forests and forest visits. This is also supported by the observation in the M2 model, where the variable of having a hobby related to travel showed a positive effect on the frequency of forest visits.
Additionally, the frequency of “scenic walks in current travel destinations” was strongly influenced by the frequency of “scenic walks near one’s home”. This indicates that walking habits around one’s residence are linked to early life experiences and incidental walking habits with no deliberate intent to connect with nature. The findings imply that increasing opportunities for contact with natural environments through childhood experiences or routine walking, even in settings unrelated to forest activities, can enhance both interest in and visits to forests.

4.1.2. Role of Parenting and Transportation Accessibility

To identify explanatory variables influencing interest in forests and forest visits, the analysis revealed that households with no children exhibited negative effects on forest visits, whereas households with middle elementary-aged children exhibited positive effects.
The structural equation model (M2) revealed that childcare status indirectly affected forest visits through vehicle ownership, which was associated with transportation accessibility. Tokyo, being the largest urban area in Japan, is characterized by excellent public transportation but limited parking due to high land value, leading to low rates of car ownership. Households without a car experienced reduced accessibility to forests, resulting in lower visit frequencies. On the other hand, households with children displayed an increased need for cars, leading to improved access to forest areas.
These findings indicate that efforts to improve accessibility to forests through public transportation alternatives would be effective for families with children. Moreover, promoting forest visits to childcare households by leveraging the beneficial effects of early life nature experiences could be a useful intervention strategy.

4.1.3. Aging and Forest Visits

In the M2 model, age was found to have a negative effect on forest visits. This result contrasts with previous studies conducted in different sociocultural or geographical contexts. For instance, Morita et al. [35] found that the implementation rate of forest walking increases with age in Japan. However, their study focused on a different urban area than ours, which may reflect regional differences in access to natural spaces or cultural preferences. Similarly, Jang et al. [36] reported that in Korea, individuals in their 60s visit nearby forests more frequently than those in their 20s. In Finland, Nerg et al. [37] observed that the young retirement generation (aged 65–74) significantly increased their visits to national parks and hiking areas. These discrepancies suggest that the relationship between age and forest visits might be influenced by local factors such as urban planning, natural space availability, and societal norms regarding outdoor activities. One possible explanation for this finding is that limited transportation options and reduced car ownership among older adults, especially in urban regions, may constrain their access to forest areas. For example, Nagoya City, which was the study site in Morita et al.’s research, is a major city in Japan, just like the Tokyo Special Wards that we surveyed. However, there is a significant difference in the rate of car ownership per household between the two cities. As of 2024, the average number of cars per household was 0.324 in Tokyo’s 23 Wards, whereas it was 0.901 in Nagoya City [38]. This factor could influence accessibility to forested areas, particularly for elderly individuals who may rely more on private vehicles. These findings suggest that existing theories on elderly forest visits may need to be refined by incorporating the role of transportation accessibility in urban contexts. Although our study was limited to urban residents, future research should compare urban, suburban, and rural residents where transportation systems and car ownership rates differ. Such comparisons would provide a clearer understanding of the relationship between accessibility and visits.

4.1.4. Reciprocal Relationship Between Interest and Visits

Comparing the models (M3a and M3b) that incorporated “interest” and “visit” as explanatory variables, respectively, the standardized path coefficient from “visit” to “interest” was 0.25, and from “interest” to “visit” was 0.24, with no significant differences. It is easy to imagine that interest leads to a visit, but it is also quite possible that interest is generated by repeated visits based on the principle of simple contact. Since the possibility of the existence of these bidirectional relationships remains, causal inference using time series data needs to be examined for precise verification.

4.2. Discussion of the Post-LASSO Result

While the following variables were not directly included in the models, the post-LASSO analysis identified them as having significant effects on forest interest and visits. Given their potential relevance to understanding behavioral patterns and policy implications, we provide a complementary discussion of these factors in this section.

4.2.1. Hobby and Its Relationship with Forest Interest and Visits

The analysis revealed that certain hobbies exerted positive effects on both forest interest and visits. Notably, these were not driven by a search for refreshment but rather by a desire for relaxation. This finding aligns with the growing popularity of forest bathing and other similar activities designed to promote relaxation and health through nature-based experiences.

4.2.2. Homemakers and Forest Interest

The variable job of homemaker had a significant negative effect on interest in nature. Although there are no previous studies showing that being a housewife per se decreases interest in nature, one possible explanation is that being engaged in childcare and caregiving activities causes one’s scope of activities to be centered around the home, reducing access to information that would bring about interest in nature.

4.2.3. Civil Servants and Forest Visits

The variable job of civil servant demonstrated a positive effect on forest visits. According to a survey conducted by Japan’s Ministry of Internal Affairs and Communications in 2022, compared to the private sector, public employees tend to take more annual paid leave days and have a better work-life balance. This is thought to have led to higher rates of forest visits, as they are able to plan their leisure time more easily and have more opportunities to travel. Conversely, for workers with insufficient schedule flexibility, our results suggest that time constraints may hinder forest visits [39].

4.2.4. The Role of Museums

An interesting variable that showed a significant positive effect on both forest interest and visits was museums as a hobby. Museums, botanical gardens, aquariums, zoos, and other cultural institutions combine experiences related to nature and culture. Enhancing access to these types of facilities could foster greater engagement with nature and encourage forest visits by offering diverse and educational opportunities to connect with natural environments.

4.3. Limitations

This study has some limitations that should be acknowledged. One potential limitation is the influence of seasonal factors on survey responses. The survey was conducted in winter, and previous studies have shown that weather conditions can significantly impact subjective well-being [40,41] and mood [42,43]. Colder temperatures and shorter daylight hours may affect respondents’ psychological states and their willingness to engage in outdoor activities. Therefore, the observed relationships between forest interest, forest visits, and other variables might partially reflect seasonal variations rather than stable behavioral patterns. Future research should consider conducting surveys across different seasons to assess the robustness of the findings and to account for potential seasonal biases.
This study employs a sequential LASSO-then-SEM approach, which offers a structured method for variable selection and causal analysis. However, this approach remains relatively novel in applied research, and its implementation in related fields is still emerging. While LASSO effectively reduces dimensionality and prevents overfitting, its tendency to exclude variables with weaker statistical signals—even when they are theoretically important—raises concerns about potential information loss. In this study, we addressed this issue by manually reintegrating certain variables and assessing their impact on model fit.
One potential extension of this work is the incorporation of more systematic sensitivity analyses (e.g., stepwise reintegration of excluded variables, Bayesian model averaging) to further assess the robustness of variable selection. However, given the complexity of our SEM framework and the need to balance model parsimony with interpretability, implementing exhaustive sensitivity analyses for all excluded variables was beyond the scope of this study. Future research could explore these methods to refine the LASSO-SEM approach and establish the best practices for its application in various domains.

5. Conclusions

The findings from both the pSEM and post-LASSO analyses provide concrete policy implications for promoting forest interest and visits. Given the significant influence of accessibility, early life nature contact, and cultural infrastructure, targeted interventions should prioritize the following strategies:
  • Improve Accessibility: Strategies such as enhancing public transportation for families or those without cars could alleviate accessibility issues.
  • Early Life Nature Contact: Efforts should focus on increasing exposure to natural environments from early childhood.
  • Cultural Infrastructure: Promoting and improving access to cultural spaces like museums and botanical gardens can have a dual effect of encouraging both interest in and visits to forests.
  • Addressing Demographic Constraints: Special attention should be paid to age-related constraints and parenting status when designing outreach and intervention programs to promote forest visits.
These insights underscore the need for a multifaceted approach that integrates urban planning, environmental education, and social policies to foster stronger connections between people and forests. Future research should explore how these strategies can be effectively implemented in different socio-cultural contexts.

Supplementary Materials

The following supporting information can be downloaded at: https://www.mdpi.com/article/10.3390/f16050714/s1, Table S1: Data Types and Reference Categories of Explanatory Variables; Table S2: Cross-Validation Results for LASSO Regression on Forest Interest; Table S3: Cross-Validation Results for LASSO Regression on Forest Visit; Table S4: Summary Statistics of All Variables Collected from the Survey; Table S5: Summary Statistics of Data Collected Using the Four-Point Scale; Table S6: LASSO-Selected Variables and Coefficients for Forest Interest and Forest Visit; Table S7: Detailed Standardized Path Coefficients Among Variables in Model M1; Table S8: Detailed Standardized Path Coefficients Among Variables in Model M2; Table S9: Detailed Standardized Path Coefficients Among Variables in Model M3a; Table S10: Detailed Standardized Path Coefficients Among Variables in Model M3b; Table S11: Structure and Explanatory Power of Individual Models.

Author Contributions

Conceptualization, K.O. (Kimisato Oda), K.Y., A.M., K.O. (Keita Otsuka), S.J., Y.H., M.I., T.M., K.S. and N.T.; methodology, K.O. (Kimisato Oda) and N.T.; validation, K.O. (Kimisato Oda), K.Y., A.M., K.O. (Keita Otsuka), S.J., Y.H., M.I., T.M., K.S. and N.T.; formal analysis, K.O. (Kimisato Oda); investigation, K.O. (Kimisato Oda), K.O. (Keita Otsuka), S.J. and N.T.; resources, K.O. (Kimisato Oda) and N.T.; data curation, K.O. (Kimisato Oda); writing—original draft preparation, K.O. (Kimisato Oda); writing—review and editing, K.O. (Kimisato Oda), K.Y., A.M., K.O. (Keita Otsuka), S.J., Y.H., M.I., T.M., K.S. and N.T.; visualization, K.O. (Kimisato Oda); supervision, K.Y., A.M. and N.T.; project administration, K.Y., A.M. and N.T.; funding acquisition, K.Y. All authors have read and agreed to the published version of the manuscript.

Funding

This study was funded by a grant project from the Forestry and Forest Products Research Institute.

Data Availability Statement

The raw data from this study cannot be made public because we plan to conduct further analysis in conjunction with data from other areas that we plan to acquire in the future.

Acknowledgments

Author K.O. would like to express his sincere gratitude to Hajime Utsugi for advice on obtaining funding and making the project a reality, Keiko Fukumoto for advice on piecewise SEM methods, and Shingo Obata for consultation on variable selection methods.

Conflicts of Interest

The funders had no role in the design of the study; in the collection, analyses, or interpretation of data; in the writing of the manuscript; or in the decision to publish the results.

References

  1. Mather, A.S. Forests of consumption: Postproductivism, postmaterialism, and the postindustrial forest. Environ. Plan. C Gov. Policy 2001, 19, 249–268. [Google Scholar] [CrossRef]
  2. Nordlund, A.; Westin, K. Forest values and forest management attitudes among private forest owners in Sweden. Forests 2010, 2, 30–50. [Google Scholar] [CrossRef]
  3. Cesaro, L.; Gatto, P. The Multifunctional Role of Forests: Policies, Methods and Case Studies; Pettenella, D., Ed.; European Forest Institute: Joensuu, Finland, 2008. [Google Scholar]
  4. Winkel, G.; Lovric, M.; Muys, B.; Katila, P.; Lundhede, T.; Pecurul, M.; Pettenella, D.; Pipart, N.; Plieninger, T.; Prokofieva, I.; et al. Governing Europe’s forests for multiple ecosystem services: Opportunities, challenges, and policy options. For. Policy Econ. 2022, 145, 102849. [Google Scholar] [CrossRef]
  5. Sheppard, J.P.; Chamberlain, J.; Agúndez, D.; Bhattacharya, P.; Chirwa, P.W.; Gontcharov, A.; Sagona, W.C.J.; Shen, H.-L.; Tadesse, W.; Mutke, S. Sustainable forest management beyond the timber-oriented status quo: Transitioning to co-production of timber and non-wood forest products—A global perspective. Curr. For. Rep. 2020, 6, 26–40. [Google Scholar] [CrossRef]
  6. Hallikainen, V.; Hyppönen, M.; Pernu, L.; Puoskari, J. Family forest owners’ opinions about forest management in northern Finland. Silva Fenn. 2010, 44, 363–384. [Google Scholar] [CrossRef]
  7. Kindstrand, C.; Norman, J.; Boman, M.; Mattsson, L. Attitudes towards various forest functions: A comparison between private forest owners and forest officers. Scand. J. For. Res. 2008, 23, 133–136. [Google Scholar] [CrossRef]
  8. Gundersen, V.; Köhler, B.; Myrvold, K.M. Seeing the forest for the trees: A review-based framework for better harmonization of timber production, biodiversity, and recreation in boreal urban forests. Urban Sci. 2019, 3, 113. [Google Scholar] [CrossRef]
  9. Murphy, W.; Wall, S. Forest recreation in a commercial environment. Small-Scale For. Rural. Dev. Intersect. Ecosyst. Econ. Soc. 2006, 3, 347–356. [Google Scholar]
  10. Yun, D.; Hennessy, S.; Courtney, S.A. Motivations and Preferred Activities of Tourists to Rural Destinations: A Comparative Analysis of Rural and Urban Residents. Travel and Tourism Research Association: Advancing Tourism Research Globally 60. 2016. Available online: https://scholarworks.umass.edu/bitstreams/cc7538bb-a6b0-44d2-85a0-7569c8054d45/download (accessed on 7 February 2025).
  11. Willits Fern, K.; Luloff, A.E. Urban Residents’ Views of Rurality and Contacts with Rural Places. Rural Sociol. 1995, 60, 454–466. [Google Scholar] [CrossRef]
  12. Wang, C.; Zou, J.; Fang, X.; Chen, S.; Wang, H. Using Social Media and Multi-Source Geospatial Data for Quantifying and Understanding Visitor’s Preferences in Rural Forest Scenes: A Case Study from Nanjing. Forests 2023, 14, 1932. [Google Scholar] [CrossRef]
  13. English, D.B.; Kocis, S.M.; Zarnoch, S.J. Characteristics and Use Patterns of Visitors to Dispersed Areas of Urban National Forests. Policies Methods Tools Visit. Manag. Proc. Second. Int. 2004, 2, 179–184. [Google Scholar]
  14. Hauru, K.; Eskelinen, H.; Yli-Pelkonen, V.; Kuoppamäki, K.; Setälä, H. Residents’ perceived benefits and the use of urban nearby forests. Int. J. Appl. For. 2015, 2, 1–23. [Google Scholar]
  15. Dwyer, J.F.; McPherson, E.G.; Schroeder, H.W.; Rowntree, R.A. Assessing the benefits and costs of the urban forest. Arboric. Urban For. (AUF) 1992, 18, 227–234. [Google Scholar] [CrossRef]
  16. Bell, S.; Thompson, C.W. Human engagement with forest environments: Implications for physical and mental health and wellbeing. In Challenges and Opportunities for the World’s Forests in the 21st Century; Springer: Dordrecht, The Netherlands, 2013; pp. 71–92. [Google Scholar]
  17. Tyrväinen, L.; Ojala, A.; Neuvonen, M.; Borodulin, K.; Lanki, T. Health and well-being from forests-experience from Finnish research. Santé Publique 2018, S1, 249–256. [Google Scholar] [CrossRef] [PubMed]
  18. Hall, C.M. Seeing the forest for the trees: Tourism and the international year of forests. J. Herit. Tour. 2011, 6, 271–283. [Google Scholar] [CrossRef]
  19. Cazalis, V.; Loreau, M.; Barragan-Jason, G. A global synthesis of trends in human experience of nature. Front. Ecol. Environ. 2023, 21, 85–93. [Google Scholar] [CrossRef]
  20. UNPD (United Nations, Department of Economic and Social Affairs, Population Division). World Urbanization Prospects: The 2018 Revision; United Nations: New York, NY, USA, 2019. [Google Scholar]
  21. Zajonc, R.B. Attitudinal effects of mere exposure. J. Personal. Soc. Psychol. 1968, 9 Pt 2, 1–27. [Google Scholar] [CrossRef]
  22. Soga, M.; Gaston, K.J. Extinction of experience: The loss of human–nature interactions. Front. Ecol. Environ. 2016, 14, 94–101. [Google Scholar] [CrossRef]
  23. Tibshirani, R. Regression shrinkage and selection via the lasso. J. R. Stat. Soc. Ser. B Stat. Methodol. 1996, 58, 267–288. [Google Scholar] [CrossRef]
  24. Meier, L.; Van De Geer, S.; Bühlmann, P. The group lasso for logistic regression. J. R. Stat. Soc. Ser. B Stat. Methodol. 2008, 70, 53–71. [Google Scholar] [CrossRef]
  25. Fonti, V.; Belitser, E. Feature selection using lasso. VU Amst. Res. Pap. Bus. Anal. 2017, 30, 1–25. [Google Scholar]
  26. Kumar, S.; Attri, S.D.; Singh, K.K. Comparison of Lasso and stepwise regression technique for wheat yield prediction. J. Agrometeorol. 2019, 21, 188–192. [Google Scholar] [CrossRef]
  27. Taylor, J.; Tibshirani, R. Post-selection inference for-penalized likelihood models. Can. J. Stat. 2018, 46, 41–61. [Google Scholar] [CrossRef] [PubMed]
  28. Lefcheck, J.S. piecewiseSEM: Piecewise structural equation modelling in r for ecology, evolution, and systematics. Methods Ecol. Evol. 2016, 7, 573–579. [Google Scholar] [CrossRef]
  29. Domínguez-Miranda, S.A.; Rodriguez-Aguilar, R.; Velazquez Salazar, M. Modeling the Relation Between Non-Communicable Diseases and the Health Habits of the Mexican Working Population: A Hybrid Modeling Approach. Mathematics 2025, 13, 959. [Google Scholar] [CrossRef]
  30. Kumagai, E.; Minato, M.; Takahashi, T. Kinnen no kikō hendō to dojō suibun no henka ga Tanba kuro daizu shuyō sanchi no shuryō ni oyoboshita tamen-teki eikyō bunseki [Multifaceted impact analysis of recent climate change and soil moisture variations on the yield of Tanba black soybean in major production areas]. Jpn. J. Crop Sci. 2024, 93, 278–293. (In Japanese) [Google Scholar]
  31. Rosa, C.D.; Profice, C.C.; Collado, S. Nature experiences and adults’ self-reported pro-environmental behaviors: The role of connectedness to nature and childhood nature experiences. Front. Psychol. 2018, 9, 1055. [Google Scholar] [CrossRef]
  32. Ward Thompson, C.; Aspinall, P.; Montarzino, A. The Childhood Factor: Adult Visits to Green Places and the Significance of Childhood Experience. Environ. Behav. 2008, 40, 111–143. [Google Scholar] [CrossRef]
  33. Farías-Torbidoni, E.I.; Rossi, S.D.; Pickering, C.M. Visitation patterns in a peri-urban natural park: Comparing mountain bikers, runners, walkers and hikers. J. Outdoor Recreat. Tour. 2023, 44, 100686. [Google Scholar] [CrossRef]
  34. Oprica, R.F.; Tudose, N.C.; Davidescu, Ș.O.; Zup, M.; Marin, M.; Comănici, A.N.; Criț, M.N.; Pitar, D. Gender inequalities in Transylvania’s largest peri-urban forest usage. Ann. For. Res. 2022, 65, 57–69. [Google Scholar] [CrossRef]
  35. Morita, E.; Aoyama, K.; Tamura, T.; Okada, R.; Kawai, S.; Ito, Y.; Hamajima, N. Large-scale survey of frequency of forest walking and related factors in a Japanese population inhabiting a large city, and comparison of an urban area and a rural area. J. For. Res. 2013, 18, 454–461. [Google Scholar] [CrossRef]
  36. Jang, Y.; Yoo, R.; Lee, J. The Effects of Visit Characteristics in Neighborhood Forest on Individual Life Satisfaction. J. People Plants Environ. 2019, 6, 677–690. [Google Scholar] [CrossRef]
  37. Nerg, A.; Uusivuori, J.; Mikkola, J.; Neuvonen, M.; Sievänen, T. Visits to National Parks and Hiking Areas: A Panel Data Analysis of Their Socio-Demographic, Economic and Site Quality Determinants. Tour. Econ. 2012, 18, 77–93. [Google Scholar] [CrossRef]
  38. Ministry of Internal Affairs and Communications. Reiwa 4 Nendo Chiho Kokyo Dantai No Kinmu Joken Tou Ni Kansuru Chosa Kekka [Car Ownership Trends in Japan]. 2023. Available online: https://www.airia.or.jp/publish/statistics/trend.html (accessed on 7 February 2025).
  39. Ministry of Internal Affairs and Communications. Reiwa 4 Nendo Chiho Kokyo Dantai No Kinmu Joken Tou Ni Kansuru Chosa Kekka [Results of the 2022 Survey on Working Conditions, etc. of Local Governments in Japan]. 2023. Available online: https://www.soumu.go.jp/main_content/000919479.pdf (accessed on 7 February 2025).
  40. Connolly, M. Some like it mild and not too wet: The influence of weather on subjective well-being. J. Happiness Stud. 2013, 14, 457–473. [Google Scholar] [CrossRef]
  41. Feddersen, J.; Metcalfe, R.; Wooden, M. Subjective wellbeing: Why weather matters. J. R. Stat. Soc. Ser. A Stat. Soc. 2016, 179, 203–228. [Google Scholar] [CrossRef]
  42. Keller, M.C.; Fredrickson, B.L.; Ybarra, O.; Côté, S.; Johnson, K.; Mikels, J.; Conway, A.; Wager, T. A warm heart and a clear head: The contingent effects of weather on mood and cognition. Psychol. Sci. 2005, 16, 724–731. [Google Scholar] [CrossRef]
  43. Denissen, J.J.; Butalid, L.; Penke, L.; Van Aken, M.A. The effects of weather on daily mood: A multilevel approach. Emotion 2008, 8, 662–667. [Google Scholar] [CrossRef]
Figure 1. The results of variable selection from the LASSO regression analysis, focusing on “Forest Interest” as the dependent variable. (a) Cross-validation plot for the penalty term of the Forest Interest Model. (b) LASSO coefficient profiles for the Forest Interest Model. Each colored line represents a different explanatory variable. Colors are automatically assigned.
Forests 16 00714 g001
Figure 2. The results of variable selection from the LASSO regression analysis, focusing on “Forest Visit” as the dependent variable. (a) Cross-validation plot for the penalty term of the Forest Interest Model. (b) LASSO coefficient profiles for the Forest Visit Model. Each colored line represents a different explanatory variable. Colors are automatically assigned.
Forests 16 00714 g002
Figure 3. Structural equation model focused on Forest Interest (Model 1).
Forests 16 00714 g003
Figure 4. Structural equation model focused on Forest Visit (Model 2).
Forests 16 00714 g004
Figure 5. Structural equation model focusing on the causal relationship from Forest Interest to Forest Visit (Model 3a).
Forests 16 00714 g005
Figure 6. Structural equation model focusing on the causal relationship from Forest Visit to Forest Interest (Model 3b).
Forests 16 00714 g006
Table 1. Percentage of respondents who judged it to be a forest for each type of green space.
1. Small urban parks (e.g., neighborhood playgrounds)5.5
2. Tree-lined walkways along streets8.5
3. Urban parks or gardens with ample space for walking
(e.g., large botanical gardens or city parks)
23.5
4. Suburban parks, satoyama landscapes,
or wooded areas featuring natural environments
57.2
5. Mountain trails or remote forested mountains79.9
6. Others0.7
Indicates what percentage of the 5000 respondents considered it a forest.
Table 2. Distribution of Forest Interest.
No interest14.94
Not very interested33.18
Somewhat interested37.92
Interested13.96
Percentage of 5000 respondents selecting each interest category.
Table 3. Frequency of Forest Visits in the Past Year.
I did not visit even once in the past year64.40
I visited only once in the past year11.62
I visited about once every six months10.68
I visited about once every few months7.70
I visited about once a month3.10
I visited about once a week1.08
I visited several times a week or more1.42
Percentage of 5000 respondents by visit frequency.
Table 4. Accuracy of models built by LASSO and post-LASSO for Forest Interest and Forest Visit.
Interest ModelLASSOPost-LASSOVisit ModelLASSOPost-LASSO
ROC-AUC_Interest0.8700.872ROC-AUC_Visit0.8460.848
PR-AUC_Interest0.8800.883PR-AUC_Visit0.7590.755
Precision_Interest0.7840.781Precision_Visit0.7980.806
Recall_Interest0.7600.771Recall_Visit0.8800.871
F1_Score_Interest0.7710.776F1_Score_Visit0.8370.837
The left table shows the accuracy of the Forest Interest Model, and the right table shows the accuracy of the Forest Visit Model, both of which showed moderate accuracy (AUC 0.9–0.7). The Precision and Recall probabilities, their harmonic means (F1-score), and the AUC of the Precision–Recall curve calculated from them were also shown to be good for both models.
Table 5. Variable names selected by post-LASSO in the Forest Interest Model and their coefficients, p-values, odds ratios, and 95% confidence intervals for the odds ratios. Statistical significance is indicated as follows: p < 0.05 (*), p < 0.01 (**).
VariablesCoefficientsp-ValueOR95% Cl
Forest Preference1.039150.000 **2.832.503.21
Forest Familiarity0.843930.000 **2.332.082.61
Job
Executives−0.402560.0930.670.421.07
Homemaker−0.255470.026 *0.770.620.97
Student0.423920.0611.530.982.39
Unemployed (including retirees)0.095320.4031.100.881.38
Household Annual Income
3–4 million JPY0.187700.1481.210.941.56
15–20 million JPY−0.379690.0710.680.451.03
Academic Background
High School0.171320.0801.190.981.44
Upper Secondary Specialized Training School0.443600.0571.560.992.47
Residence
Shibuya Ward0.473590.0651.610.972.67
Suginami Ward0.428490.009 **1.531.122.12
Toyoshima Ward−0.538010.012 *0.580.380.89
Katsushika Ward0.387430.026 *1.471.052.08
Childcare
Upper Elementary−0.329700.1710.720.451.15
Nature experiences in the vicinity of current home
Observation0.150810.046 *1.161.001.35
Scenic Walk0.160160.004 **1.171.051.31
Art0.043030.5751.040.901.21
Nature experiences in current travel destinations
Observation0.080590.3161.080.931.27
Scenic Walk0.161220.006 **1.171.051.32
Activity0.095480.1331.100.971.25
Greening0.071000.4081.070.911.27
Nature experiences around home when under 18 years old
Scenic Walk0.104080.0771.110.991.25
Agriculture, Forestry, and Fishing Experience0.069180.2841.070.941.22
Nature experiences in destinations under 18 years old
Observation0.098080.1241.100.971.25
Scenic Walk0.005440.9351.010.881.15
Activity0.085760.1571.090.971.23
Agriculture, Forestry, and Fishing Experience0.041690.5791.040.901.21
Hobbies for Relaxation
Music0.138890.1021.150.971.36
Walking0.229730.018 *1.261.041.52
Trip0.187940.025 *1.211.021.42
Drive0.163120.2771.180.881.58
Gardening0.298020.043 *1.351.011.80
Jogging and Sports0.343240.017 *1.411.071.87
Museum0.386070.002 **1.471.151.89
Petcare0.259710.0521.301.001.69
Hobbies for Refresh
Reading0.161080.2081.170.911.51
Walking0.059240.5731.060.861.30
Drive0.206050.2721.230.851.78
Cinema0.216380.1161.240.951.63
Warm Up0.286030.0571.330.991.79
Bathing0.155710.2101.170.921.49
Museum0.180970.3091.200.851.70
Table 6. Variable names selected by post-LASSO in the Forest Visit Model and their coefficients, p-values, odds ratios, and 95% confidence intervals for the odds ratios. Statistical significance is indicated as follows: p < 0.05 (*), p < 0.01 (**).
VariablesCoefficientsp-ValueOR95% Cl
Forest Preference0.448640.000 **1.571.391.77
Forest Familiarity0.288200.000 **1.331.191.49
Age−0.026040.000 **0.970.970.98
Job
Civil Servant0.589440.021 *1.801.092.97
Temporary Worker−0.212320.1820.810.591.10
Unemployed (including retirees)−0.149880.2150.860.681.09
Other−0.339060.2190.710.411.21
Household Annual Income
10–15 million JPY0.152520.2371.160.901.50
15–20 million JPY−0.458800.033 *0.630.410.96
Not aware of own household income−0.213250.024 *0.810.670.97
Academic Background
High School−0.070100.4910.930.761.14
Professional Training College−0.207400.1060.810.631.04
Upper Secondary Specialized Training School0.295320.1901.340.862.08
Residence
Chiyoda Ward0.451400.2481.570.733.38
Sumida Ward−0.305560.1780.740.471.14
Koto Ward−0.308900.0650.730.531.02
Shibuya Ward0.568330.018 *1.771.102.82
No Car−0.404970.000 **0.670.570.78
Childcare
No Children−0.211620.018 *0.810.680.97
Preschool Children0.176680.3781.190.811.77
Middle Elementary0.471650.049 *1.601.002.57
Nature experiences in the vicinity of current home
Observation0.112750.1061.120.981.28
Scenic Walk0.104040.0571.111.001.24
Art0.033320.6311.030.901.18
Activity0.137190.029 *1.151.011.30
Nature experiences in current travel destinations
Observation0.140480.039 *1.151.011.31
Scenic Walk0.480480.000 **1.621.451.80
Activity0.267760.000 **1.311.161.47
Nature experiences around home when under 18 years old
Scenic Walk0.033410.5261.030.931.15
Art0.009480.8801.010.891.14
Activity0.025180.6761.030.911.15
Agriculture, Forestry, and Fishing Experience0.061170.3401.060.941.20
Nature experiences in destinations under 18 years old
Observation0.040710.4981.040.931.17
Activity0.085560.1531.090.971.22
Greening−0.001440.9841.000.861.15
Lecture0.012240.8631.010.881.16
Agriculture, Forestry, and Fishing Experience0.001730.9811.000.871.15
Hobbies for Relaxation
Walking0.209260.026 *1.231.031.48
Trip0.521940.000 **1.691.412.01
Drive0.253100.039 *1.291.011.64
Gardening0.114180.3751.120.871.44
Bathing0.340690.000 **1.411.171.69
Jogging and Sports0.267070.046 *1.311.011.70
Museum0.250600.018 *1.281.041.58
Hobbies for Refresh
Walking0.113630.2521.120.921.36
Trip0.181090.0651.200.991.45
Shopping Mall0.155350.1581.170.941.45
Warm Up0.152490.2651.160.891.52
Table 7. Model fit for each structural equation by piecewise SEM.
ModelAICFisher’s Cp ValueDegrees of
Freedom
M129,239.334.10.94310
M223,881.1211.5220.31810
M3a36,692.5541.6540.07730
M3b36,688.739.5040.11530
The model has sufficient explanatory power when p > 0.05.
Disclaimer/Publisher’s Note: The statements, opinions and data contained in all publications are solely those of the individual author(s) and contributor(s) and not of MDPI and/or the editor(s). MDPI and/or the editor(s) disclaim responsibility for any injury to people or property resulting from any ideas, methods, instructions or products referred to in the content.

