Article

Ecological Benefits and Structure of Mixed vs. Pure Forest Plantations in Subtropical China

1
Jiyang College, Zhejiang A&F University, Zhuji 311800, China
2
State Key Laboratory of Subtropical Silviculture, Zhejiang A&F University, Hangzhou 311300, China
*
Author to whom correspondence should be addressed.
Forests 2025, 16(5), 738; https://doi.org/10.3390/f16050738
Submission received: 30 March 2025 / Revised: 23 April 2025 / Accepted: 24 April 2025 / Published: 25 April 2025
(This article belongs to the Section Forest Ecology and Management)

Abstract

:
Numerous studies on biodiversity–ecosystem functioning (BEF) have shown that mixed plantations can improve the ecological benefits of forest ecosystems. However, few studies have employed a multi-dimensional approach to study the integrated ecological benefits of mixed plantations. This study aims to evaluate the stand characteristics and ecological benefits of different forest types by examining various ecological indicators, including trees, shrubs, herbs, and soil properties. Focusing on typical mixed broadleaf–conifer plantations (MBCPs), mixed coniferous plantations (MCPs), and pure Cunninghamia lanceolata (Lamb.) Hook plantations (PCLs) at the Guiyang Plantation Farm, Suichang, we analyzed growth performance, spatial structure, understory vegetation diversity, and soil physicochemical properties across these forest types. For each forest type, one 100 × 100 m plot was established. Within each plot, five 20 × 20 m subplots were selected for investigation. Our results show that the aboveground biomass of MCPs is higher than that of MBCPs and PCLs, with increases of 46.58% and 177.29%, respectively. Furthermore, both mixed plantations offer better stand structure compared to pure plantations. In mixed plantations, the MBCPs exhibited a high degree of niche overlap, indicating that interspecific competition outweighed complementarity, whereas the MCPs demonstrated a more favorable stand structure. MCPs also exhibit significantly greater understory vegetation diversity compared to MBCPs and PCLs, with increases of 4.19%–13.04% and 10.34%–36.99%, respectively. Additionally, mixed plantations enhance soil moisture retention and fertility. With the onset of global warming and the increasing prevalence of extreme weather events, the establishment of artificial mixed plantations is an essential strategy to address climate change and enhance the ecological benefits of plantations.

1. Introduction

The primary objective of establishing artificial plantations was initially to address the scarcity of wood resources for human needs [1]. However, with the onset of global warming and the increasing prevalence of extreme weather events, artificial plantations have become relevant to wider ecological concerns [2]. Globally, forests serve as vital natural carbon reservoirs, and afforestation is widely recognized as a key strategy to boost terrestrial carbon stocks, contributing to climate change mitigation [3]. The reconstruction and sustainable management of artificial plantations have gained critical importance in safeguarding the environment and maintaining forest productivity [4]. Currently, large-scale afforestation initiatives are being implemented globally. In China, the vast territory and diverse geological features create favorable conditions for the cultivation of various plantation tree species. Over the past decades, however, extensive deforestation driven by agricultural expansion has led to a significant reduction in forest cover [5]. To combat the degradation of land caused by human activities and climate change, artificial plantations are now being established to restore ecosystems, provide ecological services, and contribute to climate change mitigation. As this trend gains prominence on a global scale, the development of future afforestation strategies must be informed by a comprehensive understanding of the ecological benefits provided by artificial plantations. Such knowledge will be essential for addressing environmental challenges in the decades ahead.
Biodiversity is widely recognized as a key determinant of community and ecosystem dynamics, potentially being the primary factor influencing ecosystem function [6]. Generally, the presence of multiple species together boosts productivity; this is called biodiversity–ecosystem functioning (BEF) [7]. This idea primarily originates from studies conducted on grassland ecosystems [8]. In the last twenty years, BEF research has extended to forest ecosystems [9], with studies indicating that biodiversity positively impacts forest ecosystem functions [10]. Research demonstrates that mixed plantations enhance the ecological functions and benefits of forest plantations [11]. While much of the existing research has focused on evaluating the ecological impacts of mixed plantations through a singular perspective, several studies highlight the specific advantages of mixed forests in promoting forest health and biodiversity [12]. In studies of understory vegetation, the diversity index in mixed plantations often exceeds that of pure plantations [13]. Similarly, from a soil health standpoint, the soil in mixed plantations typically exhibits superior nutrient content and overall fertility compared to that in pure plantations [14]. The growth status [15], spatial structure [16], understory vegetation diversity [17], and soil properties [18] of forests all play pivotal roles in shaping their ecological functions and structural integrity. Together, these factors contribute to the overall ecological performance of forest ecosystems.
The interaction between multiple factors plays a critical role in determining the integrated ecological benefits of plantations [17]. Previous research has assessed the ecological benefits of mixed plantations from various perspectives [19]. However, the available knowledge was so far rather fragmented and could not provide a holistic picture of mixed-species forests [20]. Taking an integrated approach is essential for plantation managers, as it offers a more detailed insight into the variations in stand structure and the ecological benefits of artificial plantations, which is crucial for promoting sustainable plantation development. This study focuses on typical forest types found in the Guiyang Plantation Farm, Suichang, including mixed broadleaf–conifer plantations (MBCPs), mixed coniferous (Pinus hwangshanensis W. Y. Hsia and C. lanceolata) plantations (MCPs), and pure C. lanceolata plantations (PCLs). We evaluated the characteristics and ecological benefits of different forest types from several angles, including tree growth, understory vegetation, and soil properties, to assess the overall effect of mixed plantations on forest ecology. Specifically, we used tree height, diameter at breast height, and biomass to analyze stand growth; spatial structure to reflect changes in ecological niches of tree species; understory vegetation diversity to analyze biodiversity; and soil physicochemical properties to assess water retention and nutrient content of soils. Due to the region’s climatic conditions, we hypothesize that the growth of mixed plantations is better than pure plantations and the growth performance of the mixed coniferous plantations surpasses that of the mixed broadleaf–conifer plantations. The study aimed to answer the following questions: (1) How do the three forest types differ in terms of stand growth? (2) How do mixed plantation forests promote forest growth and development? And (3) how do the integrated ecological benefits vary between pure and mixed plantations?

2. Materials and Methods
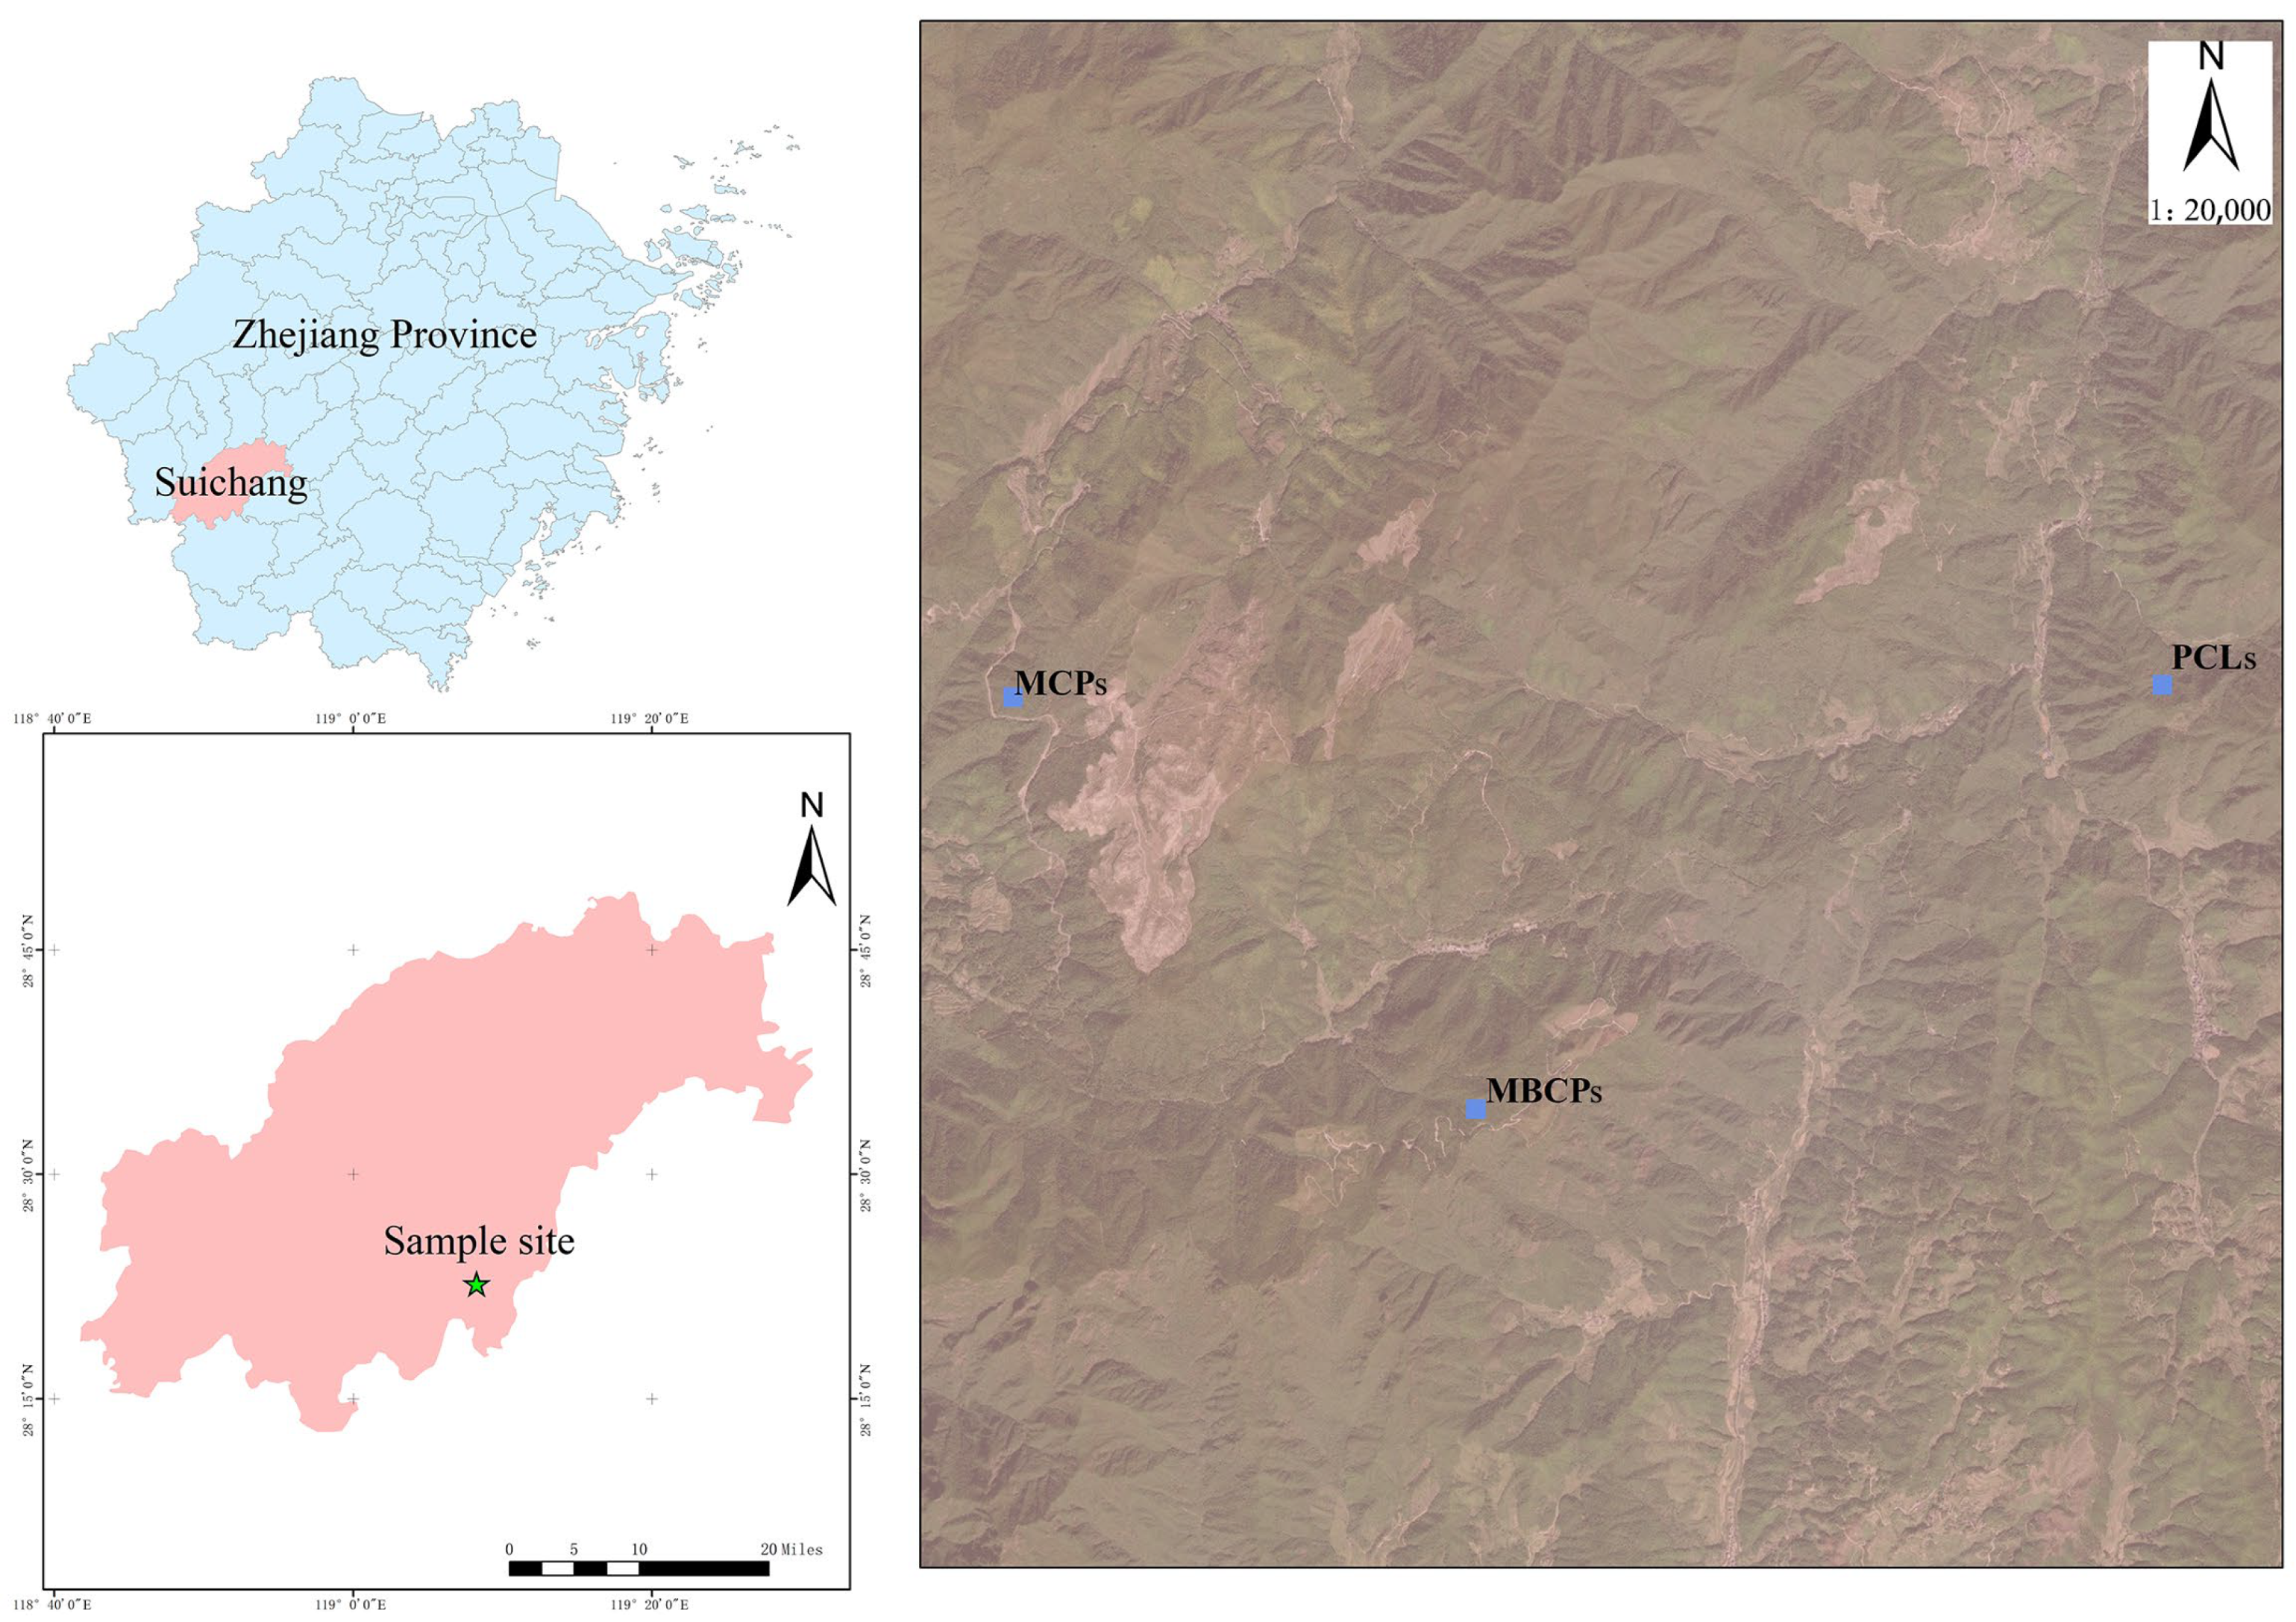
2.1. Study Area

The study was conducted at the Guiyang Plantation Farm, located in the southern part of Suichang, Lishui City, Zhejiang Province, with coordinates at 28°20′0″–28°22′30″ N and 119°5′30″–119°8′30″ E (Figure 1). The region is characterized by a subtropical monsoon climate, with warm winters and cool summers. The area receives abundant rainfall, high humidity, and experiences foggy conditions in the winter and spring. It also benefits from long periods of sunshine, all of which are conducive to forest growth. Annual precipitation ranges from 1850 to 2400 mm, with an average temperature between 10 °C and 14 °C. The frost-free period spans from 180 to 230 days, and the altitude varies between 800 and 1200 m above sea level. The predominant soil types in the area are subtropical humid mountainous red soils and yellow soils. The natural vegetation in the region is dominated by mixed broadleaf–conifer plantations and mixed coniferous plantations.

2.2. Forest Management History

The Guiyang Plantation Farm in Suichang underwent afforestation in the 1980s. The tree species planted in the research area have not been subjected to large-scale pest infestations, diseases, or forest fires. Prior to planting, seedlings of C. lanceolata and P. hwangshanensis were carefully cultivated, with management practices including irrigation, water and fertilizer optimization, and weed control. Various afforestation approaches were applied across the plantation forest area 43 years ago. The PCL was planted with C. lanceolata, the MCP was planted with P. hwangshanensis and C. lanceolata, and the MBCP was planted with P. hwangshanensis, C. lanceolata, Schima superba Gardner & Champ, and Quercus glandulifera Blume. For this study, three sample plots with similar site conditions but differing afforestation methods were selected for investigation. The sample plots selected for this study are representative of the typical characteristics of the area.

2.3. Field Survey and Sampling

In July 2023, three large plots (100 × 100 m) were selected based on field surveys and satellite imagery, representing three forest types: MBCPs, MCPs, and PCLs. From each large plot, five smaller plots (20 × 20 m) were established, including one center plot and four corner plots. In each sample plot, all trees with a diameter at breast height (DBH) ≥ 5 cm were measured, and their species and coordinates were recorded [21]. Tree height was measured using a laser hypsometer (BSH1500, Boshihang Company, Beijing, China). The basic characteristics of the plots are presented in Table 1. The tree species of the three forest types are shown in Table S1.

2.4. Survey of Understory Shrubs and Herbaceous Plants

In each 20 × 20 m plot, eight groups of shrub and herbaceous layer plots were established at regular intervals (Figure 2). The 20 × 20 m plot was subdivided into 5 × 5 m small plots. A 2 × 2 m shrub plot was then placed in the upper left corner of every non-adjacent 5 × 5 m small plot, with a 1 × 1 m herbaceous plot nested within it. As a result, each small plot contained 8 shrub and herbaceous plots, and each large plot contained a total of 40 shrub and herbaceous plots. A species survey was conducted for each shrub and herbaceous plot, recording the plant types, quantities, and coverage based on their classification into plant species and families [22].

2.5. Investigation of Physical and Chemical Properties of Soil

Soil was taken from each corner of a 20 × 20 m plot using a soil-coring ring method, within a 5 m radius of the plot’s center. At each sampling point, three random positions were selected along three directions on the circumference, each with a radius of 50 cm. The upper layer of dead branches and leaves was removed, and a soil auger was used to sample the 0–20 cm soil layer. Soil samples from the three locations were then pooled together, and stones, coarse roots, grass leaves, and other debris were removed. The prepared soil samples were placed in self-sealing bags for subsequent chemical analysis. The soil chemical properties analyzed in this study included pH, total organic carbon (TOC), total nitrogen (TN), total phosphorus (TP), available phosphorus (AP), ammoniacal nitrogen (AN), and nitrate nitrogen (NN). The soil chemical properties of different types of forest are different [23,24]. The soil chemical properties analyzed in this study (pH, TOC, TN, TP, AP, AN, and NN) are critical determinants of plantation productivity [25]. The determination of soil pH was achieved using a pH meter assay. NN was determined using the Automated Colorimetry method. TN was measured using the semi-micro Kjeldahl method, while AN was quantified using the alkali-diffusion absorption method. AP was extracted with hydrochloric and sulfuric acids, and its concentration was determined using the molybdenum-antimony resistance colorimetric method [26]. TP was measured by spectrophotometry [27], and TOC was determined using the catalytic combustion method [28].

2.6. Data Analysis

2.6.1. Analysis of Stand Biomass

Numerous studies have been conducted on aboveground biomass in Zhejiang Province, resulting in a variety of allometric equations for estimating aboveground biomass growth. It is generally accepted that allometric growth equations established within the same climatic region can be applied more broadly to similar contexts. To estimate the species-specific allometric variance of trees in the sample plots, published methods for biomass estimation were utilized. The aboveground biomass equations for S. superba, C. lanceolata, and others are presented below [29]:
S. superba AGB = 0.07103 ((DBH)2H)0.91
C. lanceolata AGB = 0.11584 ((DBH)2H)0.75
Others AGB = 0.09459((DBH)2H)0.87
AGB represents the aboveground biomass (kg), DBH denotes the diameter at breast height (cm), and H refers to the tree height (m).

2.6.2. Calculation of the Importance Value and Index for Forest Spatial Structure

The application of spatial structural parameters, such as the angular scale between four adjacent trees, is a well-established technology that can accurately describe and analyze tree size differentiation, isolation, and spatial distribution patterns within forest communities [30]. To mitigate edge effects, a 5 m inward buffer zone was established at the edges of the sample plots [16]. The intensity of forest competition was assessed using the Hegyi competition index [31].
  • Uniform angle index ( W i )
The uniformity angle scale of adjacent trees surrounding a reference tree (i) is used to describe spatial distribution patterns. It is defined as the ratio of the number of α angles smaller than the standard angle (α° = 72°) to the total number of four α angles within the spatial structural unit [32]. The W i was computed using Formula (1), which is as follows:
W i = 1 4 j = 1 4 z i j
Z i j   = 1 ,     W h e n   t h e   j t h   a n g l e   α   i s   l e s s   t h a n   t h e   s t a n d a r d   a n g l e   α 0 0 ,     O t h e r w i s e
There are five possible values for the angular scale uniformity index: W i   = 0 (very uniform), W i   = 0.25 (uniform), W i   = 0.5 (random), W i   = 0.75 (non-uniform), and W i   = 1 (very non-uniform). The spatial distribution characteristics of the forest stand within a large plot can be determined by calculating the average angular scale of all tree species in the plot. The value of the average angular scale ( W ¯ ) is found to be randomly distributed within the range [0.475, 0.517], uniformly distributed below 0.475, and clustered above 0.517. The W ¯ was computed using Formula (2), which is as follows:
w ¯ = 1 n i = 1 n   w i = 1 4 n i = 1 n   j = 1 4   z i j
  • Neighborhood Comparison ( U i )
The size ratio, used to describe the degree of difference in tree size, has five possible values: U i   = 0 (advantage), U i   = 0.25 (sub-advantage), U i   = 0.50 (moderate), U i   = 0.75 (disadvantage), and U i   = 1.00 (absolute disadvantage) [33]. The U i was computed using Formula (3), which is as follows:
U i = 1 4 j = 1 n k i j
k i j   = 0 ,     If   the   adjacent   tree   j   is   smaller   than   the   reference   tree   i 1 ,     Otherwise
  • Mingling degree ( M i )
The degree of spatial isolation of tree species in mixed plantations is quantified using the following values: 0 (zero degree mixed), 0.25 (weak degree mixed), 0.50 (moderate degree mixed), 0.75 (strong degree mixed), and 1.00 (extremely strong degree mixed) [34]. The M i was computed using Formula (4), which is as follows:
M i = 1 4 j = 1 4 v i j
v i j   = 1 ,     When   the   reference   tree   i   is   not   of   the   same   species   as   the   jth   adjacent   tree 0 ,     Otherwise
Commonly used forest structure indicators in ecological research, such as relative abundance, relative significance, and importance value, are employed to assess the role of tree species within a community. Tree species with higher importance values are considered more integral to the community structure [35].
Relative abundance = (number of individuals of a species/number of individuals of all species) × 100%
Relative significance = the cross-sectional area of a certain species/the total cross-sectional area of all species × 100%
Relative height = the height of a certain species/the total height of all species × 100%
Importance value = (relative abundance + relative significance + relative height degree)/3

2.6.3. Species Diversity of Understory Shrubs and Herbs

Shannon–Wiener diversity index (H′) [36]:
H = i = 1 S p i ln P i
P i represents the percentage of the i-th tree species in the total number of trees in the forest stand, and S denotes the total number of tree species in the forest stand.
Richness index ( M ) [37]:
M = S 1 / ln N
S represents the number of tree species, while N denotes the total number of individuals across all tree species.
The Pielou evenness index (E) is used to quantify the evenness of species distribution in the community [38]:
E = H / ln S
H′ represents the Shannon–Wiener index, and S denotes the total number of tree species in the forest stand.
Simpson dominance index ( λ ) [39]:
λ = 1 1 s P i 2
S represents the total number of tree species, while P denotes the percentage of the i-th tree species in the total number of trees in the forest stand.

2.6.4. Physico-Chemical Properties of Soil

Soil physical properties include soil bulk density (SBD), total porosity (TP), soil water content (SWC), and field water capacity (FWC).
S B D = m 2 m V
T P = 1 V o l u m e   m a s s   o f   s o i l T h e   p r o p o r t i o n   o f   s o i l × 100 %
S W C = m 1 m 2 m 2 m × 100 %
F W C = T h e   s o i l   w e t   w e i g h t T h e   s o i l   d r y   w e i g h t T h e   s o i l   d r y   w e i g h t × 100 %
In this context, m1 denotes the total mass of the fresh soil sample, including the ring knife, while m2 represents the total mass of the dry soil sample with the ring knife. The mass of the ring knife alone is denoted by m, and V refers to the volume of the ring knife.

2.7. Statistical Analysis

Winkelmass 1.0 and SPSS 27.0 software were used for data handling and analysis. Data were tested using one-way ANOVA with LSD as a multiple comparison method. The significance level was set at α < 0.05 and α < 0.01. And Origin 2022 was used for drawing.

3. Results

3.1. Stand Growth

Overall, significant differences were observed in both biomass and breast-height diameter among the three forest types (Figure 3). The biomass of MCPs was significantly higher than that of MBCPs and PCLs, with increases of 46.58% and 177.29%, respectively. The height of trees in both MBCPs and MCPs was greater than that in PCLs, with MCPs exceeding MBCPs in height. The maximum breast diameter was observed in MCPs, with only a small difference between MBCPs and PCLs.

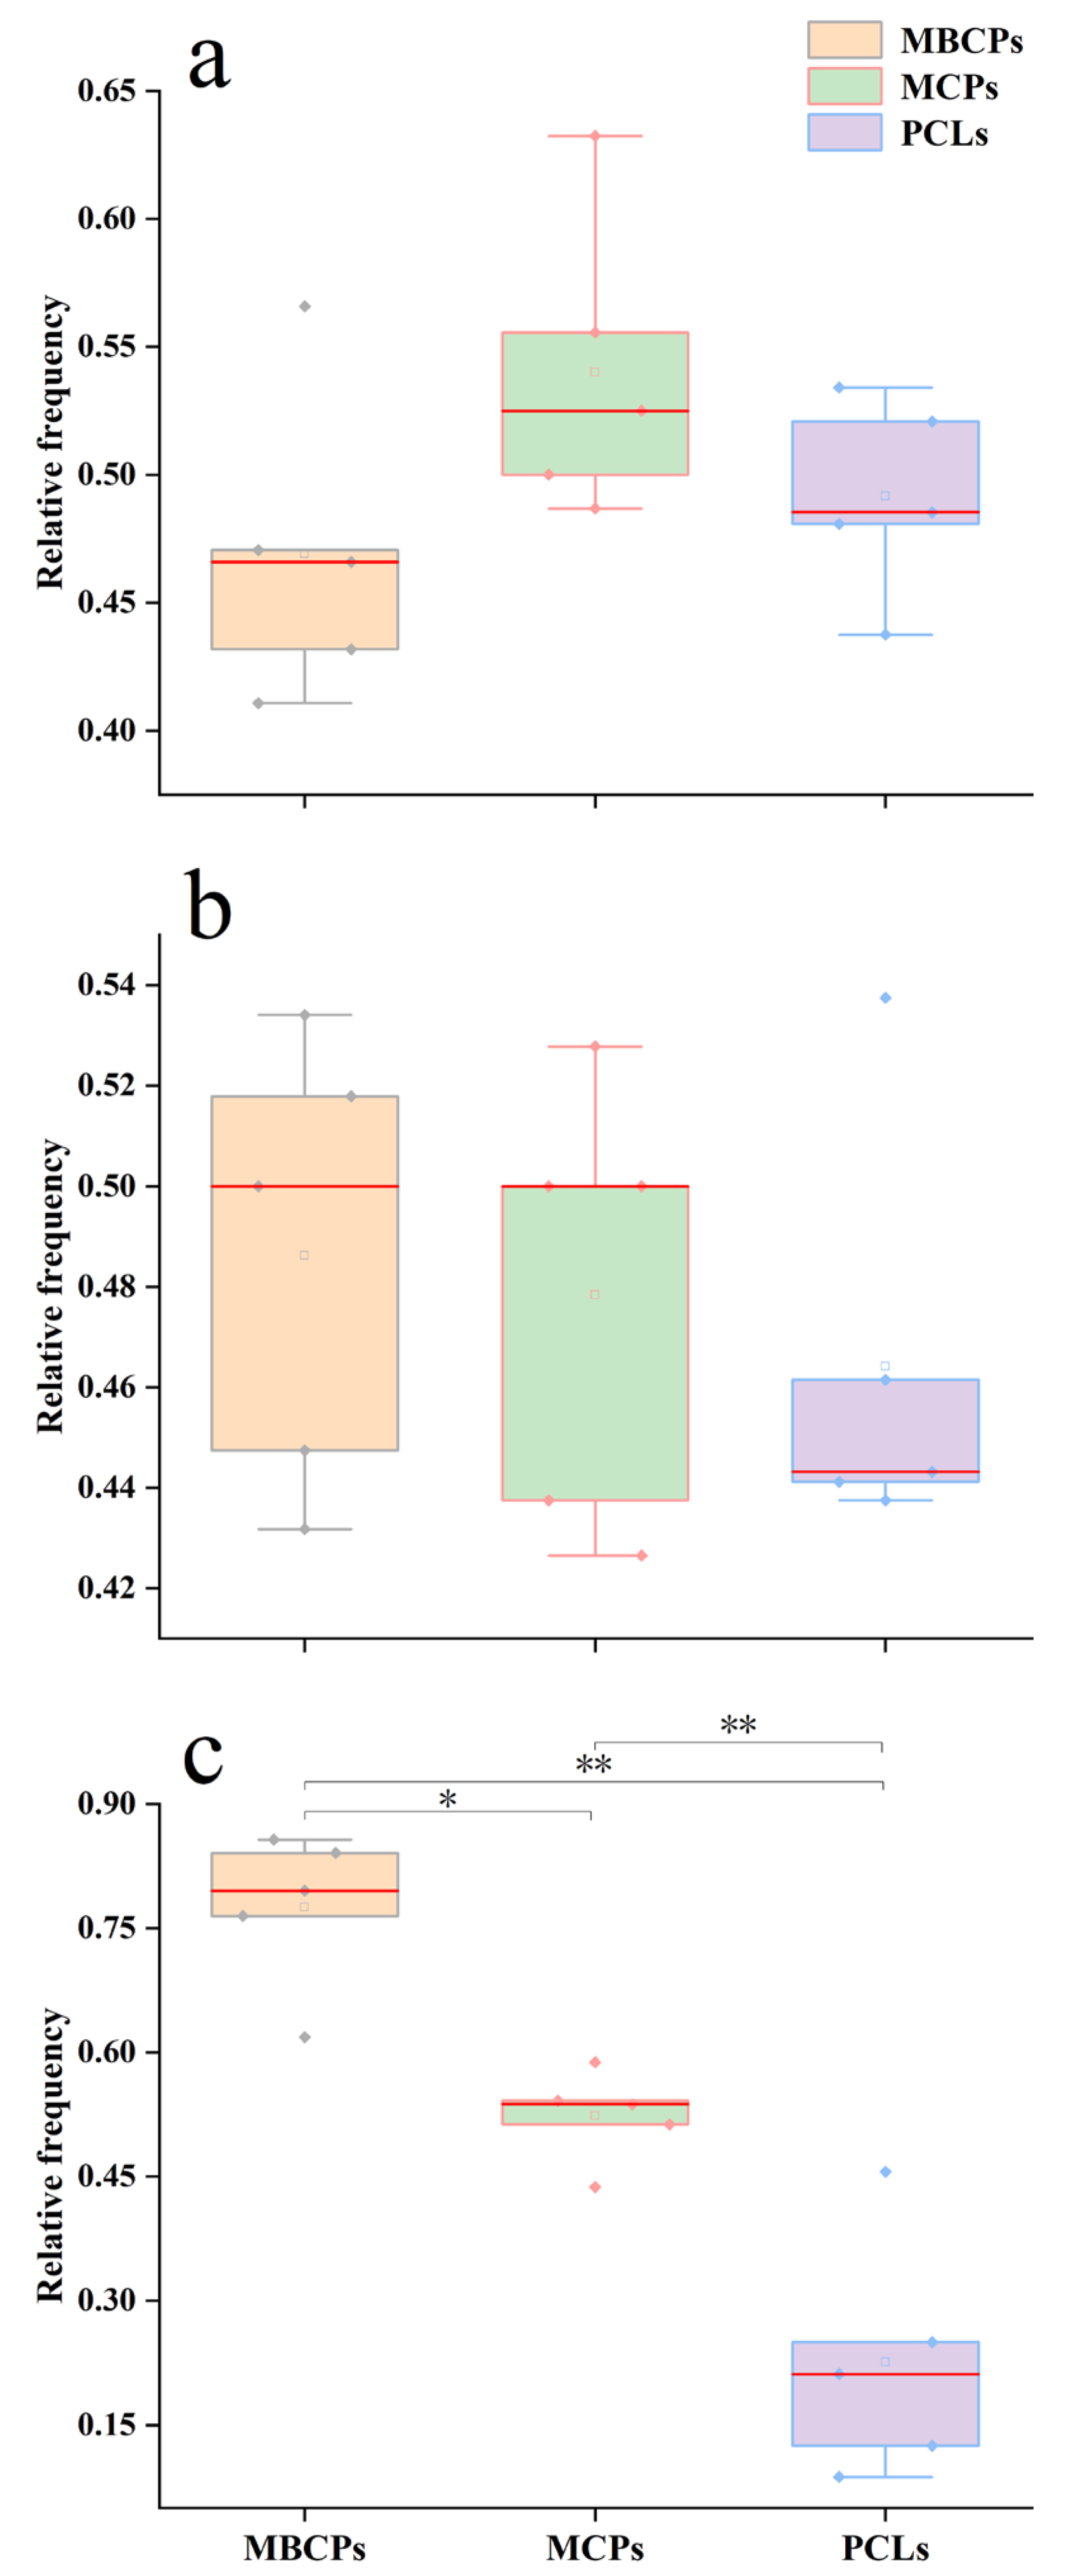
3.2. Stand Structure

In the MBCPs, there are seven tree species (Table S1), with the combined importance values of P. hwangshanensis (29.85%), C. lanceolata (24.14%), Q. glandulifera (12.31%), and S. superba (18.27%) exceeding 80% of the total for all species in the sample plot. This indicates that these species are dominant, while the remaining species are considered subordinate. In the MCPs, also with seven tree species, the combined importance values of C. lanceolata (40.98%) and P. hwangshanensis (29.95%) exceed 70%, demonstrating their absolute dominance in the sample plots. In the PCLs, the importance value of C. lanceolata alone approaches 75%, while the importance values of the other two species are below 15%. This suggests that the plot is a pure C. lanceolata plantation, dominated by a single species.
The uniform angles (MBCPs, MCPs, and PCLs) are 0.4690, 0.5400, and 0.4917, respectively (Figure 4). These values suggest that the trees in the PCLs are randomly distributed, while MBCPs exhibit a uniform tree distribution, and MCPs show a clustered distribution. The neighborhood comparison values for the three forest types are 0.4862, 0.4784, and 0.4642, respectively, indicating that MBCPs and MCPs are in a moderate growth state, while PCLs are experiencing growth pressure. The mingling values for the three forest types are 0.7753, 0.5236, and 0.2260, respectively, indicating that MBCPs are in an extremely strong mixed state, MCPs in a weak mixed state, and PCLs in a very weak mixed state. The competition indices for the three forest types are as follows: MBCP (2.37) > PCL (2.09) > MCP (1.85), reflecting the highest level of competition among tree species in MBCPs, followed by PCLs, and the lowest in MCPs (Table S1).

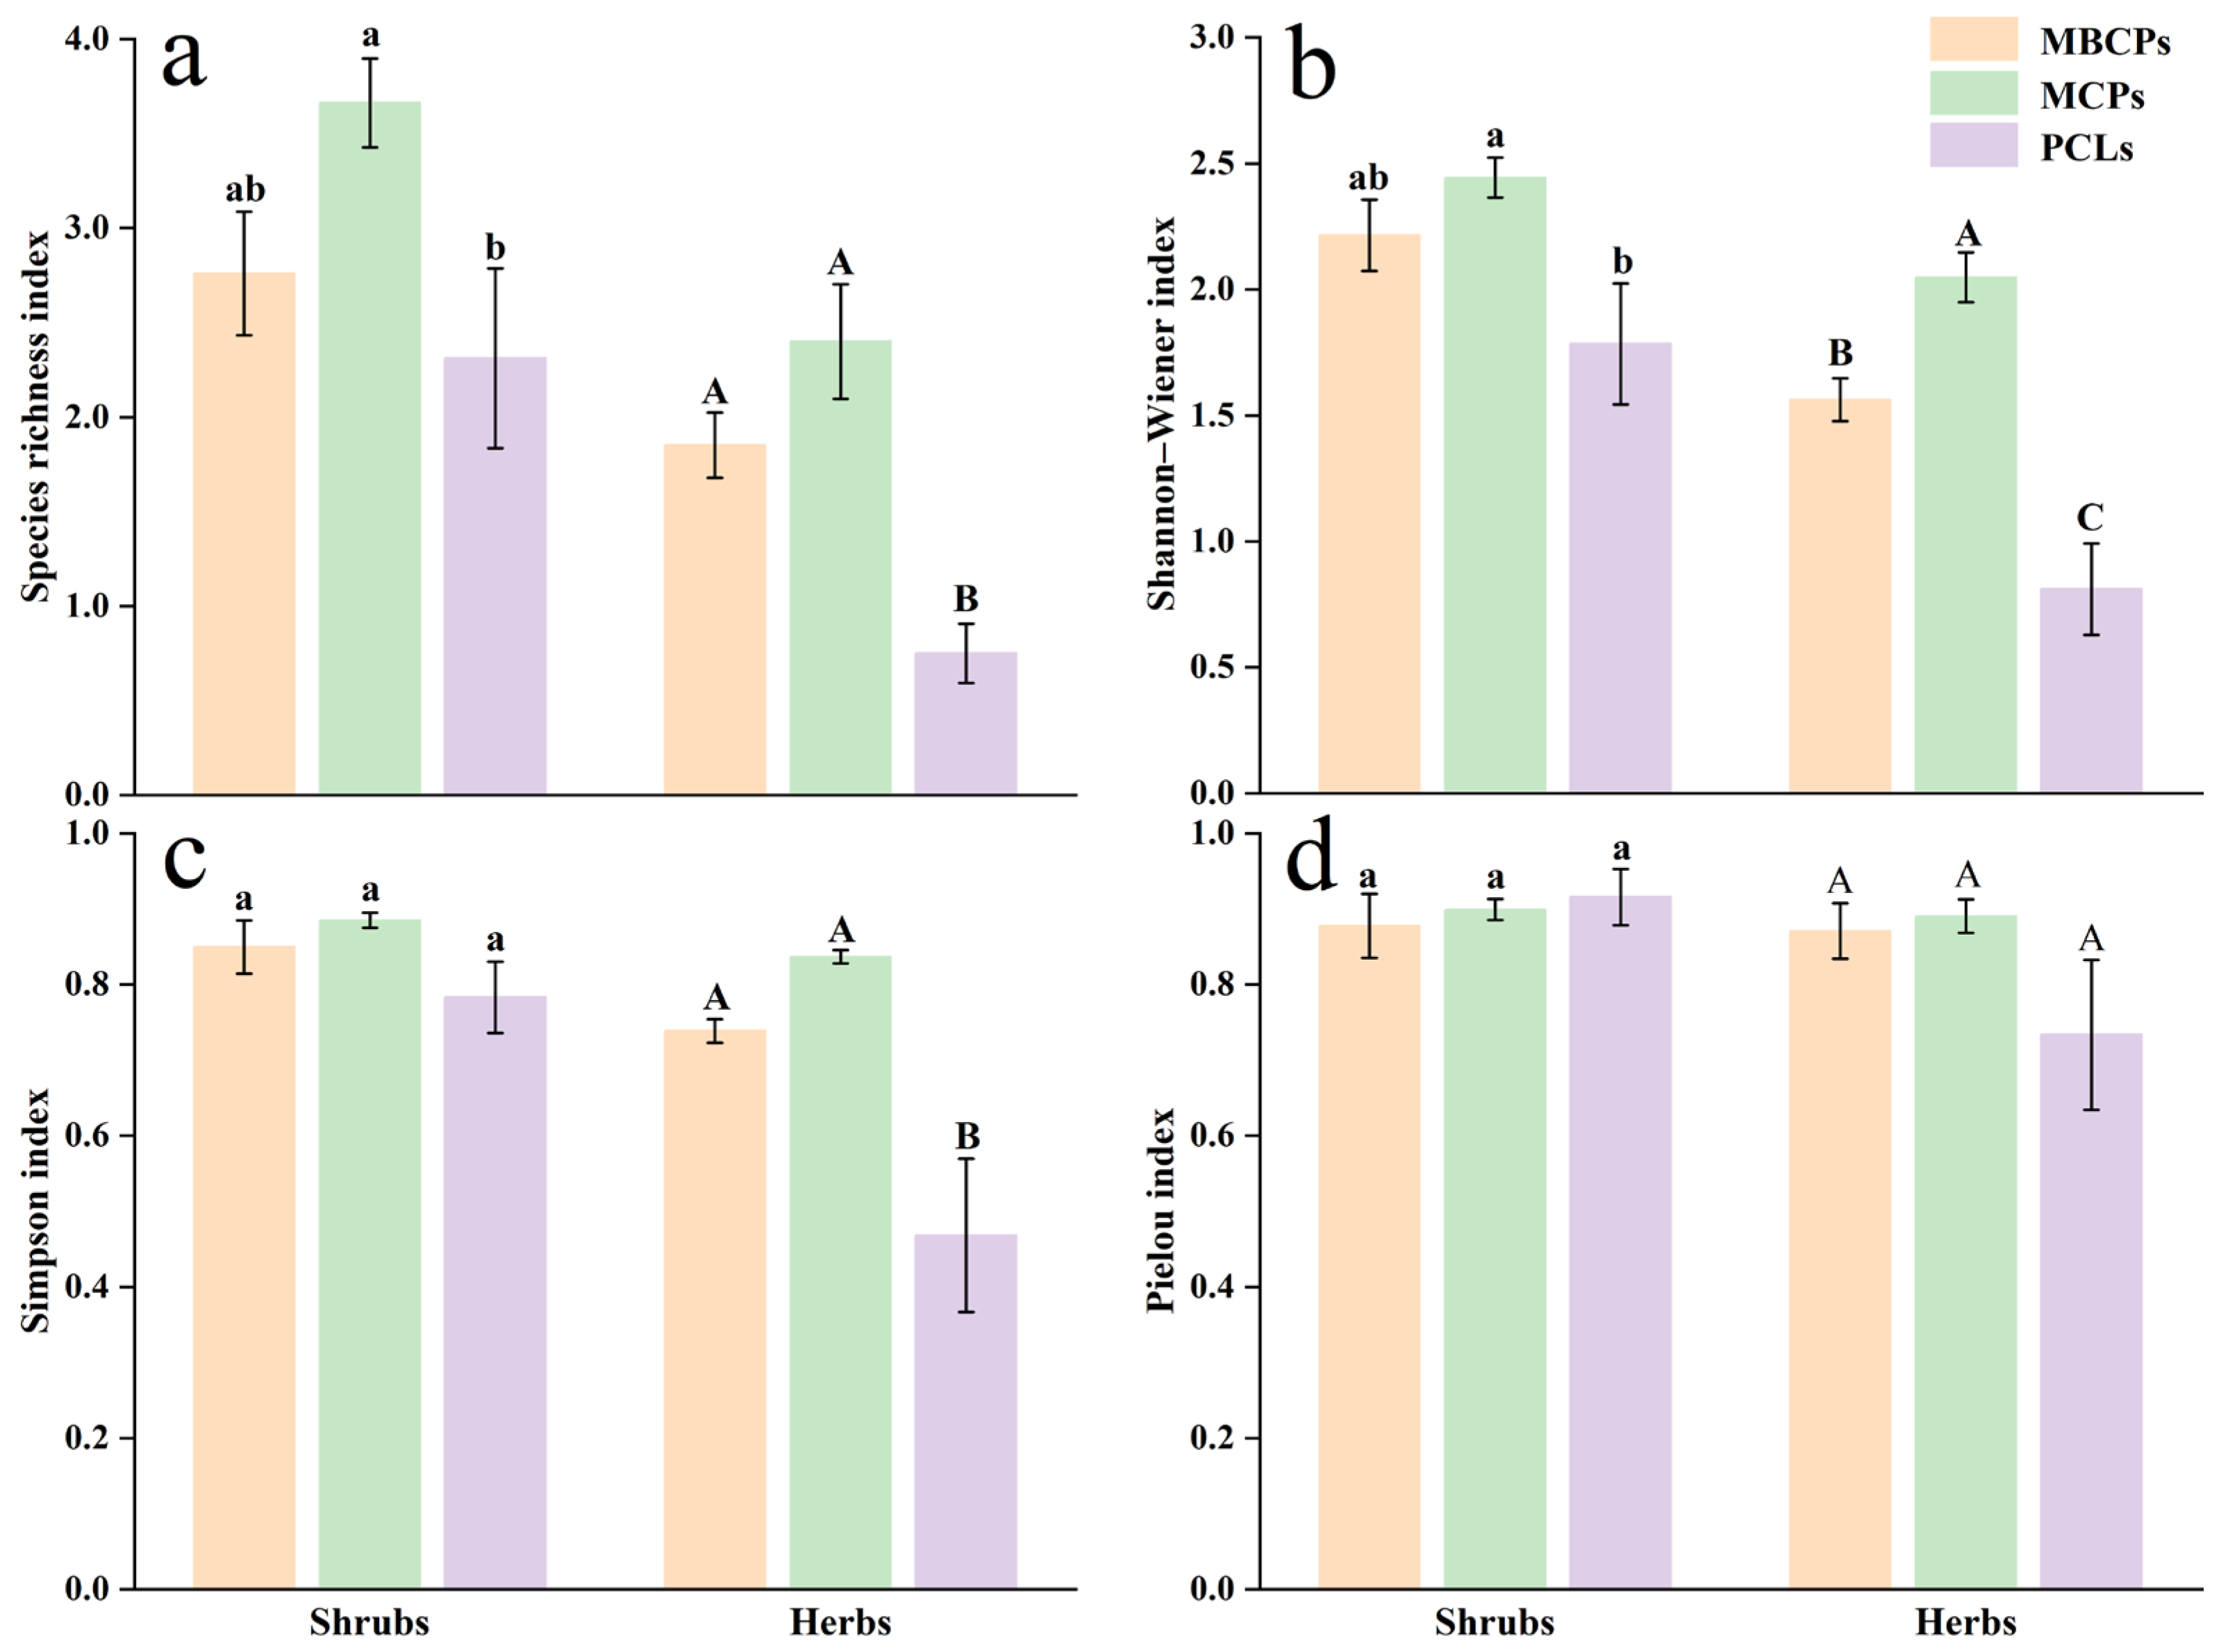
3.3. Species Composition and Diversity of Understory Shrubs and Herbaceous Plants

In the MBCPs, the dominant understory shrub species are Rhododendron simsii Planch, Eurya rubiginosa Hung T. Chang, Eurya muricata Dunn, and Rhododendron farrerae Sweet, with a total importance value of 51.58%. In the herbaceous layer, Miscanthus sinensis is the dominant species, with an importance value of 41.70% (Table S2). In the MCPs, the dominant understory shrub species are R. simsii and E. muricata, with a total importance value of 32.41%. The importance value of Ophiopogon japonicus (L. f.) Ker Gawl and Woodwardia japonica (L. f.) Sm was 33.88%, and they are the dominant species among the herbs. In the PCLs, the dominant understory shrub species are Rubus buergeri Miq, R. simsii, and E. muricata, with a total importance value of 42.69%. The importance value of Diplopterygium glaucum (Thunb. ex Houtt.) Nakai was 52.49%, and it is the dominant species among the herbs. All the shrub species in the three plots are shade-tolerant, including R. buergeri, R. simsii, and E. muricata. The herbaceous species across the plots are also shade-tolerant, with ferns being the most common.
Overall, the understory vegetation diversity in MCPs was significantly higher than in MBCPs and PCLs, with increases of 4.19%–13.04% and 10.34%–36.99%, respectively (Figure 5). The richness index, Simpson diversity index, and Shannon–Wiener diversity index for both the shrub and herb layers were highest in MCPs, with significant differences observed (p > 0.05). For the shrub and herb layer, the Simpson and Shannon–Wiener diversity indices followed the following order: MCPs > MBCPs > PCLs. In the Pielou index of shrubs, PCLs > MCPs > MBCPs.

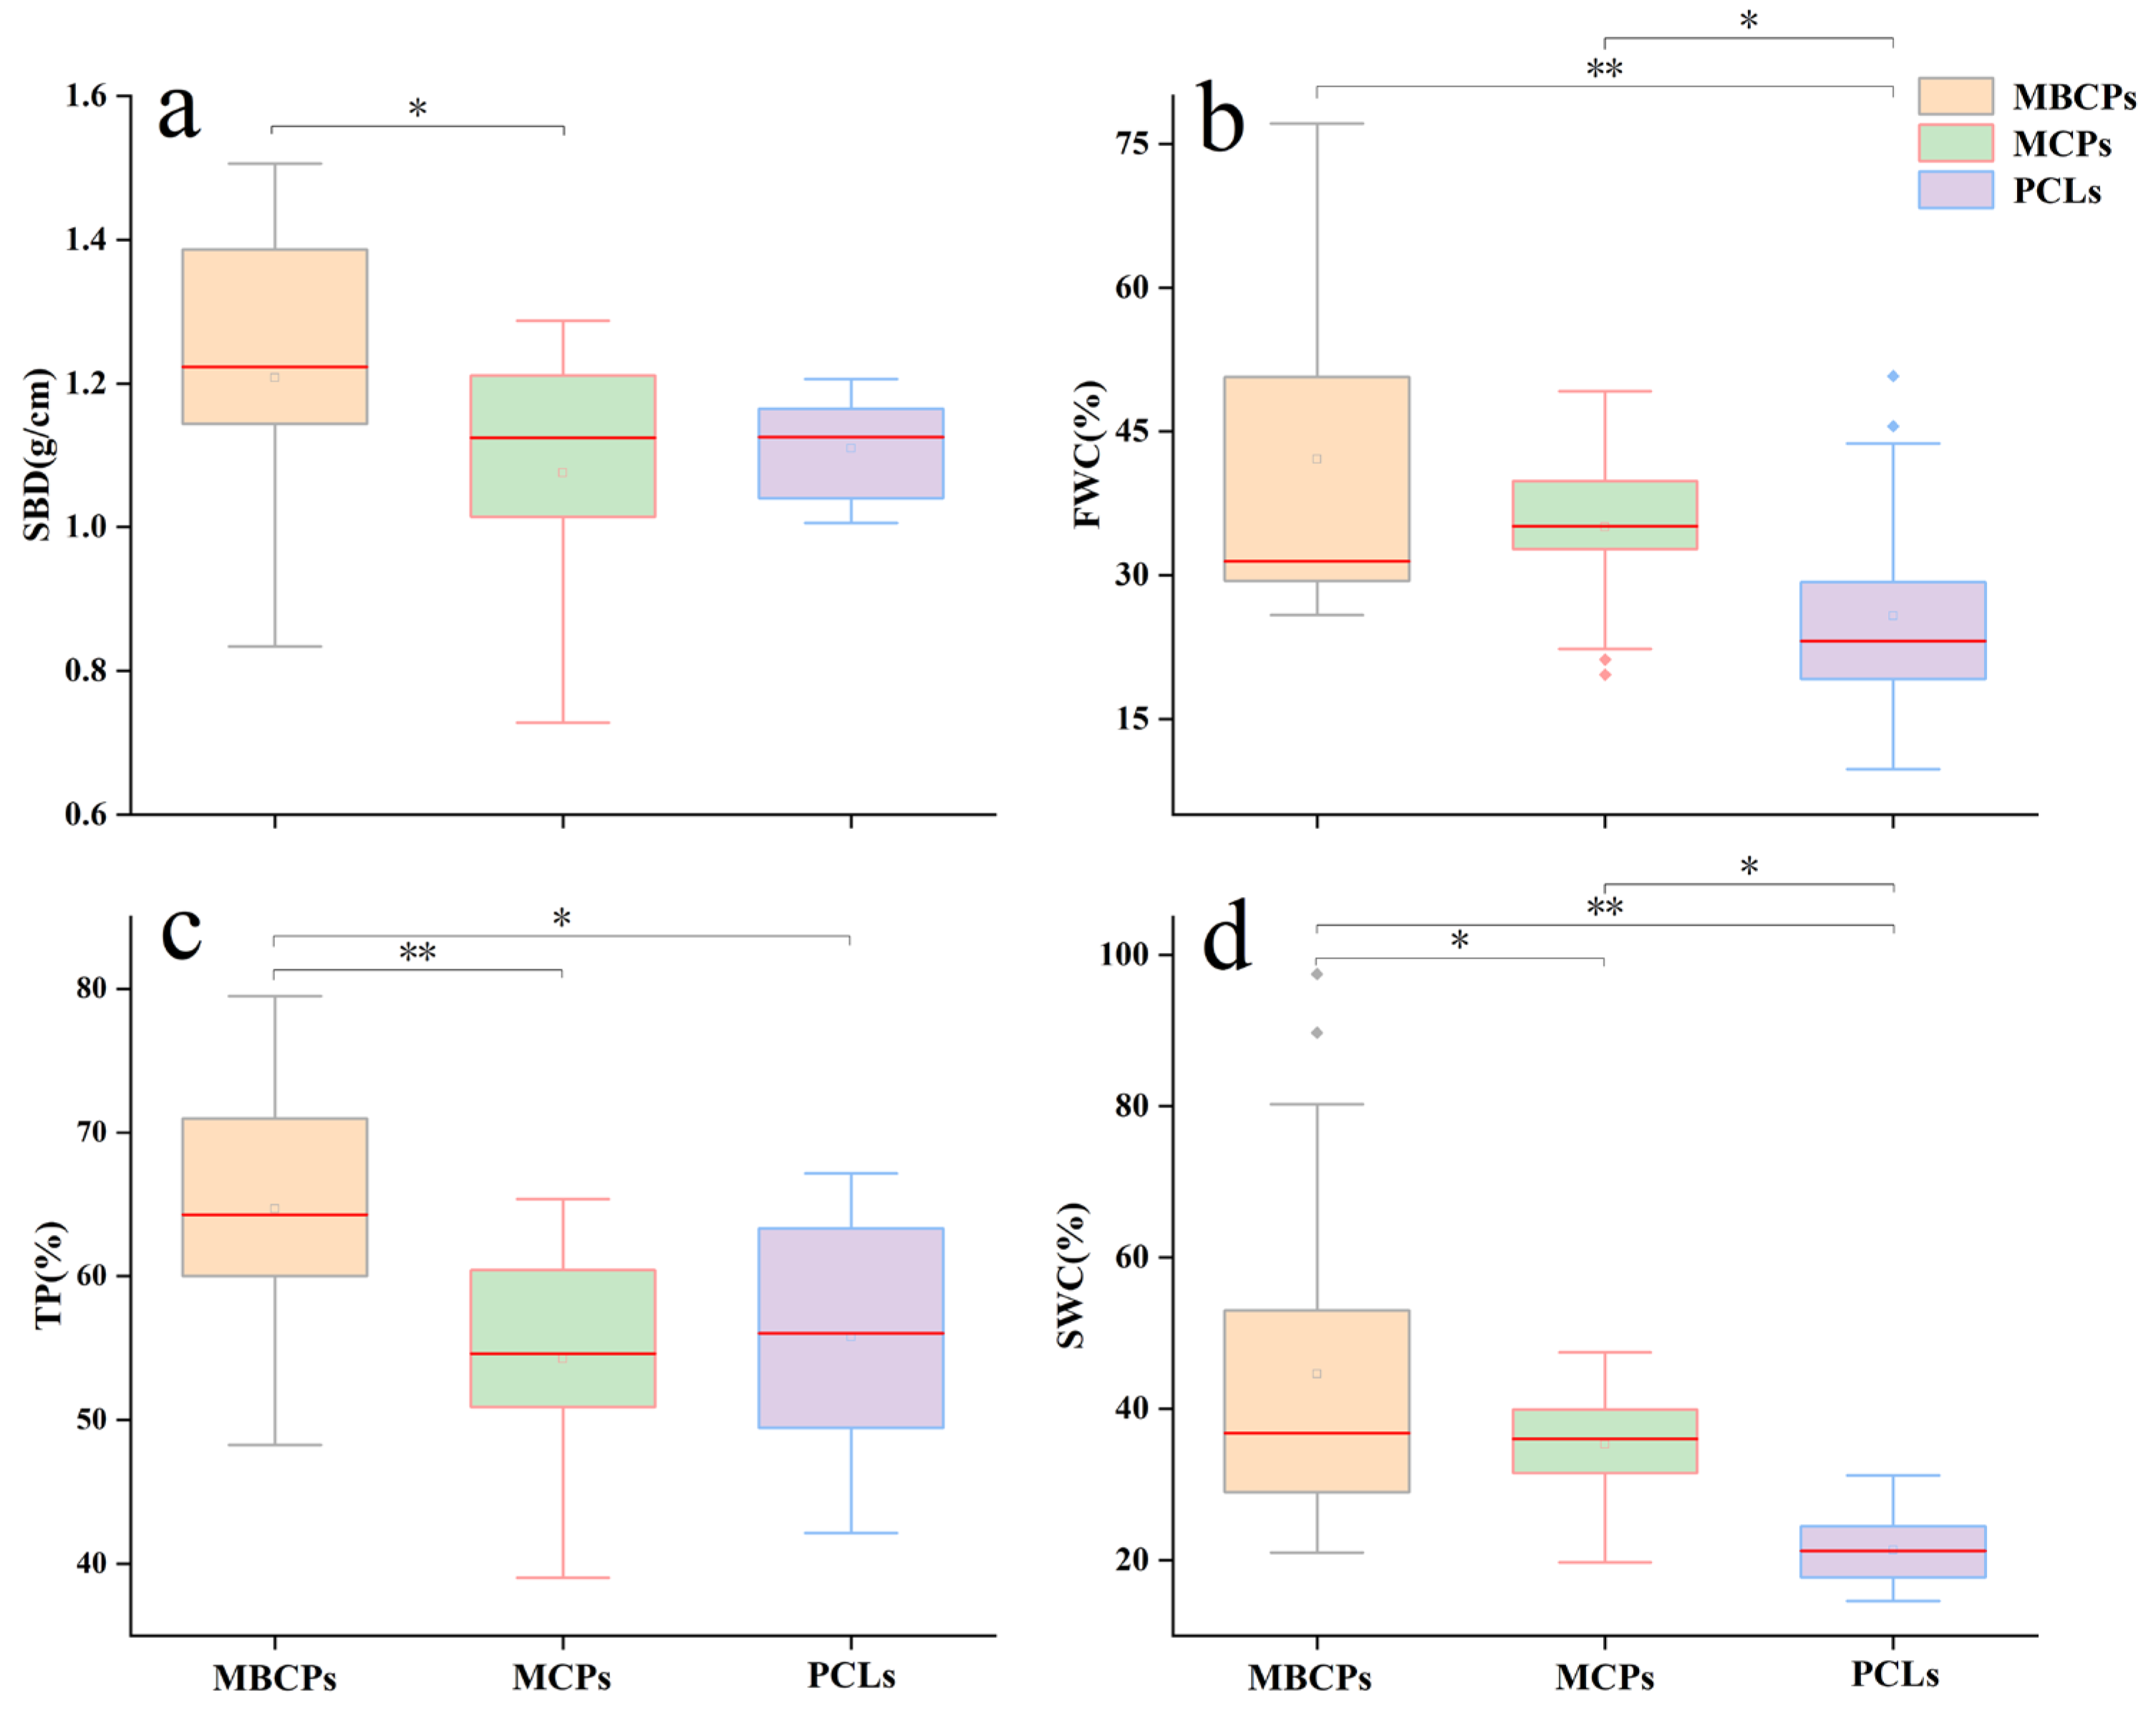
3.4. Soil Physical and Chemical Properties

The SBD of the three forest types is MBCPs > PCLs > MCPs (Figure 6), while TP also shows the sequence MBCPs > PCLs > MCPs. In terms of FWC and SWC, both MCPs and MBCPs are higher than PCLs, with the difference between MCPs and MBCPs being relatively small. Significant differences were observed in the pH value, AN, NN, TN, TP, AP, and TOC across the different forest types. Among the three forest types, the pH, TN, TP and TOC were highest in PCLs. MCPs had the highest AN and AP content, while MBCPs had the highest NN content but the lowest TP and TOC content (Table 2).

4. Discussion

4.1. Analysis of Stand Growth Conditions and Spatial Structure

Research has demonstrated that mixed plantations can enhance forest growth, although their benefits may be constrained by interspecific competition [40]. The productivity of artificial mixed plantations significantly exceeds that of pure plantations [20,41]. In this study, the importance value of C. lanceolata in PCLs was 73.64%, with a comprehensive advantage of 99.85% and a competition index of 2.09, indicating that Chinese fir is primarily subject to intraspecific competition. In contrast, in MBCPs and MCPs, C. lanceolata is mixed with other species such as P. hwangshanensis and S. superba, resulting in higher productivity, tree height, and DBH compared to PCLs, in line with previous research [42]. Notably, MCPs showed the most significant improvement, with increases of 177.29%, 20.96%, and 27.87%, respectively. MCPs in mixed plantations demonstrated 46.58%, 32.70%, and 15.14% greater biomass, height, and DBH, respectively, relative to MBCPs. C. lanceolata appeared in all three plots, with an importance value exceeding 20% and a comprehensive advantage of over 80%. The values for MBCP (84.63%), MCP (101.47%), and PCL (99.85%) growth rates were higher in mixed plantations compared to pure plantations, suggesting that although intraspecific competition limits the growth of C. lanceolata, species mixing enhances its growth potential. Studies have shown that interspecific competition in mixed plantation forests is slowed by species interactions [43]. However, this study observed the opposite in MBCPs and PCLs, where the competition index of MBCPs (2.37) was higher than that of PCLs (2.09). This discrepancy may be attributed to the niche overlap [44] between P. hwangshanensis and C. lanceolata in the MBCP plot, which reduced their complementarity. The broadleaf species in MBCPs represent middle and late succession species with similar ecological niches and relatively low complementary effects [45], resulting in competition outweighing the complementary benefits [46].
Our research found that mixed plantations promote forest growth by optimizing the spatial allocation of tree species. The ecological niche differences, guided by the spatial structure and positioning of forest trees, enable more efficient utilization of forest ecological resources [47]. Spatial structure directly influences the competitive advantage and spatial niche of each tree species [48]. Spatial structure analysis revealed that MBCPs and MCPs are in extremely strong and weak mixed states, respectively, with mingling degrees of 0.7753 and 0.5236. This suggests that MBCPs and MCPs exhibit greater adjacency between tree species (such as P. hwangshanensis, C. lanceolata, Q. glandulifera, and S. superba) compared to PCLs. In contrast, PCLs are in a weak mixed state (mingling degree: 0.2260), where tree species (C. lanceolata, Castanopsis eyrei (Champ. ex Benth.) Tutcher, S. superba, etc.) are typically not adjacent to one another. Furthermore, the uniform angle values show that MBCP trees are uniformly distributed (0.4690), MCP trees are clustered (0.5400), and PCL trees are randomly distributed (0.4917). The neighborhood comparison indices for MBCPs and MCPs are 0.4862 and 0.4784, respectively, indicating a moderate growth state, whereas PCLs have a neighborhood comparison index of 0.4642, reflecting growth pressure. Overall, the spatial structures of MBCPs and MCPs are of high quality, which positively influences forest growth [49].
The studies indicate that the spatial structures of MBCPs and MCPs are superior to those of PCLs, offering greater potential for forest management. Optimized artificial mixed plantations demonstrate higher productivity [50]. Overall, due to the high diversity of tree species, the productivity of mixed plantations typically surpasses that of pure plantations. Our findings showed that the biomass of MBCPs and MCPs exceeded that of PCLs, with the overall forest growth of MCPs outperforming MBCPs. Previous studies have highlighted that the degree of mixing directly affects the spatial structure of forests [48]. Consistent with these findings, the mixing degrees of MBCPs and MCPs are superior to that of PCLs [51]. In conclusion, mixed plantations offer better stand structure and greater management potential compared to pure plantations.

4.2. Understory Vegetation Diversity Analysis

Generally, mixed forests will increase biodiversity [19]. Other research has also highlighted a positive correlation between the species richness of herbaceous and shrub layers and tree species diversity [52]. Shrub communities in mixed plantations exhibited significantly higher Pielou index values in PCLs than in MCPs and MBCPs, which may be attributed to the aggregated spatial distribution patterns of shrub individuals [53]. In forest ecosystems, each component is influencing and being influenced by the others. Mixed plantations modify the understory environment and soil properties through changes in light and water availability. The complementarity of tree crowns results in heterogeneous light distribution, which, in turn, promotes understory vegetation diversity [54].

4.3. Analysis of Soil Physico-Chemical Properties Analysis

The thick understory litter and high forest diversity in artificial mixed plantations effectively intercept rainfall and reduce surface runoff, improving soil physical properties and enhancing the water retention capacity of these plantations [55]. This contributes to a significant increase in SWC. The root systems of mixed-plantation shrubs and herbs are distributed in all parts of the soil, and their growth can increase the TP content of the soil. An increase in TP typically correlates with a decrease in SBD. However, in our study, we observed a direct proportional relationship between total porosity and bulk density. This anomaly may be attributed to excessive human activities in the study area, which could have hindered the decomposition of mineral particles and organic matter in the soil [56]. A higher level of soil moisture can facilitate nutrient exchange in the soil, affecting phosphorus availability [57]. Phosphorus is an essential nutrient for plant growth, particularly in southern China, and a key indicator of soil fertility. The typical red and yellow soils in this region are often phosphorus-deficient, but the phosphorus content in mixed plantations helps alleviate this limitation. Mixed plantations are more effective than pure plantations in increasing effective phosphorus content in soil [58].

4.4. Integrated Ecological Benefits of Mixed Plantation

Overall, mixed plantations were superior to pure plantations in terms of stand structure, understory vegetation, and physico-chemical properties of soil compared to pure forest stands [59]. In the context of subtropical climate change in China, particularly during extreme cold weather events [60], artificial plantations play a critical role in mitigating the impacts of extreme weather [54,61]. Adjustment of the spatial structure of mixed plantations can help maintain forest biodiversity and ensure the stability of forest ecosystems in the face of such extreme weather conditions [51]. Shrubs in the forest understory reduce evaporation and increase humidity by lowering wind speed, which is crucial for maintaining ecosystem stability during harsh weather conditions [62]. Furthermore, when faced with challenges such as soil erosion and flash floods, mixed plantations enhance their water and soil retention capacity by regulating soil structure and mitigating temperature fluctuations [63].

5. Conclusions

Mixed plantations have a better spatial structure and greater management potential than purely artificial plantations. Among these, the mixed coniferous stands showed improved growth in this specific case. Additionally, the diversity of understory vegetation in mixed plantations is richer than in pure artificial plantations. The different species composition of the artificial plantations has led to an increase in the water retention capacity of the soil, as well as an increase in the fertility of the soil. With the onset of global warming and the increasing prevalence of extreme weather events, the establishment of artificial mixed plantations is an essential strategy to address climate change and enhance the ecological benefits of plantations.

Supplementary Materials

The following supporting information can be downloaded at https://www.mdpi.com/article/10.3390/f16050738/s1; Table S1: The tree species composition in the different forest types; Table S2: Species and importance values of shrubs and herbs.

Author Contributions

Conceptualization, P.Q. and S.J.; data curation, P.Q.; funding acquisition, S.J.; investigation, P.Q., Y.H., X.L. and S.J.; methodology, P.Q. and Y.H.; project administration, X.L. and S.J.; software, P.Q.; supervision, Y.H.; writing—original draft, P.Q.; writing—review and editing, S.J. All authors have read and agreed to the published version of the manuscript.

Funding

This research was funded by the National Key Research and Development Project (2019YFE0118900) and National Natural Science Foundation of China (31971641).

Data Availability Statement

The datasets generated during and/or analyzed during the current study are available from the corresponding author upon reasonable request.

Conflicts of Interest

The authors declare no conflicts of interest.

References

  1. West, P.W. Growing Plantation Forests; Springer International Publishing: Cham, Switzerland, 2014; p. 276. [Google Scholar]
  2. Yin, Y.; Ma, D.; Wu, S. Climate change risk to forests in China associated with warming. Sci. Rep. 2018, 8, 493. [Google Scholar] [CrossRef] [PubMed]
  3. Cai, W.; He, N.; Li, M.; Xu, L.; Wang, L.; Zhu, J.; Sun, O.J. Carbon Sequestration of Chinese Forests from 2010 to 2060: Spatiotemporal Dynamics and Its Regulatory Strategies. Sci. Bull. 2022, 8, 836–843. [Google Scholar] [CrossRef] [PubMed]
  4. Farooq, T.H.; Shakoor, A.; Wu, X.; Li, Y.; Rashid, M.H.U.; Zhang, X.; Gilani, M.M.; Kumar, U.; Chen, X.; Yan, W. Perspectives of Plantation Forests in the Sustainable Forest Development of China. iForest-Biogeosci. For. 2021, 14, 166–174. [Google Scholar] [CrossRef]
  5. Miao, L.; Zhu, F.; He, B.; Ferrat, M.; Liu, Q.; Cao, X.; Cui, X. Synthesis of China’s land use in the past 300 years. Glob. Planet. Change 2013, 100, 224–233. [Google Scholar] [CrossRef]
  6. Tilman, D.; Isbell, F.; Cowles, J.M. Biodiversity and ecosystem functioning. Annu. Rev. Ecol. Evol. Syst. 2014, 45, 471–493. [Google Scholar] [CrossRef]
  7. van der Plas, F.; Manning, P.; Allan, E.; Scherer-Lorenzen, M.; Verheyen, K.; Wirth, C.; Zavala, M.A.; Hector, A.; Ampoorter, E.; Baeten, L.; et al. Jack-of-all-trades effects drive biodiversity-ecosystem multifunctionality relationships in European forests. Nat. Commun. 2016, 7, 11109. [Google Scholar] [CrossRef]
  8. Tilman, D.; Wedin, D.; Knops, J. Productivity and sustainability influenced by biodiversity in grassland ecosystems. Nature 1994, 379, 718–720. [Google Scholar] [CrossRef]
  9. Grossman, J.J.; Vanhellemont, M.; Barsoum, N.; Bauhus, J.; Bruelheide, H.; Castagneyrol, B.; Cavender-Bares, J.; Eisenhauer, N.; Ferlian, O.; Gravel, D.; et al. Synthesis and Future Research Directions Linking Tree Diversity to Growth, Survival, and Damage in a Global Network of Tree Diversity Experiments. Environ. Exp. Bot. 2018, 152, 68–89. [Google Scholar] [CrossRef]
  10. Raf, A.; Olivier, H. Forest restoration, biodiversity and ecosystem functioning. Ann. Occup. Environ. Med. 2011, 11, 29. [Google Scholar] [CrossRef]
  11. Li, Q.; Liu, Z.; Jin, G. Mixed forests provide higher levels of growth and yield than monocultures across a broad range of conditions. Forest Ecol. Manag. 2024, 566, 122083. [Google Scholar] [CrossRef]
  12. Liu, C.L.C.; Kuchma, O.; Krutovsky, K.V. Mixed-species versus monocultures in plantation forestry: Development, benefits, ecosystem services and perspectives for the future. Glob. Ecol. Conserv. 2018, 15, e00419. [Google Scholar] [CrossRef]
  13. Ou, Z.; Pang, S.; He, Q.; Peng, Y.; Huang, X.; Shen, W. Effects of vegetation restoration and environmental factors on understory vascular plants in a typical karst ecosystem in southern China. Sci. Rep. 2020, 10, 12011. [Google Scholar] [CrossRef] [PubMed]
  14. Zhang, M.; Guan, F.; Fan, S.; Zhang, X. Response of soil microbial community structure and diversity to mixed proportions and mixed tree species in bamboo–broad-leaved mixed forests. Forests 2024, 15, 921. [Google Scholar] [CrossRef]
  15. Gamfeldt, L.; Snäll, T.; Bagchi, R.; Jonsson, M.; Gustafsson, L.; Kjellander, P.; Ruiz-Jaen, M.C.; Froberg, M.; Stendahl, J.; Philipson, C.D.; et al. Higher Levels of Multiple Ecosystem Services Are Found in Forests with More Tree Species. Nat. Commun. 2011, 4, 1340. [Google Scholar] [CrossRef]
  16. Zhao, Z.; Hui, G.; Liu, W.; Hu, Y.; Zhang, G. A novel method for calculating stand structural diversity based on the relationship of adjacent trees. Forests 2022, 13, 343. [Google Scholar] [CrossRef]
  17. Chen, X.; Taylor, A.R.; Reich, P.B.; Hisano, M.; Chen, H.Y.H.; Chang, S.X. Publisher Correction: Tree Diversity Increases Decadal Forest Soil Carbon and Nitrogen Accrual. Nature 2023, 620, E16. [Google Scholar] [CrossRef]
  18. Lefcheck, J.S.; Byrnes, J.E.K.; Isbell, F.; Gamfeldt, L.; Griffin, J.N.; Eisenhauer, N.; Hensel, M.J.S.; Hector, A.; Cardinale, B.J.; Duffy, J.E. Biodiversity enhances ecosystem multifunctionality across trophic levels and habitats. Nat. Commun. 2015, 6, 6936. [Google Scholar] [CrossRef]
  19. Huuskonen, S.; Domisch, T.; Finér, L.; Berninger, F.; Forsius, M.; Lindroos, A.-J.; Nieminen, T.; Piirainen, S.; Poikolainen, J.; Ukonmaanaho, L. What is the potential for replacing monocultures with mixed-species stands to enhance ecosystem services in boreal forests in Fennoscandia? For. Ecol. Manag. 2021, 479, 118548. [Google Scholar] [CrossRef]
  20. Bauhus, J.; Forrester, D.I.; Gardiner, B.; Jactel, H.; Vallejo, R.; Pretzsch, H. (Eds.) Mixed-Species Forests: Ecology and Management; Springer: Cham, Switzerland, 2017. [Google Scholar] [CrossRef]
  21. Wang, Y.; Li, J.; Cao, X.; Liu, Z.; Lv, Y. The Multivariate Distribution of Stand Spatial Structure and Tree Size Indices Using Neighborhood-Based Variables in Coniferous and Broad Mixed Forest. Forests 2023, 14, 2228. [Google Scholar] [CrossRef]
  22. Zhejiang Provincial Forestry Bureau. Technical Specifications for Long-Term Biodiversity Monitoring Plot Construction and Survey in Zhejiang Natural Protected Areas (Version 1.0); Zhejiang Standard Press: Hangzhou, China, 2022. [Google Scholar]
  23. Paquette, A.; Messier, C. The Effect of Biodiversity on Tree Productivity: From Temperate to Boreal Forests. Glob. Ecol. Biogeogr. 2011, 20, 170–180. [Google Scholar] [CrossRef]
  24. Smolander, A.; Kitunen, V. Comparison of Tree Species Effects on Microbial C and N Transformations and Dissolved Organic Matter Properties in Boreal Forest Floors. Appl. Soil Ecol. 2011, 49, 224–233. [Google Scholar] [CrossRef]
  25. Jian, Z.; Ni, Y.; Lei, L.; Chen, X.; Wang, H.; Wang, Y.; Zhang, Y.; Wu, J. Phosphorus is the key soil indicator controlling productivity in planted Masson pine forests across subtropical China. Sci. Total Environ. 2022, 822, 153525. [Google Scholar] [CrossRef] [PubMed]
  26. Vogt, K.A.; Vogt, D.J.; Brown, S.; Tilley, J.P.; Edmonds, R.L.; Silver, W.L.; Siccama, T.G. Dynamics of forest floor and soil organic matter accumulation in boreal, temperate, and tropical forests. In Soil Management and Greenhouse Effect; Kimble, J.M., Levine, E.R., Stewart, B.A., Eds.; CRC Press: Boca Raton, FL, USA, 1995; p. 2. [Google Scholar] [CrossRef]
  27. Cook, A.M.; Daughton, C.G. Total Phosphorus Determination by Spectrophotometry. Methods Enzymol. 1981, 72, 292–295. [Google Scholar] [CrossRef] [PubMed]
  28. Avramidis, P.; Nikolaou, K.; Bekiari, V. Total Organic Carbon and Total Nitrogen in Sediments and Soils: A Comparison of the Wet Oxidation–Titration Method with the Combustion-Infrared Method. Agric. Agric. Sci. Procedia 2015, 4, 425–430. [Google Scholar] [CrossRef]
  29. Zhang, J.; Ge, Y.; Chang, J.; Jiang, B.; Jiang, H.; Peng, C.; Zhu, J.; Yuan, W.; Qi, L.; Yu, S. Carbon storage by ecological service forests in Zhejiang Province, subtropical China. For. Ecol. Manag. 2007, 245, 64–75. [Google Scholar] [CrossRef]
  30. Zhang, G.; Hui, G.; Zhang, G.; Zhao, Z.; Hu, Y. Telescope method for characterizing the spatial structure of a pine-oak mixed forest in the Xiaolong Mountains, China. Scand. J. For. Res. 2019, 34, 751–762. [Google Scholar] [CrossRef]
  31. Hui, G.; Li, L.; Zhao, Z. The comparison of methods in analysis of the tree spatial distribution pattern. Acta Ecol. Sin. 2007, 27, 4717–4728. [Google Scholar] [CrossRef]
  32. Hui, G.; Gadow, K.; Albert, M. The neighbourhood pattern: A new structure parameter for describing distribution of forest tree position. Sci. Silv. Sin. 1999, 35, 37–42. [Google Scholar]
  33. Hui, G.; Gadow, K.; Albert, M. A new parameter for stand spatial structure neighbourhood comparison. For. Res. 1999, 12, 1–6. [Google Scholar]
  34. Gadow, K.; Hui, G. Characterizing Forest Spatial Structure and Diversity. In Proceedings of the International Workshop Organized at the University of Lund, Lund, Sweden, 7–9 April 1999; pp. 20–30. [Google Scholar]
  35. Curtis, J.T. Plant Ecology Workbook. Soil Sci. 1950, 69, 418. [Google Scholar] [CrossRef]
  36. Shannon, C.E. A mathematical theory of communication. Bell Syst. Technol. J. 1948, 27, 379–423. [Google Scholar] [CrossRef]
  37. Magurran, A.E. (Ed.) Ecological Diversity and Its Measurement; Springer: Dordrecht, The Netherlands, 1988. [Google Scholar]
  38. Pielou, E.C. Species-diversity and pattern-diversity in the study of ecological succession. J. Theor. Biol. 1966, 10, 370–383. [Google Scholar] [CrossRef] [PubMed]
  39. Greenberg, J.H. The Measurement of Linguistic Diversity. Language 1956, 32, 109–115. [Google Scholar] [CrossRef]
  40. Turnbull, L.A.; Isbell, F.; Purves, D.W.; Loreau, M.; Hector, A. Understanding the value of plant diversity for ecosystem functioning through niche theory. Proc. Biol. Sci. 2016, 283, 20160536. [Google Scholar] [CrossRef]
  41. Houpert, L.; Rohner, B.; Forrester, D.I.; Mina, M.; Huber, M.O. Mixing Effects in Norway Spruce—European Beech Stands Are Modulated by Site Quality, Stand Age and Moisture Availability. Forests 2018, 9, 83. [Google Scholar] [CrossRef]
  42. Fien, E.K.P.; Fraver, S.; Teets, A.; Weiskittel, A.R.; Hollinger, D.Y. Drivers of Individual Tree Growth and Mortality in an Uneven-Aged, Mixed-Species Conifer Forest. For. Ecol. Manag. 2019, 449, 539. [Google Scholar] [CrossRef]
  43. Condés, S.; Pretzsch, H.; Río, M. Species Admixture Can Increase Potential Tree Growth and Reduce Competition. For. Ecol. Manag. 2023, 539, 120997. [Google Scholar] [CrossRef]
  44. Quiroga, P.; Souto, C. Ecological niche modeling, niche overlap, and good old Rabinowitz’s rarities applied to the conservation of gymnosperms in a global biodiversity hotspot. Landsc. Ecol. 2021, 37, 2571–2588. [Google Scholar] [CrossRef]
  45. Sterba, H.; Drinberger, G.; Riter, T. The contribution of forest structure to complementarity in mixed stands of Norway spruce (Picea abies L. Karst) and European larch (Larix decidua Mill.). Forests 2018, 9, 410. [Google Scholar] [CrossRef]
  46. Forrester, D.I. The Spatial and Temporal Dynamics of Species Interactions in Mixed-Species Forests: From Pattern to Process. For. Ecol. Manag. 2014, 312, 282–292. [Google Scholar] [CrossRef]
  47. Sardans, J.; Vallicrosa, H.; Zuccarini, P.; Farre-Armengol, G.; Fernandez-Martinez, M.; Peguero, G.; Gargallo-Garriga, A.; Ciais, P.; Janssens, I.A.; Obersteiner, M.; et al. Empirical support for the biogeochemical niche hypothesis in forest trees. Nat. Ecol. Evol. 2021, 5, 184–194. [Google Scholar] [CrossRef] [PubMed]
  48. Fang, X.; Tan, W.; Gao, X.; Chai, Z. Close-to-Nature Management Positively Improves the Spatial Structure of Masson Pine Forest Stands. Web Ecol. 2021, 21, 45–54. [Google Scholar] [CrossRef]
  49. Zhang, J.; Zhao, J.; Cheng, R.; Ge, Z.; Zhang, Z. Effects of neighborhood competition and stand structure on the productivity of pure and mixed Larix principis-rupprechtii forests. Forests 2022, 13, 1318. [Google Scholar] [CrossRef]
  50. Tong, X.; Brandt, M.; Yue, Y.; Ciais, P.; Jepsen, M.R.; Penuelas, J.; Wigneron, J.P.; Xiao, X.-P.; Song, X.-P.; Horion, S.; et al. Forest management in southern China generates short-term extensive carbon sequestration. Nat. Commun. 2020, 11, 129. [Google Scholar] [CrossRef]
  51. Yang, S.; Mao, K.; Yang, H.; Wang, Y.; Feng, Q.; Wang, S.; Miao, N. Stand characteristics and ecological benefits of Chinese fir, Chinese cedar, and mixed plantations in the mountainous areas of the Sichuan Basin. For. Ecol. Manag. 2023, 544, 121168. [Google Scholar] [CrossRef]
  52. Su, X.; Zheng, G.; Chen, H.Y.H. Understory diversity is driven by resource availability rather than resource heterogeneity in subtropical forests. For. Ecol. Manag. 2022, 503, 119781. [Google Scholar] [CrossRef]
  53. Zhou, Z.; Tran, P.Q.; Cowley, E.S.; Kleiner, M.; Anantharaman, K. Diversity and Ecology of Microbial Sulfur Metabolism. Nat. Rev. Microbiol. 2025, 23, 122–140. [Google Scholar] [CrossRef]
  54. Williams, L.J.; Paquette, A.; Cavender-Bares, J.; Messier, C.; Reich, P.B. Spatial complementarity in tree crowns explains overyielding in species mixtures. Nat. Ecol. Evol. 2017, 1, 63. [Google Scholar] [CrossRef]
  55. Chen, S.; Huang, Y.; Yan, M.; Han, Y.; Wang, K.; Chen, Z.; Ruan, D.; Yu, Y.; Tu, Z. Differential Water Conservation Capacity in Broadleaved and Mixed Forest Restoration in Latosol Soil-Eroded Region, Hainan Province, China. Plants 2024, 13, 694. [Google Scholar] [CrossRef]
  56. Raguet, P.; Cade-Menun, B.; Mollier, A.; Abdi, D.; Ziadi, N.; Karam, A.; Morel, C. Mineralization and speciation of organic phosphorus in a sandy soil continuously cropped and phosphorus-fertilized for 28 years. Soil Biol. Biochem. 2023, 178, 108938. [Google Scholar] [CrossRef]
  57. Li, S.X.; Wang, Z.H.; Malhi, S.S.; Li, S.Q.; Gao, Y.J.; Tian, X.H. Nutrient and water management effects on crop production, and nutrient and water use efficiency in dryland areas of China. In Advances in Agronomy; Elsevier: Amsterdam, The Netherlands, 2009; Volume 102, pp. 223–265. [Google Scholar] [CrossRef]
  58. Li, Y.; Jiang, L.; Yuan, H.; Li, E.; Yang, X. The impact of artificial afforestation on the soil microbial community and function in desertified areas of NW China. Forests 2024, 15, 1140. [Google Scholar] [CrossRef]
  59. Piotto, D.; Víquez, E.; Montagnini, F.; Kanninen, M. Pure and mixed forest plantations with native species of the dry tropics of Costa Rica: A comparison of growth and productivity. For. Ecol. Manag. 2004, 190, 359–372. [Google Scholar] [CrossRef]
  60. Feng, L.; Li, Z.; Zhao, Z. Extreme Climate Shocks and Green Agricultural Development: Evidence from the 2008 Snow Disaster in China. Int. J. Environ. Res. Public Health 2021, 18, 12055. [Google Scholar] [CrossRef] [PubMed]
  61. Cantarello, E.; Jacobsen, J.B.; Lloret, F.; Lindner, M. Shaping and Enhancing Resilient Forests for a Resilient Society. Ambio 2024, 53, 1095–1108. [Google Scholar] [CrossRef]
  62. Bigelow, S.W.; North, M.P. Microclimate Effects of Fuels-Reduction and Group-Selection Silviculture: Implications for Fire Behavior in Sierran Mixed-Conifer Forests. For. Ecol. Manag. 2012, 264, 51–59. [Google Scholar] [CrossRef]
  63. Gong, C.; Tan, Q.; Liu, G.; Xu, M. Impacts of Mixed Forests on Controlling Soil Erosion in China. Catena 2022, 213, 106147. [Google Scholar] [CrossRef]
Figure 1. Location of the study area.
Forests 16 00738 g001
Figure 2. Sampling the shape of a large plot.
Forests 16 00738 g002
Figure 3. Differences in height (a), biomass (b), and breast-height diameter (c) among three forest types. Same lowercase letters represent non-significant differences (p < 0.05). DBH: diameter at breast height; MBCPs: mixed broadleaf–conifer plantations; MCPs: mixed coniferous plantations; and PCLs: pure C. lanceolata plantations.
Forests 16 00738 g003
Figure 4. Spatial structure characteristics of the three forest types: uniform angle index (a), neighborhood comparison (b), and mingling (c). An asterisk indicates a significant difference (*: p < 0.05; **: p < 0.01). MBCPs: mixed broadleaf–conifer plantations; MCPs: mixed coniferous plantations; and PCLs: pure C. lanceolata plantations.
Forests 16 00738 g004
Figure 5. Diversity of understory shrubs and herbs in three forest types, species richness index (a), Shannon–Wiener index (b), Simpson index (c), and Pielou index (d). Same lowercase and uppercase letters represent non-significant differences (p < 0.05). MBCPs: mixed broadleaf–conifer plantations; MCPs: mixed coniferous plantations; and PCLs: pure C. lanceolata plantations.
Forests 16 00738 g005
Figure 6. Soil physical properties in the three forest types. (a) Soil bulk density (SBD), (b) field water capacity (FWC), (c) total porosity (TP), and (d) soil water content (SWC). An asterisk indicates a significant difference (*: p < 0.05; **: p < 0.01). MBCPs: mixed broadleaf–conifer plantations; MCPs: mixed coniferous plantations; and PCLs: pure C. lanceolata plantations.
Forests 16 00738 g006
Table 1. Basic information about the sample plots. hm−2 refers to hectares.
Forest TypesAspectSlope (°)Density of Trees (Trees/hm−2)Canopy Density
MBCPsSouthwest2027250.74
East2115500.77
West1914500.77
Southeast2515250.75
South1622000.73
MCPsSouth918500.67
South1118250.73
South1414250.81
Southwest1320750.68
Northeast1418250.68
PCLsWest1215500.31
Northwest1820250.67
North919250.64
West2112500.68
North1310000.71
Note: hm−2 refers to hectares.
Table 2. Soil chemistry of three forest types.
Forest TypespHAN (mg/kg)NN (mg/kg)TN (g/kg)TP (g/kg)AP (mg/kg)TOC (g/kg)
MBCPs4.70 ± 0.22 b15.06 ± 7.43 b51.14 ± 31.48 a2.51 ± 0.64 b0.16 ± 0.12 b46.42 ± 13.45 b2.86 ± 1.10 b
MCPs4.68 ± 0.13 b26.38 ± 13.10 a23.25 ± 29.18 b3.12 ± 0.83 a0.18 ± 0.04 b55.23 ± 16.12 a3.63 ± 1.41 b
PCLs5.24 ± 0.26 a8.02 ± 5.04 c7.96 ± 16.32 b3.13 ± 0.57 a0.43 ± 0.14 a42.98 ± 9.07 b14.64 ± 12.34 a
Note: Data are given as the mean ± standard error. Same lowercase letters represent non-significant differences. These data were collected and analyzed in five small 20 × 20 m plots in each 100 × 100 m sample plot. MBCPs: mixed broadleaf–conifer plantations; MCPs: mixed coniferous plantations; and PCLs: pure C. lanceolata plantations. AN: ammoniacal nitrogen, NN: nitrate nitrogen, TN: total nitrogen, TP: total phosphorus, AP: available phosphorus, and TOC: total organic carbon.
Disclaimer/Publisher’s Note: The statements, opinions and data contained in all publications are solely those of the individual author(s) and contributor(s) and not of MDPI and/or the editor(s). MDPI and/or the editor(s) disclaim responsibility for any injury to people or property resulting from any ideas, methods, instructions or products referred to in the content.

