Article

Operator Exposure to Vibration and Noise During Steep Terrain Harvesting

1
Biotechnical Faculty, Department of Forestry and Renewable Forest Resources, University of Ljubljana, 1000 Ljubljana, Slovenia
2
Faculty of Forestry and Wood Technology, University of Zagreb, HR-10000 Zagreb, Croatia
*
Author to whom correspondence should be addressed.
Forests 2025, 16(5), 741; https://doi.org/10.3390/f16050741
Submission received: 26 March 2025 / Revised: 23 April 2025 / Accepted: 23 April 2025 / Published: 25 April 2025
(This article belongs to the Special Issue Addressing Forest Ergonomics Issues: Laborers and Working Conditions)

Abstract

:
Winch-assisted harvesting has expanded considerably in recent years as it enables ground-based machines to work safely on steep slopes. To analyze operator exposure to whole-body and hand–arm vibration (WBV, HAV) and noise exposure (LAeq, LCpeak) during winch-assisted harvesting (TW) and harvesting without winch assistance (NTW), a field study using a Ponsse Scorpion King harvester and an Ecoforst T-winch traction winch was conducted. Vibrations were measured at three locations inside the cabin (seat, seat base/floor, control lever), while noise exposure was recorded both inside and outside the cabin. WBV exposure during work time operations was highest in the Y-direction, both on the seat (0.49–0.87 m/s2) and on the floor (0.41–0.84 m/s2). The WBV and HAV exposure levels were highest while driving on the forest and skid road. Exposure during the main productive time was significantly influenced by the harvesting system, diameter at breast height (DBH), and tree species. Noise exposure was higher, while WBV and HAV exposures on the seat, floor and control lever were lower during non-work time than during work time. The daily vibration exposure on the seat exceeded the EU action value, while LCpeak noise exposure surpassed the limit value of 140 dB(C) on all measured days. Noise and vibration exposure were constantly higher during TW than NTW harvesting but differences were small. Compared to other studies, the results show that harvesting on steep terrain increases noise and vibration exposure, while non-work time has the opposite effect on vibration and noise exposure.

1. Introduction

Worldwide, the proportion of forests with a terrain slope of more than 15° is 18.3%, while there are more than 30% of such forests in Europe. Among the European countries with a forest area of at least 1 million hectares, the proportion of forests with a slope of more than 15° is highest in three alpine countries: Italy (63%), Austria (64%), and Switzerland (70%). Conversely, it is lowest in Belarus, the three Baltic states (0%–0.4%), Finland (2%), and Sweden (5%) [1]. Since technological, environmental, economic, and institutional aspects must be considered in the forest operations management [2], the choice and use of technological systems also depends on the slope of the terrain, which is one of the most important factors in the soil erosion and hazards classification modeling of the terrain [3]. Thus, the degree of logging mechanization is highest in the Scandinavian countries, where the use of mechanization is almost 100% [4], while in Austria about 19% of the total logging is carried out with cable yarders [5]. A similar distribution of technological systems is shown by the analysis of the potential timber supply, which in the Northern European countries can be achieved mainly with harvesters and forwarders, while in the alpine countries it also includes the use of cable yarders and winch-assisted technologies [6].
Regardless of terrain conditions, nowadays the need to increase the level of mechanization is influenced by the shortage of labor in forestry due to harsh working conditions and demographic, economic, technological, and political circumstances [7]. The level of mechanization is also driven by climate changes, as the increasingly frequent natural disasters require the use of safe and highly productive technologies due to their magnitude and the need to maintain wood quality [8].
Winch-assist systems, one of the most important innovations of recent times, have seen rapid development, adoption, and implementation in many parts of the world. Over the last two decades, winch-assist systems have extended the reach of ground-based machinery to steep forests and often to forests previously considered economically marginal for forestry. A winch-assist system usually consists of a felling machine (a harvester, a feller-buncher), a forwarder [9], a skidder, and a winch [10]. Depending on the cable activity, the system can be dynamic (an independent winch or a winch mounted on other equipment that serves as an anchor) or static (a winch that is part of the felling or forwarding machine) [11].
Winch-assist systems offer several advantages over conventional ground-based machines. Research on winch-assist systems has shown, among other things, less ground disturbance [12,13,14], decreased wheel slippage [15], and less need for extensive forest road networks [11]. However, studies on the machines commonly used in winch support systems have also highlighted potential risks, particularly in terms of occupational health and safety. Harvester operators are exposed to significant mental workload [16,17], especially on steep terrain [18], in windthrow areas [19], and in mixed forest stands [20]. Exposure to whole-body vibrations (WBV) in rugged karst terrain [21] and when operating tracked machines [22], as well as noise exposure when working in plantations [23], can exceed the European and national daily exposure limits. In addition, vibration and noise exposure tends to be higher when using feller bunchers, forwarders, and skidders than when using harvesters [24,25,26]. In addition to the increased physical exposure [27], excessive hand–arm (HAV) vibration exposure on the steering wheel when operating skidders has also been documented in some cases [28].
Previous research on winch-assist systems has shown that the relatively recent technology that enables mechanized operations in steep terrain presents both challenges and opportunities for further investigation [9]. In line with these findings, the aim of this study was to expand the current knowledge of this technology in the context of occupational safety and health. In particular, the exposure of the harvester operator to vibration and noise when using a dynamic winch-assist system was investigated. This study compared the operator exposure during different work operations, both with and without the winch support system, calculated daily exposure values, and analyzed the influence of tree characteristics on operator exposure.

2. Materials and Methods

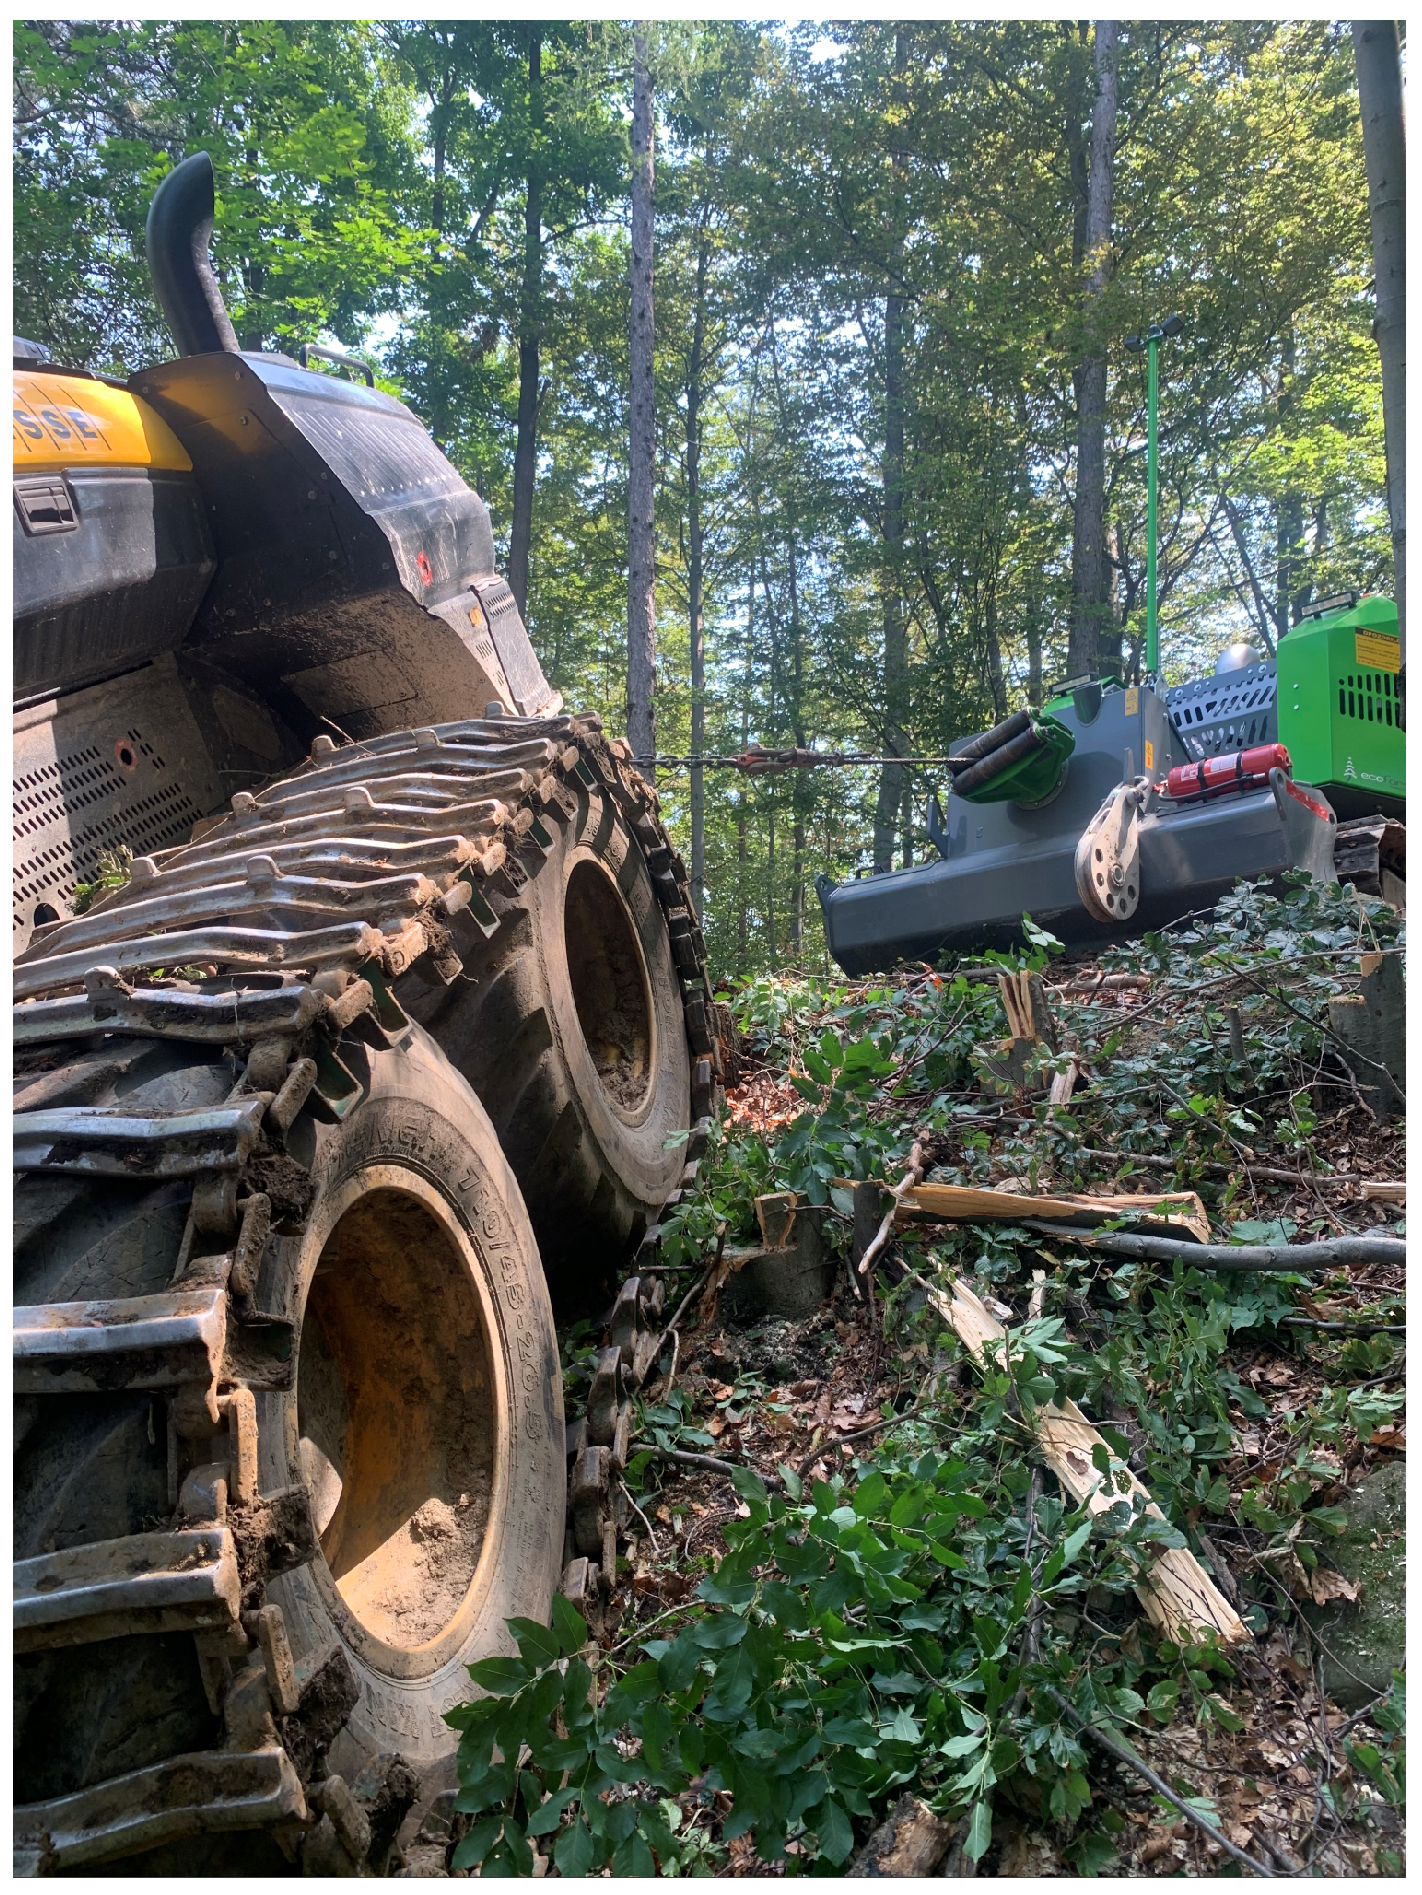
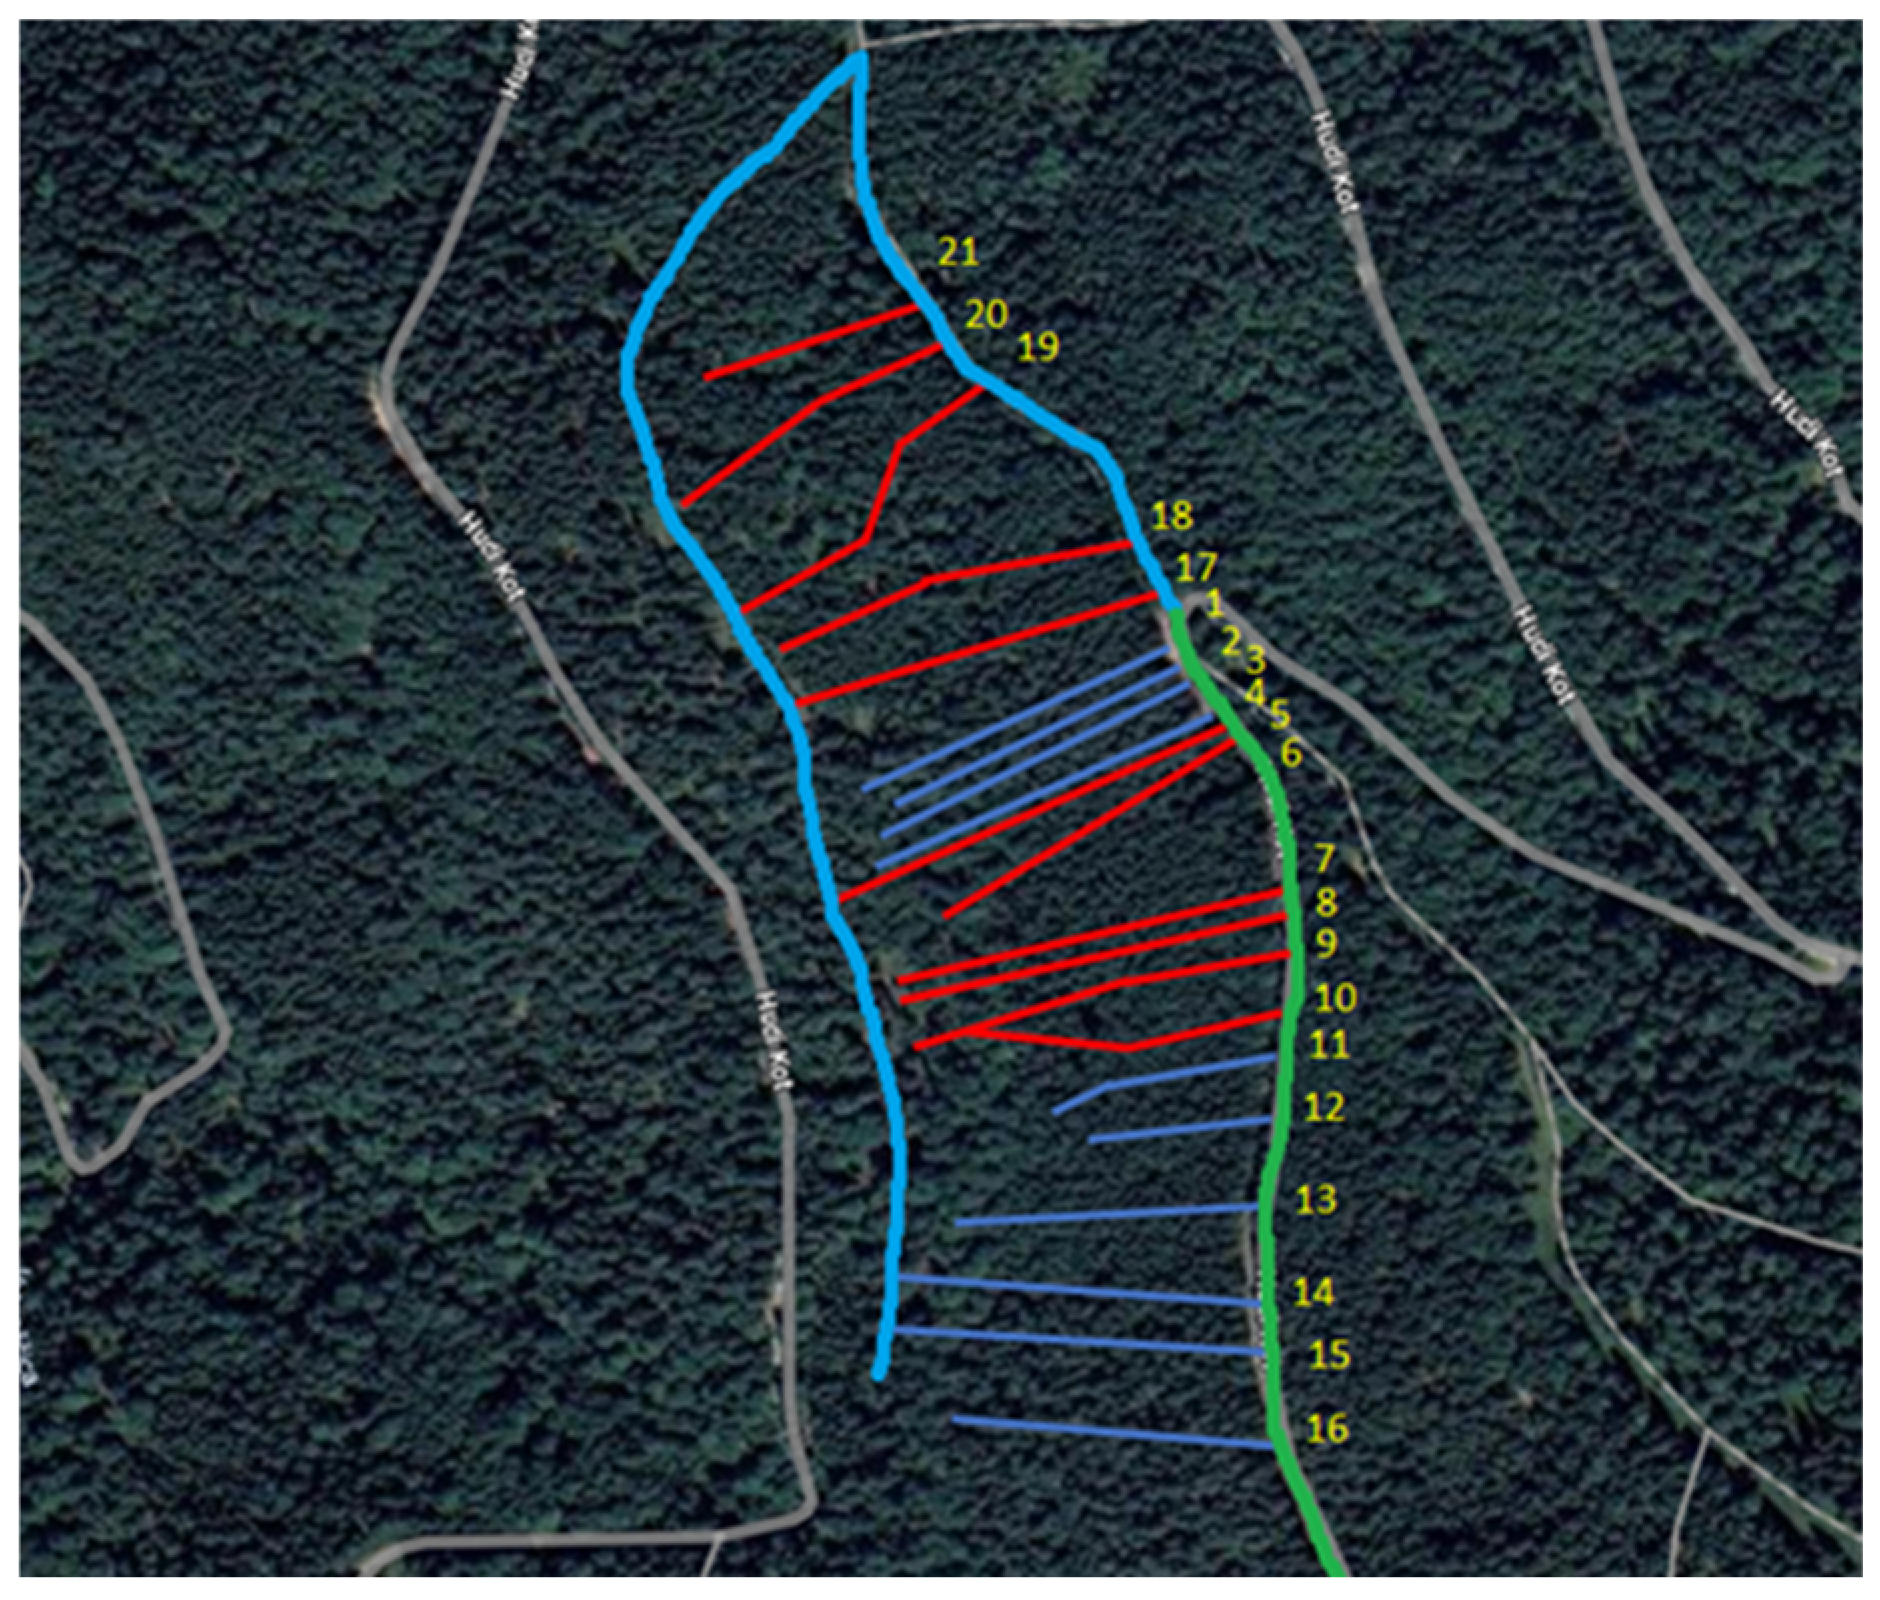
2.1. Object Description

The study site was located in the northern part of Slovenia, in the Ribniško Pohorje forest area, in sub-compartment 10283A (46°30′14.2″ N; 15°14′54.9″ E), at 1250–1340 m above sea level, on a slope with an inclination of 20°. The forests are characterized by a siliceous substrate and phytosociologically by an acidophilic montane beech forest [29].
The harvester operator who volunteered to participate in the study was 55 years old, weighed 85 kg, and had 17 years of experience in operating harvesters. He had worked for two months on two different worksites with the same harvester and traction winch as in the present study.
The harvester used in the study was manufactured by Ponsse in 2021, model Scorpion King, and had accumulated approximately 4900 operating hours (Figure 1). The harvester head, model H7, was mounted on a C50 active crane with a reach of 10 m. The harvester engine has an output power of 210 kW, and the total weight of the machine is 23.2 t, with a tractive force of 180 kN. The cabin of the machine is designed for leveling on steep terrain and is mounted together with the crane in the middle segment of the machine. That gives the operator a good view of the working area [30]. The harvester was equipped with front and rear tracks from Veriga Lesce.
The traction winch manufactured by Ecoforst, model T-winch 10.3 from 2024, was driven by a 125-kW motor that generated a constant nominal pulling force of 100 kN. The winch weighed 10.7 t and was equipped with a wire rope having a diameter of 20 mm and a length of 560 m [31].
Harvesting was carried out on an 8 ha worksite (Figure 2) in July 2024 on 5 consecutive days. The working day started at 6 am and usually ended at 2 pm. During the study the weather was dry; only on the fourth day of the measurements, it rained for 2 h in the morning, with daily maximum temperatures of 15–20 °C.
Of the 1442 trees harvested (Table 1), 70% were conifers (Picea abies L. and Abies alba M.) and the remaining 30% were deciduous trees (Fagus Sylvatica L.). With the use of the T-winch, 728 trees were harvested, with the proportion of conifers being 58%, and 714 trees were harvested without winch assistance, with the proportion of conifers being 80%. A total of 5314 logs with a timber volume of 678.3 m3 were produced. The average volume of the harvested trees ranged from 0.33 m3 to 0.73 m3, with an average of 0.47 m3.
All trees were marked with a red cross by a forest manager before harvesting. The harvest trails were parallel to each other. The slope of the 21 harvested trails ranged from 15% to 50% and the horizontal length ranged from 11 to 169 m. The winch-assisted harvesting system (TW) was used on 10 trails, with an average length of 131 m and an average slope of 45%, while the harvesting system without winch assistance (NTW) was used on 10 trails, with an average length of 108 m and an average slope of 34% (Table 1).
Skid trails and forest roads were used to move the harvester between the harvesting trails. Horizontal distances calculated using GPS tracks and manually measured slope inclinations ranged from 9 to 868 m and were shorter if the machine only moved to the neighboring harvesting trail (e.g., from trail 2 to trail 3). However, longer distances occurred when the machine returned to the start of a harvesting trail via a skid trail in the lower part of the worksite (e.g., trails 14 and 15). The harvester always started from the forest road and felled the trees downhill. When the T-winch was in use, it was anchored to the forest road to pull the harvester up the hill.
The skid trail along which the harvester moves was originally intended for timber extraction by tractors. The trail was narrow, so the operator occasionally had to drive over old tree stumps along the trail. The stoniness of the last section of the trail before the connection to the forest road with a length of 290 m was 60%, while on the remaining section the stoniness was 30%. In the section where the stoniness was lower, the trail was muddy, mixed with soil, but without wet puddles.

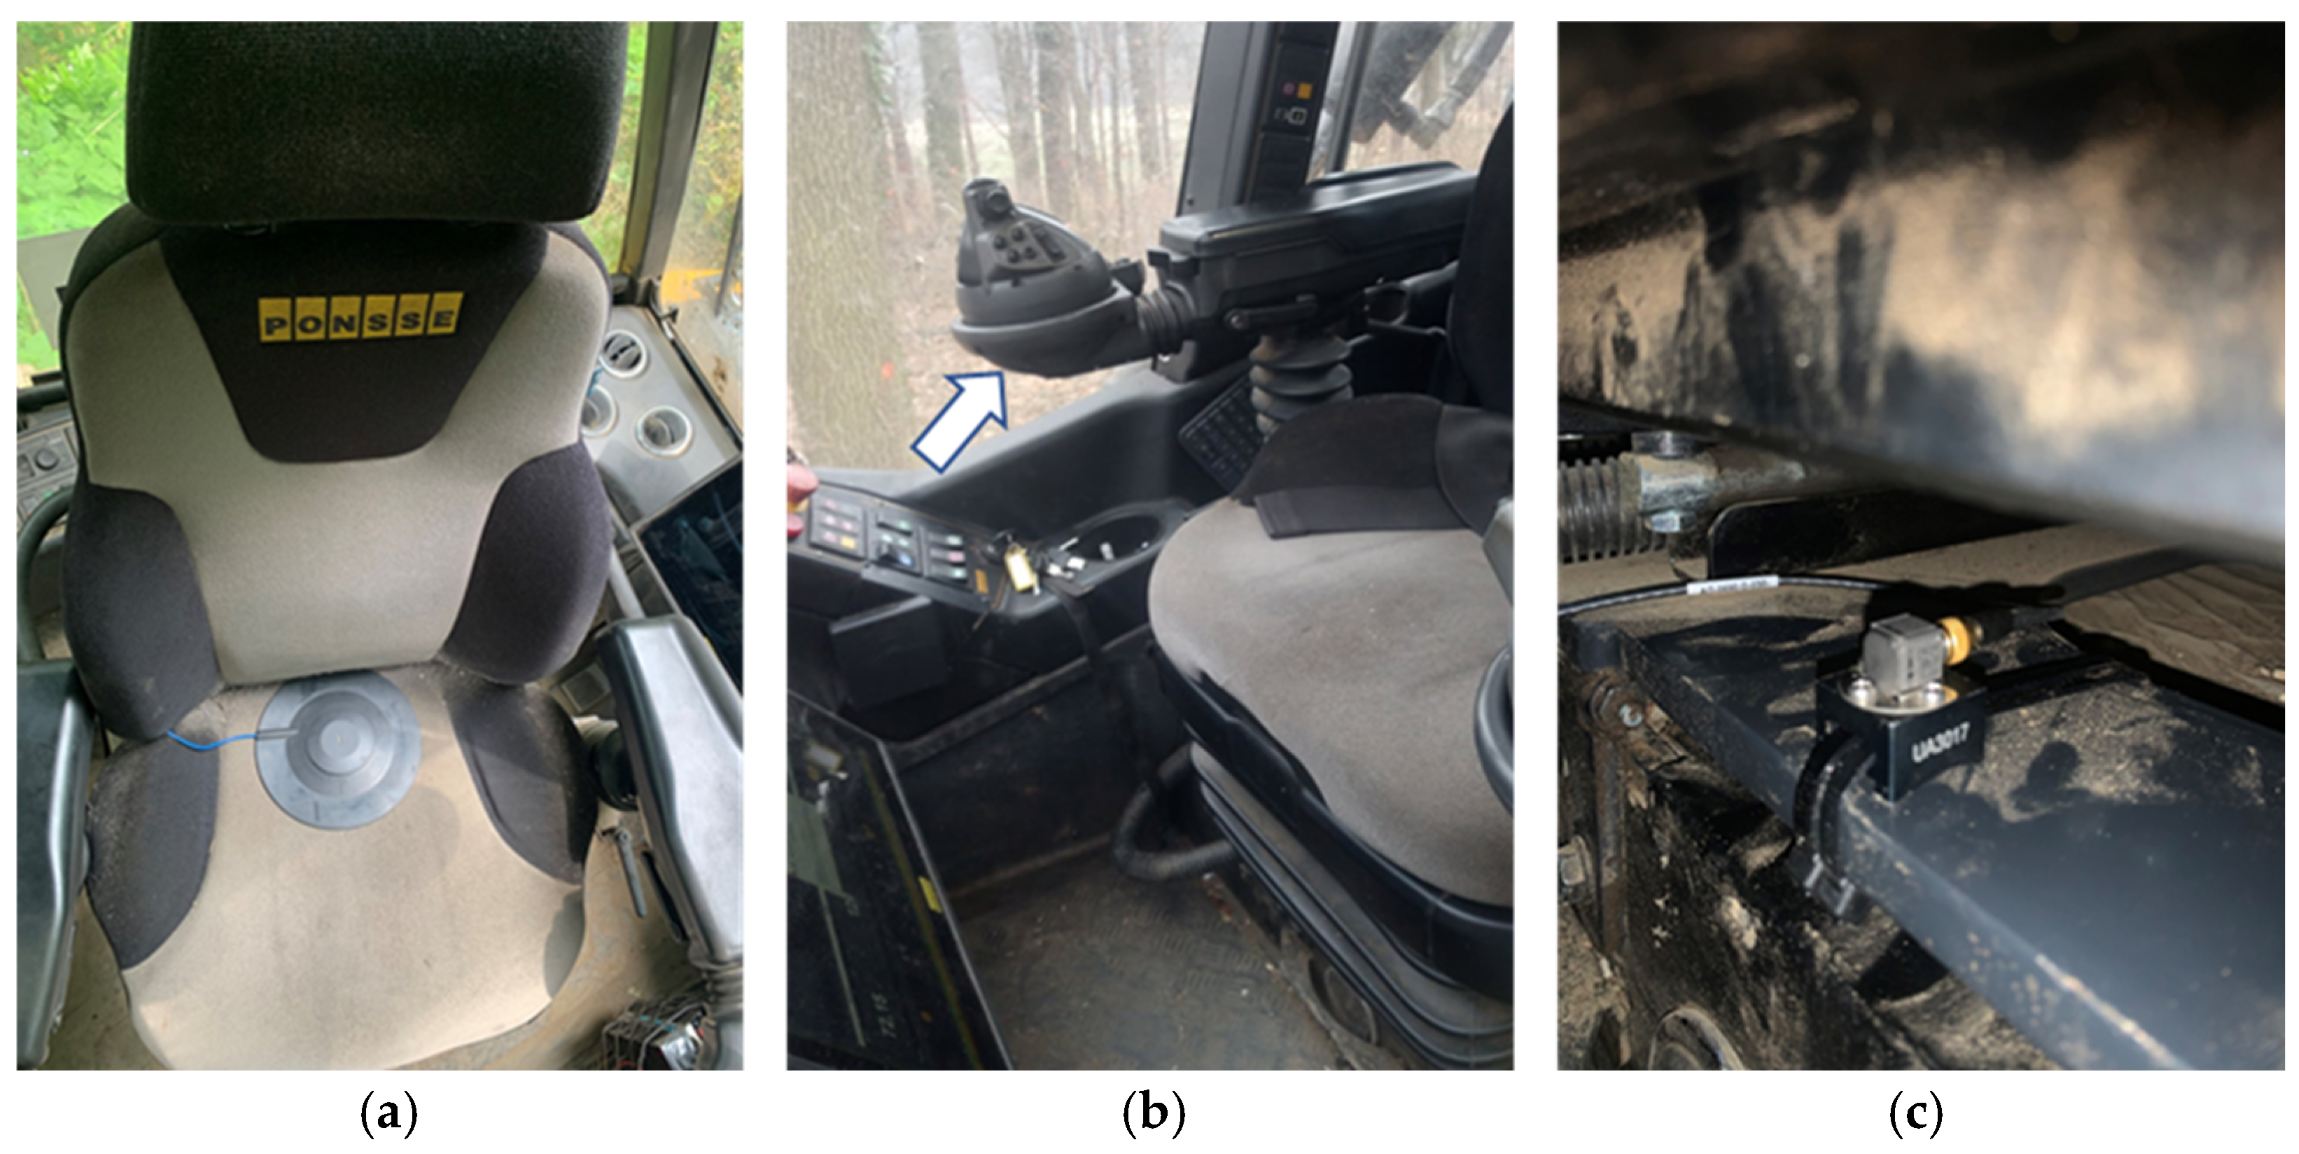
2.2. Measurement Methods and Instruments

To conduct a time study and analyze vibration and noise exposure, the entire study was recorded with a camera (JVC GY-HM170E) mounted in the harvester cabin on a windshield with a vacuum mount. Continuous time measurement with a stopwatch was used to record the work operations outside the cabin, as the time was measured to the nearest second.
The exposure levels of whole-body vibrations (WBVs) were measured with the Bruel & Kjaer Lan-XI type 3053, in a system with three accelerometers mounted at three different locations (Figure 3): the seat surface (accelerometer type 4524-B, with rubberized seat pad 4515-B); on the right control lever with the control buttons (accelerometer type 4524-B-001 with UA-3017 clip mounting adapter); and on the floor–seat base (accelerometer type 4524-B-001 with UA-3017 clip mounting adapter) [32]. Accelerometers were calibrated at the beginning of the first measurement day with a hand-held calibrator (model 4294) from Bruel & Kjaer. In accordance with the ISO 2631:1997 standard [33], the frequency-weighted WBV levels were recorded at the floor and the seat surface, i.e., in the X- (fore–aft), Y- (left–right), and Z- (up–down) directions. The frequency-weighted hand–arm vibrations (HAVs) were recorded in accordance with the ISO 5349-1:2001 standard [34]. All three accelerometers were attached to the surface with plastic ties and adhesive tape.
The noise exposure measurements were performed with two different noise meters, the Bruel & Kjaer 4445 dose meter for the assessment of the exposure outside the cabin and the Bruel & Kjaer 2250 sound meter for the assessment of the exposure inside the cabin. The measurement range of the dose meter was set to 70–140 dB(A) for an equivalent continuous sound level and to 103–143 dB(C) for the peak level [32]. Data logging for both noise meters was set to 1 s (1 Hz). In accordance with the ISO 9612:2009 standard [35], the dose meter microphone was attached to the collar of the operator’s jacket, 10 cm from the ear canal. In the cabin, the microphone (B&K, type 4189) was attached to the windshield together with the noise meter using a vacuum mount, 30 cm from the operator’s left ear. Both microphones were calibrated according to the manufacturer’s technical manual every day before the measurements.
The movement of the harvester on trails and forest roads was measured with a Garmin 60csx GPS receiver with an accuracy of 10 m. Tree and log dimensions were recorded with the harvester on-board computer according to StanForD standards for forest machine data and communication [36].
Slope distances were measured in the field with a measuring tape, while the horizontal distances were calculated based on the slope’s inclinations measured with a Suunto Clino Meter 360 PC. The slopes of the harvesting trails were recorded every 20 m, and the slope value for each trail represents the average of all measurements. The daily average slope values (total) were calculated as a weighted average of the slopes of each harvesting trail, with the weight corresponding to the sloped distance of the trail (Table 1).

2.3. Data Processing, Indicators and Statistical Analyses

Video recordings and notes were used to prepare the time study. The guidelines of the Nomenclature for Forest Work Studies [37] were taken into account when classifying workplace time (Figure 4). The workplace time was divided into work time (productive time) and non-work time (unproductive time). Productive time was additionally divided into the main work time with operations such as moving tops and branches with the harvester head, driving between the trees, felling and processing, moving and sorting different log qualities, and supportive work time. Due to the different terrain conditions (rockiness, slope gradient), operations of driving on the forest road and driving on the skid road were considered as separate operations of supportive work time. All delays, such as work-related delays (e.g., telephone calls, conversations with co-workers, work instructions), personal delays (e.g., short drink breaks or personal needs), or machine-related delays (e.g., driving the T-winch, refueling, changing the saw chain) were classified as unproductive time. Machine-related delays were further subdivided into machine delays for winch operation and maintenance (TW delays: driving the winch, switching the winch on and off, attaching the directional pulley, attaching/detaching the rope, anchoring the machine, bending the rope) and machine delays for harvester maintenance (HW delays: sharpening the blades, calibrating and refilling the chain oil of the harvesting head, refueling, replacing the chain bar and saw chain, greasing and preparing the machine, switching the machine on and off), as the use of the T-winch affected the composition of the working day and was an additional source of noise. The main break was excluded from the analyses, although it is recognized as working time under Slovenian law with a duration of 30 min [38]. In the continuous time measurement, every second of vibration and noise exposure level was assigned to a corresponding work operation.
BK Connect(™) (v27.0.0.267) software and Measurement Partner Suite (v 4.8.3.1) [32] were used to export the vibration and noise data from the measuring instruments. The data were exported in the unit of one second, and as frequency-weighted root mean square (RMS) values of vibrations in all three directions (RMS X, RMS Y, RMS Z) for all three measurement locations. In addition, the second-by-second frequency-weighted equivalent (LAeq) and peak (LCpeak) noise values for both instruments were also exported. Exposures to noise and vibration for each tree or working day were calculated using the equations (Equations (1)–(8)) (Table 2) specified in the international ISO standards [33,34,35]. According to good practice guidelines [36] and the international ISO standard [33], the highest measured axial values should be considered when assessing the daily WBV exposure [39]. In addition, a correction factor (k) must be applied in all directions: for seat measurements, k is 1.4 for both horizontal directions and 1.0 for the vertical direction, while for measurements on the floor, k is 1.0 in all directions. All exposures should then be recalculated for an 8 h working day, generally in accordance with national regulations.
The basic sampling units (Figure 5) for statistical analyses in the study consisted of values calculated per individual tree, while the sample size depended on the purpose of the analysis (e.g., operations, and productive and unproductive time). Statistical processing was performed using MS Excel® (v16.0, Microsoft, Redmond, WA, USA) and the JASP® statistical program (v 0.19.2, University of Amsterdam, The Netherlands).

3. Results

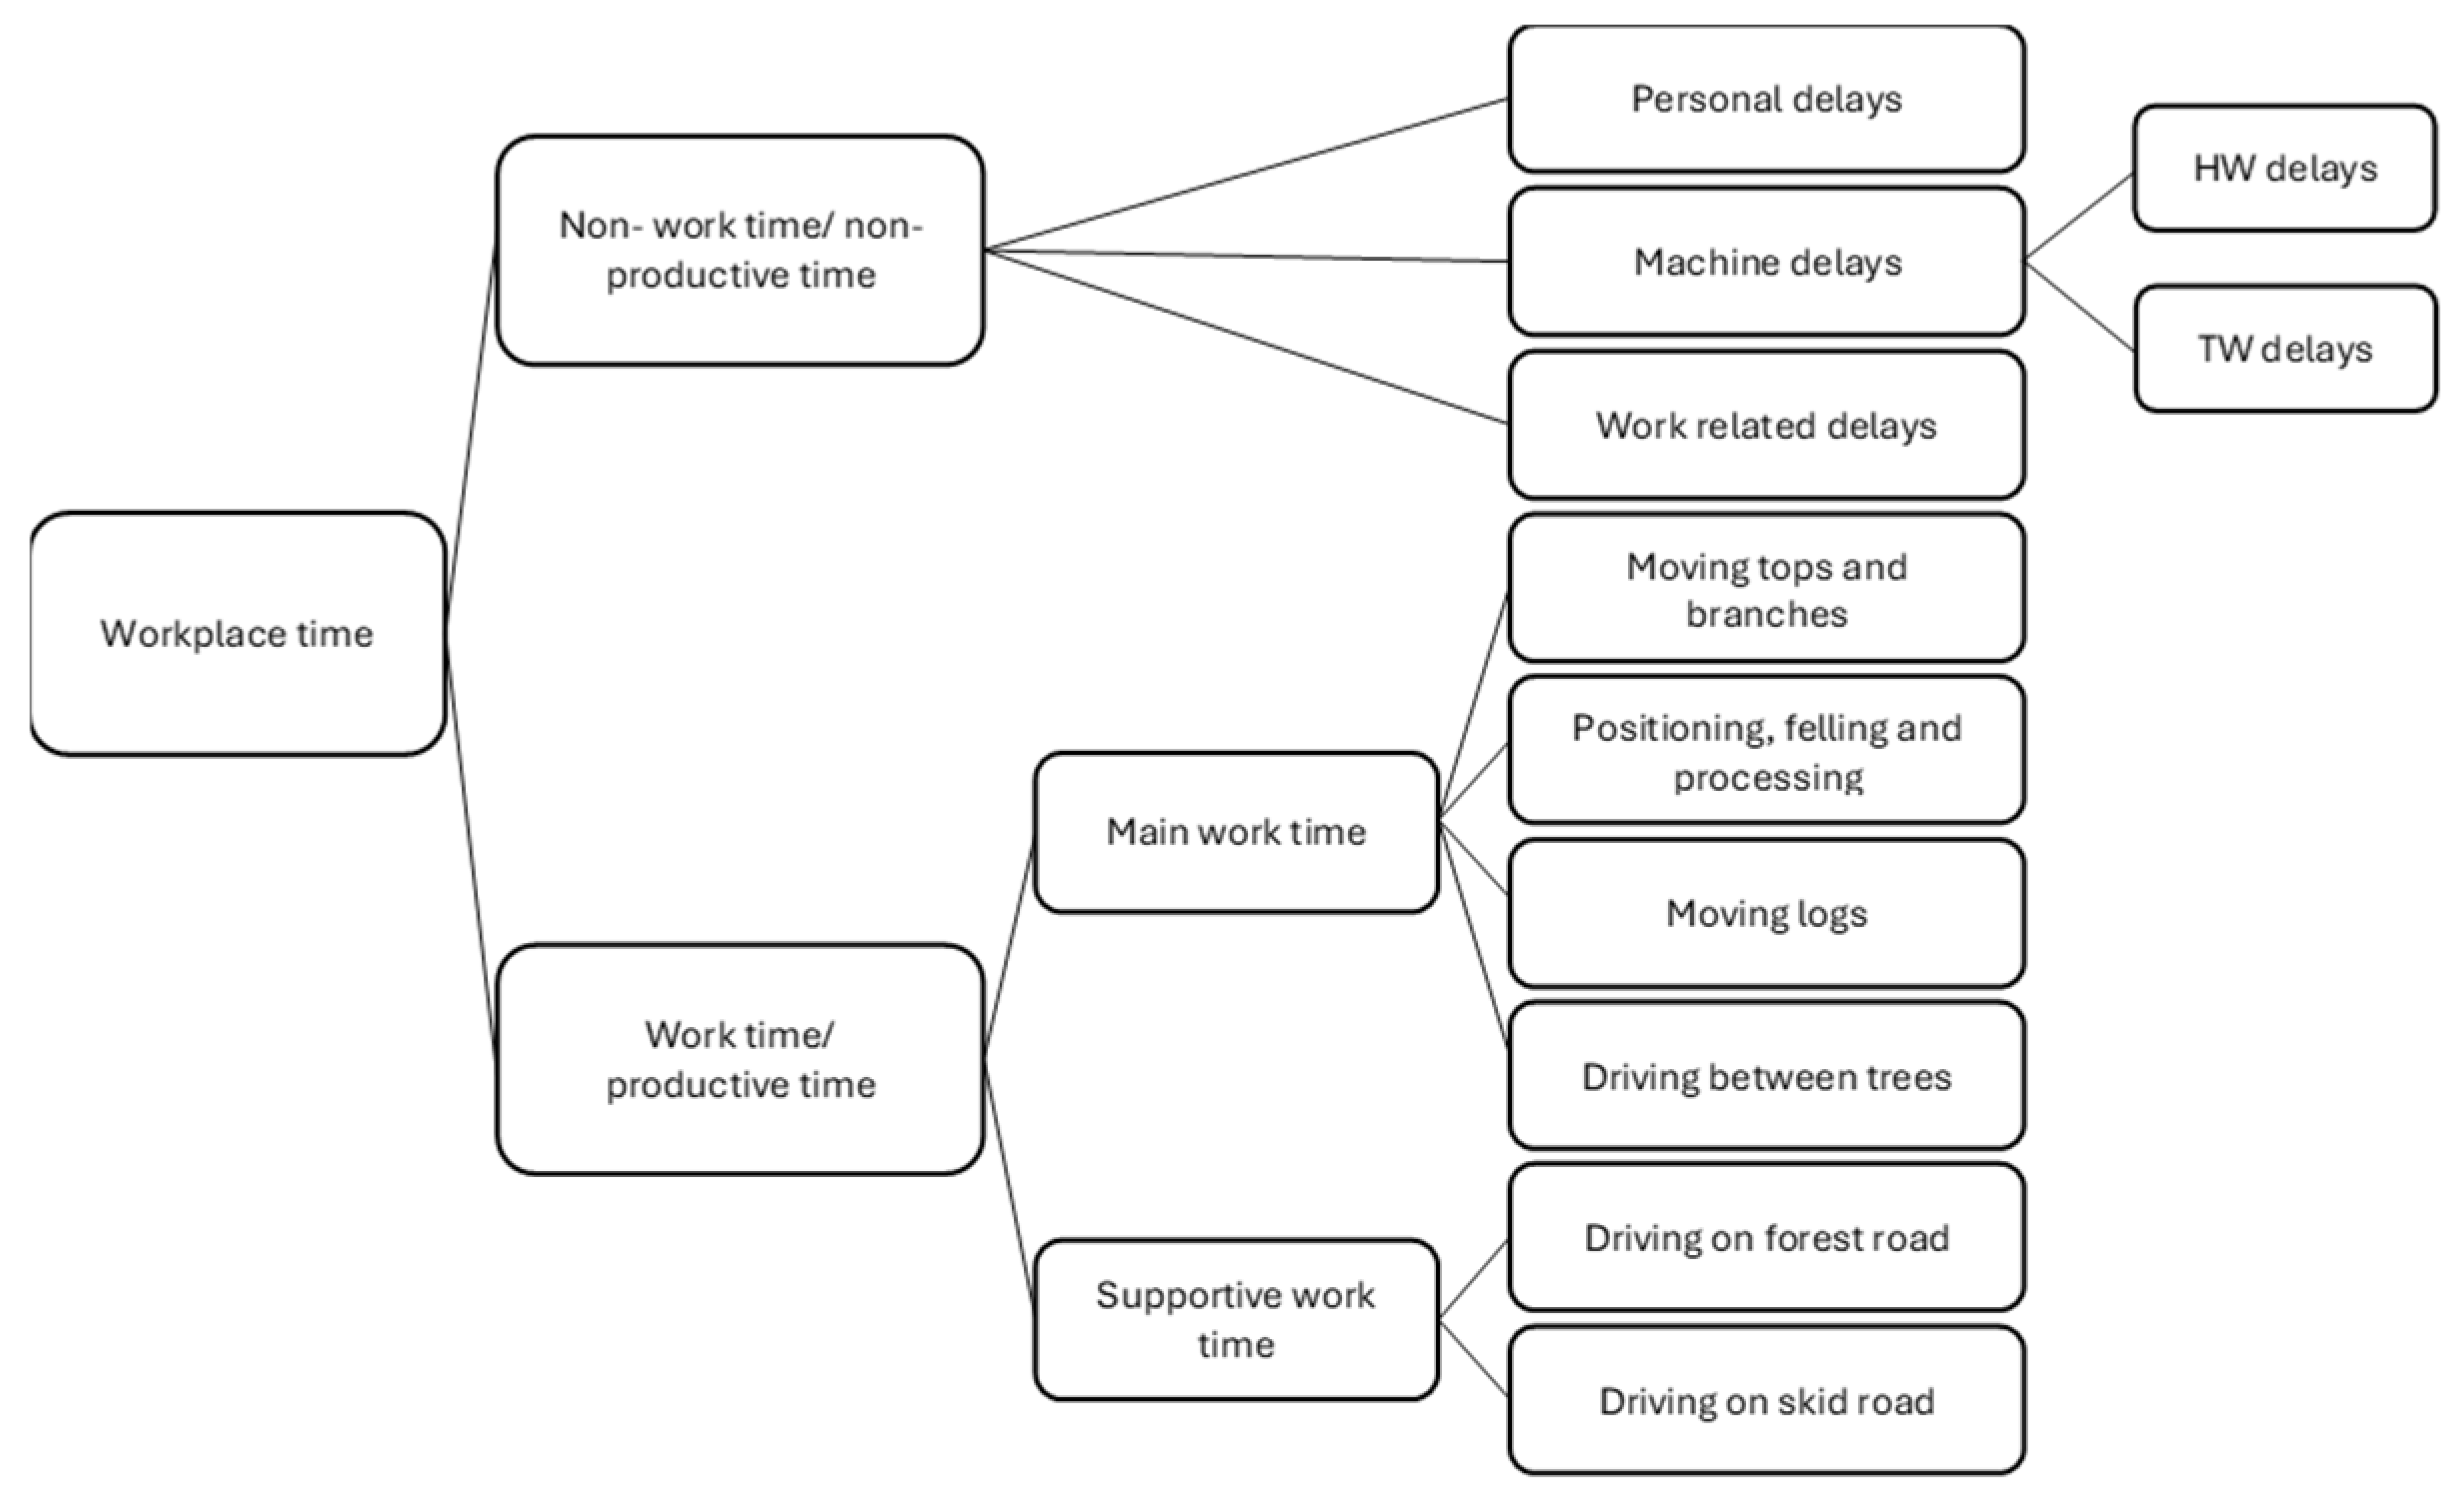
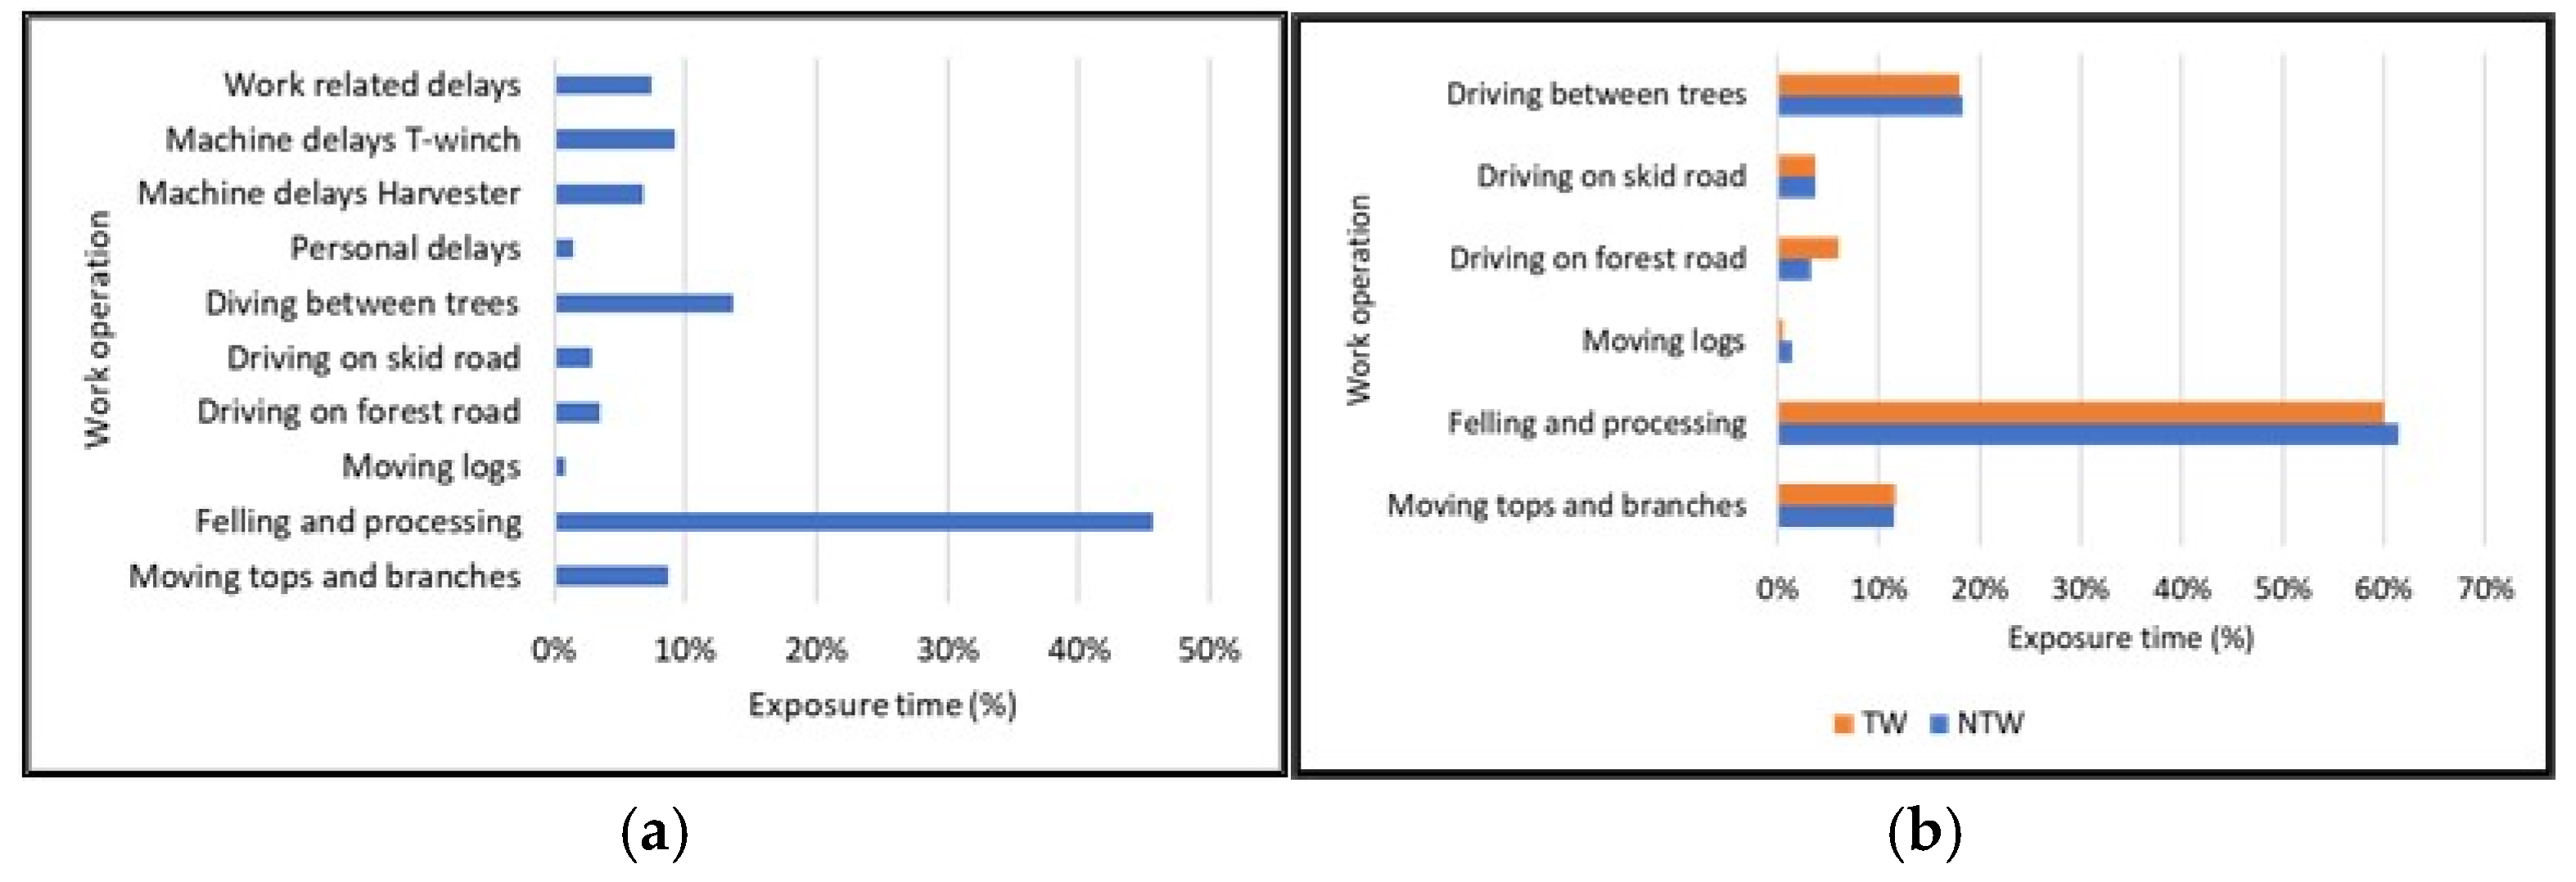
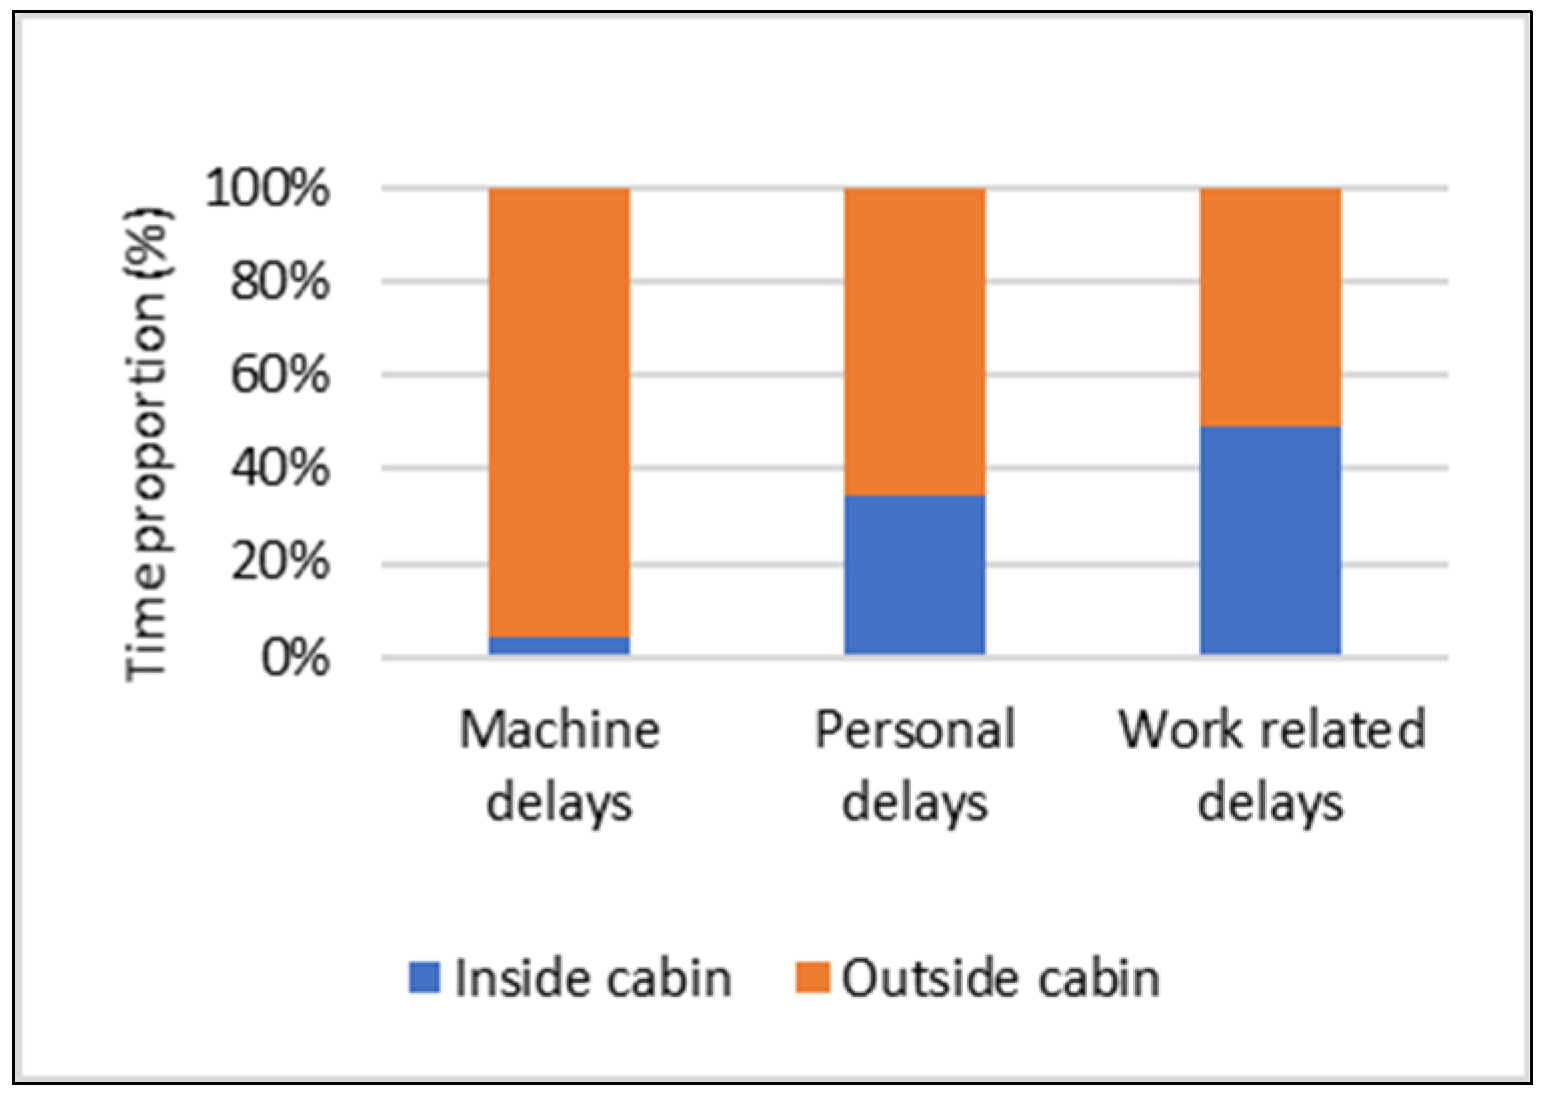
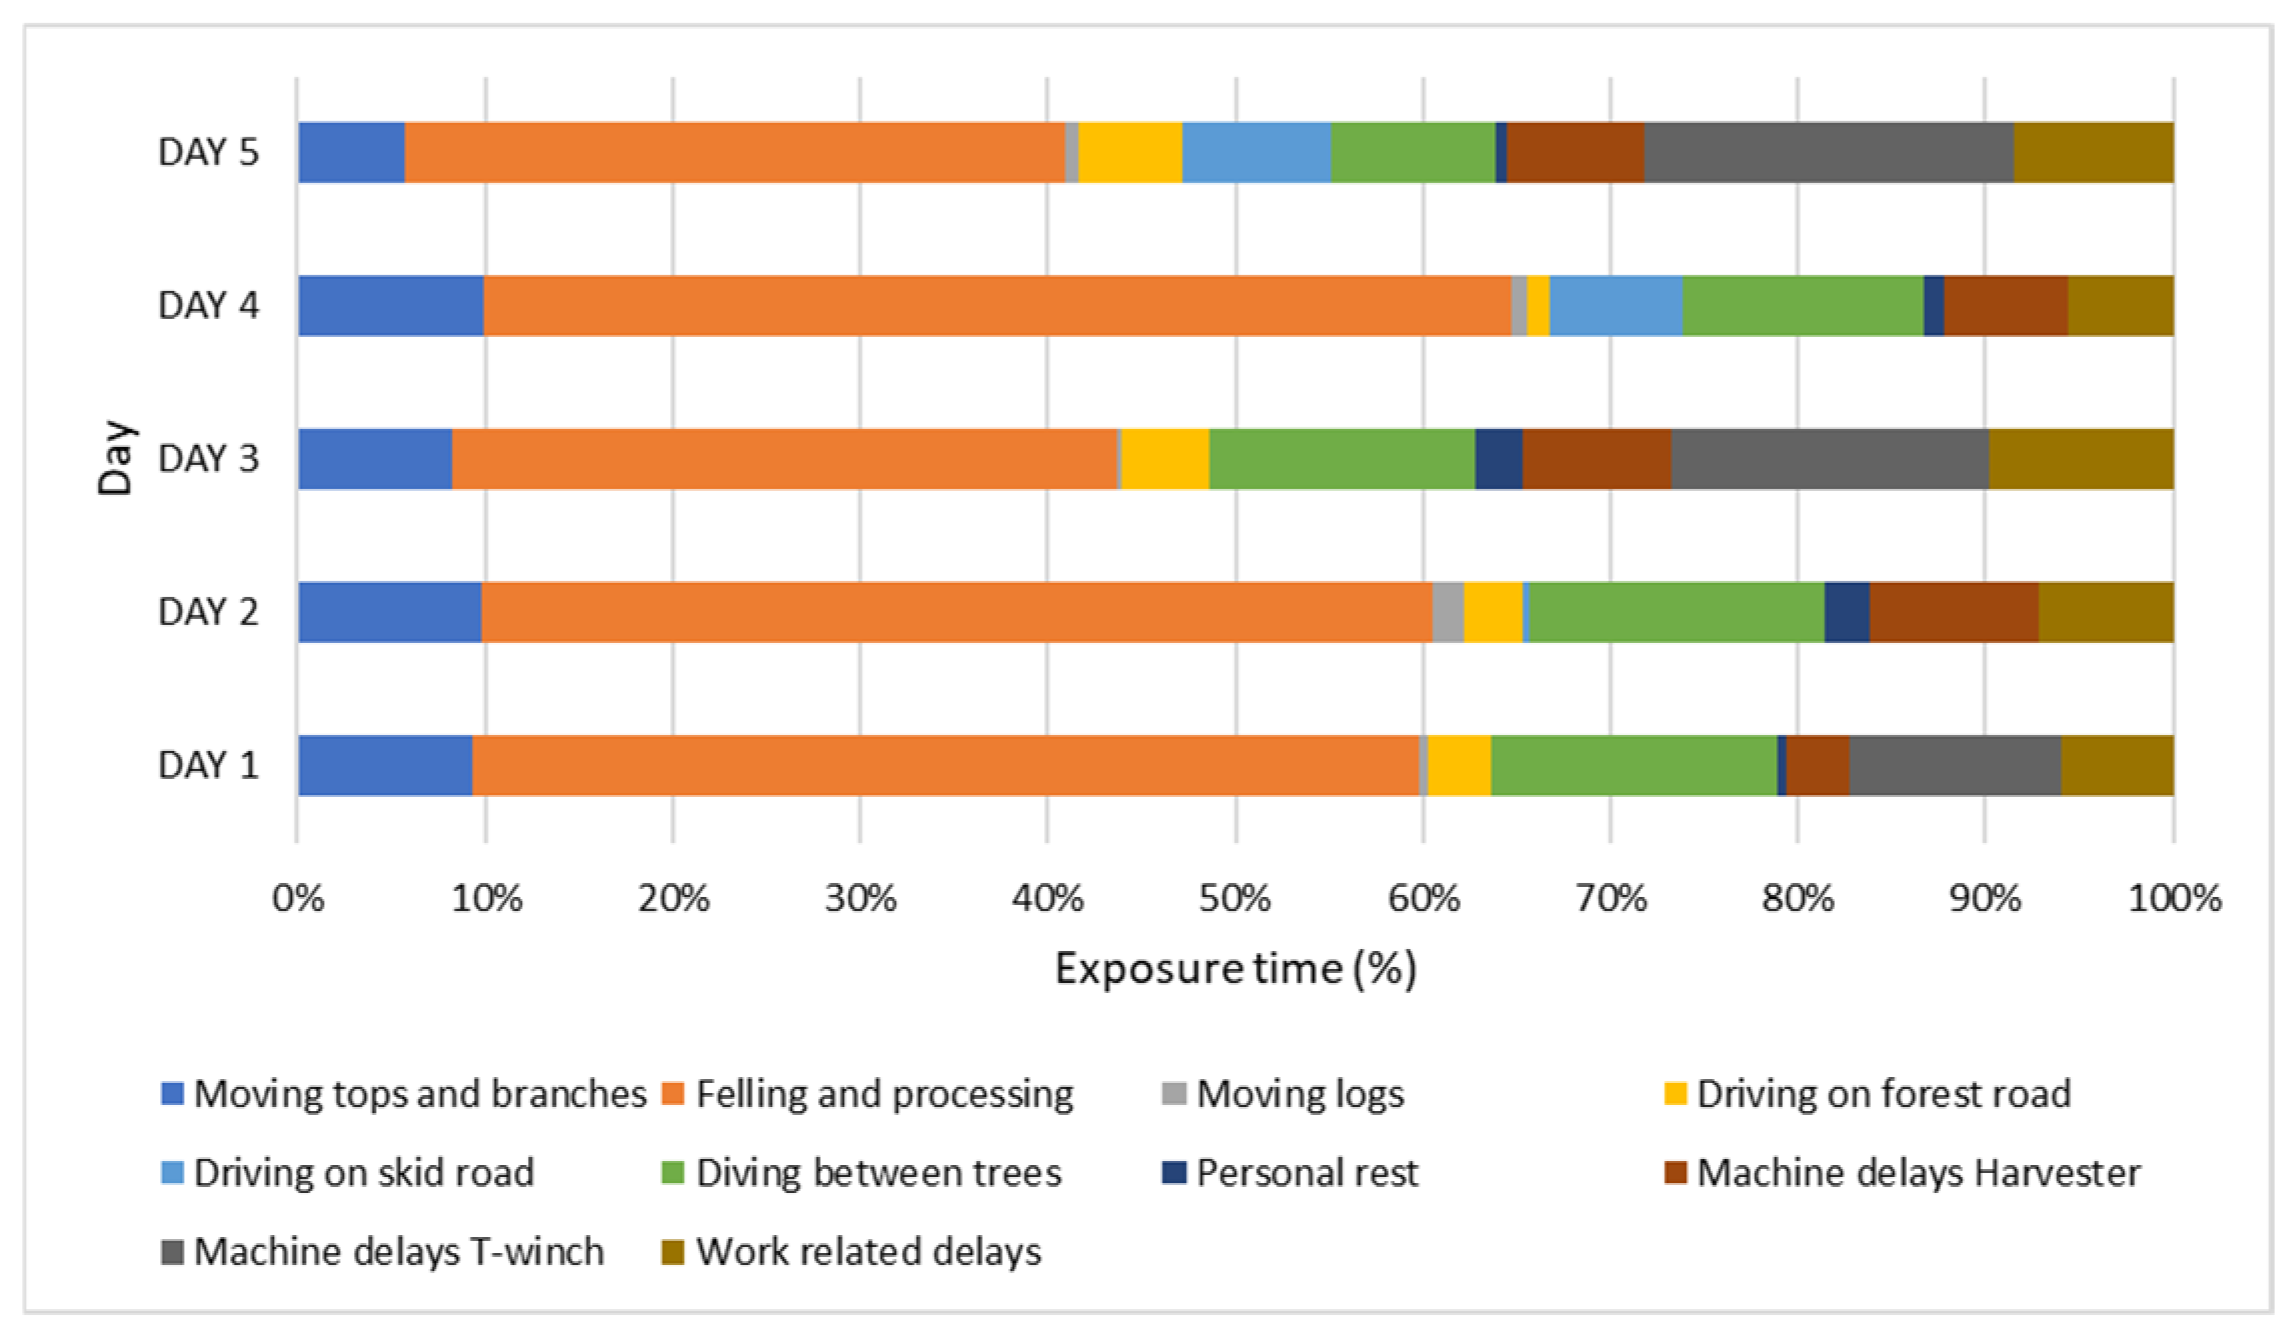
3.1. Exposure Time Structure

In general, the proportion of productive time within the total recorded workplace time (1834 min) was 72.9%. Regardless of the harvesting system, felling and processing accounted for the longest time within the productive time at 61.0%, while machine movements on skid roads and forest roads ranged from 3.8% to 4.6% of the productive time. The ratio of main productive time to supportive work time was 92.0%: 8%, being lower in the TW system (90.0%: 10%) and higher in the NTW system (93.0%: 7%) (Figure 6).
During unproductive time (delay operations), the highest proportion corresponded to machine delays (64.0%), from which delays related to the use of T-winch (TW delays) took 57.5% and delays related to the harvester maintenance 42.5%.
During machine delays, personal delays, and work-related delays, the operator worked both inside and outside the cabin (Figure 7). In general, he spent the least amount of time in the cabin during machine delays (4.0%), followed by personal delays (35.0%), with the most time spent in the cabin during work-related delays (49.0%). The distribution of delays between the individual harvesting systems is not possible due to the experimental design, as personal and work-related delays cannot be assigned exclusively to one working system.
The composition of workplace time varies from one working day to another and depends mainly on the harvesting system used and the operations applied during the day (Figure 8). Based on the duration of felling and processing, the working days can be divided into two groups. The first group comprises the first, second, and fourth day, where more than half of the working time (51.0%–55.0%) was spent on felling and processing, while the total delays were between 11% and 14% of the workplace time. The second group consists of the third and fifth day, where felling and processing accounted for about a third of the working time (32%–35%), while total delays were longer (28%–36%), mainly due to delays related to the use of the T-winch. The duration of machine driving on the skid and forest roads increased over the days, from 3% on the first and second day to 5% on the third, 8% on the fourth, and 12% on the last day, corresponding to the distances travelled each day (Figure 8).

3.2. Vibrations and Noise Exposure of the Operator

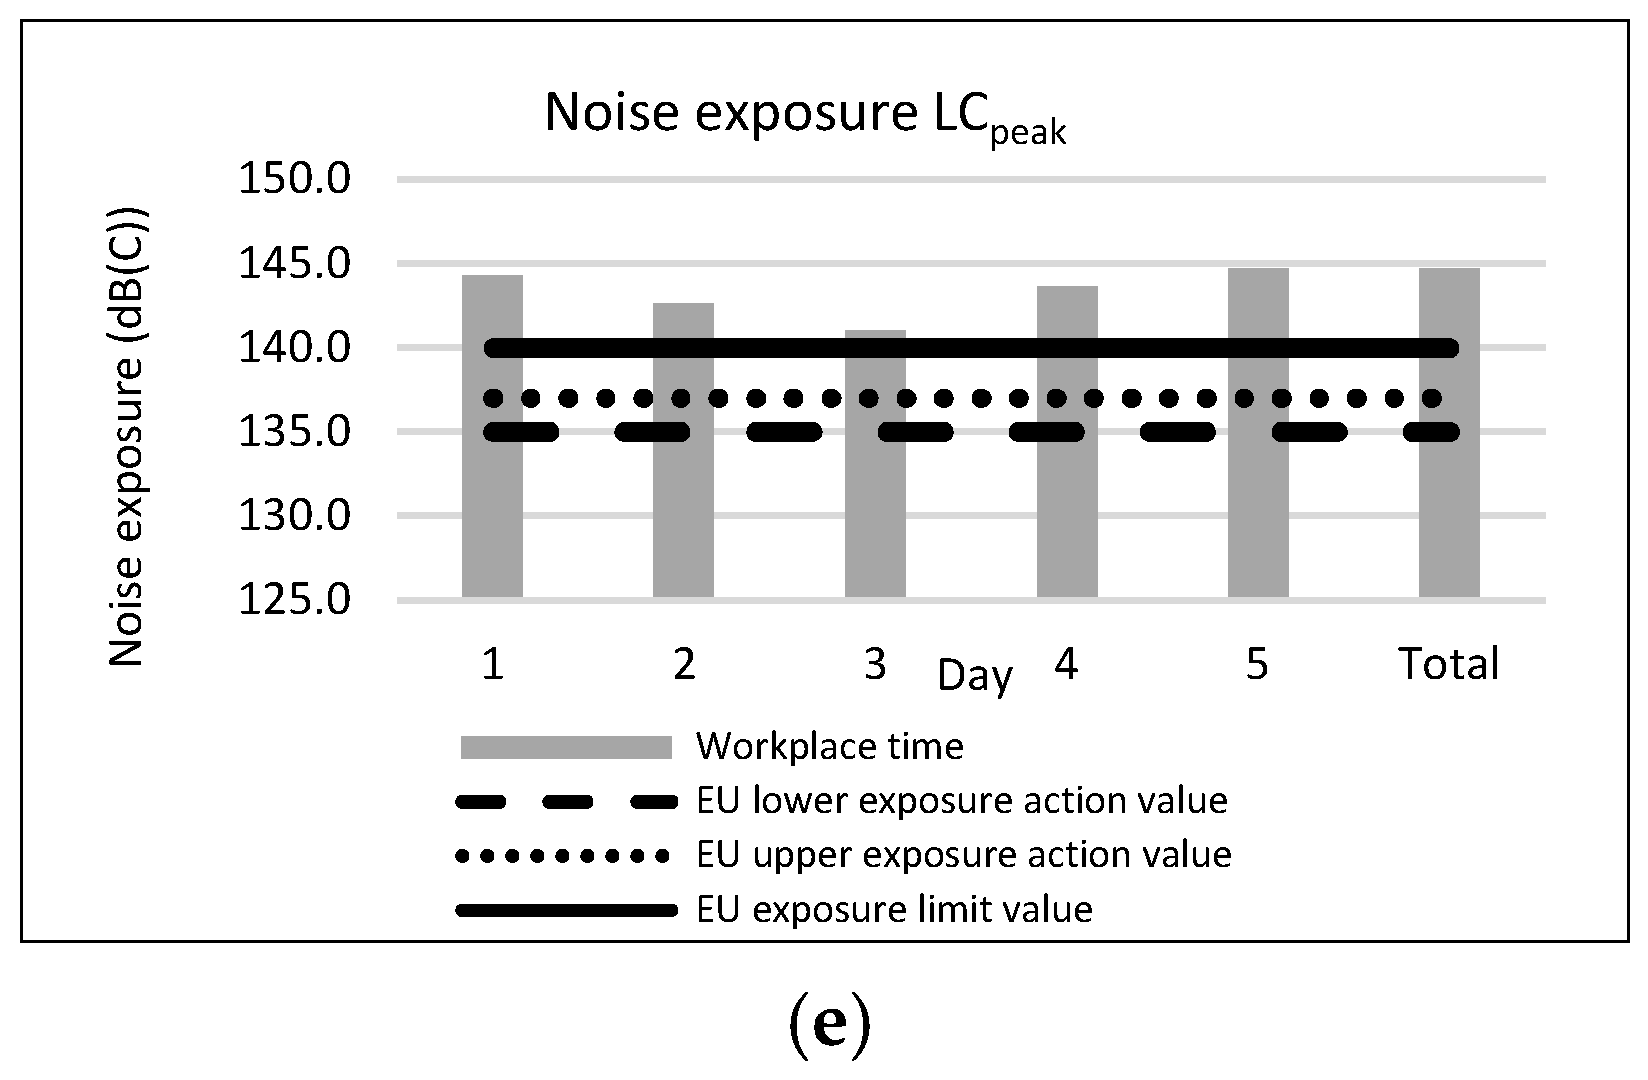
3.2.1. Average and Daily Exposure of the Operator

Depending on the individual directions, the WB seat vibration levels ranged from 0.30 m/s2 to 0.49 m/s2 during the measured workplace time and were 4.2 to 5.6 times higher during productive time than during unproductive time. Vibration levels during the supportive work time were 1.5 to 2.3 times higher than during the main productive time. Among the operations during the productive time, the highest vibrations were measured during the moving operations, ranging from 0.66 m/s2 to 0.87 m/s2, and were lower during the harvester boom operations, ranging from 0.22 m/s2 to 0.56 m/s2, and the lowest during moving logs, with vibration values ranging from 0.22 m/s2 to 0.49 m/s2. During unproductive time, vibration levels depend mainly on the ratio between the time spent in the cabin and the time spent outside the cabin (Figure 7). For example, the vibration levels inside the cabin ranged from 0.20 m/s2 to 0.25 m/s2 for personal delays but were 1.5 to 5.8 times lower during the total time (Table 3).
WB vibrations on the seat were 27% (0.10 m/s2) higher in the Y- (lateral) direction than in the X- (fore–aft) direction and 64% (0.19 m/s2) higher than in the Z- (vertical) direction during the measured workplace time. Productive time operations also had higher vibrations in the Y-direction than in the other two directions, the least in moving operations (Y/X: 10%–19%; Y/Z: 12%–32%), more in harvester boom operations (Y/X: 23%–3%; Y/Z: 107%–123%), and the most in felling and harvesting (Y/X: 37%; Y/Z: 136%). Considering the lowest vibration during operations where the machine is not moving, vibration levels increased the most during machine movement in the Z-direction (up to 3.1 times), and less in the X- and Y-directions (by up to 1.9 and 1.8 times, respectively). For personal delays, vibrations were 30% higher in the Z-direction than in the other two directions throughout the work time. This makes personal delays the only work operation where the vibration exposure was not highest in the Y-direction.
Depending on the direction of vibration, WB vibration exposure measured during workplace time ranged from 0.36 m/s2 to 0.45 m/s2 at the cabin floor (seat base) and from 0.41 m/s2 to 0.52 m/s2 in the productive time. During productive time, the highest vibrations were measured during driving on the forest road and skid road, ranging from 0.49 m/s2 to 0.84 m/s2, lower and ranging from 0.34 m/s2 to 0.50 m/s2 during driving between trees and felling and processing operations, and the lowest, ranging from 0.23 m/s2 to 0.48 m/s2, during moving logs, tops, and branches with the harvester boom. During unproductive time, the exposures were 6.4 to 6.8 times lower than during productive time. When the operator was in the cabin, the vibration exposure ranged from 0.11 m/s2 to 0.21 m/s2 for individual delays and from 0.03 m/s2 to 0.14 m/s2 during time outside the cabin.
Similar to the seat measurements, the WB vibration levels from the floor during measured workplace time were higher in the Y-direction than in the X- and Z-directions (26%). In contrast to the seat measurements, the highest vibrations were measured in the Z-direction (0.83–0.84 m/s2) during the supportive productive time and in the Y-direction (0.41–0.50 m/s2) during the main productive time. During the unproductive time, for all the delays, vibrations were highest in the Y-direction.
During measured workplace time and productive time, WBV on the seat are 10% higher in the X- and Y-directions and 20% lower in the Z-direction than on the floor. During the productive time operations, vibration levels are higher in horizontal directions (X and Y) on the seat (0.06–0.21 m/s2 or 20%–40%, 0.02–0.11 m/s2 or 4%–20%) than on the floor. On the other hand, in the Z-axis, the vibrations are lower when measured on the seat (0.01–0.18 m/s2 or 4%–40%) than on the floor, except for operation driving between trees, where vibrations from the seat were 20% (0.09 m/s2) higher than on the floor. In absolute values, vibrations in the horizontal directions on the seat relative to the floor increased the most (up to 0.21 m/s2) and, at the same time, decreased the most in the vertical direction (up to 0.18 m/s2) during machine driving operations. In relative values, however, the exposure on the seat in relation to the floor decreased the most in the X- and Z-directions and increased the least in the Y-direction in the felling and processing operation. During unproductive time, vibration levels on the seat are higher (0.01–0.07 m/s2 or 20%–120%) than on the floor between all delays.
During workplace time, hand–arm (HA) vibrations (VTV) measured on the right control lever were 1.30 m/s2, and were 0.19 m/s2 higher during productive time. Similar to the vibrations measured on the floor, the highest values were recorded during supportive work time operation (2.08 and 2.14 m/s2), lower during moving tree tops and branches and felling and processing (1.43 m/s2), and the lowest during driving between the trees and moving logs (1.38 and 1.27 m/s2). The vibrations were 5.7 times lower during the unproductive time than during the productive period. They ranged from 0.65 m/s2 to 0.78 m/s2 during the delays in the cabin and from 0.15 m/s2 to 0.42 m/s2 for the total duration of the delays (Table 3).
The operator’s noise exposure (Table 3), based on the parameter of LAeq, amounted to 77.8 dB(A) during workplace time and was 15.6 dB(A) lower in productive time (67.9 dB(A)) compared to unproductive time (83.5 dB(A)). Among the operations during productive time, the noise level was highest during machine movements (68.0–70.5 dB(A)), followed by felling and processing (67.6 dB(A)), while the lowest noise levels were recorded during moving tree tops and branches with the harvester boom (66.8–67.1 dB(A)). During the unproductive time, when the operator was in the machine cabin, the noise exposure was at least as high or even higher (70.5–72.8 dB(A)) than when driving on the forest road, where the highest noise exposure was measured among the productive operations. The highest noise level (84.8 dB(A)) was recorded during machine delays, which included all additional tasks related to the T-winch (an additional noise source) as well as tasks related to harvester maintenance. During T-winch-related machine delays, the measured noise was 84.7 dB(A), similar to the value recorded during harvester maintenance-related delays of 84.9 dB(A).
The operator’s noise exposure, based on the LCpeak parameter, was 144.7 dB(C) during the measured workplace time and 9.3 dB(C) lower during the productive time. Noise levels between 133.8 dB(C) and 136.0 dB(C) were recorded during delays inside the cabin as well as certain operations during the productive time, including driving on the road, between trees, and felling and processing. During other operations of productive time, noise exposure was lower, ranging from 106.0 dB(C) to 114.6 dB(C). Noise exposure during delays in total was much higher than during delays inside the cabin, ranging from 143.6 dB(C) to 144.7 dB(C).
The level of daily exposure is influenced not only by the different composition of workplace time (Figure 8), but also by the different workloads during the individual work operations. As the WBV analyses indicated that the exposure levels were consistently highest on the Y-axis across all working days, only the WBV exposure on the Y-axis was considered when the WBV values on the seat and on the floor were compared across the days (Table 4). The biggest variations in WBV and HAV exposure across days were observed during machine driving on the forest skid road, with particularly high values recorded on the fourth day, while the least variation occurred during moving tops and branches and between work-related delays and machine delays. During tree felling and processing, which can account for more than half of the working time (Figure 8), daily variations in exposure levels were generally low, except for WBV levels on the seat on the last measurement day. For LAeq noise exposure, the largest variations were observed during delays, especially during personal delays, while variations were minimal during the main productive work operations. Also, for LCpeak noise exposure, the largest variations were observed during personal delays; significant differences were observed during machine travel between trees, machine travel on forest roads, and during felling and processing, while the smallest variations were observed during work-related delays and machine delays, and during moving tops and branches and moving logs.
To assess exposure to WBV, HAV, and noise, exposure levels were analyzed based on measurements taken during measured workplace time. For WBV exposure measured at the seat and on the floor, the recorded values were adjusted along the Y-axis (Figure 8) using the corresponding correction factor of 1.4 (k-value). In addition, the daily exposure levels over an eight-hour reference period (A8) were compared with the exposure limit and action values defined in EU legislation [40]. As the work times were shorter than 480 min on all days (Table 4), the calculated daily noise exposure levels were lower than those recorded during actual working hours. This comparison is particularly relevant for optimizing work schedules and assessing their potential impact on operator exposure.
WB in HA vibration exposure over an eight-hour period and during the actual measured workplace time was lowest at all three measurement points (seat, floor, and control lever) on the third day, mainly due to the relatively high proportion of machine delays (Figure 7). The highest seat and control lever vibration levels were recorded on the first day, due to both the extended duration of certain tasks and the peak daily vibration intensities during tree felling and processing and driving between trees (Table 4). Exposure on the floor was highest on the fifth day, mainly due to the prolonged duration and peak vibration intensities observed during driving on both forest and skid roads and during felling and processing operations. In contrast, noise exposure (LAeq) was highest on the third day, due to the same factor influencing vibration exposure—the prolonged duration of machine delays. Conversely, LAeq exposures were lowest on the fourth day due to the lowest proportion of delays and the lowest daily noise exposure during machine and work-related delays.
A comparison of the measured workplace time (Figure 9) exposures with the limit and action values defined in the EU Directives shows that WBV exposure at the operator’s seat exceeded the action value of 0.5 m/s2 [40] on all five days measured, with values ranging from 0.54 m/s2 to 0.75 m/s2 and a total exposure of 0.69 m/s2. WBV exposure measured on the floor also exceeded the action value, but only on the fifth day (0.56 m/s2), while on the remaining four days, exposure levels were between 0.05 m/s2 and 0.19 m/s2 below the action value. HAV exposure at the control lever did not exceed the action value (2.5 m/s2) [40], with daily values ranging from 1.07 m/s2 to 1.51 m/s2 below the action value. LAeq noise exposure, with work time values between 72.5 dB(A) and 78.8 dB(A), did not exceed the lower action value of 80 dB(A) [41] (Figure 9).
The daily (A8) WBV exposure at the operator’s seat was similar to the measured exposure during workplace time, above the action value (0.5 m/s2) on all five days, with values between 0.50 m/s2 and 0.67 m/s2 and a total exposure of 0.61 m/s2. In contrast, the WBV exposure at the harvester floor remained below the action value, with daily (A8) values between 0.07 m/s2 and 0.21 m/s2 below the threshold value. The HAV exposure also did not exceed the action value (2.5 m/s2), with values between 1.23 m/s2 and 1.59 m/s2 below the threshold value. The same applies to LAeq noise exposure, where the daily values were between 1.91 dB(A) and 8.43 dB(A) below the lower action value (80 dB(A)) [36]. However, the daily LCpeak noise exposure exceeded both the lower (135 dB(C)) and the upper (137 dB(C)) action values [40], with daily values between 141.0 dB(C) and 144.7 dB(C). Due to the lack of use of hearing protection, the exposure also exceeded the daily limit value of 140 dB(C) (Figure 9).

3.2.2. Impact of Harvesting System, DBH, and Tree Species on WBV, HAV, and Noise Exposure

A comparison of vibration and noise exposure during the main productive work operations between harvesting systems showed that exposure was generally equal or higher when the TW rather than NTW system was used, except for WBV exposure in the X-direction during machine movement between the trees and LCpeak noise exposure during felling, processing, and moving logs (Table 5). The differences in WBV exposure between the harvesting systems ranged from 0.00 m/s2 to 0.04 m/s2 on the seat and from −0.01 m/s2 to 0.04 m/s2 on the floor, while the differences in HAV exposure at the control lever ranged from 0.07 m/s2 to 0.20 m/s2. The difference in LAeq noise exposure between TW and NTW systems ranged from 0.0 dB(A) to 0.7 dB(A), while the difference in LCpeak noise exposure ranged from −0.1 dB(C) to 0.4 dB(C) (Table 5).
The highest number of statistically significant differences in exposure between the harvesting systems was confirmed during the felling and processing operation, with the differences being insignificant only for the WBV on the seat in the X-direction and for the LCpeak noise exposure. Among the exposure indicators, most statistically significant differences were observed for LAeq noise exposure, with insignificant differences only for the operation of moving logs. During the main productive time, exposure differences between the harvesting systems were statistically significant for the same indicators, directions, and measurement locations as for operation of felling and processing, apart from WBV on the ground in the X-direction, where the differences were not significant.
Since the observed differences between the harvesting systems may also occur due to the characteristics of the felled trees, such as the diameter at breast height (DBH) and tree species (TS), we statistically examined their influence on vibration and noise exposure. The results show that the DBH significantly increases the vibration exposure in all directions and at all measurement locations, as well as the LCpeak noise exposure during the main productive time, while its influence on the LAeq noise exposure is not statistically significant (Table 6). The tree species (TS) has a significant influence on the WBV exposure on the seat in all directions, the HAV exposure on the control lever, and the LAeq and LCpeak noise exposure, with all exposure values being higher when processing deciduous trees than conifers. After accounting for the effects of DBH and tree species, the differences in noise exposure between harvesting systems for the same parameters, directions, and measurement locations remained statistically significant as before adjusting for these factors (Table 6).
In addition to the tree characteristics, the slope of the harvesting trails can also have an influence on the exposure of the worker, with steeper slopes observed in the NT system than in the NTW system (Table 1). To account for this factor, an analysis of covariance was performed for four neighboring harvesting trails, with the slope ranging between 40.0% and 45.0% (Figure 2): trails 1 and 4 for the TW system and trails 17 and 18 for the NTW system. The results are largely consistent with those obtained for all harvesting trails. The WBV exposure on the seat and on the floor in the Y- and Z-directions, as well as the HAV exposure on the control lever, were significantly influenced by all three examined factors. The WBV exposure on the seat in the X-direction was significantly influenced by the harvesting system and the tree species, the LAeq noise exposure was significantly influenced by the harvesting system, and the LCpeak noise exposure was significantly influenced by the diameter at breast height of the felled trees (Table 6).

4. Discussion

Winch-assisted harvesting (the TW system) is not a new system of wood extraction. However, a review of previous research shows that there is a lack of studies examining the effects of TW on exposure time composition and operator exposure to physical risk factors when working with winch-assisted harvesters. Based on existing research on ground-based machines, it is expected that changes in organizational and terrain conditions could affect not only productivity but also safety at work in terms of exposure to noise and vibration. Operator exposure to vibrations is influenced by engine speed [42], hydraulic pump pressure [43], travel speed [44,45], and slope and roughness of the terrain [21], while noise exposure is influenced by the slope of the terrain [46], the engine power [45], and the age, wear, and cabin sealing quality [47].
The analysis of workplace time composition or the distribution of exposure time is a crucial part of any ergonomic study, as previous research indicates that the duration of individual operations or groups of operations can significantly affect the operator’s workload, while the duration itself is influenced by working conditions in the broadest sense [48]. The average proportion of productive time across all measurement days was 72.9%, with the variation between days ranging from 49.3% to 87.8%. These daily variations are attributed to differences in the composition of workplace time, which in turn are influenced by the working methods and the harvesting system, with the main break time being excluded from the calculations of unproductive time. The average proportion of productive time was lower than the Slovenian standard time for harvesting with large harvesters (78.2%) [39] and lower than the results of previous studies (88.0%, 73.6%, and 72,6%) [49,50,51]. The results suggest that productive time in the TW system is reduced by additional tasks associated with winch use, such as moving the machine, anchoring, attaching, and detaching the machine with a wire rope, adjusting the pulling force, installing a directional pulley, bending the rope, and refueling. These results are in line with previous research on winch-assisted harvesting [52].
During the productive time, the felling and processing operation had the longest duration of, on average, 61.0% of the productive time, with daily variations between 55.3% and 64.0%. This is generally consistent with previous studies [21,49,52,53]. Differences compared to previous studies may be not only due to the harvesting system, but also to different working, terrain, and stand conditions, while daily variations are primarily influenced by the composition of the workplace time, especially the proportion of time spent driving on skid roads and forest roads, rather than the harvesting system itself. This is also indicated by the ratio between main productive time and supportive productive time, which was unexpectedly lower for the winch-assisted harvesting system (TW) compared to harvesting without winch assistance (NTW). The reason for this is that the winch, which was positioned and anchored on the forest road, made the transition from the harvesting trail to the forest road more difficult due to the steeper slope and, above all, due to the lower pulling force when the machine closes the winch. This resulted in damage to the embankment of the forest road due to wheel slippage. The difficult transition on the forest road in one case caused the boogie axle of the harvester to rotate 180°, which poses a risk of machine damage. To eliminate the problem of difficult transitions, from harvesting trails to the road, the winch cable path should be adjusted with a directional pulley system.
The largest proportion of unproductive time was accounted for by machine delays (62.0%), followed by work-related delays (31.7%), and the smallest proportion by personal rest (6.3%). Of the total delay duration, the highest proportion of time spent inside the harvester cabin was due to work-related delays (49.0%), while the lowest proportion was due to machine delays (4.0%). The composition of unproductive time is not only important in terms of vibration and noise exposure, but also plays a crucial role in the occupational safety risks and psychophysical workload of forest operators when they perform tasks and machine maintenance outside the cabin [54,55].
The WBV exposure on the harvester operator’s seat during the productive time ranged between 0.33 and 0.56 m/s2, similar to the values measured in karst terrain [21] and higher than those observed in the boreal forests of Russia [56]. During unproductive time, WBV exposure was significantly lower (0.08–0.10 m/s2) and depended on the proportion of time the operator spent inside the cabin. When driving on forest and skid roads, the WBV exposure was 1.5 to 2.3 times higher than during the main productive operations, with the lowest values measured during felling and processing (0.22–0.52 m/s2). The results are similar to those of previous studies [21,45,56,57,58] and confirm that off-road machine driving increases WBV exposure and that WBV exposure is higher during machine movement compared to stationary work with the crane and harvesting head.
WBV measurements on the operator’s seat showed that the vibrations in the Y-axis during workplace time were 26.6% and 64.0% higher than those in the X- and Z-axes, respectively. The highest values were also recorded in the Y-axis during the productive time, which could be attributed to reduced machine stability in the lateral direction due to the height-to-width ratio of the harvester [59] or to the machine movements induced by the harvester head. The torque transmitted to the head varies with the movement of the tree through the head and with the distance of the center of gravity from the gripping point during log processing. Vibrations in the vertical axis (Z-axis) are significantly influenced by the seat suspension and the use of tracks on wheeled machines [60]; in a study on tracked harvesters, the authors concluded that vibrations increased in the Z-axis compared to wheeled harvesters [61]. Despite the use of an air-suspension seat, the WBV exposure increased by up to 3.1 times in the Z-axis during operations involving machine movement, compared to stationary operations, while the increase in the X- and Y-axes was lower (up to 1.9 and 1.8 times, respectively). The vibration exposure in the Y-axis during the productive time in the study (0.54 m/s2) was lower than on karst terrain (0.57 m/s2) [21], but higher than in the study on flat terrain in Russia [56], suggesting that ground conditions may influence vibration exposure levels.
Depending on the direction of vibration measured on the floor, the WBV values during workplace time were between 0.35 m/s2 and 0.45 m/s2, during productive time they were from 0.40 m/s2 to 0.51 m/s2, and they were between 0.41 m/s2 and 0.50 m/s2 during main production time. Similar to the seat measurements, the highest values were measured in the Y-axis. During the unproductive time, the vibration values were 6.4 to 6.8 times lower than during the productive time. The highest floor vibration values were measured while driving on forest and skid roads (0.83–0.85 m/s2), with the highest values occurring in the Z-axis. This indicates that the seat suspension plays an important role in reducing the vibration exposure in the vertical axis, as the WBV values on the seat were 20% lower during the same operations. The results also show that WBV values in the X- and Y-axes were higher on the seat than on the floor, suggesting that vibration exposure could be further reduced by using a multi-axis suspension seat, which significantly reduces vibrations in all directions and is specifically designed for off-road machines [62].
During the measured work time, the HAV values were highest during the productive time (1.27–2.14 m/s2), similar to the WBV. Within the productive time, the highest values were measured during driving on forest and skid roads (2.08–2.14 m/s2). During the unproductive time, the vibration values were 5.7 times lower than during the productive time. Previous studies have shown that the intensity of steering wheel vibrations increases with engine speed and power [28]. The measured HAV exposures during operations are comparable to those measured on the steering wheel of an Ecotrac 140 V skidder, but lower than those measured on the steering wheel of a smaller agricultural tractor [63], which illustrates the influence of machine design on vibration exposure. The HAV exposure is also lower compared to other forestry activities, especially compared to the use of chainsaws [64]. The Ponsse harvester control levers with a ball shape [30], in combination with the armrest, influences the positioning of the hand, which plays an important role in the transmission of vibrations from the palm to the wrist and further along the arm [65]. Considering the fact, that harvester operators perform up to 4000 inputs per hour with their fingers [66] or around 35,000 repetitive motions per day, vibration transmission is particularly important as it can synergistically contribute to the development of repetitive motion disorders [67].
The average noise exposure of the operator during work time was 77.8 dB(A), with levels of 67.9 dB(A) during productive time and 83.5 dB(A) during unproductive time. Noise exposure during productive time was comparable to or lower than in previous studies [21,68], and, at 72.2 dB(A), it was also lower in the cabin during unproductive time than in previous studies [21], which could indicate differences between machine manufacturers. Unlike vibration exposure, noise exposure was higher during the unproductive time than during the productive time. The cause of increased exposure to noise is engine operation during delays, where noise from open doors or work performed outside the cabin (such as maintenance and refueling) resulted in additional exposure for the operator. Another significant source of noise was the operation and movement of the T-winch when the operator was in the proximity. The lowest noise exposure levels were measured when during operation of moving logs (66.8 dB(A)) and moving tops and branches (67.1 dB(A)), while the highest level (84.8 dB(A)) occurred during machine delays, when the operator was engaged in tasks related to the T-winch (moving, refueling, bending wire, and attaching wire to the machine) and harvester maintenance (refueling, greasing, and sharpening blades). A detailed analysis of machine delays showed that noise exposure was 0.2 dB(A) lower for delays associated with the T-winch (84.7 dB(A)) than for delays associated with the harvester (84.9 dB(A)). This result suggests two important things: that the use of a T-winch in the TW system does not increase the operator’s noise exposure during unproductive time compared to the NTW system; and in the NTW system, certain tasks performed during unproductive time, such as manual blade sharpening, can contribute significantly to the operator’s noise exposure.
Similar to the LAeq noise exposure levels, the highest LCpeak noise exposures were recorded during the delays, with a maximum value of 144.7 dB(C), which is 13.1 dB(C) higher than the values measured during harvesting on karst terrain [21]. A detailed analysis of the individual noise peak values showed that high LCpeak values consistently occurred when closing the cabin door, which required a considerable amount of force to fully close. Based on the observations at work, additional sources of peak values occurred when greasing machine parts with a pneumatic gun and tightening traction tracks, which required the use of a pneumatic hammer and a larger hand hammer, that were comparable to the LCpeak exposures observed during wedging with an axe during a tree felling [69]. LCpeak exposure during productive time (135.4 dB(C)) was 7.7 to 19.1 dB(C) higher than those reported in previous studies [21,25,69]. In general, several factors influence noise exposure, including cabin sealing and component wear [48], driving speed, and engine speed [68].
Daily A(8) exposure values are influenced by the time structure of the working day, the intensity of exposure during different work operations, and individual peak values. The results show that the daily A(8) values for WBV were highest in the Y-direction on all measurement days, which, as already mentioned, could be related to the reduced lateral stability of forestry machines, especially on uneven terrain [59], as well as to the influence of the tree and log center of gravity during processing and movement. When comparing daily A(8) WBV and HAV exposure over different days, the lowest 8 h exposure in work time was measured on the third day, which also had a relatively high proportion of machine delays. Previous studies have also shown that, in addition to the duration of exposure, the individual peak vibration values within a work process also strongly influence the overall exposure levels. Poje et al. [21] found that WBV exposure decreased by 67% after only one extreme peak value was excluded.
Comparison of the WBV measured on the seat during work time between different days showed that the exposure exceeded the EU action value of 0.5 m/s2 [40] on all five measurement days. If the WBV measured on the floor was also compared with the EU regulations [40], the action value would have been exceeded on the fifth day of measurement. However, for seated work environments, the standard [33] (ISO 2631-5:2018) explicitly does not consider floor measurements when assessing the impact on health, although they are included in the assessment of comfort. HAV exposure levels remained below the EU action value (2.50 m/s2) [38], but their actual impact on workers’ health remains unclear. Studies have shown that the combined effect of vibrations and repetitive motions can lead to increased finger control effort, resulting in muscle contraction injuries and altered finger sensation over time. This phenomenon, known as multi-finger action, is described in the scientific literature as finger enslavement or lack of individuation [70]. Measurements of HAV exposure on forestry machinery are often overlooked but can have significant importance. For example, researchers have found high daily HAV exposures at the steering wheel of agricultural tractors where exposures exceeded limit values. In such cases, up to 10% of operators could develop white finger disease in less than two years [63].
The equivalent noise level LAeq A(8) did not exceed the lower action limit value of 80 dB(A) on any of the five measurement days, which contrasts with the results of a study conducted in Brazil, in which 17 machines exceeded the action limit value, and 10 even exceeded the exposure limit value of 85 dB(A) [47]. It is also consistent with studies from Europe [21,24,68]. However, the measured LCpeak A(8) values exceeded the daily exposure limit of 140 dB(C) on all five measurement days. According to ISO 9612:2009 [35], this means that under such conditions the operator must either stop the work or use appropriate personal protective equipment (PPE) such as earmuffs or earplugs. The highest peak values measured in the harvester cabin were related to the noise generated when closing the cabin door, which required considerable force to close, as well as the operator’s interaction with the traction winch, which required frequent exits from the harvester cabin to attach the wire to the harvester. In addition, the attachment of the T-winch to the ground required the operator to be close to the machine to assess successful anchoring, which also contributed to noise exposure. To mitigate noise-related risks, the use of hearing protection is recommended when work tasks are conducted outside the harvester cabin [47]. In addition, regular inspection of the cabin doors is recommended to ensure their proper functioning and to minimize excessive noise when closing. Finally, it is advisable for the operator to switch off the harvester before leaving the cabin to reduce noise exposure and increase safety in the workplace.
In order to determine whether the harvesting system affects operator exposure, we analyzed exposure levels for individual work operations during main productive time and overall. The results indicate that WBV, HAV, and noise exposure were generally higher when working with the TW harvesting system than with the NTW system. Statistical analysis confirmed significant differences between the two systems for most of the exposure indicators analyzed during the main productive time, taking into account the influence of diameter at breast height (DBH) and tree species on exposure levels. To eliminate the potential influence of terrain slope, we repeated the statistical analysis exclusively for four harvesting trails with slopes between 40.0% and 45.0%, but results remained largely unchanged. Based on these findings, we conclude that the TW harvesting system significantly increases WBV and HAV, as well as noise exposure. When working on steep terrain, ground-based machines often exceed the maximum slope considered safe for wheeled (30%) and tracked machines (40%) [71], which increases the risk of machine slippage, rollovers, and fatal accidents [72]. Visser and Stampfer [73] suggest that wheeled harvesters and forwarders should not operate on slopes above 35%, machines adapted for steep terrain should not exceed 50%, and machines equipped with traction-assist winches may operate on slopes up to 70%–80%. The authors also note that machine manufacturers often do not specify the maximum allowable operating slope in the technical data. It has been observed that engine speed and hydraulic pump pressure significantly affect the level of seat vibration [43], while the required engine power and fuel consumption increase on steeper slopes [42]. When using traction winches in combination with other machines, there may be slight delays in communication between the machines, resulting in sudden tension peaks in the wire rope when the machine starts descending, as the winch cannot immediately adjust the wire tension in synchronization with the machine movement. These sudden tension peaks can contribute to a higher WBV exposure. Therefore, it is crucial that the operator is highly experienced and consistently applies the minimum required pulling force as this reduces the magnitude of tension peaks [74].
In addition to the harvesting system, DBH and tree species significantly influence the operator’s exposure. Exposure increases with DBH and is higher when harvesting broadleaf than coniferous trees. These findings align with previous studies that have identified DBH as a key factor influencing exposure [58,75]. The influence of tree species is logical, as broadleaf trees generally have higher wood density and thicker branches that do not grow perpendicular to the tree stem. These characteristics, together with lower productivity [76,77], may also contribute to increased WBV and noise exposure. Further analysis of operator exposure during winch-assisted harvesting on steep slopes will be necessary to better understand the impact of various factors on forest workers exposure.
Since this study was conducted under real conditions in the forest and not in a controlled experiment specifically designed to evaluate the impact of winch-assist systems on WBV and noise exposure, we recommend that future studies compare winch-assisted harvesting on different terrain with varying gradients of harvesting trails using randomly selected trails for TW and NTW systems to eliminate the possible influence of trail characteristics on the results. In addition, from an ergonomic perspective, further detailed studies of unproductive time and studies on psychophysical workload are essential, as previous research has indicated that mental workload is higher on steep terrain [18,20].
As observed, high noise exposure occurs during unproductive time, while vibration exposure predominates during the productive time. To reduce noise exposure when harvesting with active winch-assist systems, we recommend the use of earmuffs or earplugs for all operations performed outside the cabin. To minimize WBV, additional care should be taken when preparing the site and organizing the work to drive as little as possible on forest and skid roads.

5. Conclusions

This study shows that the proportion of productive time varies between harvesting systems and is bigger when using the NTW system (harvesting without winch assistance), because of additional work operations required during TW harvesting (winch-assisted harvesting), which goes along with other studies [52]. There were differences in duration of individual work operations, not solely because of different harvesting systems, but also because of different working and terrain conditions, the time spent driving on skid and forest roads, and work time composition, which was similar to other studies [21,50,52,77].
WBV exposure measured on the seat did exceed the action limit value on all measured days. WBV on the floor was excessive only on the fifth day and was generally always the highest in the Y-axis, mainly because of lower lateral stability of the harvester during driving on rough terrain [59] and the tree and log center of gravity during processing. However, HAV exposure never exceeded action limit values. WBV and HAV exposures were highest during driving operations and lower during operations using the harvester boom and head.
Operator exposure to noise (LAeq) did not exceed the daily lower limit value. In contrast, LCpeak values exceeded the daily limit value from EU legislations, which means that some occasional high peak values, which occurred mainly when closing the cabin door, and during some operations requiring the use of the T-winch and harvester, may stop whole harvesting process.
The harvesting system had a significant impact on operator exposure to WBV, HAV, and noise (LAeq), which was higher for the TW system than for the NTW system, but absolute differences in values were low. Additionally, with higher DBH exposure in all measured parameters except for LAeq, tree species has a significant influence on WBV measured at the seat and HAV measured on the right control lever, as well as on LAeq and LCpeak exposure, and were higher during harvesting broadleaves.
Further research should be conducted to analyze the impact of using winch assistance on steep slopes on different psychophysical exposures of operators. The results of this study show that the operator is advised to wear earplugs or earmuffs in order to minimize the exposure to noise. Additional planning and avoiding driving on skid and forest roads could reduce operator exposure to WBV and HAV.

Author Contributions

Conceptualization, A.P. and L.P.; Methodology, A.P.; Software, L.P.; Validation, L.P. and A.P.; Formal analysis, L.P.; Investigation, L.P.; Resources, A.P.; Data curation, L.P.; Writing—original draft preparation, L.P.; Writing—review and editing, A.P.; Visualization, L.P.; Supervision, M.Š.; Project administration, M.Š.; Funding acquisition, L.P. All authors have read and agreed to the published version of the manuscript.

Funding

This research was funded by ARIS (Slovenian research and innovation agency) programme funding, The forest-wood chain and climate changes: transition to a circular bioeconomy (P4-0430), and University of Ljubljana, Biotechnical faculty. The research was also supported by the Pahernik Foundation, for the scientific work and publishing the results.

Data Availability Statement

The data supporting this study may be provided upon reasonable request to the authors of the study.

Acknowledgments

The authors wish to thank Slovenian state forests (SiDG) for technical support and carrying out winch-assisted harvesting.

Conflicts of Interest

The authors declare no conflicts of interest. The funders had no role in the design of the study, in the collection, analysis, interpretation of data, in the writing of the manuscript, or in the decision to publish the results.

Abbreviations

The following abbreviations are used in this manuscript:
WBVWhole-body vibrations
HAVHand–arm vibrations
TWWinch-assisted harvesting
NTWHarvesting without winch assistance (conventional harvesting)
LAeqEquivalent continuous sound level
LCpeakPeak sound level
DBHDiameter at breast height
VTVVibration total value
TSTree species

References

  1. Lundbäck, M.; Häggström, C.; Nordfjell, T. Worldwide trends in methods for harvesting and extracting industrial roundwood. Int. J. For. Eng. 2021, 32, 202–215. [Google Scholar] [CrossRef]
  2. Heinimann, H.R. Forest operations under mountainous conditions. In Forests in Sustainable Mountain Development: A State of Knowledge Report for 2000; Price, M.F., Butt, N., Eds.; Task Force on Forests in Sustainable Mountain Development; CABI Publishing: Wallingford, UK, 2000; pp. 224–234. [Google Scholar] [CrossRef]
  3. Adams, J.D.; Visser, R.J.M.; Prisley, S.P. Modelling steep terrain harvesting risks using GIS. In Proceedings of the Austro 2003: High Tech Forest Operations for Mountainous Terrain, Schlägl, Austria, 5–9 October 2003. [Google Scholar]
  4. Asikainen, A.; Leskinen, L.A.; Pasanen, K.; Väätäinen, K.; Anttila, P.; Tahvanainen, T. The Present and Future of the Forestry Machinery Sector. Finnish Forest Research Institute. 2009. Available online: https://jukuri.luke.fi/handle/10024/504111 (accessed on 5 February 2025).
  5. Prem, J.; Bauer, H. Austrian annual timber harvesting report for 2019. In German: Holzeinschlagsmeldung für das Kalenderjahr 2019; Federal Ministry of Agriculture, Regions and Tourism: Wien, Austria, 2020; 12 p. [Google Scholar]
  6. Pucher, C.; Erber, G.; Hasenauer, H. Europe’s Potential Wood Supply by Harvesting System. Forests 2023, 14, 398. [Google Scholar] [CrossRef]
  7. Šporčić, M.; Landekić, M.; Šušnjar, M.; Pandur, Z.; Bačić, M.; Mijoč, D. Shortage of Labour Force in Forestry of Bosnia and Herzegovina–Forestry Experts’ Opinions on Recruiting and Retaining Forestry Workers. Croat. J. For. Eng. 2024, 45, 183–197. [Google Scholar] [CrossRef]
  8. Enache, A.; Kühmaier, M.; Visser, R.; Stampfer, K. Forestry operations in the European mountains: A study of current practices and efficiency gaps. Scand. J. For. Res. 2016, 31, 412–427. [Google Scholar] [CrossRef]
  9. Holzfeind, T.; Visser, R.; Chung, W.; Holzleitner, F.; Erber, G. Development and Benefits of Winch-Assist Harvesting. Curr. For. Rep. 2020, 6, 201–209. [Google Scholar] [CrossRef]
  10. Visser, R.M.; Spinelli, R. Benefits and Limitations of Winch-Assist Technology for Skidding Operations. Forests 2023, 14, 296. [Google Scholar] [CrossRef]
  11. FISC. Winch-Assisted Harvesting, Best Practice guide. Part A, the Winch-Assist System. 2022. Available online: https://www.safetree.nz/resources/winch-assisted-harvesting-bpg (accessed on 11 March 2025).
  12. Mckenzie, D.W.; Richardson, B.Y. Feasibility study of self-contained tether cable system for operating equipment on slopes of 20 to 75%. J. Terramech. 1978, 15, 113–127. [Google Scholar] [CrossRef]
  13. Sessions, J.; Leschinsky, B.; Chung, W.; Boston, K.; Wimer, J. Theoretical stability and traction of steep slope tethered feller-bunchers. For. Sci. 2017, 63, 192–200. [Google Scholar] [CrossRef]
  14. Cavalli, R.; Amishev, D. Steep Terrain Forest Operations–Challenges, Technology Development, Current Implementation, and Future Opportunities. Int. J. For. Eng. 2019, 30, 175–181. [Google Scholar] [CrossRef]
  15. Schönauer, M.; Holzfeind, T.; Hoffmann, S.; Holzleitner, F.; Hinte, B.; Jaeger, D. Effect of a Traction-Assist Winch on Wheel Slippage and Machine Induced Soil Disturbance in Flat Terrain. Int. J. For. Eng. 2021, 32, 1–11. [Google Scholar] [CrossRef]
  16. Tynkkynen, M. Assessing Harvester Operators’ Mental Workload Using Continuous ECG Recording Technique. Int. J. Cogn. Ergon. 2001, 5, 213–219. [Google Scholar] [CrossRef]
  17. Berger, C. Mental stress on harvester operators. High Tech Forest Operations for Mountainous Terrain. In Proceedings of the Formec Conference 2003, Schlaegl, Austria, 5–9 October 2003; Available online: https://www.formec.org/images/proceedings/2003/22_berger.pdf (accessed on 6 February 2025).
  18. Szewczyk, G.; Spinelli, R.; Magagnotti, N.; Tylek, P.; Sowa, J.M.; Rudy, P.; Gaj-Gielarowiec, D. The Mental Workload of Harvester Operators Working in Steep Terrain Conditions. Silva Fenn. 2020, 54, 10355. [Google Scholar] [CrossRef]
  19. Szewczyk, G.; Spinelli, R.; Magagnotti, N.; Mitka, B.; Tylek, P.; Kulak, D.; Adamski, K. Perception of the Harvester Operator’s Working Environment in Windthrow Stands. Forests 2021, 12, 168. [Google Scholar] [CrossRef]
  20. Spinelli, R.; Magagnotti, N.; Labelle, E.R. The Effect of New Silvicultural Trends on Mental Workload of Harvester Operators. Croat. J. For. Eng. 2020, 41, 177–190. [Google Scholar] [CrossRef]
  21. Poje, A.; Grigolato, S.; Potočnik, I. Operator Exposure to Noise and Whole-Body Vibration in a Fully Mechanised CTL Forest Harvesting System in Karst Terrain. Croat. J. For. Eng. 2019, 40, 139–250. [Google Scholar]
  22. Schettino, S.; Minette, L.J.; Caçador, S.S.; Reboleto, I.D. Assessment of Occupational Vibration on Tire × Track Harvesters in Forest Harvesting. In Proceedings of the 20th Congress of the International Ergonomics Association, IEA 2018, Florence, Italy, 26–30 August 2018. [Google Scholar] [CrossRef]
  23. Camargo, D.A.; Munis, R.A.; Simões, D. Investigation of Exposure to Occupational Noise among Forestry Machine Operators: A Case Study in Brazil. Forests 2021, 12, 299. [Google Scholar] [CrossRef]
  24. Lima, C.; Lima, R.C.; Souza, A.; Minette, L.; Schettino, S.; Vieira, M.; Nascimento, G. Occupational Noise and Vibration Assessments in Forest Harvesting Equipment in North-Eastern Brazil. J. Exp. Agric. Int. 2019, 40, 1–9. [Google Scholar] [CrossRef]
  25. Jankovský, M.; Messingerová, V.; Ferenčík, M.; Allman, M. Objective and Subjective Assessment of Selected Factors of the Work Environment of Forest Harvesters and Forwarders. J. For. Sci. 2016, 62, 8–16. [Google Scholar] [CrossRef]
  26. Smidt, M.F.; Lynch, S.; Schall, M.; Sesek, R. Speed and whole body vibration in a sample of grapple skidders from the US South. In Proceedings of the 2022 ASABE Annual International Meeting, Houston, TX, USA, 17–20 July 2022; American Society of Agricultural and Biological Engineers: St. Joseph, MI, USA, 2022. [Google Scholar] [CrossRef]
  27. Jack, R.J.; Oliver, M.; Dickey, J.P.; Cation, S.; Hayward, G.; Lee-Shee, N. Six-Degree-of-Freedom Whole-Body Vibration Exposure Levels during Routine Skidder Operations. Ergonomics 2010, 53, 696–715. [Google Scholar] [CrossRef]
  28. Šušnjar, M.; Pandur, Z.; Zečić, Z.; Kopseak, H.; Bačić, M. Skidder Operator Vibration Exposure. In Proceedings of the 8th International Ergonomics Conference, Ergonomics 2020, Advances in Intelligent Systems and Computing, Zagreb, Croatia, 2–5 December 2020. [Google Scholar] [CrossRef]
  29. Pregledovalnik Podatkov o Gozdovih. Available online: https://prostor.zgs.gov.si/pregledovalnik/ (accessed on 11 November 2024).
  30. Ponsse oyj. Available online: https://www.ponsse.com/en/web/guest/products/harvesters/product/-/p/scorpion#/ (accessed on 17 March 2025).
  31. Ecoforst. Available online: https://www.ecoforst.at/t-winch-10-3/ (accessed on 10 February 2025).
  32. Bruel&Kjaer. Available online: https://www.bksv.com/media/doc/bp2106.pdf (accessed on 7 February 2025).
  33. ISO 2631-1:1997; Mechanical Vibration and Shock–Evaluation of Human Exposure to Whole Body Vibration—Part 1: General Requirements. ISO: Geneva, Switzerland, 1997.
  34. ISO 5349-1:2001; Mechanical Vibration—Measurement and Evaluation of Human Exposure to Hand-Transmitted Vibration—Part 1: General Requirements. ISO: Geneva, Switzerland, 2001.
  35. ISO 9612:2009; Acoustics–Determination of Occupational Noise Exposure–Engineering Method. ISO: Geneva, Switzerland, 2009.
  36. Skogforsk. Available online: https://www.skogforsk.se/english/projects/stanford/ (accessed on 15 December 2024).
  37. Björheden, R.; Apel, K.; Shiba, M.; Thompson, M.A. IUFRO Forest Work Study Nomenclature; Swedish University of Agricultural Science, Department of Operational Efficiency: Garpenberg, Sweden, 1995; 16 p. [Google Scholar]
  38. UL, RS. 2010. Available online: https://pisrs.si/pregledPredpisa?id=URED5360 (accessed on 17 February 2025).
  39. European Commission: Directorate-General for Employment. Social Affairs and Inclusion. Non-Binding Guide to Good Practice with a View to Implementation of Directive 2002/44/EC on the Minimum Health and Safety Requirements Regarding the Exposure of Workers to the Risks Arising from Physical Agents (Vibrations); Publications Office: Luxembourg, 2005. [Google Scholar] [CrossRef]
  40. EU 2002: Directive 2002/44/EC of the European Parliament and of the Council of 25 June 2002 on the minimum Health and Safety Requirements Regarding the Exposure of Workers to The Risks Arising from Physical Agents (Vibration). Official Journal of the European Communities, Brussels, Belgium. Available online: https://eur-lex.europa.eu/resource.html?uri=cellar:546a09c0-3ad1-4c07-bcd5-9c3dae6b1668.0004.02/DOC_1&format=PDF%20 (accessed on 17 February 2025).
  41. EU 2003: Directive 2003/10/EC of the European Parliament and of the Council of 6 February 2003 on the Minimum Health and Safety Requirements Regarding the Exposure of Workers to the Risks Arising from Physical Agents (Noise). Official Journal of the European Communities, Brussels, Belgium. Available online: https://eur-lex.europa.eu/legal-content/EN/TXT/PDF/?uri=CELEX:32003L0010 (accessed on 17 February 2025).
  42. Šušnjar, M.; Pandur, Z.; Bačić, M.; Halilović, V.; Nevečerel, H.; Lepoglavec, K.; Kopseak, H. Analysis of Skidder Fuel Consumption by Work Operations During Timber Extraction in Thinning of Even-Aged Forest on Mountainous Terrain: A Case Study. Sustainability 2024, 16, 11240. [Google Scholar] [CrossRef]
  43. Santos, D.W.F.D.N.; Valente, D.S.M.; Fernandes, H.C.; Souza, A.P.D.; Minette, L.J. Influence of pump pressure and engine speed on ergonomic parameters of forwarder operators. Rev. Árvore 2020, 44, e4425. [Google Scholar] [CrossRef]
  44. Tiemessen, I.J.; Hulshof, C.T.J.; Frings-Dresen, M.H.W. An overview of strategies to reduce whole-body vibration exposure on drivers: A systematic review. Int. J. Ind. Ergon. 2007, 37, 245–256. [Google Scholar] [CrossRef]
  45. Rehn, B.; Lundström, R.; Nilsson, L.; Liljelind, I.; Järvholm, B. Variation in Exposure to Whole-Body Vibration for Operators of Forwarder Vehicles—Aspects on Measurement Strategies and Prevention. Int. J. Ind. Ergon. 2005, 35, 831–842. [Google Scholar] [CrossRef]
  46. Obi, O.F.; Visser, R. Including Exogenous Factors in the Evaluation of Harvesting Crew technical efficiency using a multi-step data envelopment analysis procedure. Croat. J. For. Eng. 2018, 39, 153–162. [Google Scholar]
  47. Camargo, D.; Munis, R.; Batistela, G.; Simões, D. Exposure to Occupational Noise: Machine Operators of Full Tree System in Brazil. Croat. J. For. Eng. 2022, 43, 397–402. [Google Scholar] [CrossRef]
  48. Poje, A.; Potočnik, I.; Danilović, M.; Antonić, S. A Case Study of the Impact of Skidding Distance on Tractor Operator Exposure to Noise. Balt. For. 2016, 22, 357–364. [Google Scholar]
  49. McNeel, J.F.; Rutherford, D. Modelling Harvester-Forwarder System Performance in a Selection Harvest. J. For. Eng. 1994, 6, 7–14. [Google Scholar] [CrossRef]
  50. Javůrek, P.; Dvořák, J. Evaluation of Total Time Consumption in Harvester Technology Deployment in Conditions of the Forest Sector of the Czech Republic. J. For. Sci. 2018, 64, 33–42. [Google Scholar] [CrossRef]
  51. Väyrynen, S. Occupational accidents in the maintenance of heavy forest machinery. J. Occup. Accid. 1982, 4, 175. [Google Scholar] [CrossRef]
  52. Holzfeind, T.; Stampfer, K.; Holzleitner, F. Productivity, Setup Time and Costs of a Winch-Assisted Forwarder. J. For. Res. 2018, 23, 196–203. [Google Scholar] [CrossRef]
  53. Dvorak, J.; Gluschkov, S.; Markoff, I. Performance of the small tracked harvesters in spruce stands. For. Sci. 2007, 77, 85. [Google Scholar]
  54. Sláma, D.; Mergl, V.; Pavlíková, E.A. Analysis of the Heart Rate of Operators of Forwarding Machines during Work Activities. Forests 2023, 14, 1348. [Google Scholar] [CrossRef]
  55. Olivera, F.A.; Visser, R. Using the harvester on-board computer capability to move towards precision forestry. N. Z. J. For. 2016, 60, 3–7. [Google Scholar] [CrossRef]
  56. Gerasimov, Y.; Sokolov, A. Ergonomic characterization of harvesting work in Karelia. Croat. J. For. Eng. 2009, 30, 159–170. [Google Scholar]
  57. Staněk, L.; Mergl, V. Whole Body Vibrations during Fully Mechanised Logging. Forests 2022, 13, 630. [Google Scholar] [CrossRef]
  58. Sherwin, L.M.; Owende, P.M.O.; Kanali, C.L.; Lyons, J.; Ward, S.M. Influence of Forest Machine Function on Operator Exposure to Whole-Body Vibration in a Cut-to-Length Timber Harvester. Ergonomics 2004, 47, 1145–1159. [Google Scholar] [CrossRef]
  59. Poršinsky, T.; Bumber, Z.; Pandur, Z.; Đuka, A.; Ursić, B.; Lovrinčević, M. Dimensional and mass characteristics of forwarders. Šumarski List (Online) 2022, 146, 387–401. [Google Scholar] [CrossRef]
  60. Butkus, R.; Vasiliauskas, G.; Zinkevicius, R. Operator Whole-Body Vibration Exposure of Wheeled Forwarder with Bogie Tracks. In Proceedings of the 19th International Scientific Conference Engineering for Rural Development, Jelgava, Latvia, 20 May 2020; Available online: https://www.iitf.lbtu.lv/conference/proceedings2020/Papers/TF407.pdf (accessed on 25 January 2025).
  61. Martins, A.B.; Lopes, E.d.S.; Fiedler, N.C.; Oliveira, F.M.d.; Pagnussat, M.B. The Whole-Body Vibration in Operation of Wheeled and Tracked Harvester IN PINUS Thinning. Int. J. Ind. Ergon. 2020, 80, 103006. [Google Scholar] [CrossRef]
  62. Kim, J.H.; Dennerlein, J.T.; Johnson, P.W. The Effect of a Multi-Axis Suspension on Whole Body Vibration Exposures and Physical Stress in the Neck and Low Back in Agricultural Tractor Applications. Appl. Ergon. 2018, 68, 80–89. [Google Scholar] [CrossRef]
  63. Goglia, V.; Gospodarić, Z.; Košutić, S.; Filipović, D. Hand-Transmitted Vibration from the Steering Wheel to Drivers of a Small Four-Wheel Drive Tractor. Appl. Ergon. 2003, 34, 45–49. [Google Scholar] [CrossRef]
  64. Bačić, M.; Landekić, M.; Šušnjar, M.; Šporčić, M.; Pandur, Z. Vibration Levels and Daily Vibration Exposure While Using Different Tools in a Forest Cleaning. Cent. Eur. For. J. 2023, 69, 49–58. [Google Scholar] [CrossRef]
  65. Xu, X.S.; Dong, R.G.; Welcome, D.E.; Warren, C.; McDowell, T.W.; Wu, J.Z. Vibrations Transmitted from Human Hands to Upper Arm, Shoulder, Back, Neck, and Head. Int. J. Ind. Ergon. 2017, 62, 1–12. [Google Scholar] [CrossRef] [PubMed]
  66. Gellerstedt, S. Operation of the Single-Grip Harvester: Motor-Sensory and Cognitive Work. Int. J. For. Eng. 2002, 13, 35–47. [Google Scholar] [CrossRef]
  67. Paini, A.; Da, E.; Lopes, E.; Souza, A.; Oliveira, F.; Rodrigues, C.; Paini, A. Repetitive motion and postural analysis of machine operators in mechanized wood harvesting operations. Cerne 2019, 25, 214–220. [Google Scholar] [CrossRef]
  68. Messingerová, V.; Martinusová, L.; Slaník, M. Ergonomic Parameters of the Work of Integrated Technologies at Timber Harvesting. Croat. J. For. Eng. 2005, 26, 79–84. [Google Scholar]
  69. Poje, A.; Potočnik, I.; Marenče, J. Impact of woodcutters ax and felling wedge to vibration exposure. Proceedings of conference paper 7. In Proceedings of the Međunarodno Savjetovanje Šumarsko Inženjerstvo Jugoistočne Europe-Stanje i Izazovi, Zalesina, Croatia, 14–16 September 2022. [Google Scholar]
  70. Arpinar-Avsar, P.; Park, J.; Zatsiorsky, V.M.; Latash, M.L. Effects of Muscle Vibration on Multi-Finger Interaction and Coordination. Exp. Brain Res. 2013, 229, 103–111. [Google Scholar] [CrossRef]
  71. Visser, R.; Berkett, H. Effect of Terrain Steepness on Machine Slope When Harvesting. Int. J. For. Eng. 2015, 26, 1–9. [Google Scholar] [CrossRef]
  72. NZDOL. Approved Code of Practice for Safety and Health in Forest Operations; Department of Labour: Wellington, New Zealand, 1999; 135 p., ISBN 0-4777-03622-8. [Google Scholar]
  73. Visser, R.; Stampfer, K. Expanding Ground-based Harvesting onto Steep Terrain: A Review. Croat. J. For. Eng. 2015, 36, 321–331. [Google Scholar]
  74. FISC-Safetree. Available online: https://www.datocms-assets.com/97172/1686788458-winch-assisted-harvesting-bpg-chapt-3-winches.pdf (accessed on 5 February 2025).
  75. Ackerman, S.; Bekker, J.; Astrup, R.; Talbot, B. Understanding the Influence of Tree Size Distribution on the CTL Harvesting Productivity of Two Different Size Harvesting Machines. Eur. J. For. Res. 2024, 143, 1199–1211. [Google Scholar] [CrossRef]
  76. Mederski, P.S.; Schweier, J.; Đuka, A.; Tsioras, P.; Bont, L.G.; Bembenek, M. Mechanised Harvesting of Broadleaved Tree Species in Europe. Curr. For. Rep. 2022, 8, 1–19. [Google Scholar] [CrossRef]
  77. Olivera, A.; Visser, R.; Acuna, M.; Morgenroth, J. Automatic GNSS-Enabled Harvester Data Collection as a Tool to Evaluate Factors Affecting Harvester Productivity in a Eucalyptus spp. Harvest. Oper. Uruguay. Int. J. For. Eng. 2016, 27, 15–28. [Google Scholar] [CrossRef]
Figure 1. Ponsse Scorpion King Harvester tethered to the Ecoforst T-winch 10.3.
Forests 16 00741 g001
Figure 2. Numbered harvesting trails harvested with winch assistance (blue) and without winch assistance (red), skid (white blue), and road (green) system.
Forests 16 00741 g002
Figure 3. Seat pad with accelerometer on the seat surface (a), on the control lever (the white arrow marks the location of accelerometer) (b), and on the floor (seat base) (c).
Forests 16 00741 g003
Figure 4. Work elements in the study.
Forests 16 00741 g004
Figure 5. Calculation diagram with equations used.
Forests 16 00741 g005
Figure 6. Proportion of exposure time according to time elements during working time (a) and productive time (b).
Forests 16 00741 g006
Figure 7. Proportion of exposure time inside and outside the cabin during delays.
Forests 16 00741 g007
Figure 8. Exposure time of work operations for each working day.
Forests 16 00741 g008
Figure 9. Daily A(8) and workplace time exposure to WBV on the seat (a) and floor (b), to HAV on the control lever (c) and to LAeq (d) and LCpeak (e) noise.
Forests 16 00741 g009aForests 16 00741 g009b
Table 1. Worksite characteristics by days and harvesting trails.
DayHarvesting TrailHarvesting
System
Number of Trees (n)Volume (m3)Trail Distance (m)Trail Slope (%)Skid Road Distance (m)Forest Road Distance (m)
11TW9135.212045017
2TW8537.312550014
3TW6728.41264509
4TW5726.615740018
5NTW4221.813635055
Total 342149.3133430113
26NTW5726.513530050
7NTW8441.011532043
8NTW10143.21063508
9NTW7835.69235022
10NTW63.010350164
Total 326149.392330287
310NTW6039.390350150
11TW602948040015
12TW4724.913945020
13TW6623.988450202
Total 23393.6103420387
414TW3511.477450425
17NTW7238.9144452030
18NTW3619.213740160
19NTW2513.632351910
20NTW6823.914315220
21NTW8532.71101586830
Total 321130.9103321117485
513TW118.048450239
14TW4620.513245623259
15TW6329.014450610265
16TW10065.01335062065
Total 220155.2113481853828
1–5Total 1442678.3109402971.82107
TW—winch-assisted harvesting; NTW—harvesting without winch assistance.
Table 2. Equations used for analysis, with variable explanations.
Nr. of EquationEquationVariables
Equation (1) R M S x , y , z , V T V = R M S i 2 × t i t i
  • RMSx,y,z,VTV—exposure to WB (RMSx, RMSy, RMSz) and HA (RMSVTV) vibration during work operation, days or trees (m/s2);
  • RMSi—exposure to WB (RMSxi, RMSyi, RMSzi) and HA (RMSVTVi) vibration in 1-s interval (m/s2);
  • ti—duration of work operation;
  • LAeq—noise exposure during work operation, days or trees (dB(A));
  • LAeqi—noise value during individual work operation in 1-s interval (dB(A));
  • LCpeak—exposure to max peak value during work operation, days or trees (dB(C));
  • LCpeaki—max value of Lcpeak in 1 s interval (dB(C));
  • AVGRMS,LAeq,LCpeak- average exposure to RMS, LAeq, and LCpeak;
  • ni—number of observations (=trees);
  • A(8)RMSy, RMSVTV, LAeq, Lcpeak- daily exposure in 8 h long period of work time;
  • wi—level of noise or vibration exposure during measured workplace time.
Equation (2) L A e q = 10 × l o g ( 10 0.1 × L A e q i × t i t i )
Equation (3) L C p e a k = max ( L C p e a k i )
Equation (4) A V G R M S ,   L A e q ,   L C p e a k = R M S i ; L A e q i ; L C p e a k i n i
Equation (5) A 8 R M S y = R M S y w i × 1.4 × T w i 480   min
Equation (6) A 8 R M S V T V = R M S V T V w i × T w i 480   min
Equation (7) A 8 L A e q = L A e q w i × log T w i 480   min
Equation (8) A 8 L C p e a k = L C p e a k w i
Table 3. Operator exposure to vibration and noise per work element.
Work ElementRT (min)
(Inside Cabin/Total)
WBV Seat
(Inside the Cabin/Total) 1
WBV floorHAV Control LeverNoise
(Inside the Cabin/Total) 1
RMS X (m/s2)RMS Y (m/s2)RMS Z (m/s2)RMS X (m/s2)RMS Y (m/s2)RMS Z (m/s2)VTV (m/s2)LaeqLCpeak
Productive timeSupport. work timeDriving on forest road63.20.700.770.690.490.690.832.1470.5135.4
Driving on skid road51.80.730.870.660.630.840.842.0869.0114.0
Total support. time115.00.710.810.680.540.750.832.1269.8135.4
Main productive timeMoving tops and branches160.20.430.560.270.370.480.311.4367.1114.6
Felling and processing837.70.380.520.220.410.500.341.4367.6134.2
Moving logs15.00.400.490.220.320.410.231.2766.8106.0
Driving between trees249.80.510.600.480.380.490.391.3868.0134.4
Total main productive time 1262.70.420.540.300.400.490.351.4267.6134.4
Total productive time1377.70.450.570.350.410.520.411.4967.9135.4
Unproductive timeMachine delays11.2/ 10.23/0.25/0.21/0.15/0.21/0.14/0.78/72.8/135.8/
293.80.040.050.040.030.040.030.1584.8144.7/
Personal delays9.3/0.20/0.20/0.25/0.12/0.15/0.11/0.71/70.5/133.8/
26.90.100.100.130.060.080.060.3678.6143.6
Work-related delays66.6/0.23/0.26/0.21/0.17/0.21/0.17/0.65/72.3/136.0/
135.40.150.170.130.110.140.110.4278.2144.5
Total unproductive time87.1/0.23/0.26/0.21/0.16/0.21/0.16/0.68/72.2/135.8/
456.10.090.100.080.060.080.060.2683.5144.7
Workplace time18340.390.490.300.360.450.361.3077.8144.7
1 Values for LAeq and LCpeak are separated into inside the cabin/total (inside and outside); RT—recording time; WBV seat/floor—whole-body vibrations measured on the seat/floor; HAV control lever—hand–arm vibrations measured on the right control lever.
Table 4. Operator exposure to vibration and noise per day and work element.
Work ElementWBV Seat—RMS Y (m/s2)WBV Floor—RMS Y (m/s2)HAV Control Lever—RMS VTV (m/s2)Noise—LAeq (dB(A))Noise—LCpeak (dB(C))
1234512345123451234512345
Productive timeSupp. Work timeDriving on forest road0.720.620.820.850.830.610.530.710.700.811.971.752.142.002.4574.069.369.769.670.1144.2132.8133.4109.4130.5
Driving on skid road 0.50 1.230.86 0.45 0.900.85 0.97 2.952.06 66.9 68.869.2 103.3 114.0112.0
Total supp. time0.720.600.820.960.850.610.520.710.760.831.971.662.142.292.2274.069.069.768.969.6144.2132.8133.4114.0130.5
Main productive timeMoving tree tops and branches0.620.520.540.530.540.510.440.430.490.491.621.341.311.381.3867.667.466.766.567.2112.6114.5114.6110.4108.6
Felling and processing0.570.490.510.500.520.470.410.420.470.711.581.321.361.371.4568.067.667.667.267.7122.5115.1132.8134.2111.0
Moving logs0.600.500.480.460.380.490.410.400.410.371.641.201.011.291.1567.667.366.266.265.7104.8106.0104.3100.2100.7
Driving between trees0.680.560.580.590.520.540.450.460.510.481.591.221.421.311.2368.367.868.966.768.2120.0122.3134.4109.8131.7
Total main productive time0.600.510.540.520.520.490.420.430.480.651.581.301.371.361.4068.067.667.867.067.7122.5122.3134.4134.2131.7
Total prod. time0.600.510.550.540.600.500.430.450.490.691.601.311.421.401.6168.567.768.067.368.2144.2132.8134.4134.2131.7
Unproductive timeMachine delays0.060.020.030.070.050.050.010.030.060.040.190.080.080.220.1785.788.484.182.282.7144.3135.9141.0142.7144.7
Personal delays0.250.090.040.18 0.210.060.030.13 0.960.300.150.500.0071.575.480.079.680.4109.7142.6121.7143.6143.3
Work-related delays0.180.190.120.180.180.150.150.090.150.140.440.450.280.440.4881.575.477.774.278.8144.2141.7134.3143.4143.8
Total unproductive time0.110.120.060.120.090.100.100.050.100.080.310.300.150.330.2884.885.783.180.082.0144.3142.6141.0143.6144.7
Total (min)379373406384292379373406384292379373406384292379373406384292379373406384292
Work time (m/s2)0.550.470.410.500.430.450.390.330.460.501.451.201.041.311.1679.679.282.974.269.5144.3142.6141143.6144.7
WBV seat/floor—whole-body vibrations measured on the seat/floor; HAV control lever—hand–arm vibrations measured on the right control lever.
Table 5. Operator exposure to vibration and noise exposure for harvesting systems and work elements of main productive time.
Har. SystemWork ElementWBV Seat WBV FloorHAV Control LeverNoise
SS
(n)
RMS X (m/s2)RMS Y (m/s2)RMS Z (m/s2)RMS X (m/s2)RMS Y
(m/s2)
RMS Z
(m/s2)
VTV
(m/s2)
SS
(n)
LAeqLCpeak
SumAvgSdAvgSdAvgSdAvgSdAvgSdAvgSdAvgSdSumAvgSdAvgSd
TWMoving tree tops and branches2050.430.120.570.170.260.100.360.120.470.150.290.141.370.5122867.11.699.74.6
Felling and processing5820.370.080.520.120.210.060.340.290.460.270.250.291.410.4264467.61.5100.44.2
Moving logs140.410.130.490.130.230.070.330.100.430.100.240.101.370.421466.61.798.63.6
Driving between trees2250.430.120.540.150.280.110.350.090.460.120.300.121.290.4524767.31.798.44.9
Total5830.380.080.530.110.230.060.350.280.470.250.270.281.410.3864467.51.599.814.5
NTWMoving tree tops and branches1880.410.110.530.150.250.080.360.150.460.160.290.171.280.4425866.71.799.84.2
Felling and processing5940.370.080.490.110.190.060.310.160.420.140.220.141.330.3679067.11.6100.53.7
Moving logs300.390.130.480.120.210.160.310.090.410.100.230.091.170.353466.61.698.62.8
Driving between trees2300.420.120.520.150.260.100.360.120.450.150.290.161.220.3928866.61.798.03.5
Total6090.370.090.490.120.200.060.320.140.420.140.230.131.300.3679767.11.699.793.9
TW-NTWMoving tree tops and branches 0.020.010.04 *0.020.010.020.00−0.030.01−0.010.00−0.030.090.07 0.4 *−29−0.10.4
Felling and processing 0.000.000.03 *0.010.02 *0.000.03 *0.130.04 *0.130.03 *0.150.08 *0.06 0.5 *−148−0.10.5
Moving logs 0.020.000.010.010.02−0.090.020.010.020.000.010.010.200.07 0.00−200.00.8
Driving between trees 0.010.000.020.000.020.01−0.01−0.030.01−0.030.01−0.040.070.06 0.7 *−430.41.4
Total 0.01−0.020.04−0.010.030.000.030.140.050.110.040.150.110.02 0.47−0.10.020.6
Values in bold with * mean that there are sig. differences between harvesting systems and work operation; Mann–Whitney and Welch’s tests were used to check significance of difference; SS sample size (=number of trees); RT means recording time; WBV seat/floor—whole-body vibrations measured on the seat/floor; HAV control lever—hand–arm vibrations measured on the right control lever.
Table 6. p-values of ANCOVA analysis between DBH, tree species, and harvesting system on WBV, HAV, and noise exposure during main productive time.
All harvesting trails FactorCategoryWBV seatWBV
seat
WBV
seat
WBV
floor
WBV
floor
WBV
floor
HAV control leverNoise
X-axisY-axisZ-axisX-axisY-axisZ-axis LAeqLCpeak
p-valuesW 0.83<0.001 *<0.001 *0.05 *0.002 *0.029 *<0.001 *<0.001 *0.522
TS 0.018 *0.018 *<0.001 *0.5730.2080.3190.008 *0.035 *0.008 *
DBH <0.001 *<0.001 *<0.001 *0.017 *0.003 *0.009 *<0.001 *0.703<0.001 *
W*TS 0.0020.5770.1260.5980.7710.7110.3080.2860.705
Marginal meansWNTW0.3830.5000.2060.3220.4300.2411.32967.139101.27
TW0.3820.5350.2350.3520.4730.2741.42367.524101.42
TSCON0.3750.5070.2110.3320.4420.2491.34167.231101.03
DEC0.3900.5270.2310.3410.4610.2651.41167.432101.67
Harvesting trails:
1, 4, 17, 18
p-valuesW 0.007 *<0.001 *0.002 *0.065<0.001 *0.005 *<0.001 *<0.001 *0.105
TS 0.003 *0.028 *0.026 *0.2230.006 *0.012 *0.046 *0.0660.307
DBH 0.0510.023 *0.014 *0.2530.029 *0.017 *0.003 *0.668<0.001 *
W*TS 0.1010.4230.7310.4690.9440.5620.3150.030.058
Marginal meansWNTW0.3560.4630.1940.2990.3900.2191.23865.935101.31
TW0.3980.5660.2260.3340.4840.2531.49067.325100.24
TSCON0.3530.490.1980.3040.4130.2201.29466.351100.42
DEC0.4010.5390.2220.3280.4610.2521.43366.909101.12
Values in bold with * mean that there are sig. differences; W—harvesting system, TS—tree species, DBH—diameter at breast height, W*TS—interaction between harvesting system and tree species, TW—winch-assisted harvesting system, NTW—conventional harvesting system, CON—coniferous, DEC—deciduous.
Disclaimer/Publisher’s Note: The statements, opinions and data contained in all publications are solely those of the individual author(s) and contributor(s) and not of MDPI and/or the editor(s). MDPI and/or the editor(s) disclaim responsibility for any injury to people or property resulting from any ideas, methods, instructions or products referred to in the content.

