Abstract
Many ecosystems have been altered since European colonization, resulting in the loss of historical ecosystems along with information about historical ecosystems. Tree density estimation from historical land surveys with alignment to expert classifications of historical vegetation strengthen reconstructions of vegetation history through research triangulation. For the midwestern United States, we extended historical tree density estimates (≥12.7 cm in diameter) to contextualize expert classifications of vegetation types in Illinois and Minnesota, part of the historical Great Plains grasslands with very frequent fire exposure, and Indiana and southern Michigan, which were more protected from fire. We also identified a tree density threshold between grasslands and savannas and contrasted density estimates with two alternate density estimates. After refining expert-classified vegetation types, out of 14 major historical ecosystems in this region, 11 were grasslands, savannas, or woodlands. The three additional ecosystems were American beech (Fagus grandifolia) closed woodlands and forests in Indiana and American beech-oak (Quercus) closed woodlands and forests and tamarack (Larix laricina) and ash (Fraxinus) swamp forests in southern Michigan. Because tree densities in the grasslands of Illinois and Minnesota did not exceed 4 trees/ha and tree densities in the savannas of Indiana, Michigan, and Minnesota ranged from 23 trees/ha to 78 trees/ha, around 15 trees/ha may be a reasonable threshold between grasslands and savannas. Density estimates generally matched with two other sources of density estimates, despite using different approaches, supporting the reliability of density estimation. Anchoring density estimates from land surveys to other sources of historical vegetation establishes the validity of density estimation, while supplementing expert-classified ecosystems.
1. Introduction
After land use and disturbance changes resulting from European colonization, historical ecosystems remain poorly described, requiring reconstructions from proxy data sources. Land surveys conducted predominantly during the 1800s in the United States permit an understanding of the range of historical ecosystems and inferences about their disturbances. Historically, fire was the disturbance that influenced many ecosystems, creating ecosystems with shared characteristics in response to disturbance frequency and severity, including fire-tolerant species and reduced tree densities [1,2]. As opposed to dense forests, open ecosystems of grasslands, savannas, open woodlands, and closed woodlands typically dominated by fire-tolerant oak or pine tree species were abundant throughout the U.S. [1]. Following fire exclusion and other land uses, the range of ecosystems has been lost to agricultural conversion and tree densification to closed forests [1]. Contemporaneous writers recorded rapid encroachment by trees following Euro-American settlement [3,4,5,6].
The historical ecological context of Illinois, Indiana, southern Michigan, and western Minnesota in the midwestern U.S. is generally well defined for interpretation, supported by various historical accounts, despite conversion to agriculture during the 1800s (Figure 1; [7,8,9,10,11,12,13]). The region encompasses part of the eastern Great Plains grasslands of central North America and the transition to the Prairie Peninsula extension into the forests of the eastern U.S., albeit most of the grasslands in these states either were converted to croplands or transitioned to forests during the second half of the 1800s [13]. Strong westerly winds combined with flat topography and plentiful herbaceous vegetation of tallgrass prairie in the productive eastern Great Plains were the ingredients for frequent surface fires, which traveled eastward until meeting conditions that decreased fire spread in the eastern U.S. [8,14]. Topographic and permanent water barriers broke up fire spread except for a funnel projecting through Illinois, after which additional large and small firebreak barriers of rough topography and water limited fire spread. Topographic roughness (‘the Driftless Area’), the Wisconsin River, and various lakes contained most fire spread to southern Wisconsin, whereas the Wabash River and topographic barriers directed fire to the northern third of Indiana [14]. Fewer fires entered southern Michigan, and the Great Black Swamp blocked most of northern Ohio, resulting in the development of greater tree densities, although open ecosystems occurred in southern Michigan and northern Ohio [11]. Furthermore, wind speeds diminished in the Prairie Peninsula, consequently spreading less fire relative to wind speed in the Great Plains region [14].

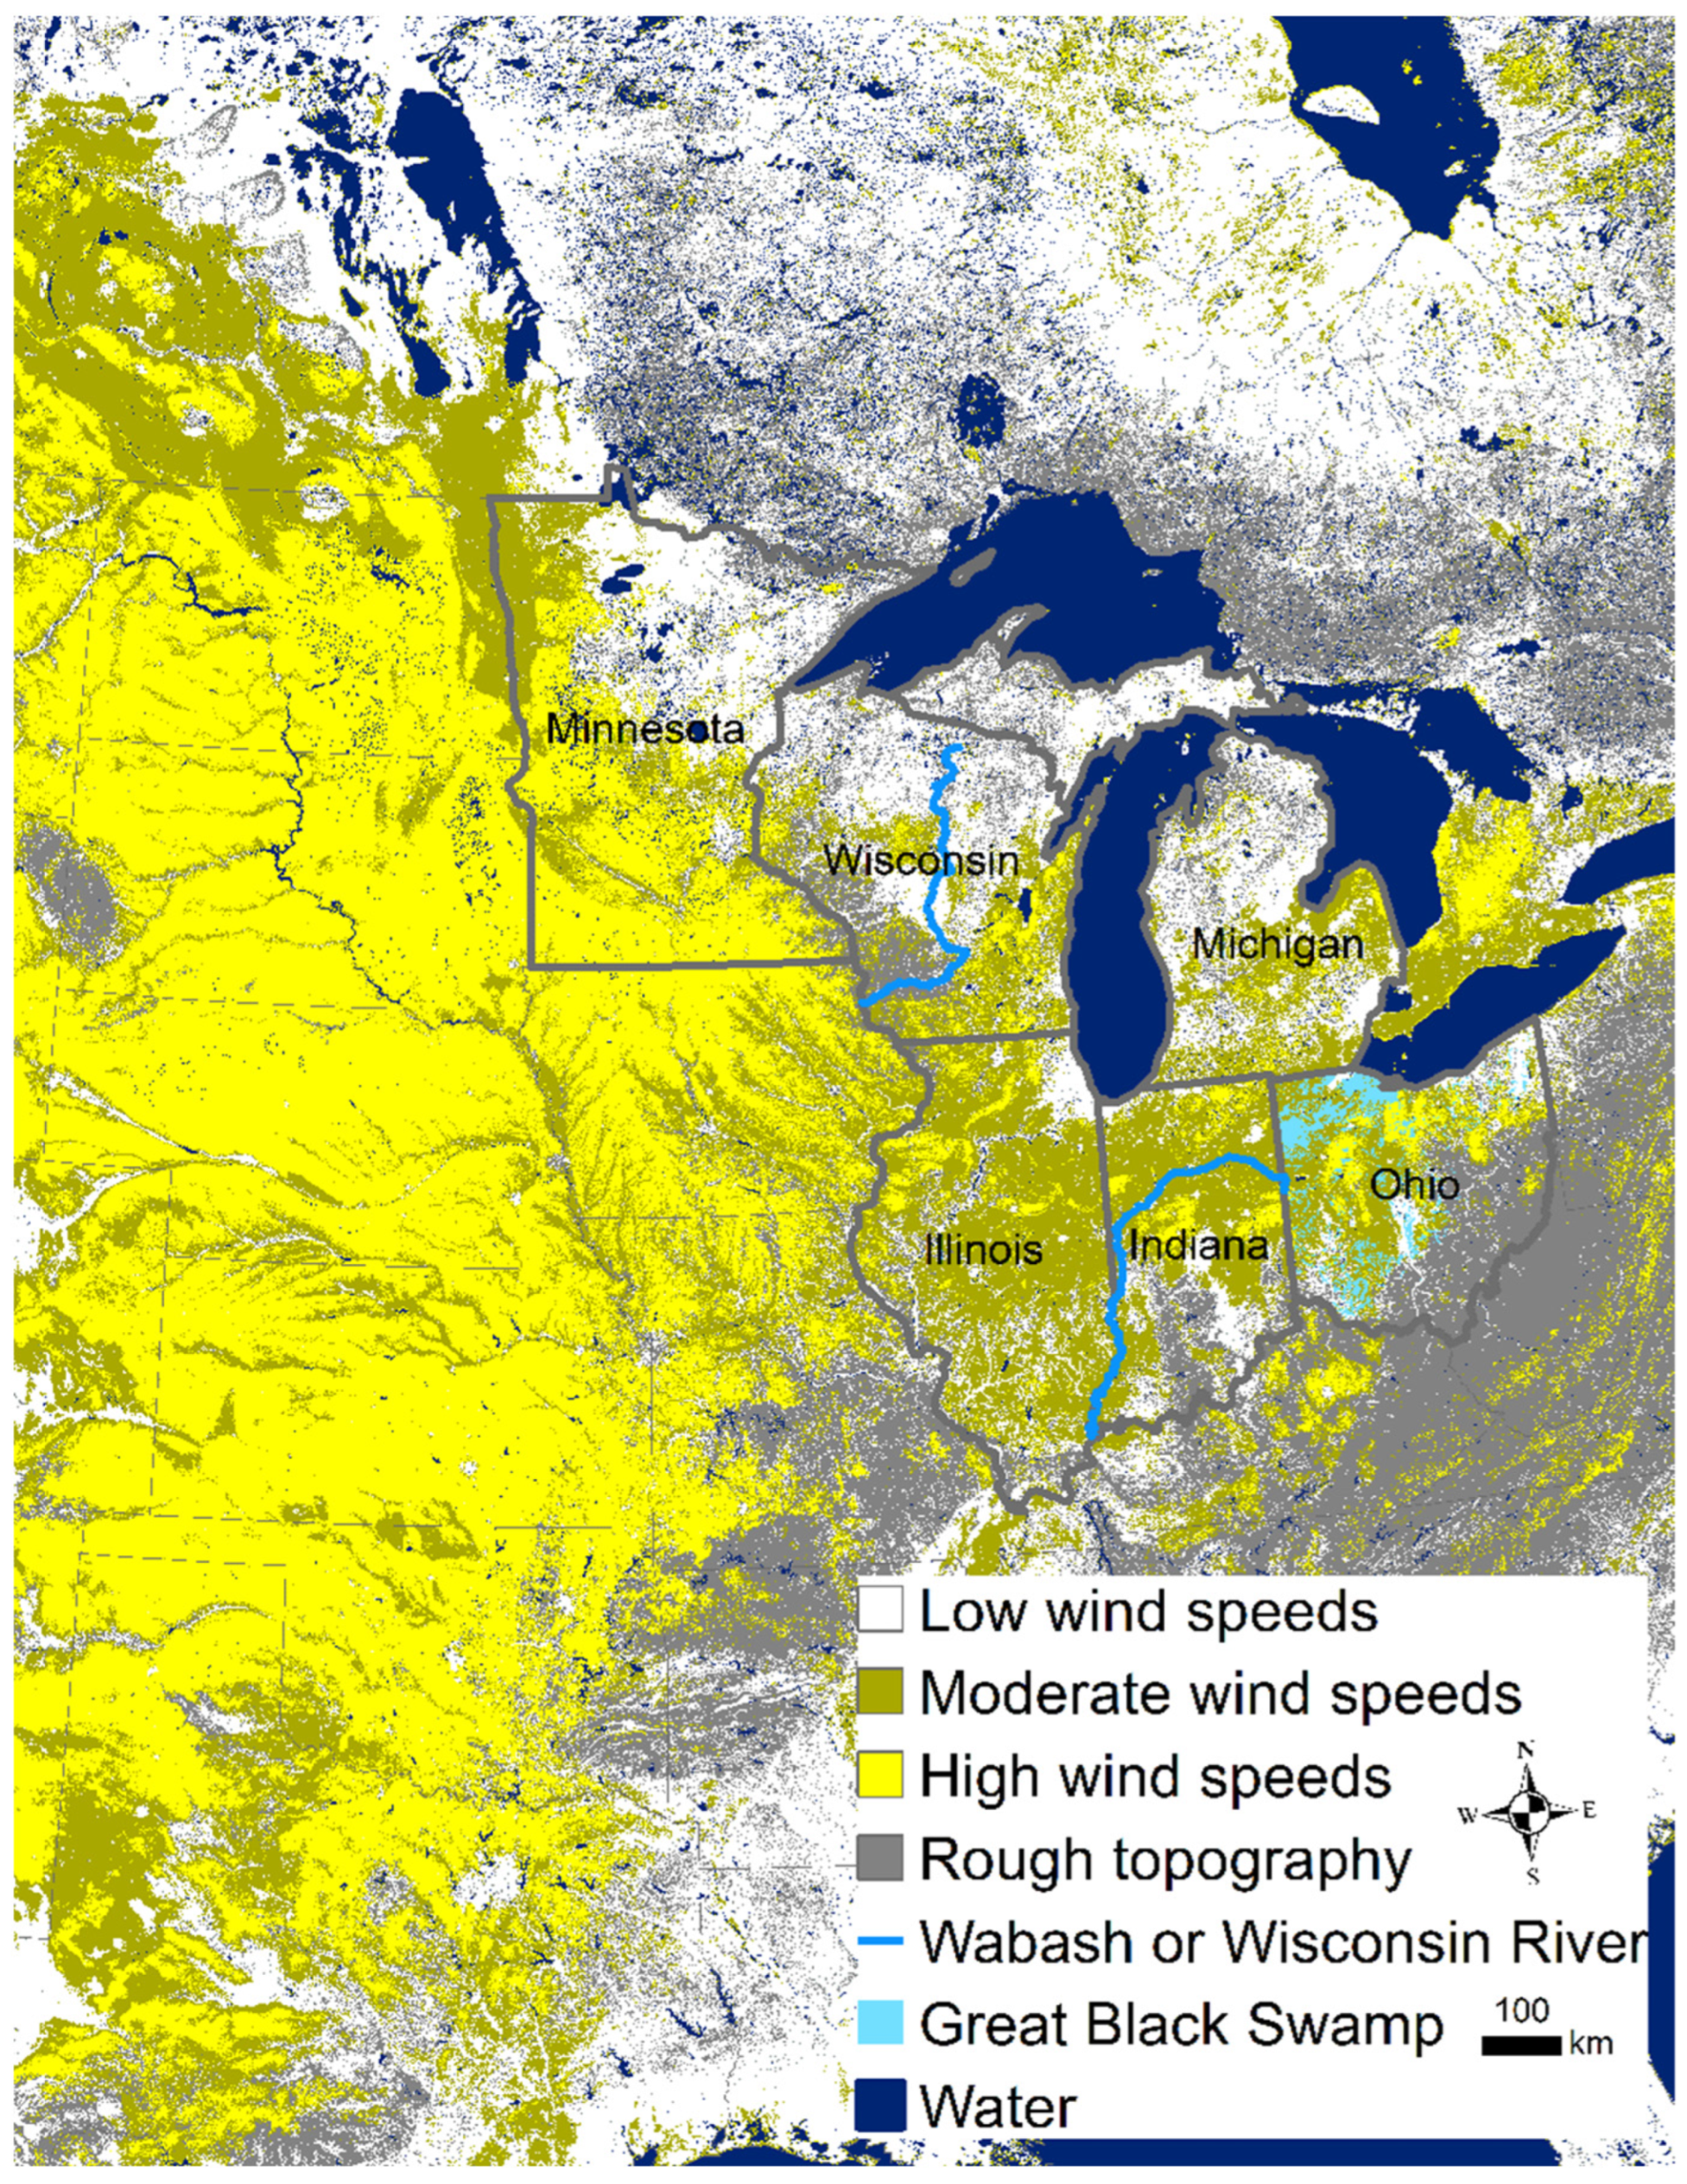
Figure 1.
Ecological context for the study region of the midwestern United States at the transition of the Great Plains to the forests of eastern North America (Minnesota, Illinois, Indiana, and Michigan outlined). Fire spread by high wind speeds with flat topography resulted in reduced tree densities, and fire spread broken by rougher topographies and aquatic ecosystems, with diminished wind speeds, protected tree establishment.
Indigenous peoples set fires annually, particularly during the fall, in the Prairie Peninsula or in the projection of grasslands from the Great Plains into the eastern U.S. [6,11,15]. Skilled practitioners could manage ecosystems with fire under less than ideal conditions. That is, frequent surface fires still can occur in rougher, wetter, and colder conditions with less wind, given ignition assistance during seasonally appropriate time intervals when vegetation is dry. Muir ([16], p. 53) wrote about oak openings of Wisconsin that were: ‘swept by running fires almost every autumn after the grass became dry. If from any cause, such as early snowstorms or late rains, they happened to escape the autumn fire besom, they were likely to be burned in the spring after the snow melted’. Moreover, large native herbivores, including white-tailed deer (Odocoileus virginianus) and American bison (Bison bison), stabilized open conditions, with interactions among fire, fire management by native humans, and native large herbivores [17].
Plotless density estimators enable tree density estimations from historical land surveys conducted during the 1800s, which consisted of survey points for two to four trees every 0.8 km. The General Land Office, which originated during the year 1812, coordinated land surveys in the systematic Public Land Survey System of townships and ranges, comprising 1.6 km square sections, throughout most states [18]. Surveyors recorded the species, diameter, distance, and bearing of two to four trees in quadrants at the corners and middle of each section line. The Morisita estimator has been demonstrated to be robust in multiple different simulated approaches, with the greatest stability in estimating densities from points with two trees, but its stipulations include the requirement of large sample sizes (i.e., landscapes estimates not local estimates) and overestimation depending on the tree configuration of tree number and clustered spatial patterns [19,20,21,22,23,24,25]. Overestimated densities can be reduced by adjustment factors calculated from simulations, and potential clustered tree patterns can be accounted for with an adjustment factor included in a range of estimates. By contrast, surveyor bias may produce greater uncertainty because decision making is difficult to simulate. Surveyors did not always select the nearest trees due to survey instructions or personal preferences [21,22,25]. Recording trees that are more distant than the nearest trees will result in underestimated tree densities. Adjustment factors can address deviations from randomness but, to date, each potential bias is partitioned as a separate surveyor choice. However, selected trees likely contain overlapping biases instead of subdivided biases. As more corrections are applied, the probability of overcorrecting increases, because surveyor bias corrections are not likely to be independent. Two sets of similar density estimates, based on different approaches, have been produced for this region [24,25].
Uncertainty can be reduced by aligning density estimates with other sources of information, namely vegetation reconstructions by experts, historical accounts, and ecological context. Experts have reconstructed vegetation classes based on historical land surveys in this region [26,27,28,29], although the vegetation classes have yet to be quantified using historical land surveys. For example, Hanberry et al. [30] quantified density and percent stocking (i.e., growing space occupied based on density, diameter, and species) in historical land surveys by ecosystem classes (e.g., savannas up to 100 trees/ha, open woodlands of 100 trees/ha to 175 trees/ha, and closed woodlands to 250 trees/ha, with forests at >250 trees/ha) assigned by an expert for historical ecosystems in the Ozark Mountains ecosystem of Missouri. The density estimates and ecosystem classes matched stocking levels based on an oak stocking guide [31]. Although different tree species vary in filling the growing space, with greater crown spread in broadleaf species than needled species, the same quantified classes generally can be applied to density estimates from historical land surveys throughout the U.S., including a range of ecosystems in the primarily forested midwestern U.S. [32]. Conceptually, ecosystem classes will fall within a continuous range of metrics, such as tree density or percent stocking, which also connects the classes described by wildlife management with quantities of forest management [31]. That is, restoration targets of ecosystems for wildlife can be quantified silviculturally.
Due to the abundance of data sources, the midwestern U.S. region is amenable to an integrated assessment encompassing the validity of tree density estimates from historical land surveys, the reliability of tree density estimates from historical land surveys, and enhanced contextualization of vegetation reconstructions by experts. While definitions vary, validity is defined here as the extent to which strictly quantitative measurements (i.e., historical tree density estimates) correspond with a meaningful and useful real ecosystem context (i.e., vegetation types assigned through reconstructions by expert opinion; [33,34,35]). Similarly, reliability is defined here as the consistency of measurements [35], despite different approaches for estimating historical tree density estimates with surveyor bias [20,21,24,25]. The intent of error estimation is to quantify the difference between estimated values and actual values to inform about the accuracy of the estimation [33]. By comparing historical tree density estimates, both to expert-defined vegetation classes and to historical tree density estimates by other approaches, validity and reliability can be established. Equally in return, historical tree density estimates, with associated tree species composition, can enrich and refine expert-designated vegetation types. While two sets of published historical tree density estimates are available for the region [25,36], tree density estimates can be integrated into expert vegetation types to supply a sub-regional ecological context, which is particularly useful for restoration and management of a gradient of ecosystem density classes. Integrating quantitative data-driven approaches with expert classification methods is known as research triangulation, or mixed methods research, to achieve validity, credibility, complexity, and synergy [34,37,38]. Because objective reality is realized through approximate representations, research findings are corroborated through convergence of a variety of quantitative and qualitative methods, with different strengths and weaknesses [37,39].
Overall, for the midwestern United States, with historical exposure to frequent fires, our objective was to augment expert-designated vegetation types with historical tree density estimates and tree species composition, including refinement based on grouping and splitting of vegetation types based on similar or dissimilar densities or composition, to deliver greater contextualization of historical ecosystems. Additionally, we compared historical tree density estimates to the real context of ecosystems to inform accuracy [33]. Components of the overall objectives were to (1) extend the ecological validity of tree density estimates (≥12.7 cm diameter) to the relatively open ecosystems of Illinois, Indiana, southern Michigan, and western Minnesota of the midwestern U.S. by estimating density in expert-defined vegetation classes and matching densities and classes (savannas up to 100 trees/ha, open woodlands of 100 trees/ha to 175 trees/ha, and closed woodlands to 250 trees/ha, with forests at >250 trees/ha [30]); (2) modify vegetation classes as indicated by historical tree density estimates and tree species composition; (3) define tree densities for grasslands relative to savannas; and (4) compare the reliability of our tree density estimates to other tree density estimates based on the Morisita plotless density estimator with differing adjustments (but which have not been aligned with ecological classes; [24,25,36]). According to the body of evidence, we expected that the historical study extent was composed of grasslands, savannas, open woodlands, and closed woodlands with low tree densities (<250 trees/ha), numerous openings within treed landscapes, and dominance by fire-tolerant oak species (>30% of all trees). Currently, this region is 60% cultivated crops, 7% pastures, and 11% developed into residential infrastructure, with only 0.8% of the extent classified as herbaceous vegetation [40]. Tree densification overall occurred in this region during the second half of the 1800s in the decades following agricultural conversion that excluded fire [13], but some locations may have densified during the survey interval, ranging from 1799 to 1907, typically matching with westward expansion of Euro-American settlement.
2. Materials and Methods
We determined tree composition and tree densities (for both ≥ 12.7 cm and ≥20.3 cm, at 1.37 m height above ground level) from survey points in historical General Land Office land surveys for Illinois, Indiana, southern Michigan, and western Minnesota in the midwestern U.S., which transitions from part of the Great Plains of North America to the Prairie Peninsula (Figure 1) and by vegetation classes reconstructed by experts from historical land surveys. The land surveys followed the Public Land Survey System of townships and ranges to divide public land for sale. The surveys completely covered these four states, regardless of tree presence. Land surveys occurred in Illinois during years 1804–1843 [26], Indiana during 1799–1834 [27], Michigan during 1816–1856 [28], and Minnesota during 1847–1907 [29] digitized from Marschner [41]. For the vegetation reconstructions, experts used the entirety of the surveys, including surveyor notes about vegetation (Figure 2), and ancillary data such as soil, landform, and geology to classify vegetation types but without calculating tree densities [42,43]. The PalEON network has made historical land surveys available for about 50% of Illinois, 70% of Indiana, and all of southern Michigan, while also standardizing historical land surveys for Minnesota [44,45,46,47,48]. Data processing was performed in SAS (version 9.4, SAS, Cary, NC, USA) and ArcGIS Pro (version 3.3.4, ESRI, Redlands, CA, USA).
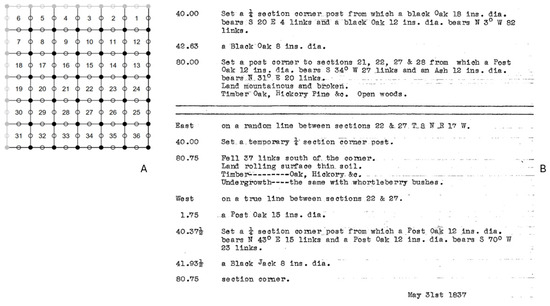
Figure 2.
Survey points (circles) occurred every 0.8 km in land surveys to divide public land into Public Land Survey System townships, comprising 36 square sections (A) and two to four trees were recorded at survey points, along with other information in the General Land Office surveys (B).
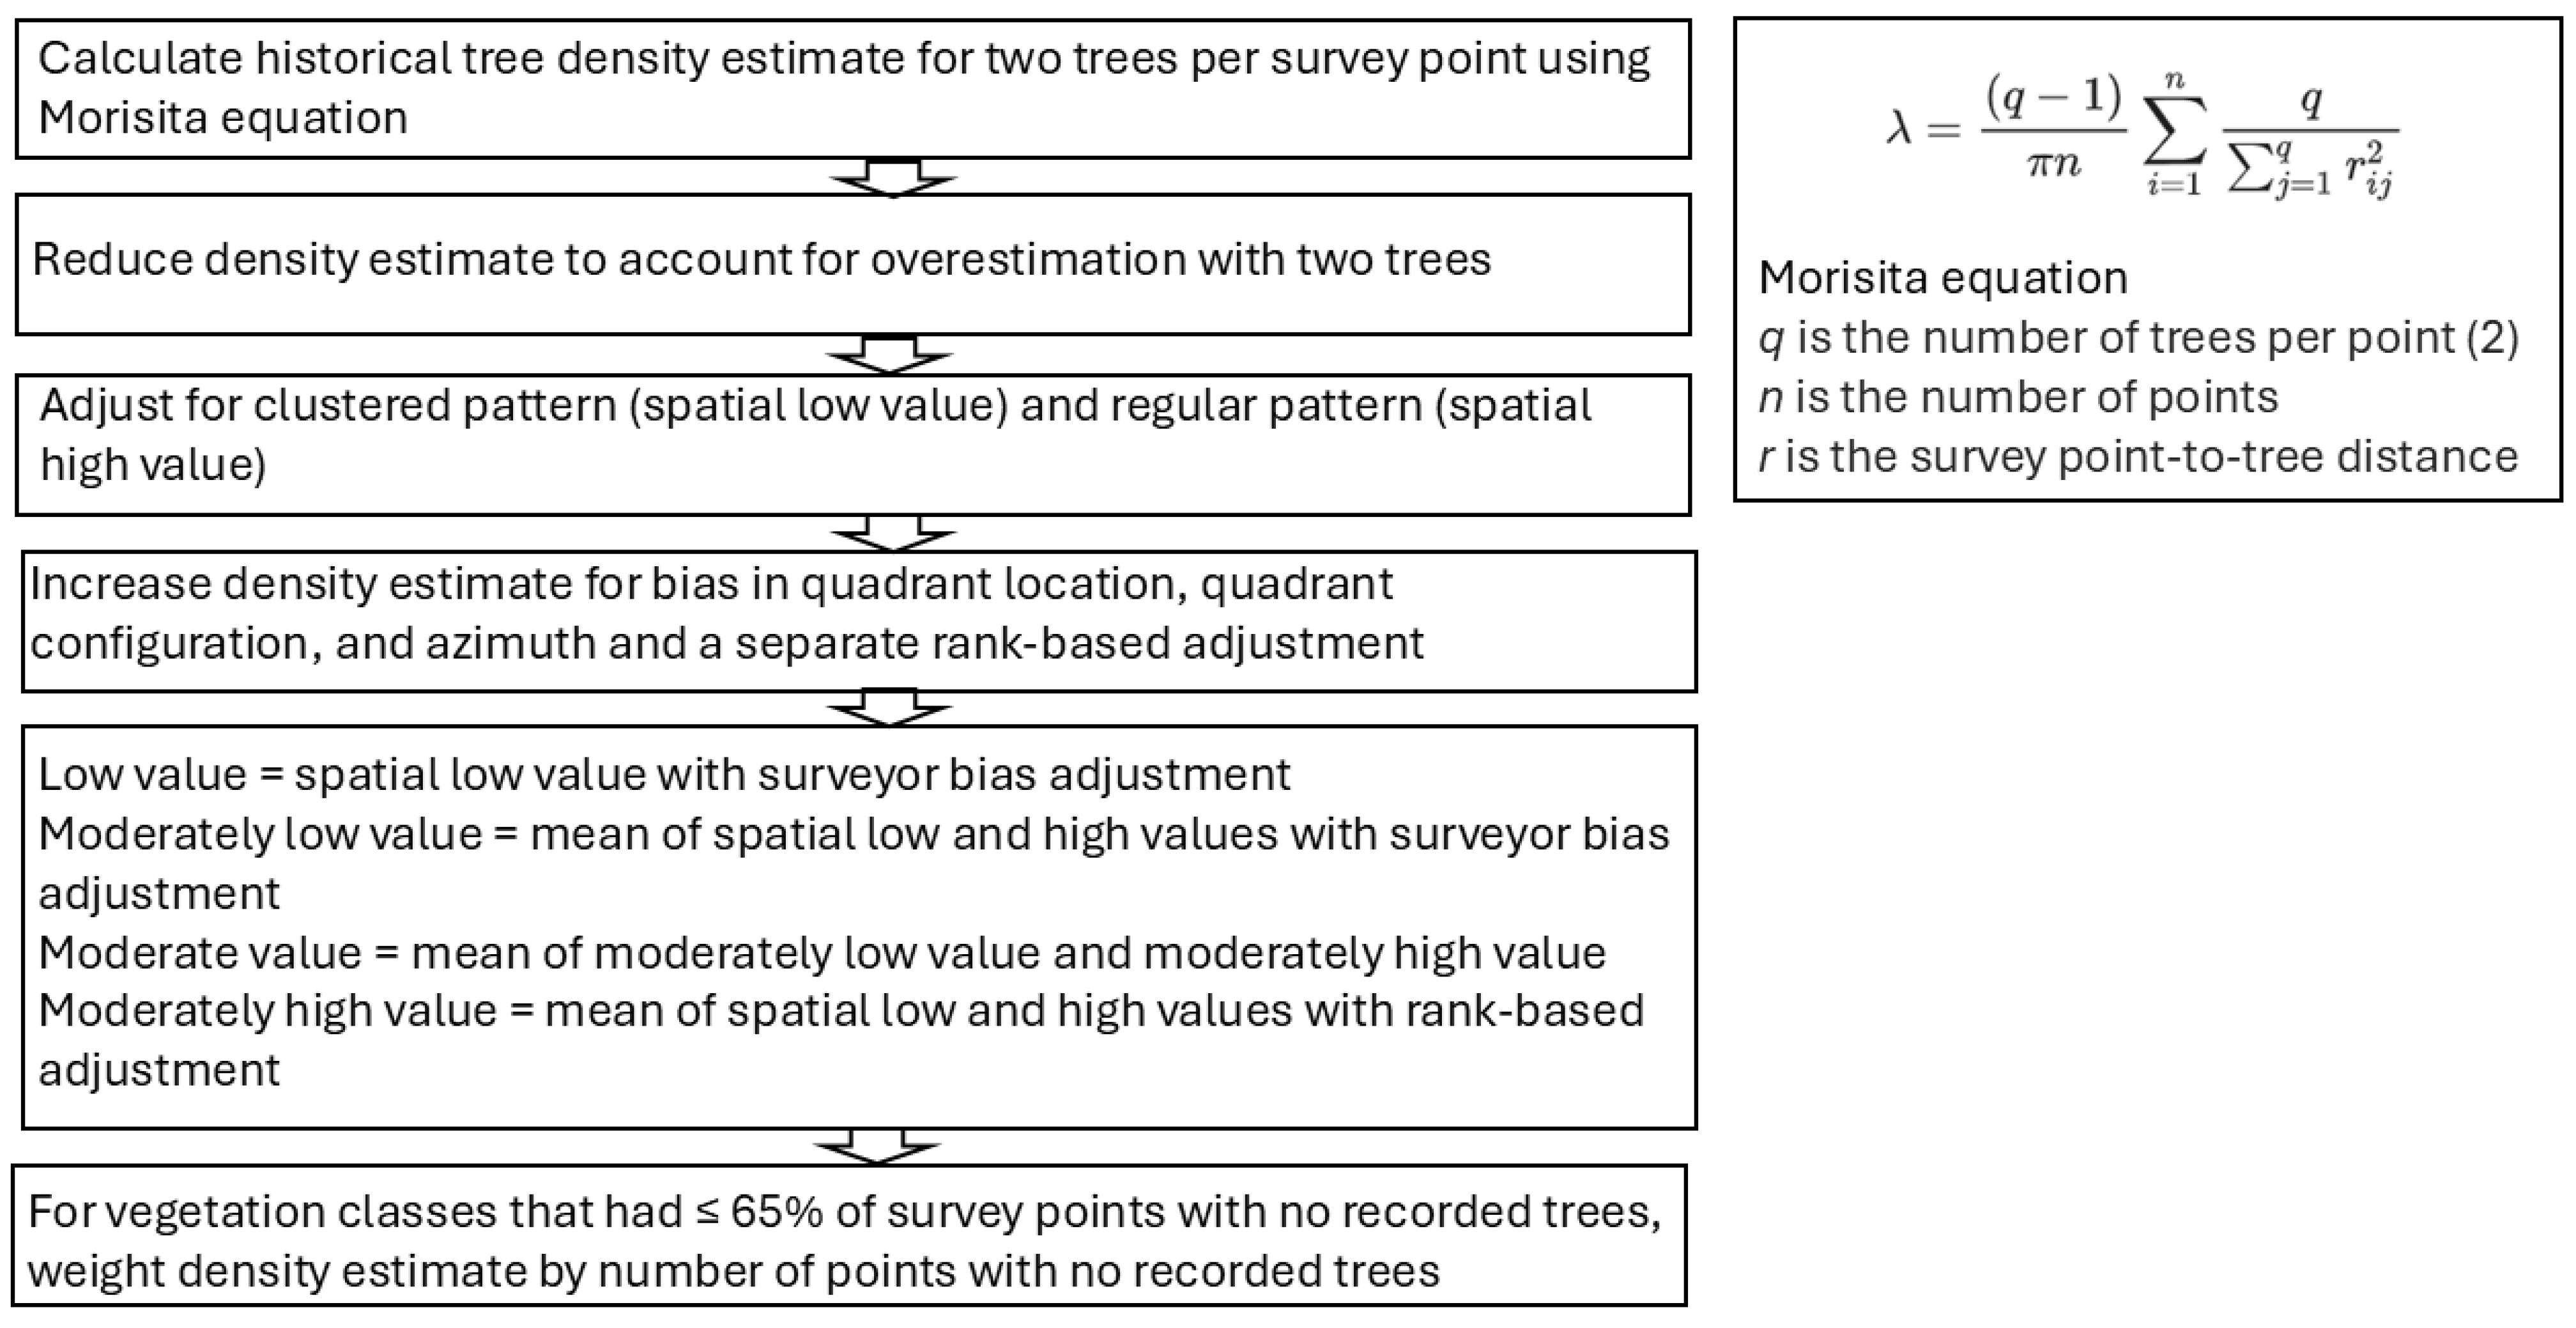
Error estimation quantifies the difference between estimated values and actual values to inform about accuracy [33]. Density estimates with the Morisita plotless estimator are probable to be accurate, given a large sample size (i.e., ideally at least 2000 survey points for points with two trees), but require simple correction factors for overestimation of points with two trees and a potential clustered spatial pattern (Figure 3; [20]). Conversely, density is underestimated when recorded trees are more distant than the nearest trees due to surveyor bias in tree selection [21]. Therefore, potential densities range from a low value to account for clustering to a maximum value to account for surveyor bias. Although confidence intervals can be derived for plotless tree density estimates [49], the magnitude of error of the density estimation calculation is minor compared to the sources of error from non-random sampling (i.e., selection of trees due to surveyor bias) and spatial patterns in tree distributions (i.e., clustering). Therefore, we calculated a range of estimates to account for uncertainty in estimation due to the major sources of error based on adjustment values from simulations and actual surveyor bias in the surveys [20,21]. We provided a spatial low value (i.e., clustered) with surveyor bias adjustment, moderately low value of the mean of spatial low and high values with surveyor bias adjustment, moderate value of the mean of moderately low values and moderately high values, and moderately high value of the mean of spatial low and high values with rank-based adjustment (Figure 3). Across a landscape, a full range of densities will likely occur.

Figure 3.
Steps for calculating historical tree density estimates.
We estimated density for two trees per survey point, because these estimates are the most robust, for tree diameter thresholds of 12.7 cm and 20.3 cm [20,23,25]. We excluded trees with recorded distances > 60 m to provide consistency with surveyor instructions. Additionally, trees that were 60 m in distance from points were equivalent to about 1 tree/ha, or grasslands (see landscape adjustment below). We kept the first two trees at survey points with three or four trees. We decreased density estimates for points with two trees, following adjustment (i.e., division by 1.22 or multiplication by 0.82; [20]). We next produced low and high density values based on adjustment values for potential clustered (i.e., division by 1.21) and regular (division by 0.97) spatial patterning (i.e., random patterning does not require correction; adjustment values in [20]).
Similarly, due to surveyors not selecting the nearest trees, adjustments help to reveal the potential magnitude of bias. We increased the low and high density values to account for surveyor bias in selecting trees that were not nearest to the survey points [21]. For bias adjustment, we determined the frequencies for quadrant location, quadrant configuration, and azimuth, and we corrected for non-random frequencies by finding the adjustment quotient from regression equations [21]. The moderately low density value was a simple mean of the adjusted low and high densities, and we kept the adjusted low density estimate as the final low density value. For a moderately high adjustment, we applied a correction from a rank-based method for a mean tree rank of 1.8 (i.e., if surveyors most often selected the second nearest tree; [21]). With this moderately high value from a rank-based adjustment and the moderate low density value from surveyor bias in the data, we calculated a moderate density value as a simple mean of the moderately low and moderately high density estimates.
As opposed to tree density estimates, we applied a landscape adjustment to account for the area of open ecosystems, as specified by the lack of recorded trees at survey points. Surveyors did not record trees at all survey points for a variety of reasons, but one reason is that trees were not available to record or exceeded a distance of 60 m, as in grasslands. In uniformly forested landscapes, almost all survey points will have recorded trees, aside for obstacles such as water bodies or rock outcroppings, but survey points with trees will decrease as open ecosystems intermix with forests. Grasslands may have high tree densities where trees occur, typically as clustered groves in protected locations, but few survey points will have recorded trees. Therefore, high tree densities are not representative of grassland landscapes. Likewise, forests may have incomplete tree coverage near survey points due to openings from gap dynamics along with intermixed grasslands and savannas in this region. Distances to trees also will be extended by intermixed open ecosystems. But adjustment for these openings will not represent forests. We applied the landscape adjustment to vegetation classes that had ≤65% of survey points with recorded trees, or >35% of survey points without recorded trees, which were grassland and savanna ecosystem classes. The landscape adjustment was a weighted average of the number of survey points with estimated tree densities and the number of points without recorded trees, for which we assigned a density estimate of 1 tree/ha (distance of 60 m).
For vegetation classes assigned by expert reconstructions, we made some refinements based on applying density estimates to split or group classes. We grouped vegetation classes that had similar densities and tree composition. Conversely, to differentiate vegetation classes in the northern third of Indiana extending into southern Michigan, which was a favorable pathway for fire, we separated the oak-hickory (Carya) class in this location from the oak-hickory class in southern Indiana. For southern Michigan forests, we applied a simple wetland assignment to survey points that were within wetlands that extended across this area [50]. For Illinois forests, we were not able to create any density separation in the forest class based on topographic roughness or location (i.e., southern and western Illinois along the major riverways of the Mississippi or Ohio), perhaps in part due to some limitations from surveys of only about half the area in Illinois. We retained only vegetation classes that had ≥600 survey points with trees, regardless of the number of survey points without trees, and we excluded a variety of minor wetland classes.
Lastly, we compared the overlap in our range of density estimates to published [25] or modeled [36] density estimates for similar extents of southern Michigan, Illinois, and Indiana. Density estimates were modeled by aggregating points to 8 km grid cells and smoothed using a generalized additive model [36]. For the available models of density estimates [36], we determined mean values of the modeled density estimates for the administrative areas and the areas of ecosystem classes for southern Michigan, western Minnesota, Illinois, and Indiana. These researchers used a minimum diameter threshold of ≥20.3 cm diameter, which is why we also generated densities with a 20.3 cm diameter threshold. However, a minimum of 12.7 cm diameter forms the basis to (1) differentiate general definitions of savannas, open woodlands, closed woodlands, and closed forests [30]; (2) denote that trees are no longer saplings; and (3) fully sample trees in modern tree surveys, which typically do not contain many trees of large diameters and which are truncated at 12.7 cm diameter.
3. Results
3.1. Density Estimates and Ecosystem Classes by Vegetation Classes
For Illinois, we maintained the extents of the two expert-designated vegetation classes of prairie and forest, although the application of density estimates allowed reclassification of the forest class to open woodlands (Table 1; Figure 4). These two vegetation classes contained about 34,000 survey points each, out of 71,000 survey points, or 95% of all survey points. However, 80% of the survey points in the forest class, as defined by experts, had recorded trees (≥12.7 cm in diameter and <60 m in distance), whereas only 2% of prairie class survey points had recorded trees. Tree density estimates in the prairie class ranged from a low value of 43 trees/ha to a high value of 75 trees/ha. After landscape adjustment to represent trees present at 2% of survey points, landscape tree densities ranged from 2 to 3 trees/ha in the prairie class. The forest class had low, moderately low, moderate, and moderately high density estimates of 106, 119, 137, and 154 trees/ha, respectively. These densities all represented open woodlands. Both vegetation classes were dominated by oak, consisting of 83% oaks in the grassland ecosystem class and 69% oaks in the open woodland ecosystem class. For both classes, hickories (9% and 13% of all trees in grasslands and open woodlands, respectively) and elms (Ulmus; 4% and 5% of all trees in grasslands and open woodlands, respectively) were the second and third most abundant genera, respectively.

Table 1.
For Illinois (IL), western Minnesota (MN), southern Michigan (MI), and Indiana (IN), expert designation of vegetation class and ecosystem class based on quantified tree densities (low, moderately low, moderate, and moderately high in trees/ha) for trees ≥ 12.7 cm diameter and trees ≥ 20.3 cm diameter, compared to modeled density estimates ([36]; trees ≥ 20.3 cm diameter), and oak percentage. Oaks were the dominant species unless otherwise specified. Landscape adjustments (land adj) account for survey points without trees. Low = spatial low value with surveyor bias adjustment; Moderately low value = mean of spatial low and high values with surveyor bias adjustment; Moderate value = mean of moderately low value and moderately high value; Moderately high value = mean of spatial low and high values with rank-based adjustment.
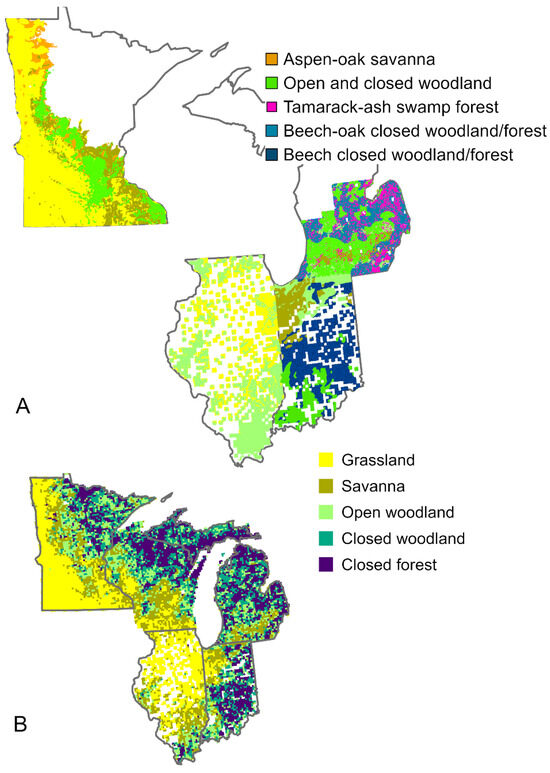
Figure 4.
Final ecosystem classes based on density estimates (for tree diameters ≥ 12.7 cm) for expert-assigned vegetation classes (A), with similar density estimates after classifying ecosystems for the model by Paciorek et al. [36], albeit with greater diameter thresholds (tree diameters ≥ 20.3 cm (B)).
For western Minnesota, we retained the extents of the prairie class (about 75,000 survey points), oak openings and barrens class (16,400 points), and oak-maple-basswood-hickory forest (‘Big Woods’) class (15,000 points) of the expert-designated vegetation classes, but collapsed aspen (Populus)-oak land, brush prairie, and wet prairie (30,400 points) into one ‘aspen-oak brush prairie’ or savanna class. These four classes comprised 96% of the 142,300 survey points. Only 3% of the prairie class had survey points with trees (≥12.7 cm in diameter and <60 m in distance), 28% of brush prairie or savanna class had survey points with trees, and 55% of the oak openings and barrens class had survey points with trees, whereas 80% of the forest class had survey points with trees. After adjustment, landscape tree density estimates for the prairie class ranged from 3 to 4 trees/ha. The low, moderately low, moderate, and moderately high tree density estimates were 33, 37, 46, and 55 trees/ha for the brush prairie or savanna class and 23, 26, 33, and 39 trees/ha for the oak openings and barrens class, respectively. Based on this difference from the grassland class, we determined about 15 trees/ha, from potential thresholds of 5 trees/ha to 25 trees/ha, as a reasonable threshold between grasslands and savannas. The density estimates for the forest class were 136, 153, 183, and 214 trees/ha for low, moderately low, moderate, and moderately high density estimates, respectively. These estimates represented open and closed woodlands, rather than closed forest.
Concerning tree composition, the grassland and oak openings and barrens ecosystem classes were dominated by oaks (67% and 89% oak, respectively), with aspens as the second most common genus. The aspen-oak brushland savanna (i.e., aspen-oak land, brush prairie, and wet prairie vegetation class) was co-dominated by aspens (40% of all trees) and oaks (36% of all trees). Oaks were the predominant species, at 36% of all trees, in the open and closed woodland ecosystem class (i.e., oak-maple-basswood-hickory forest), with moderate abundance of elms (17% of all trees), maples (Acer; 11% of all trees), and American basswood (Tilia americana; 10% of all trees), whereas hickories comprised 2% of all trees.
As for Michigan, we retained the original swamp vegetation class (4300 survey points) and combined the original savanna and barrens vegetation classes (5900 survey points). We subdivided the forest vegetation class based on the location of wetlands [49], which extended from the wet prairies of northern Indiana, resulting in a forest class (11,600 survey points) and forest in wetlands class (7900 survey points). These four vegetation classes constituted 94% of the survey points (grasslands were present but excluded due to small sample size). All of the vegetation classes had trees recorded in ≥88% of the survey points. Density estimates for the savanna and barrens class were 47, 53, 65, and 78 trees/ha for low, moderately low, moderate, and moderately high density estimates, respectively. The low, moderately low, moderate, and moderately high density estimates for the forest vegetation class within wetlands were 148, 166, 197, and 227 trees/ha, respectively, representing open and closed woodlands. The low, moderately low, moderate, and moderately high density estimates for the forest vegetation class outside of the wetlands were 207, 233, 271, and 310 trees/ha, respectively, or closed woodlands and forests. The swamp vegetation class had density estimates of 240, 269, 322, and 374 trees/ha for low, moderately low, moderate, and moderately high density estimates, respectively, indicating closed forests overall.
Regarding composition, oaks comprised 91% of all trees in the savanna ecosystem class, with hickories as the next most abundant genus at 4% of all trees. Oaks comprised 43% of all trees in the open and closed woodland ecosystem class, with American beech common at 23% of all trees. Beech and oaks were co-dominant, at 25% and 21% of all trees, respectively, in the beech and oak closed woodland and forest ecosystem class. Swamp forests were primarily tamarack (17% of all trees) and ashes (21% of all trees).
Similarly for Indiana, we combined the original prairie and wetland vegetation classes (10,500 survey points) and combined the original beech-maple and beech-oak-maple-hickory forests (37,188 survey points). We divided the oak-hickory vegetation class according to location into 10,000 survey points in northern Indiana and 11,200 survey points in southern Indiana. These four vegetation classes constituted 99% of the survey points. The prairie and wetland vegetation class only had 34% survey points with trees, but the other three vegetation classes had trees recorded in ≥75% of the survey points. The landscape density estimates for the prairie and wetland class were 27, 30, 37, and 44 trees/ha for low, moderately low, moderate, and moderately high estimates, respectively, consistent with the provisional definition of savannas. Density estimates for the oak-hickory vegetation class in northern Indiana were 101, 113, 134, and 155 trees/ha for low, moderately low, moderate, and moderately high estimates, respectively, which were density estimates for open woodlands. Density estimates for the oak-hickory vegetation class in southern Indiana were 183, 205, 241, and 277 trees/ha for low, moderately low, moderate, and moderately high estimates, respectively, or closed woodlands and forests. Likewise, the beech-maple and beech-oak-maple-hickory vegetation classes had density estimates of 215, 242, 289, and 335 trees/ha for low, moderately low, moderate, and moderately high estimates, respectively, spanning closed woodlands and forests.
Considering composition, oaks comprised 74% of all trees in the savanna ecosystem class, with hickories as the next most abundant genera at 7% of all trees, respectively. Oaks comprised 64% of all trees in the open woodland ecosystem class, with hickories and American beech as the next most abundant genera at 8% and 7% of all trees, respectively. In closed woodlands and forests of the oak-hickory vegetation class in southern Indiana, oaks comprised 36% of all trees, followed by American beech at 19% of all trees and hickories at 10% of all trees. Beech was dominant, at 38% of all trees, in the beech closed woodland and forest ecosystem class.
3.2. Overlap with Modeled Density Estimates by Vegetation Types
Out of the 14 ecosystem classes, the modeled density estimates [36] were mostly values that overlapped either with the range of low to moderately high density estimates (50% of values) or with the density range for the corresponding ecosystem classes of grasslands, savannas, open woodlands, closed woodlands, and forests (29% of values; Table 1). Three of the modeled density estimates may have departed slightly from the densities expected for the ecosystem classes. The density estimate for Illinois grasslands may be high at 18 trees/ha, particularly for truncated tree diameters ≥ 20.3 cm. Similarly, the density estimate for Michigan savannas may be high at 110 trees/ha, particularly for tree diameters ≥ 20.3 cm. Conversely, the density estimate for Minnesota Big Woods may be low at 94 trees/ha, albeit for diameters ≥ 20.3 cm.
3.3. Overlap with Density Estimates for Illinois, Indiana, and Southern Michigan
For parts of three states, the modeled density estimates [36] were values that overlapped either with the range of low to high estimates for Indiana and southern Michigan or with the range of density estimates expected for savannas or the grasslands and open forests of Illinois (Table 2). The published density estimates [25] fell within the range of low to high estimates for Indiana and slightly exceeded the high estimate for southern Michigan. Departure occurred from the published density estimates for Illinois, in that the density estimate of 117 trees/ha represented open woodlands, not accounting for almost 50% of survey points that were grasslands. However, the estimate of 117 trees/ha was the same as our moderately high density estimate, before landscape adjustment to account for grasslands.
Table 2.
For Illinois (IL), southern Michigan (MI), and Indiana (IN), comparisons of density estimates (trees/ha for trees ≥ 20.3 cm diameter) for low to moderately high estimates, modeled density estimates ([36]; ≥20.3 cm diameter), published density estimates ([25]; ≥20.3 cm diameter), and oak percentage. Landscape adjustments account for survey points without trees.
4. Discussion
4.1. Key Outcomes
Historical land surveys during the 1800s incorporated the first systematic, comprehensive tree surveys for the United States, supplying the best available information about historical ecosystems and disturbance conditions. Expert-driven or data-driven analyses are necessary to extract information contained in the survey data. However, tree density estimates from historical land surveys require alignment with other data sources to establish validity. For this study, we contextualized historical tree density estimates and expert designations of vegetation classes, which also matched the ecological context of exposure to frequent fires from the eastern Great Plains grasslands and spatial transition to more forested conditions. The greatest fire exposure occurred in Illinois and western Minnesota, whereas Indiana and southern Michigan were more protected from fire. Therefore, a combination of density estimates from historical land surveys with reconstructions of historical vegetation supported that the major ecosystems were grasslands, savannas, open woodlands, and closed woodlands, rather than closed forests, in Illinois and western Minnesota, with fire-tolerant oaks representing > 50% of all trees. While Indiana and southern Michigan contained savanna and open and closed woodland landscapes, Indiana also contained American beech closed woodlands and forests, and southern Michigan featured American beech-oak closed woodlands and forests and also tamarack and ash swamp forests. Indiana and southern Michigan had oak percentages of 30% and 40%, respectively, which still represented dominant tree percentages and denoted exposure to frequent surface fires, favoring fire-tolerant oak species.
These results also suggested that 15 trees/ha may be an intermediate value between grasslands and savannas. Tree densities in the grasslands of Illinois and Minnesota did not exceed 4 trees/ha, after accounting for the number of survey points without trees. Tree densities in the savannas of Indiana, Michigan, and Minnesota ranged from 23 trees/ha to 78 trees/ha. This is a provisional finding that may change with application to other ecosystems.
The approaches were either strictly data-driven, using only survey points from historical land surveys, or followed an expert knowledge process to land cover classification, using the entirety of the land surveys and supplementary data, with no calculation of tree density estimates. Quantitative approaches applied independent methods to deal with biases. Expert knowledge application is unique, depending on experts, based on an independent system of expert knowledge combined with the selection of ancillary data, such as soil, geology, and climate, although the first mapping classifications influenced later efforts in some other states. Different modeling approaches and adjustments overall generated similar values, supporting the reliability of density estimation from historical tree surveys [25,36]. Caveats include that the historical land surveys for Illinois and Indiana were not completely available, covering about 50% of Illinois and 70% of Indiana. Although generally representative, the state-wide results of tree densities and oak composition are intermediate products (Table 2). For example, about 65% of Illinois was classified as grasslands in the state-wide vegetation reconstruction by experts, yet only about 50% of survey points were from the grassland vegetation class. Nonetheless, the rich sources of information converged into a cohesive and nuanced reconstruction of historical vegetation, establishing the validity and reliability of historical tree density estimation and expert designations of vegetation classes from historical land surveys.
4.2. Considerations for Applying Density Estimates to Ecosystems
A range of density estimates accounts for the inherent uncertainty in density estimates. The range of values provides margins of error around the Morisita density estimates because adjustments for surveyor bias cannot encapsulate composite decisions. For the ecosystem classes in this study, compared to the completely unadjusted Morisita density estimates, the low values were about 0.87 of the Morisita density estimates, the moderately low values were equivalent, the moderate values were greater by a factor of 1.15, and the moderately high values were greater by a factor of 1.34, not weighted for the number of survey points or area of vegetation classes. While it may seem desirable to use the surveyor bias detected in the dataset to inform the adjustments, it is unlikely that each bias was compounded as a separate bias to be applied. To date, adjustments partition each deviation from random as independent, sequential biases. Although adjustments included the well-recognized biases of quadrant (i.e., NE, SE, SW, and NW), quadrant configuration (adjacent and opposite), and azimuth or newly developed options [25], approaches converged on similar estimates. Biases appear to increase with tree density, as surveyors had a greater number of trees to select within a short distance from the survey point relative to limited trees in grasslands. Ultimately, in historical tree density estimation, it may be more transparent, accessible, and standardized to simply report the Morisita density estimate for survey points with two trees, unadjusted for number of trees, potential clustering, and surveyor bias, and provide a stated range of low to high uncertainty values (e.g., 0.85 to 1.35 in this study). For completely forested study extents, with numerous trees that reduce the potential for clustering and increase the potential for surveyor bias, high values may be greater than the unadjusted estimate by a factor of 1.5, with these high values more likely to represent historical densities than lower values.
Accounting for clustered spatial patterns in historical tree arrangement means that the importance of this adjustment probably will vary depending on tree species and density. That is, tree clustering is more probable in ecological contexts such as this study extent, consisting of a range of intermixed vegetation classes and openings, with uneven fire exposure and trees located in more protected areas. Trees often occurred in groves or along riparian corridors within grasslands, rather than being uniformly distributed [11]. Additionally, tree species such as pine may regenerate naturally in dense clusters, making some pine-dominated landscapes more probable to be clustered [51]. Therefore, low estimates to account for clustering may be more representative of historical tree densities in some regions, whereas random or regular patterning may have occurred in the densely stocked circumboreal northern forests of Minnesota, Wisconsin, and Michigan.
Due to the ecological context, the vegetation classes had numerous survey points without recorded trees, which required a landscape adjustment. The percentage of survey points without recorded trees may be another good indicator that lesser density estimates are a better match to the conditions. The landscape adjustment was a weighted average of number of survey points with estimated tree densities and the number of points without recorded trees, for which we assigned a density estimate of 1 tree/ha (i.e., distance of 60 m). An overall forested landscape may have incomplete filling of survey points with trees due to openings from gap dynamics along with intermixed grasslands and savannas. Adjustment for these openings may not represent typical tree densities of the forests, such as the beech closed woodlands and closed forests of Michigan and Indiana. By contrast, about 2% to 3% of survey points had recorded trees in the grasslands of Illinois and western Minnesota and high tree densities are not representative of grassland landscapes. We applied the landscape adjustment to vegetation classes that had ≤65% of survey points with recorded trees, which were grassland and savanna classes, although this break point is provisional and perhaps could develop into a more continuous or complete scale of adjustment.
Moreover, density estimates represent one dimension of vegetation classes, whereas diameter is the other factor. Although historical forests typically contained large diameter trees, extremely large trees as occurred in productive alluvial soils may mean that the tree densities of closed woodlands occupied the growing space of forests. Similarly, circumboreal forests that experience large-scale overstory disturbance on 50 to 150 year cycles may be understocked forests in terms of diameter relative to density, as smaller diameter trees occupy less growing space, but would be considered closed forests due to dominance by trees [32].
4.3. Contextualizing Density Estimates and Vegetation Classes
Uncertainty in density estimates can be reduced by anchoring to information from vegetation reconstructions of historical land surveys or dendrochronologies, ecological classification systems, historical accounts, and early forest assessments. Placing the range of density estimates within the framework of density estimates for grasslands, savannas, open woodlands, closed woodlands, and closed forests emphasizes the ecological importance of density estimates. Grasslands, savannas, and woodlands typically experienced frequent surface fires, which controlled trees in terms of overstory density and also structural development of midstory layers, as well as tree composition. Dominant percentages (>30% of all trees) of fire-tolerant oaks and some pine species indicate fire exposure.
Illinois was primarily a grassland in the past, based on the historical tree density estimates and reconstructed vegetation, and also historical accounts [3,7,11,15,52]. About 65% of Illinois was classified as grasslands by the reconstructed vegetation classes, with density estimates of 2 to 3 trees/ha. For example, Beckwith ([7], p. 36), who was an Illinois resident and historian of maps and other archives, wrote that Illinois was mostly prairie excepting the ‘thin curtain of timber draping the water-courses.’ We were not able to isolate forested landscapes (>250 trees/ha) or even closed woodland landscapes, as perhaps occurred in parts of Illinois, but the available historical land surveys remain incomplete. Instead, the forested vegetation class represented open woodlands, with oaks as 69% of all trees and tree densities ranging from 106 to 154 trees/ha, which has support as the structure even in southern and western Illinois [4,53,54,55]. Modeled tree density estimates (≥20.3 diameter; [36]) were comparable to our tree density estimates, albeit the modeled estimates may be a little high for grasslands, whereas the other published density estimates (≥20.3 diameter; [25]) for Illinois did not appear to account for grasslands. However, the published density estimates were similar to our density estimates without adjustment.
Western Minnesota typically is defined as part of the Great Plains grasslands, with aspen and oak trees known as brushlands in suppressed shrub and sprout form due to top-killing by fire, or herbivory (i.e., grubs or coppicing; [56,57]). The historical tree density estimates for grasslands were 3 to 4 trees/ha. Oak savannas, with oaks as 89% of all trees, had densities of 23 to 39 trees/ha, similar to aspen-oak brushland savanna that had densities of 33 to 55 trees/ha, with aspens and oaks each comprising about 35% to 40% of all trees. Because fire is a contagious disturbance that spreads, exposure to fire reduced tree densities in the adjacent ‘Big Woods’ ecosystem, dominated by oaks at 36% of all trees, resulting in tree densities (136 to 214 trees/ha) representative of open and closed woodlands rather than closed forests. Modeled tree density estimates (≥20.3 diameter; [36]) were comparable to our density estimates, but the modeled estimates for the ‘Big Woods’ ecosystem may be a little low.
In southern Michigan, fire exposure from the Great Plains was limited, allowing for tree development [12,58]. Although grasslands covered too small an area for accurate density estimates, the savanna vegetation class had characteristic tree densities ranging from 47 to 78 trees/ha, with oaks as 91% of all trees. We were able to find separation between oak woodlands and beech-oak closed woodlands/forests by using a wetlands designation for oak woodlands that extended from the savannas of northern Indiana. While wetlands that are on the permanent aquatic end of the spectrum can act as a firebreak, seasonally dry herbaceous wetlands are ideal for spreading fire due to productive growth of herbaceous vegetation during the spring followed by curing during summer and fall [59]. Conversely, tamarack-ash swamps were at closed forest densities (>250 trees/ha). Oak savannas (0.73 million ha) and woodlands (1.63 million ha) encompassed about 35% of southern Michigan. Modeled tree density estimates (≥20.3 diameter; [36]) were similar to our estimates, but the modeled estimates for savannas may be too high. For all of southern Michigan, the other published density estimates (≥20.3 diameter; [25,36]) were comparable to our findings.
Indiana vegetation classes were least defined, and we modified them the most, based on quantified tree densities and composition, the strength of the data-driven method. The grasslands and wetlands, including the historical Grand Kankakee Marsh in the northeastern corner, were savannas overall, whereas the rest of the northern third of the state was primarily open woodlands [7]. Tree composition was predominantly fire-tolerant oak, at 74% and 64% of all trees, respectively for savannas and open woodlands. Most of the lower two-thirds of Indiana was covered by closed woodlands or forests dominated by American beech, but the southern part of the state contained oak-dominated closed woodlands. Owen ([60], p. 51) documented some of the historical vegetation of this southern part: ‘It is stated by the oldest inhabitants, that when the country was first settled, it was for the most part an open prairie district, on which was a luxuriant growth of wild grass…which seemed to have taken possession of the soil to the exclusion of the timber, which subsequently sprung up as the country became settled, while, at the same time, the barren grass died out.’ Where fire-tolerant oaks were dominant (≥30% of all trees), woodlands (<250 trees/ha) were likely, and where beech was dominant, closed forests (>250 trees/ha) were likely. However, due to (1) intermixing of oaks and beech, (2) 15% of survey points without recorded trees, and (3) the abundance of bison, tree densities in beech forests probably spanned the borderlines of closed woodlands and closed forests [61]. This openness and variety were borne out by historical accounts [11,62,63]. For example, Owen ([63], p. 45) described oaks and beech thinning into woods pasture. Other density estimates were similar for vegetation classes and for all of the available surveys in Indiana.
5. Conclusions
Progress in density estimation from historical land surveys has emerged, and now it is possible to validate density estimates through ecological alignment to meaningful ecosystem classes. For the midwestern United States, which had exposure to frequent fires historically, we calculated a range of mean tree densities to encapsulate the uncertainty for vegetation classes reconstructed by experts in the midwestern U.S., enabling approximation of the threshold between grasslands and savannas at around 15 trees/ha. Tree density estimates generally corresponded with vegetation types classified by experts and were consistent with historical accounts, the ecological context, and other tree density estimation approaches. Most historical ecosystem classes were grasslands, savannas, open woodlands, and closed woodlands dominated by oaks, which were favored by frequent fire exposure, particularly on the western side of the study region in the Great Plains grasslands. Protected locations in the southern two-thirds of Indiana and southern Michigan developed closed forests of American beech, although borderline closed forest density estimates and intermixing with oak woodlands indicated some fire exposure. In conclusion, historical tree density estimates generally aligned with ecosystem classes and provided another line of evidence to inform the understanding of the range of historical ecosystems and inferences about disturbances.
Author Contributions
Conceptualization, B.B.H. and R.T.; methodology, B.B.H.; formal analysis, B.B.H.; data curation, B.B.H.; writing—original draft preparation, B.B.H.; writing—review and editing, B.B.H., R.T. and C.M.R.; visualization, B.B.H. All authors have read and agreed to the published version of the manuscript.
Funding
This research was supported by the USDA Forest Service, Rocky Mountain Research Station.
Data Availability Statement
All data are publicly available. Reclassified ecosystems are available at https://zenodo.org/records/15049436, accessed on 24 April 2025.
Acknowledgments
The findings and conclusions in this publication are those of the authors and should not be construed to represent any official USDA or U.S. Government determination or policy.
Conflicts of Interest
The authors declare no conflicts of interest.
References
- Bragg, D.C.; Hanberry, B.B.; Hutchinson, T.F.; Jack, S.B.; Kabrick, J.M. Silvicultural options for open forest management in eastern North America. For. Ecol. Manag. 2020, 474, 118383. [Google Scholar] [CrossRef]
- Hagmann, R.K.; Hessburg, P.F.; Prichard, S.J.; Povak, N.A.; Brown, P.M.; Fulé, P.Z.; Keane, R.E.; Knapp, E.E.; Lydersen, J.M.; Metlen, K.L.; et al. Evidence for widespread changes in the structure, composition, and fire regimes of western North American forests. Ecol. Appl. 2021, 31, e02431. [Google Scholar] [CrossRef] [PubMed]
- Peck, J.M. A Gazetteer of Illinois. 1834. Available online: https://www.siue.edu/lovejoy-library/tas/Abbott_722.pdf (accessed on 17 November 2023).
- Engelmann, H. Remarks upon the causes producing the different characters of vegetation known as prairies, flats, and barrens in southern Illinois, with special reference to observations made in Perry and Jackson counties. Am. J. Sci. 1863, 86, 384–396. [Google Scholar] [CrossRef]
- Heikens, A.L.; Robertson, P.A. Barrens of the Midwest: A review of the literature. Castanea 1994, 59, 184–194. [Google Scholar]
- McClain, W.E.; Ruffner, C.M.; Ebinger, J.E.; Spyreas, G. Patterns of anthropogenic fire within the midwestern tallgrass prairie 1673–1905: Evidence from written accounts. Nat. Areas J. 2021, 41, 283–300. [Google Scholar] [CrossRef]
- Beckwith, H.W. History of Vigo and Parke Counties, Together with Historic Notes on the Wabash Valley, Gleaned from Early Authors, Old Maps and Manuscripts, Private and Official Correspondence, and Other Authentic, Though, for the Most Part, Out-of-the-Way Sources. 1880. Available online: https://babel.hathitrust.org/cgi/pt?id=uiug.30112045819148&view=1up&seq=7 (accessed on 17 November 2023).
- Gaskill, A. Why prairies are treeless. Science 1905, 22, 55–56. [Google Scholar]
- Gleason, H.A. The relation of forest distribution and prairie fires in the Middle West. Torreya 1913, 13, 173–181. [Google Scholar]
- Transeau, E.N. The prairie peninsula. Ecology 1935, 16, 423–437. [Google Scholar] [CrossRef]
- Williams, D.L. Reconstruction of prairie peninsula vegetation and its characteristics from descriptions before 1860. Ohio Biol. Surv. Biol. Notes 1981, 15, 83–86. [Google Scholar]
- Chapman, K.A.; Brewer, R. Prairie and savanna in southern lower Michigan: History, classification, ecology. Mich. Bot. 2008, 47, 1–48. [Google Scholar]
- Hanberry, B.B. Timing of tree density increases, influence of climate change, and a land use proxy for tree density increases in the eastern United States. Land 2021, 10, 1121. [Google Scholar] [CrossRef]
- Hanberry, B.B. Wind-bounded grasslands of North America. Ecol. Indic. 2021, 129, 107925. [Google Scholar] [CrossRef]
- Mitchell, S.A. Illinois in 1837. 1838. Available online: https://www.loc.gov/item/16000813/ (accessed on 17 November 2023).
- Muir, J. The Story of My Boyhood and Youth. 1913. Available online: https://www.wisconsinhistory.org/pdfs/la/Wis-Env-Tradition.pdf (accessed on 30 November 2023).
- Hanberry, B.B.; Faison, E.K. Re-framing deer herbivory as a natural disturbance regime with ecological and socioeconomic outcomes in the eastern United States. Sci. Total Environ. 2023, 868, 161669. [Google Scholar] [CrossRef]
- White, C.A. A History of the Rectangular Survey System; US Department of the Interior Bureau of Land Management: Washington, DC, USA, 1983. Available online: https://www.blm.gov//sites/blm.gov/files/histrect.pdf (accessed on 27 January 2024).
- Bouldin, J. Some problems and solutions in density estimation from bearing tree data: A review and synthesis. J. Biogeogr. 2008, 35, 2000–2011. [Google Scholar] [CrossRef]
- Hanberry, B.B.; Fraver, S.; He, H.S.; Yang, J.; Dey, D.C.; Palik, B.J. Spatial pattern corrections and sample sizes for forest density estimates of historical tree surveys. Landsc. Ecol. 2011, 26, 59–68. [Google Scholar] [CrossRef]
- Hanberry, B.B.; Yang, J.; Kabrick, J.M.; He, H.S. Adjusting forest density estimates for surveyor bias in historical tree surveys. Am. Midl. Nat. 2012, 167, 285–306. [Google Scholar] [CrossRef]
- Goring, S.J.; Mladenoff, D.J.; Cogbill, C.V.; Record, S.; Paciorek, C.J.; Jackson, S.T.; Dietze, M.C.; Dawson, A.; Matthes, J.H.; McLachlan, J.S.; et al. Novel and lost forests in the upper Midwestern United States, from new estimates of settlement-era composition, stem density, and biomass. PLoS ONE 2016, 11, e0151935. [Google Scholar] [CrossRef]
- Cogbill, C.V.; Thurman, A.L.; Williams, J.W.; Zhu, J.; Mladenoff, D.J.; Goring, S.J. A retrospective on the accuracy and precision of plotless forest density estimators in ecological studies. Ecosphere 2018, 9, e02187. [Google Scholar] [CrossRef]
- Paciorek, C.J.; Cogbill, C.V.; Peters, J.A.; Williams, J.W.; Mladenoff, D.J.; Dawson, A.; McLachlan, J.S. The forests of the midwestern United States at Euro-American settlement: Spatial and physical structure based on contemporaneous survey data. PLoS ONE 2021, 6, e0246473. [Google Scholar] [CrossRef]
- Cogbill, C.V. Surveyor and analyst biases in forest density estimation from United States Public Land Surveys. Ecosphere 2023, 14, e4647. [Google Scholar] [CrossRef]
- Illinois Natural History Survey. Illinois Landcover in the Early 1800s. 2003. Available online: https://clearinghouse.isgs.illinois.edu/data/landcover/illinois-landcover-early-1800s (accessed on 16 July 2023).
- Indiana Department of Natural Resources. Presettlement Land Cover. 2016. Available online: http://maps.indiana.edu/previewMaps/Environment/Land_Cover_Presettlement_IDNR.html (accessed on 16 July 2023).
- Michigan Natural Features Inventory. Vegetation Circa 1800. 2023. Available online: https://mnfi.anr.msu.edu/resources/vegetation-circa-1800 (accessed on 16 July 2023).
- Minnesota Department of Natural Resources. Native Vegetation at the Time of the Public Land Survey 1847–1907. 1998. Available online: https://gisdata.mn.gov/dataset/biota-marschner-presettle-veg (accessed on 16 July 2023).
- Hanberry, B.B.; Jones-Farrand, D.T.; Kabrick, J.M. Historical open forest ecosystems in the Missouri Ozarks: Reconstruction and restoration targets. Ecol. Restor. 2014, 32, 407–416. [Google Scholar] [CrossRef]
- Kabrick, J.M.; Hanberry, B.B.; Dey, D.C.; Knapp, B.O.; Larsen, D.R.; Knapp, L.S.P. Adapting Gingrich Stocking Guides for Managing Oak Woodlands and Savannas. In Foundational Concepts in Silviculture with Emphasis on Reforestation and Early Stand Improvement; Jain, T.B., Schuler, T.M., Eds.; Department of Agriculture, Forest Service: Fort Collins, CO, USA, 2022. [Google Scholar]
- Hanberry, B.B.; Dey, D.C. Historical range of variability for restoration and management in Wisconsin. Biodivers. Conserv. 2019, 28, 2931–2950. [Google Scholar] [CrossRef]
- Reynolds, M.R. Estimating the error in model predictions. For. Sci. 1984, 30, 454–469. [Google Scholar]
- Golafshani, N. Understanding reliability and validity in qualitative research. Qual. Rep. 2003, 8, 597–607. [Google Scholar] [CrossRef]
- Zumbo, B.D. 3 Validity: Foundational issues and statistical methodology. Handb. Stat. 2006, 26, 45–79. [Google Scholar]
- Paciorek, C.; Cogbill, C.; Peters, J.; Goring, S.; McLachlan, J.; Williams, J. Settlement Aboveground Biomass, Stem Density, and Basal Area, Midwest US, Level 1 ver 1. Environmental Data Initiative. 2019. Available online: https://portal.edirepository.org/nis/mapbrowse?packageid=msb-paleon.26.1 (accessed on 15 November 2023).
- Denzin, N.K. Triangulation 2.0. J. Mix. Methods Res. 2012, 6, 80–88. [Google Scholar] [CrossRef]
- Fetters, M.D.; Freshwater, D. The 1 + 1 = 3 Integration Challenge. J. Mix. Methods Res. 2015, 9, 115–117. [Google Scholar] [CrossRef]
- Bans-Akutey, A.; Tiimub, B.M. Triangulation in research. Acad. Lett. 2021, 2, 1–7. [Google Scholar] [CrossRef]
- Dewitz, J.; U.S. Geological Survey. National Land Cover Database (NLCD) 2019 Products (ver. 2.0, June 2021): U.S. Geological Survey Data Release. 2021. Available online: https://www.sciencebase.gov/catalog/item/5f21cef582cef313ed940043 (accessed on 20 April 2025).
- Marschner, F.J. The Original Vegetation of Minnesota. 1930. Available online: https://gisdata.mn.gov/dataset/biota-marschner-presettle-veg (accessed on 16 July 2023).
- Comer, P.J.; Albert, D.A.; Wells, H.A.; Hart, B.L.; Raab, J.B.; Price, D.L.; Kashian, D.M.; Corner, R.A.; Leibfreid, T.R.; Austin, M.B.; et al. Michigan’s Presettlement Vegetation, as Interpreted from the General Land Office Surveys 1816–1856. Michigan Natural Features Inventory, Lansing, MI. 1995. Available online: https://mnfi.anr.msu.edu/reports/MNFI-Report-1995-06.pdf (accessed on 14 April 2025).
- Brady, T. The Mystery of a Map and a Man. 2003. Available online: https://apps.dnr.state.mn.us/volunteer_index/api/v1/article_pdf?id=1448 (accessed on 14 April 2025).
- McLachlan, J. Settlement Trees, Illinois Level 0 ver 0. Environmental Data Initiative. 2020. Available online: https://portal.edirepository.org/nis/mapbrowse?packageid=msb-paleon.28.0 (accessed on 15 November 2023).
- McLachlan, J. Settlement Trees, Indiana Level 0 ver 0. Environmental Data Initiative. 2020. Available online: https://portal.edirepository.org/nis/mapbrowse?packageid=msb-paleon.27.0 (accessed on 15 November 2023).
- McLachlan, J. Settlement Trees, Southeastern Michigan Level 0 ver 0. Environmental Data Initiative. 2020. Available online: https://portal.edirepository.org/nis/mapbrowse?packageid=msb-paleon.29.0 (accessed on 15 November 2023).
- McLachlan, J.; Williams, J. Settlement Trees, Southern Michigan Level 0 ver 0. Environmental Data Initiative. 2020. Available online: https://portal.edirepository.org/nis/mapbrowse?packageid=msb-paleon.30.0 (accessed on 15 November 2023).
- Williams, J.; McLachlan, J. Settlement Trees, Minnesota Level 0 ver 0. Environmental Data Initiative. 2020. Available online: https://portal.edirepository.org/nis/mapbrowse?packageid=msb-paleon.33.0 (accessed on 15 November 2023).
- Mitchell, K. Quantitative Analysis by the Point-Centered Quarter Method. 2023. Available online: https://faculty.wallin.wwu.edu/envr442/pdf_files/PCQM.pdf (accessed on 10 April 2025).
- U.N. Food and Agriculture Organization [FAO]. Global Lakes and Wetlands Database (GLWD). 2023. Available online: https://www.fao.org/land-water/land/land-governance/land-resources-planning-toolbox/category/details/en/c/1043160/ (accessed on 17 November 2023).
- Burns, R.M. Silvicultural Systems for the Major Forest Types of the United States; U.S. Department of Agriculture, Forest Service: Washington, DC, USA, 1983.
- McClain, W.E. Prairie Establishment and Landscaping. Division of Natural Heritage, Illinois Department of Natural Resources. 2003. Available online: https://www2.illinois.gov/dnr/publications/documents/00000285.pdf (accessed on 15 November 2023).
- Leitner, L.A.; Jackson, M.T. Presettlement forests of the unglaciated portion of southern Illinois. Am. Midl. Nat. 1981, 105, 290–304. [Google Scholar] [CrossRef]
- Hutchison, M.D. The barrens of the Midwest: An historical perspective. Castanea 1994, 59, 195–203. [Google Scholar]
- Brugam, R.B.; Kilburn, P.D.; Luecking, L. Pre-settlement vegetation of Greene, Jersey and Macoupin Counties along the prairie/forest border in Illinois. Trans. Ill. State Acad. Sci. 2016, 109, 9–17. [Google Scholar]
- Cottam, G. The phytosociology of an oak woods in southwestern Wisconsin. Ecology 1949, 30, 271–287. [Google Scholar] [CrossRef]
- Lindsey, A.A. Vegetation of the drainage-aeration classes of northern Indiana soils in 1830. Ecology 1961, 42, 432–436. [Google Scholar] [CrossRef]
- Parker, A.A. Trip to the East and Texas. White and Fisher, Concord, NH. 1835. Available online: http://gutenberg.org/cache/epub/53648/pg53648-images (accessed on 8 February 2024).
- Hanberry, B.B.; Noss, R.F. Locating potential historical fire-maintained grasslands of the eastern United States based on topography and wind speed. Ecosphere 2022, 13, e4098. [Google Scholar] [CrossRef]
- Owen, D.D. Report of a Geological Reconnoissance of the State of Indiana. Walker, Indianapolis, Indiana. 1859. Available online: https://babel.hathitrust.org/cgi/pt?id=nyp.33433009901053&seq=7 (accessed on 8 February 2024).
- Butler, A.W. Indiana: A century of changes in the aspects of nature. Proc. Indiana Acad. Sci. 1895, 5, 31–42. [Google Scholar]
- Lindley, H. Indiana as Seen by Early Travelers. Indiana Historical Commission, Indianapolis, IN. 1916. Available online: https://www.loc.gov/item/17027081/ (accessed on 9 February 2023).
- Owen, R. Report of a Geological Reconnoissance of Indiana. Dodd, Indianapolis, Indiana. 1862. Available online: https://babel.hathitrust.org/cgi/pt?id=uc1.b4170402&seq=15 (accessed on 8 February 2024).


Disclaimer/Publisher’s Note: The statements, opinions and data contained in all publications are solely those of the individual author(s) and contributor(s) and not of MDPI and/or the editor(s). MDPI and/or the editor(s) disclaim responsibility for any injury to people or property resulting from any ideas, methods, instructions or products referred to in the content. |
© 2025 by the authors. Licensee MDPI, Basel, Switzerland. This article is an open access article distributed under the terms and conditions of the Creative Commons Attribution (CC BY) license (https://creativecommons.org/licenses/by/4.0/).