Abstract
The likely increase in the frequency and severity of droughts with climate warming will pose an enormous challenge for the conservation of forest biodiversity. Documenting the response of species to recent droughts can inform future conservation actions. Mammals that breed and mature slowly may be especially vulnerable to drought-induced disruption to breeding. The yellow-bellied glider (Petaurus australis, Shaw) is a threatened low-density, arboreal marsupial of eastern Australia. Following a severe drought in 2019, one population had declined by 48% by 2021. The present study investigated whether this population had recovered 3–4 years (2022 and 2023) after that drought. Audio surveys of this highly vocal species were conducted at 42 sites, sampling > 1000 h per year, and producing recordings of 2038–2856 call sequences. The probability of occupancy varied little across the two survey years (0.92–0.97). Local abundance in 2023 had returned to pre-drought levels (45% of occupied sites had ≥3 individuals compared to 6% in 2021). These findings show a recovery from a drought-induced decline required at least 3 years, in keeping with the slow life history traits of this species. This study highlights the importance of considering a species’ life history strategy when evaluating its sensitivity to drought.
1. Introduction
Droughts are known to impair breeding and increase mortality in many vertebrate species, e.g., [1,2,3,4,5,6]. Given that droughts are predicted to increase in frequency and severity with climate warming [7,8,9,10], it is likely that such events will destabilise the populations of many vertebrate species, particularly those already under pressure from other threats such as habitat fragmentation and introduced predators [11,12]. Therefore, the conservation of biodiversity requires a better understanding of how species respond to climate variability.
Terrestrial mammals are an important group of vertebrates in which to understand responses to climate variability because many species have been the subject of detailed long-term studies [13], they encompass a range of life history strategies [14], and many species are listed as threatened [15]. Despite this, a recent review of demographic responses to climate variation in terrestrial mammals identified substantial deficiencies in knowledge, including among species regarded as sensitive to climate change [13]. The obvious response is for new detailed demographic studies to be conducted. This should include investigations that attempt to understand the mechanisms that drive complex demographic responses to climate variability and particularly drought.
Life history traits are important drivers of population dynamics [16]. These traits, in general, can be divided along a fast-slow continuum, whereby fast is characterised by high fecundity and short development times, and slow is characterised by low fecundity and long development times [17]. This characterisation of traits is of value in understanding responses to climate variability which will influence survival and reproduction. There is a suggestion in primates that species with slow demographic rates may be buffered from climate variability [12]. However, a more detailed investigation revealed that among two co-existing species with a slow life history strategy, there was strong evidence of adverse response to drought but manifesting through different pathways of infant mortality and reproduction [18]. Differences in diet were implicated as a potential driver of this pattern. This highlights that we need detailed information for any threatened species to achieve effective conservation.
The yellow-bellied glider (Petaurus australis; 560 g) (Figure 1) is a vulnerable, group-living, arboreal marsupial of eastern Australia that is threatened by habitat clearing and fragmentation, wildfires and climate change [15,19]. Climate modelling predicts large contractions in its geographic range, even under a low warming (1 °C) scenario [20]. Therefore, knowledge of its response to drought should greatly inform its conservation. A recent study [21] documented a drought-induced decline in abundance. The study population continued to decline in abundance two years after the drought had ended. The mechanism underlying this decline appears to have been both reduced breeding and increased subadult mortality, due to typical annual fecundity of <1 young and sexual maturation of >1 year (i.e., slow life history traits) [22]. Adult mortality appeared unaffected because site occupancy remained unchanged through the drought. This species is nocturnal, occupies large territories of 30–80 ha and is difficult to trap [22,23]. These characteristics make it difficult to directly document changes in breeding and subadult mortality such that they must be inferred. Nonetheless, indirect methods can make an important contribution to understanding how climate variability influences this species and, therefore, contribute to its long-term conservation. This species has a specialised diet of plant and insect exudates supplemented by invertebrates, with exudates predicted to be adversely affected by drought [21].

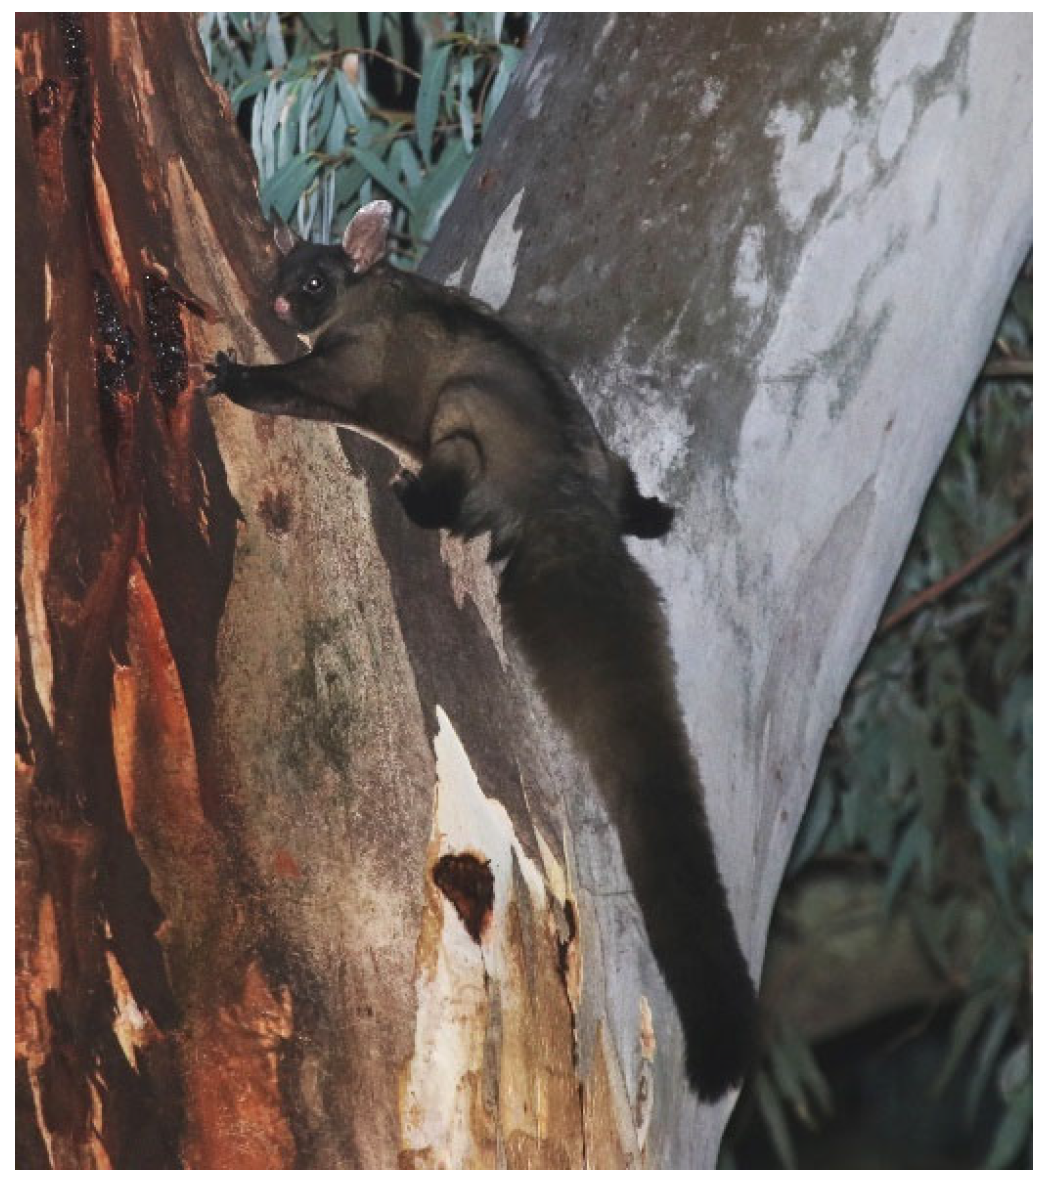
Figure 1.
A yellow-bellied glider on the Bago Plateau, south-west New South Wales. Image: Rohan Bilney.
The recent study continued for two years after the drought had ended, but population abundance at that time was at an 8-year low. Given that the local population of the yellow-bellied glider is estimated to be large, and rainfall had been well above average in the two years after the drought [21], I would predict that population recovery to pre-drought abundance should be observed within another two years if a slow life history was responsible for the absence of a recovery. If recovery was not observed, then other causes would need to be investigated. Therefore, the aim of this study was to describe the abundance of this species over an additional two years. I ask whether there is evidence that abundance has returned to the pre-drought level.
2. Materials and Methods
2.1. Study Area
This study was conducted in Richmond Range National Park (NP) (28°43′19′′ S, 152°44′54′′ E; 15,657 ha), in north-east New South Wales (NSW), Australia. This reserve was gazetted in 1997. Prior to this it was managed for timber production. The reserve contains broad areas of open sclerophyll forest and expanses of World Heritage-listed rainforest. The yellow-bellied glider relies on the open forest (for further details see [21]) (Figure 2).

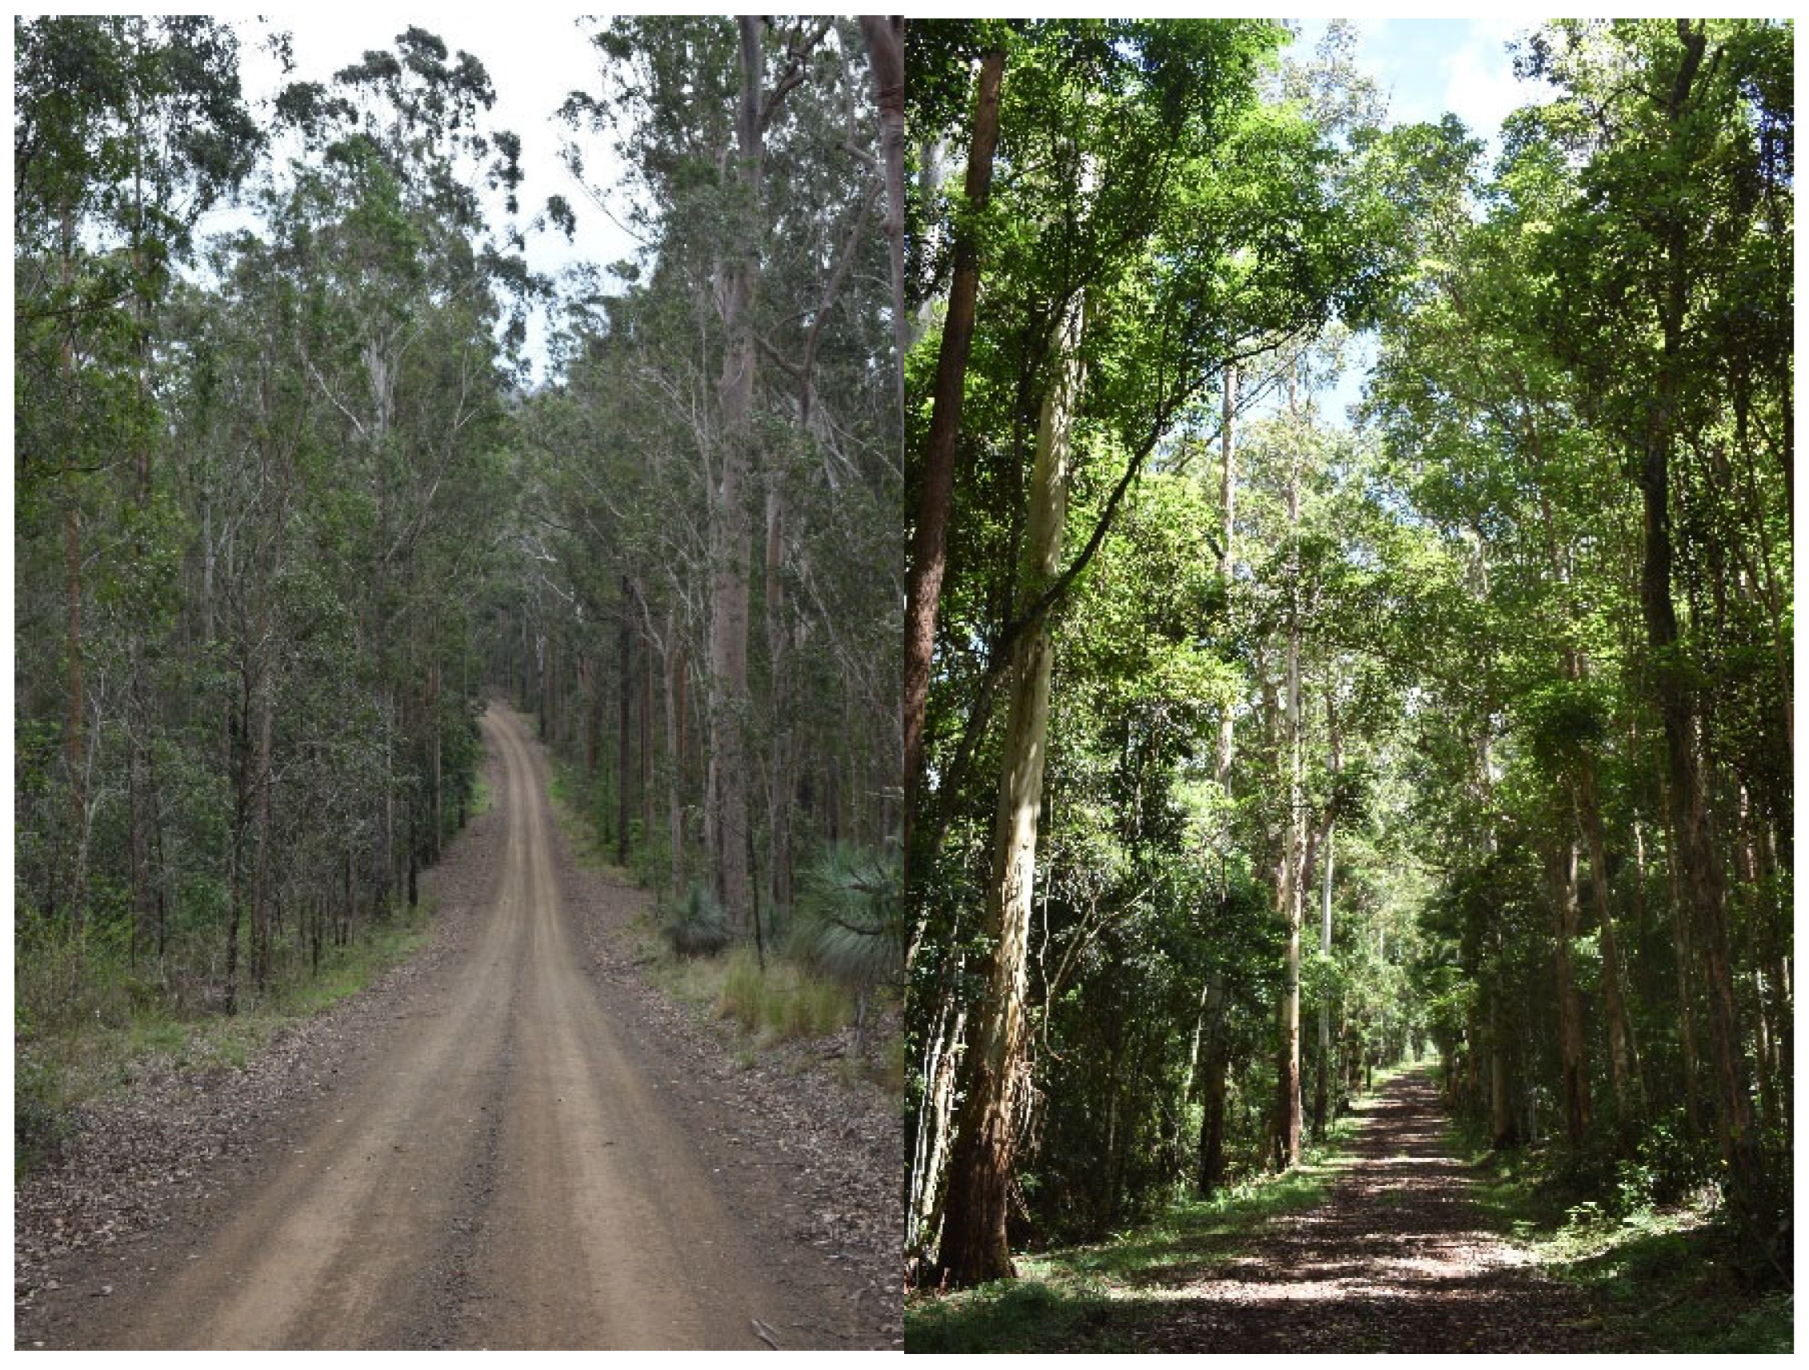
Figure 2.
Eucalypt forest survey sites in Richmond Range National Park.
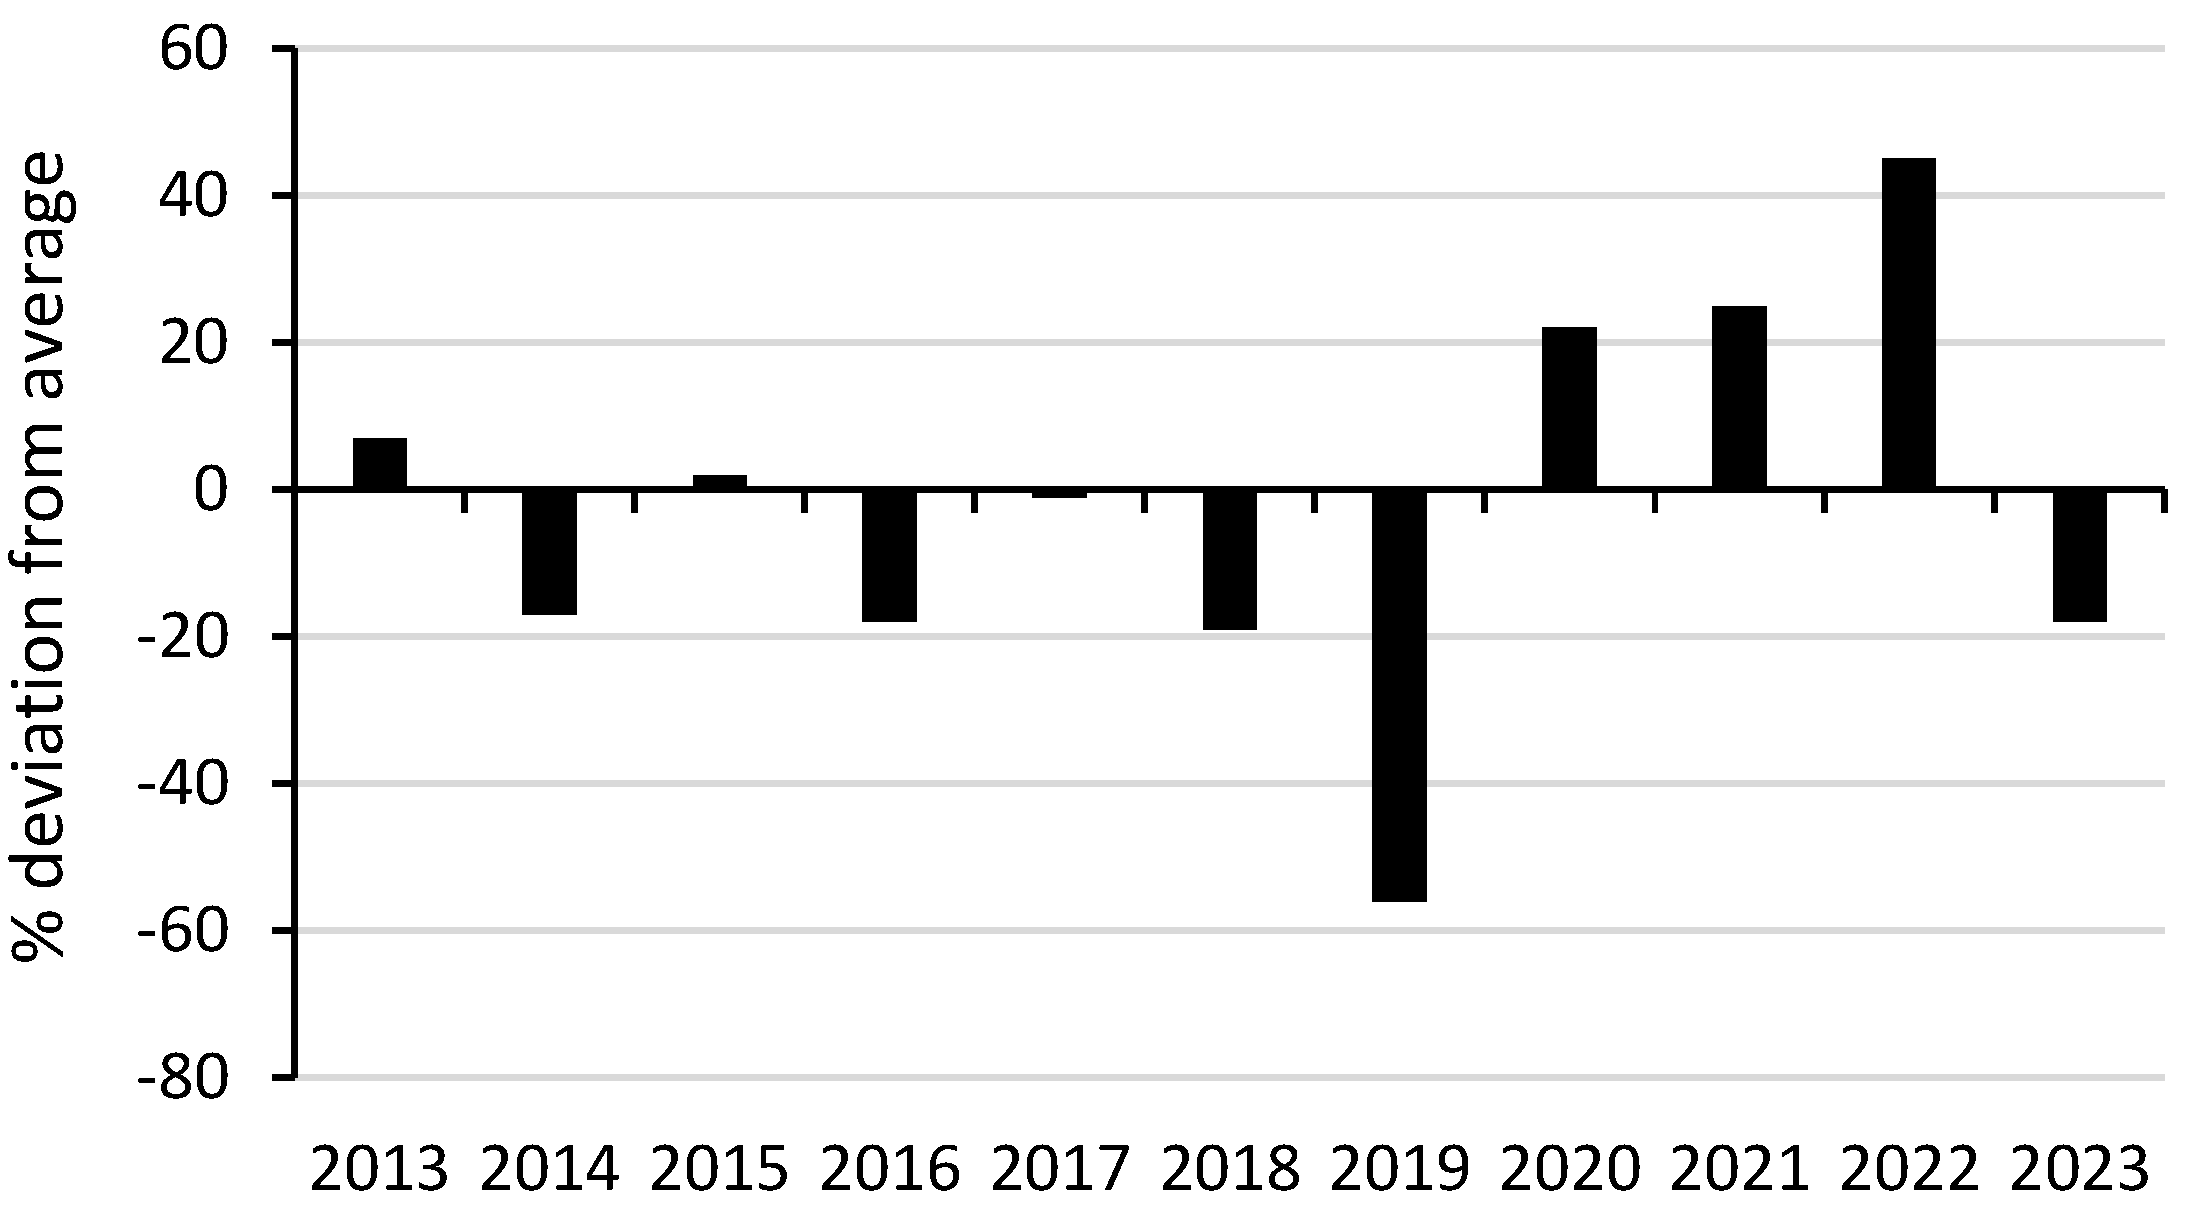
Average annual rainfall averaged 1032 mm (1914–2024) (Bonalbo Post Office, 57,003, 10 km west) (Bureau of Meteorology; Available online: http://www.bom.gov.au/jsp/ncc/cdio/weatherData/av?p_nccObsCode=139&p_display_type=dataFile&p_stn_num=057003 (accessed on 11 July 2025)). Surveys described in Goldingay et al. (2023) [21] were conducted during 2014–2021. Surveys in this study were conducted during 2022–2023. Annual rainfall varied dramatically over the 10 years when surveys were conducted (Figure 3). In 2019, it was the lowest in >100 years in 2019. In 2022, it was 145% of the annual average.
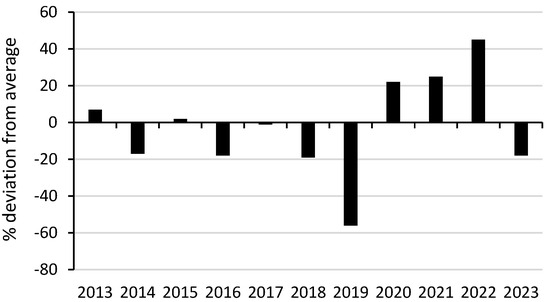
Figure 3.
Rainfall deviation from the annual average. Data source: Bureau of Meteorology, www.bom.gov.au.
2.2. Animal Surveys
Survey sites were located along all accessible unsealed roads in eucalypt forest. The majority (>80%) of survey sites in the present study had not experienced wildfire since 1995. Sites were spaced an average of 780 m apart so that animals detected on adjacent transects belong to different social groups. The earlier study [21] (Goldingay, unpublished observations) confirmed that glider groups were frequently detected concurrently on adjacent transects. This survey relied on the use of audio-recorders to detect the target species. In the earlier study sites contained a 200 m long transect that was searched during a 20 min spotlighting session on three different nights each year, between September and December. Calls of the yellow-bellied glider and the powerful owl (Ninox strenua, Gould) were broadcast during these surveys to elicit calls from yellow-bellied gliders. Loud calls serve to advertise its territories [24]. Powerful owls may occasionally prey on gliders. Its calls may elicit a vocal response from gliders [22,25].
In this study one audio-recording unit (Song Meters; Wildlife Acoustics, Maynard, MA, USA; www.wildlifeacoustics.com/ (accessed on 13 July 2025)) was installed 1.5 m high on a tree at each site. The units included the SM3 (www.wildlifeacoustics.com/uploads/user-guides/SM3-USER-GUIDE-20200805.pdf (accessed on 13 July 2025)), SM4 (https://www.wildlifeacoustics.com/uploads/user-guides/SM4-USER-GUIDE-EN-2024-06-11.pdf (accessed on 13 July 2025)) and SM-Mini (https://www.wildlifeacoustics.com/uploads/user-guides/Song-Meter-Mini-EN-01032024.pdf (accessed on 13 July 2025)). Units recorded in a 16-bit format at a sampling rate of 24 kHz. Glider calls may be detected up to at least 100 m away. They were programmed to record for 5 h after dark to coincide with the highest calling activity [24,26]. They were left in place for up to 4 weeks. I sampled 42 sites in 2022 and 41 sites in 2023 (one unit malfunctioned) during September to December. Recordings from five non-consecutive nights were analysed to record activity by yellow-bellied gliders. Nights of wet or windy conditions were ignored. Spectrograms from the recordings were generated in the audio software Audacity (version 2.0.2). Calls of the yellow-bellied glider were readily located by their unique spectral signature [26,27]. There are three common call types: full call (1–3 shrieks followed by several gurgles), gliding gurgle (gurgle only) and short call (short shriek only, often repeated) [24,26,28]. The time and type of call, and whether located near (loud), far (soft) or at an intermediate distance were recorded for each call. Gliding gurgles followed quickly by full calls, and repeated short calls were treated as a single call sequence when enumerating the total number of calls per period. The timing and loudness of the calls over short periods (<5 min) was used to estimate the number of individuals present at a site each night. Individuals may call in rapid succession, with some calls overlapping each other [24] (Goldingay, unpublished data; see Supplementary Materials). Although not absolute, the maximum number detected over five non-consecutive nights in a year allows local abundance to be indexed for comparison among years. The number recorded was divided into two classes of abundances (≤2 or ≥3 individuals), to distinguish between glider social groups with evidence of breeding and those without evidence. To avoid a disproportionate influence by sites where gliders were rarely detected, I only included sites where gliders were detected on at least 3 different nights or where there were >30 calls in total.
2.3. Multi-Season Occupancy Analysis
I used multi-season occupancy [29] to investigate occupancy dynamics. The basic multi-season occupancy model includes four parameters estimated as probabilities: site occupancy (psi, ψ), detection (p), colonisation (gamma, ɣ) and local extinction (eps, ɛ). Modelling was conducted with program PRESENCE version 15.9 (USGS Patuxent Wildlife Research Centre, Laurel, MD 20708, USA). For each survey site I constructed a detection history to reflect whether the species was detected (1) or not (0), or if a site was not surveyed (–) due to a device malfunction, during the five survey occasions (nights) over the two years. I constructed models to investigate whether occupancy was influenced by site covariates (some derived by GIS) that were influential in the previous study (see [21] for details); elevation; number of different forest types (i.e., associations of different tree species); percentage cover of rainforest within a 200 m buffer of a 200 m long transect at each site; and two additional covariates, the number of hollow-bearing trees with at least one hollow entrance suited to a yellow-bellied glider (entrance diameter 6–15 cm) within a 0.8 ha plot at each site and the number of trees > 60 cm dbh (diameter at breast height). The covariate values were centred by subtracting the mean and dividing by the standard deviation. I also investigated whether the probability of detection was equivalent or differed between the two years.
Models were compared using Akaike’s Information Criterion that was corrected for small sample size (AICc) [30]. Ranking by AICc value (from lowest value) provides an indicator of the model with the best fit to the data. The difference in AICc (i.e., ∆AICc) between the top model and any other model indicates the relative support to explain the data [31]. Models that differ by <2∆AICc are considered equally plausible. Increasing values of ∆AICc indicate less support. If adding a covariate to a well-supported model does not improve model fit by >2ΔAICc it should be considered uninformative and omitted (see [31]). The procedure used to build models started with comparing a null detection model to a year-varying detection model. If one showed a better fit (<2∆AICc) it was then used to fit occupancy covariates. Covariates were then fit to colonisation and extinction parameters. Models that did not converge were excluded.
2.4. Ethics Statement
Approvals for this research were obtained from the Southern Cross University Animal Care & Ethics Committee (ARA 22/20, 23/32) and a scientific permit from the NSW government (SL100330).
3. Results
3.1. Animal Detections and Occupancy
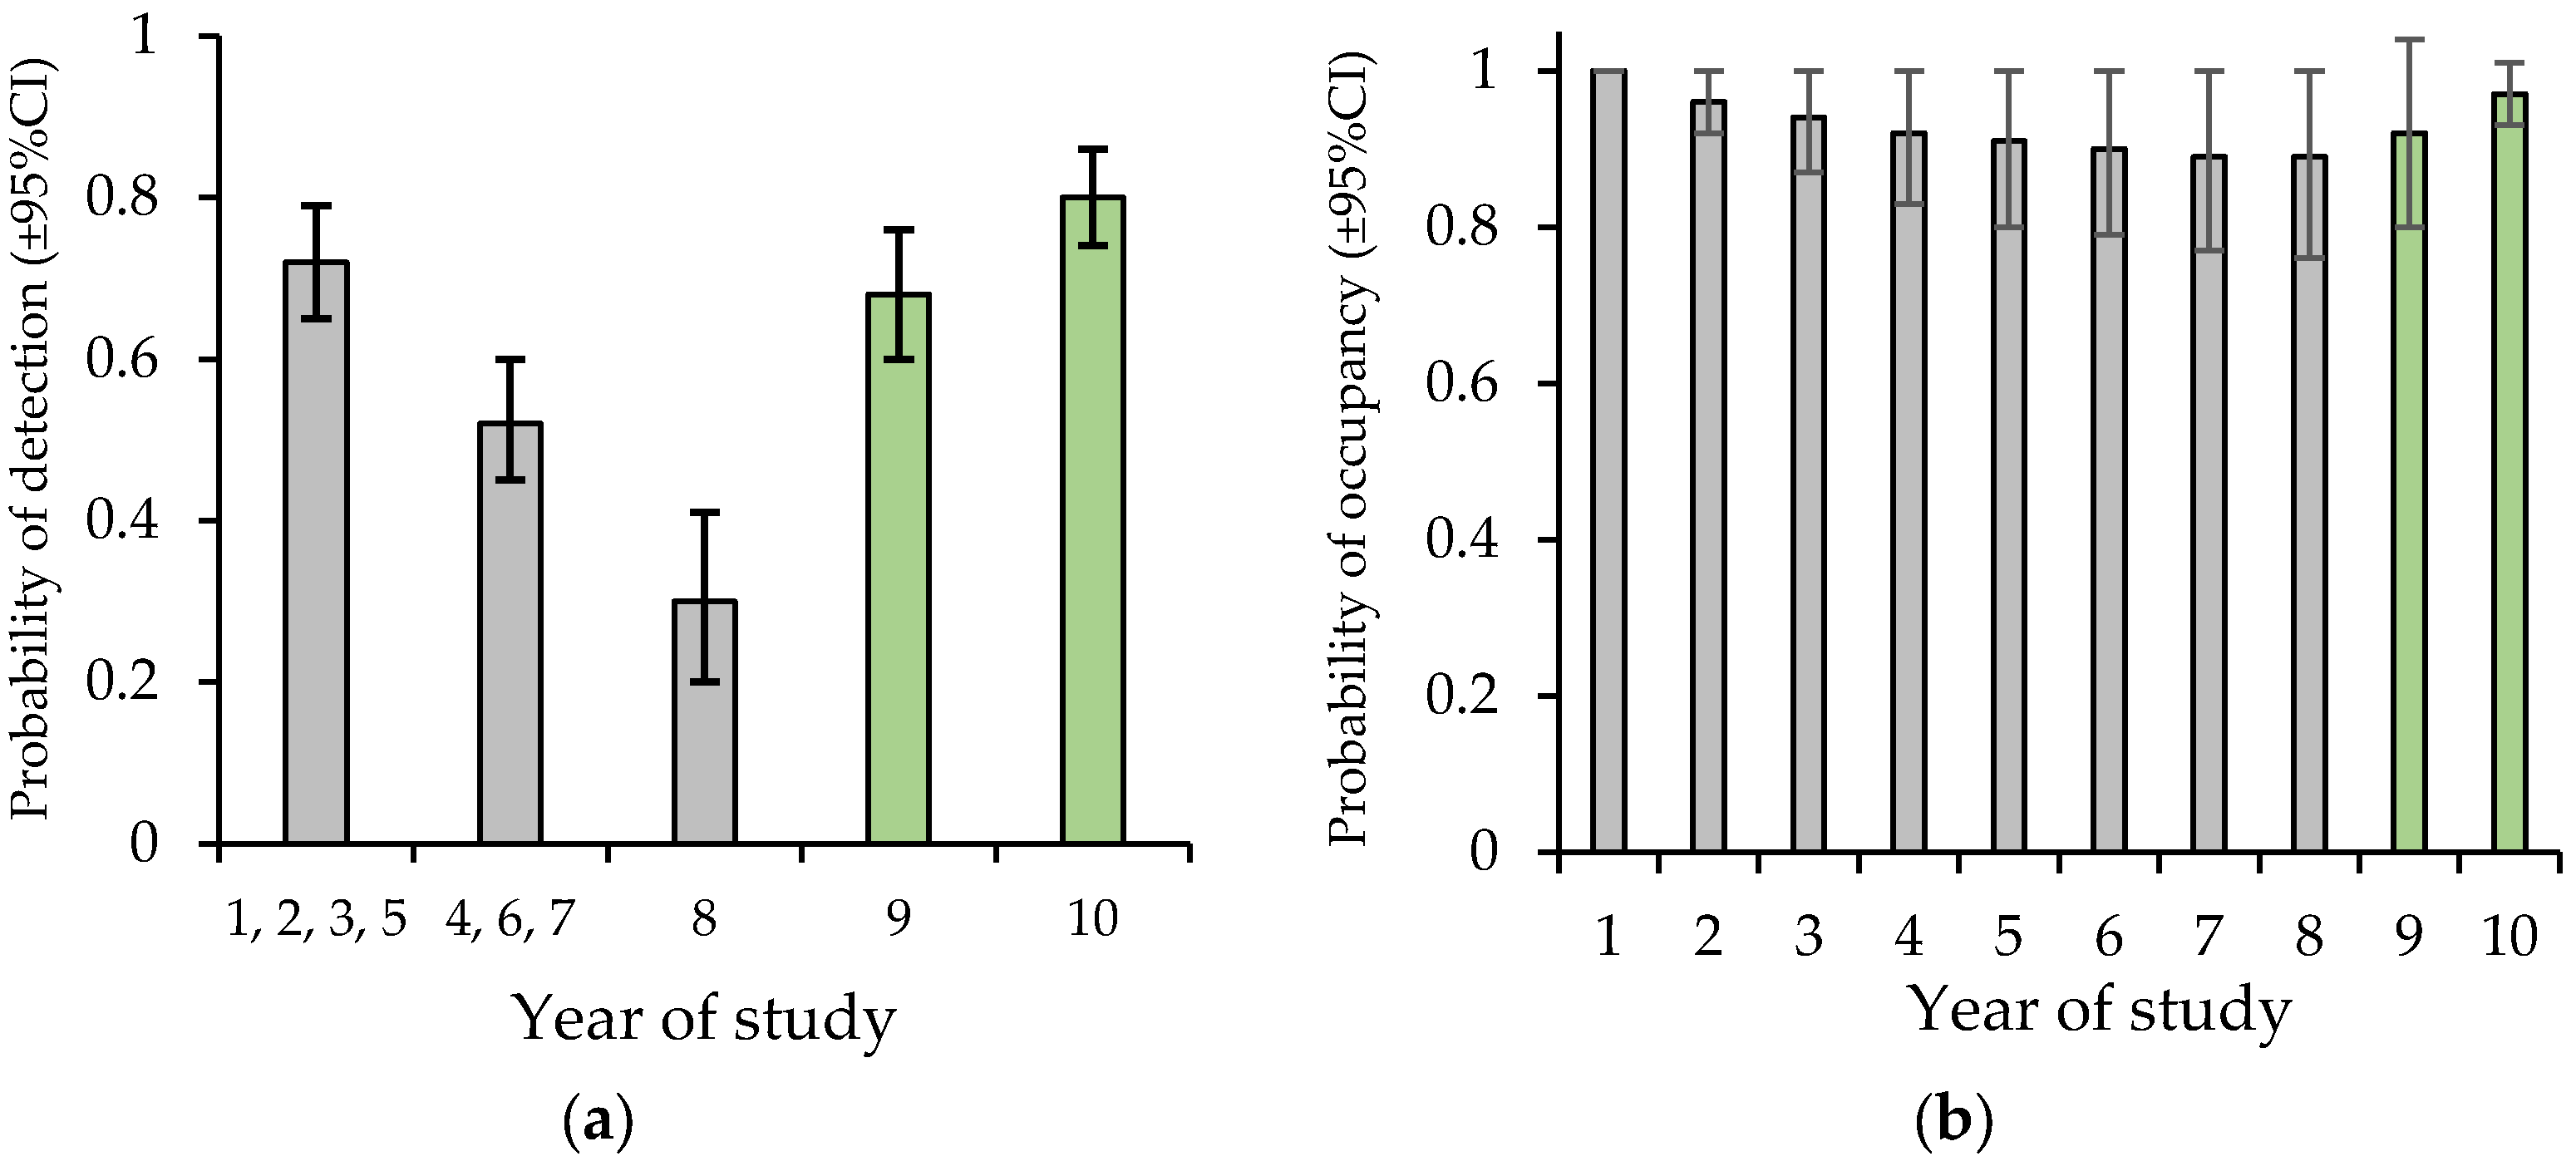
A total of 2038 call sequences of the yellow-bellied glider were recorded in 2022 and 2856 in 2023. This produced 461 detections of individuals (sum of individuals assumed detected per night per site) across 93% of transects. ‘Naïve’ occupancy (% of transects with detections) was 83% in 2022 and 95% in 2023. There was strong evidence that allowing detection to vary with audio recorder-type fit the data better than a null model (ΔAICc = 19.89). Allowing detection to also vary by year showed no improvement in model fit. A detection model that contrasted the SM3 to the other recorders, showed a better fit to the data than a model contrasting the three recorders (ΔAICc = 2.61). In this model the probability of detection was 0.59 ± 0.04 with the SM3 and 0.83 ± 0.03 with the SM4 or SM-mini. To enable comparison of detection estimates with the 8-year study of Goldingay et al. (2023) [21], detection estimates were derived from a year-varying model without including recorder type. This showed that the probability of detection based on all the audio recorders was equivalent to or higher than the highest previous estimates (Figure 4a).
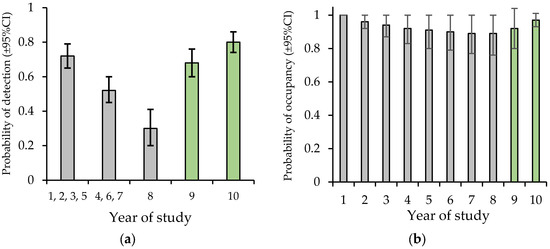
Figure 4.
Contrasting the estimates of detection and occupancy of this study (green bars) from audio-recorders with earlier estimates (grey bars) based on spotlighting in Goldingay et al. (2023) [21]. Year 1 was 2014. The drought was most severe in year 6 (2019). (a) The probability of nightly detection. (b) The probability of occupancy. In years 9 and 10, habitat covariates were held at their means.
There was evidence to suggest a model that included two site covariates influenced the probability of initial occupancy in 2022 (Table 1). Based on model weight the top model had 3.9 times more support than the next model. The number of forest types had a positive influence (β = 1.74 ± 0.85, SE) on initial occupancy whereas the number of hollow-bearing trees had a negative influence (β = −1.32 ± 0.59). The estimate for the probability of extinction converged on 0, so it was fixed at 0 in the final model. No covariates influenced the probability of colonisation which was estimated at 0.66 ± 0.20. In the final model with the two covariates held at their means, the probability of occupancy was estimated at 0.92 in 2022 and 0.97 in 2023 (Figure 4b).

Table 1.
Model selection results using AICc (see methods) to compare the top five models for four parameters for the yellow-bellied glider in Richmond Range. Covariates: FTs, number of forest types; HBTs, number of live hollow-bearing trees; Tr60, number of trees > 60 cm dbh; (.), null model; SM3, SM3 contrasted with other recorders; W, model weight; k, number of parameters.
3.2. Animal Abundance
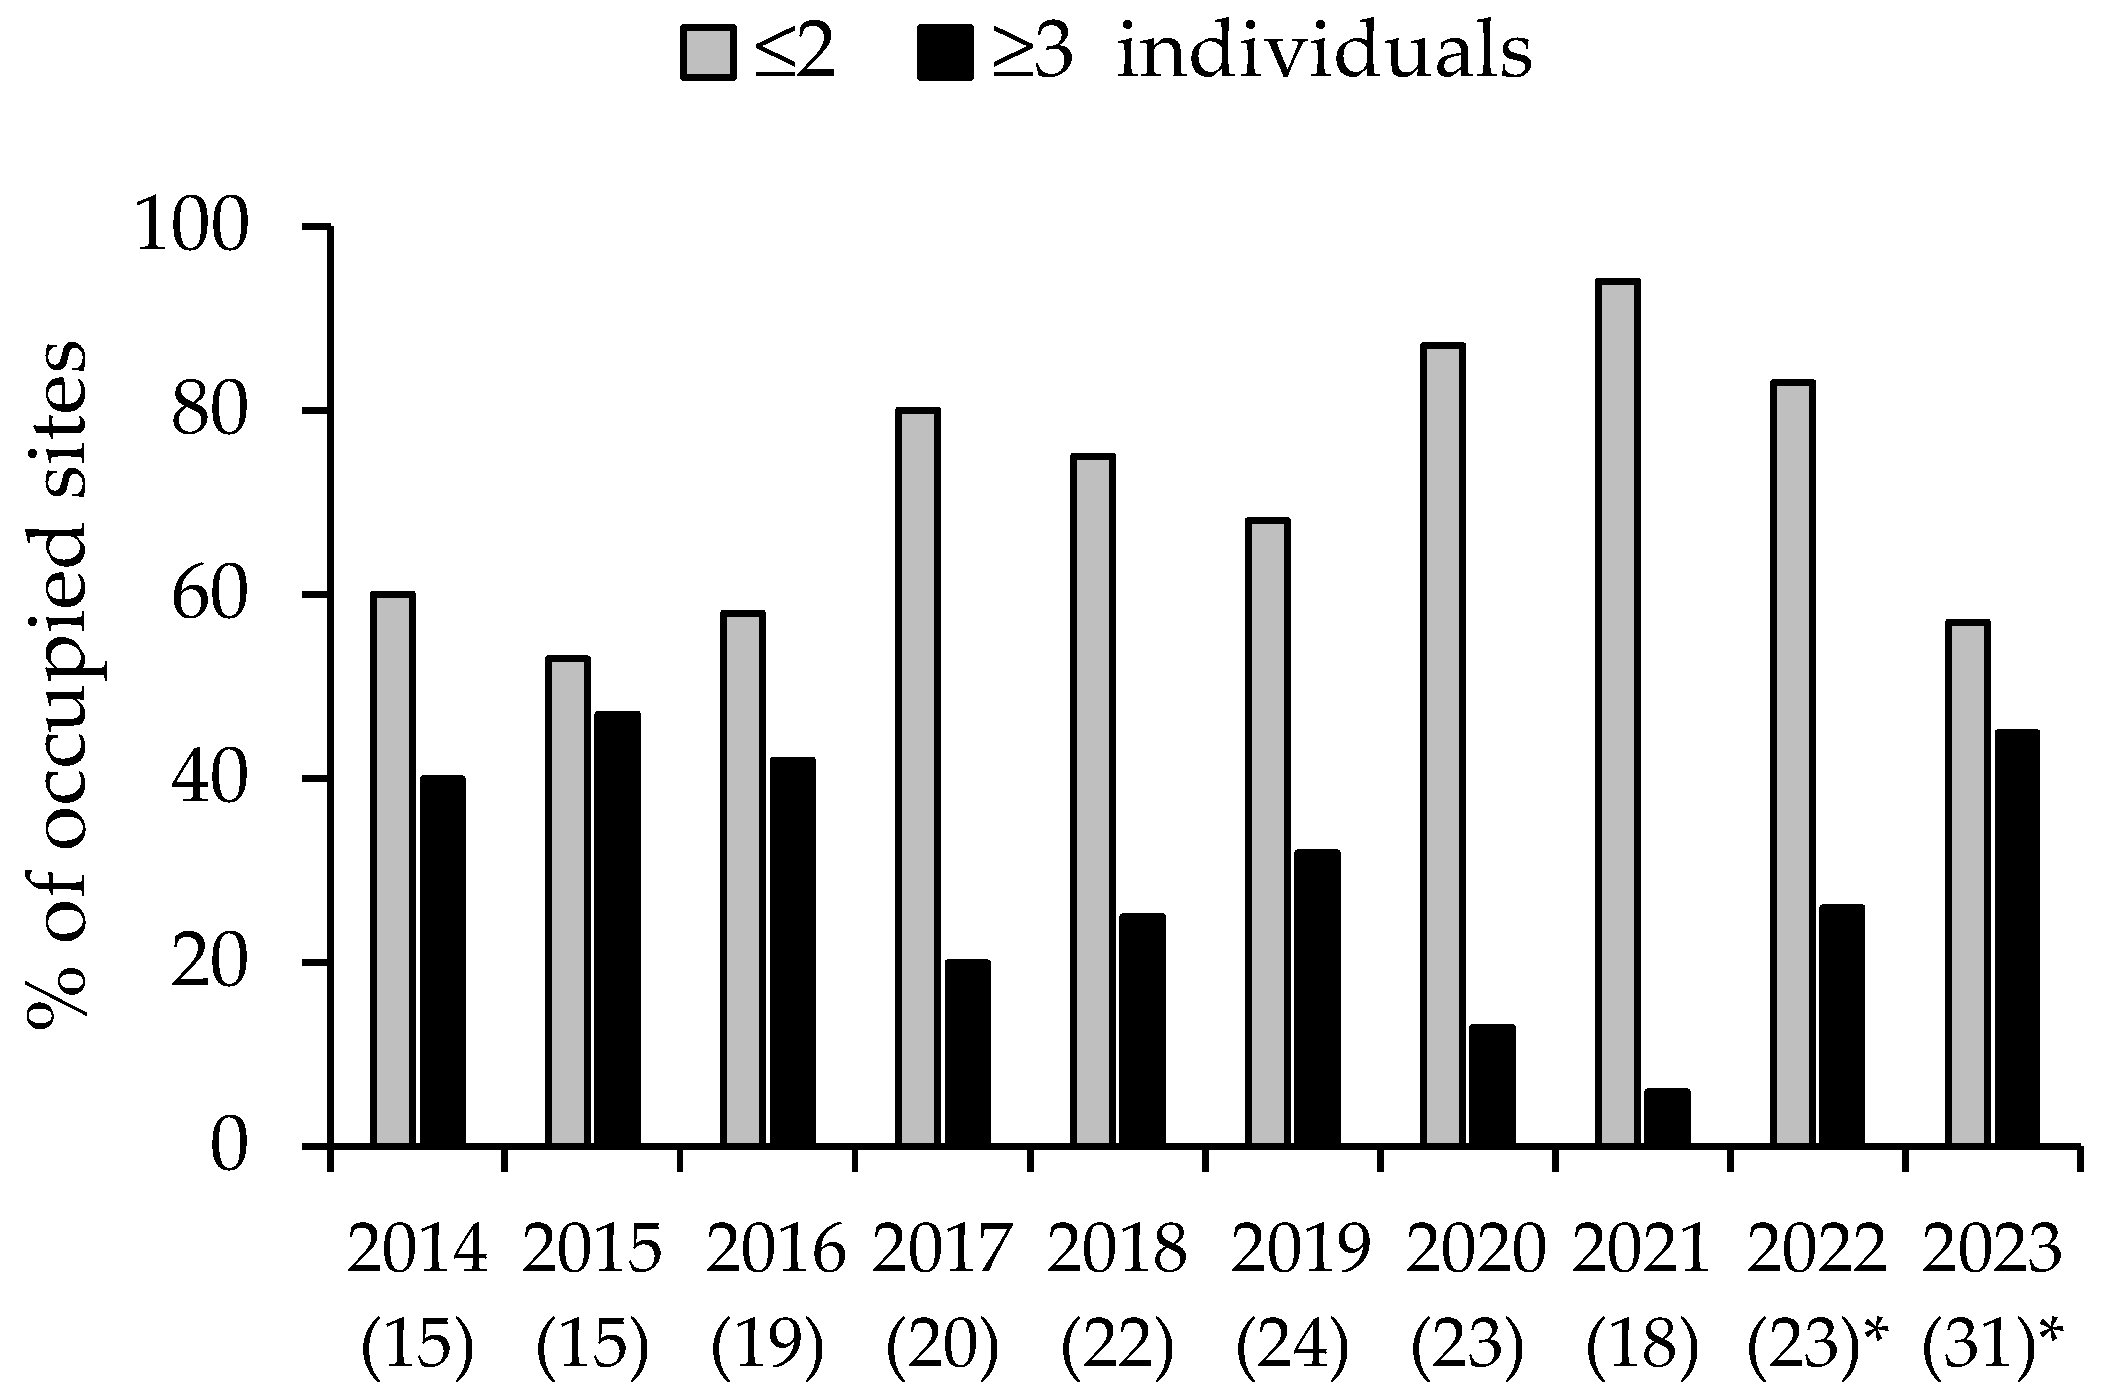
Mean site abundance in 2022 (1.6 ± 0.20) was significantly different (t2 = 3.18, d.f. = 40, p = 0.003) from that in 2023 (2.0 ± 0.20). Comparison of the two abundance classes (≤2 or ≥3 individuals) revealed that 26% of 23 sites in 2022, and 45% of 31 sites in 2023 contained ≥3 individuals. A comparison of the frequency of the two abundance classes in 2023 (i.e., year 10) with 2021, the last year of the earlier study (i.e., year 8), revealed a significant dependence on year (Fisher’s exact test, 2-tailed, p = 0.004), with ≥3 individuals detected at only 6% of occupied sites in 2021. Thus, the decline in the largest abundance class that was most extreme in 2021 had returned to pre-drought levels in 2023 (Figure 5).

Figure 5.
Local abundance classes (maximum number detected: ≤2 and ≥3 individuals) of the yellow-bellied glider across survey sites. Values in brackets show the number of survey sites (which increased over time) where gliders were detected. Values during 2016–2021 are from Goldingay et al. (2023) [21]. * These values are based on sites where gliders were detected by audio recorder on at least 3 of 5 survey nights or at least 30 calls were recorded.
4. Discussion
4.1. Population Monitoring
Long-term studies that extend fully across drought events, through both decline and recovery, are required to understand how populations respond, and are most useful if the life history traits that drive responses are identified, e.g., [5,18]. To document how mammals respond to drought events usually requires the capture and marking of individuals so that reproduction can be recorded and survival estimated, e.g., [3,32,33]. This is hampered in the yellow-bellied glider because it is nocturnal, difficult to capture, and has small social groups (usually only 2–3 individuals) that occupy large territories (usually >50 ha) [22]. Where trapping and nocturnal observations have occurred, typically only three social groups have been studied, producing incomplete knowledge and over relatively short periods (3–5 years) [23,34,35].
The present study has attempted to overcome the above short-comings by sampling a relatively large number of social groups (20–30) but using indirect methods to document breeding (i.e., group size) and adult survival (occupancy). Using this approach I previously documented a decline in this yellow-bellied glider population that coincided with a severe drought, but which had not recovered to pre-drought abundance even two years after the drought despite above-average rainfall [21]. At that time the probability of detection was less than half what it was pre-drought (Figure 4a). In contrast, the probability of occupancy appeared unchanged before, during and after the drought (Figure 4b). This lack of change probably reflects that individuals are relatively long-lived (up to 6 years; [23,36]), such that whilst breeding frequency and subadult survival were reduced due to the drought, adult survival was not. This is what has been observed in some longer-lived primates [12]. However, it is not universal with one population of ring-tailed lemurs (Lemur catta) suffering >30% adult mortality following a drought [32]. Adult survival of yellow-bellied gliders would likely decline during a longer drought.
The use of audio recorders proved highly effective in sampling the yellow-bellied glider as it has in other studies [27,37]. Although the probability of nightly detection varied with recorder type (0.53–0.83), it was much higher than in other studies that used the more sensitive recorder (0.24–0.42, with no rain [27]; 0.14–0.29 [37]), which probably reflects the local abundance of gliders. These other studies found seasonal differences in detection (primarily rain-induced in [27]); however, calling rate varies with food type [24] such that seasonal differences may reflect diet as well as local abundance. Regardless, the high detection values were adequate to detect the species if present (see below). Surveys were standardised to spring and summer in this and the preceding study [21]. This restriction on when sampling occurred reduced the likelihood that fluctuations in group sizes within a year (i.e., independence of subadults) would confound comparisons among years.
The probability of initial occupancy in this study was positively influenced by the number of forest types, reflecting food diversity (see [22]). Initial occupancy was negatively influenced by the number of hollow-bearing trees, which seems counterintuitive for a species dependent on tree hollows for shelter and to raise young, such that the most plausible explanation is that it must reflect some aspect of foraging habitat (e.g., tree die-off may be more prevalent where more hollow-bearing trees occur). This covariate was not influential in the earlier study [21] and generally does not influence this species elsewhere [22]. Further research is needed to investigate the driver of this pattern.
4.2. Life History Traits
Because this study has relied on indirectly determining adult survival and breeding it is not possible to know the influence of the drought on offspring production (i.e., female fertility) or subadult survival. Consequently, it is not known whether females stopped producing young during and after the drought, which then led to lower group sizes as subadults dispersed, or whether subadults incurred much higher-than-normal mortality. To some extent this does not matter but a combination of both appears to explain why recovery required at least 3 years. The salient point is that species with slow rates of offspring production and long maturation times can be expected to require several years for their populations to fully recover from a drought, e.g., [32]. These traits may also make such species more vulnerable to extinction [38]. Slow recovery from a drought may have serious consequences for yellow-bellied glider populations subject to other threats such as wildfire, logging or habitat fragmentation. It also suggests yellow-bellied glider populations exposed to longer or successive droughts can be expected to incur greater losses. In the present study the three years immediately post-drought had substantially above average rainfall which may have produced an idiosyncratic recovery that may not be observed following future droughts. Studies of other populations are required to determine how general this pattern is.
4.3. The Influence of Diet
The present study documented a return to pre-drought abundance after at least 3 years. Recovery by another yellow-bellied glider population from another drought (detections per 100 h of spotlighting were 2.5 times higher two years after the drought compared to in three drought years; [39]) suggests faster recovery than in the present study. This may have been due to profuse flowering that occurred at that location. Some primates have been shown to have species-specific responses to drought at the same location, with differences in diet being implicated [18]. Therefore, differences in diet among yellow-bellied glider populations (e.g., a reliance on tree sap compared to a reliance on nectar at different locations; see [22]) may induce different sensitivities to drought and/or different recovery times. This can only be resolved through further study. An important question is whether exudivorous mammals, in general, are more predisposed to substantial declines during droughts because their foods have high water content, so production is reliant on trees having access to adequate soil moisture [21].
4.4. Limitations of This Study
This study attempts to integrate detections of yellow-bellied gliders over two years with detections in the same study area in the preceding eight years (coinciding with a severe drought) presented in another study [21]. There are three potential limitations in performing this: 1. A reliance on audio recorders in the present study when the earlier study relied on detections during spotlighting. 2. The use of different audio recorder types that differed in their probability of detection. 3. Excluding sites with few audio detections when estimating local abundance may introduce bias. The present study extends an occupancy analysis from the previous study [21]. The probability of detection in years 9 and 10 was equivalent to three of the pre-drought years. Occupancy modelling can accommodate variation in the probability of detection to estimate the probability of occupancy. Bias may be introduced if such heterogeneity is not identified [40]. The previous study [21] employed spotlighting and audio recorders concurrently in year 8 and used multi-method occupancy to show that spotlighting alone or combined with audio recorders produced equivalent estimates of occupancy.
Whilst different audio recorder types differed in their probability of detection in this study, there was a mix of types used in years 9 and 10 such that different recorder types have not introduced any bias. Furthermore, there was no evidence that the probability of detection differed between the two years. A legitimate question is whether survey effort was adequate to detect the target species. An equation (see [41]) can be used to calculate how many nights are required to achieve detection with 95% confidence based on the single-occasion detection estimates. This provides evidence that the lower value of the SM3 (0.59) could achieve 95% confidence of detection after four nights whereas the SM4 and SM-mini (0.83) required only two nights. That is, sufficient sampling had occurred in this study with any of the recorders. Simulation results show that estimates are unbiased for detection estimates of at least 0.50 [29].
Human observers can detect the calls of yellow-bellied gliders up to 500 m away [24,26]. The distance over which calls can be detected by audio recorders is unknown but is likely to be much less than for a human observer. Consequently, using audio recorders to score the number of gliders present at a site may be less reliable. Spotlight surveys also included call broadcast which induced responses by gliders. Therefore, rather than simply scoring glider abundance at all sites where calls were detected in this study, an arbitrary threshold of calling records (3 nights or >30 calls) was used to ensure a site could be adequately scored. This might appear to bias the result. However, a far greater number of sites was categorised in 2023 (n = 31) compared to either the drought year (24) or pre-drought years (15–19). Therefore, the comparison of abundance over time should be robust.
4.5. Implications
There are three implications from this study. The first is that a slow life history strategy means slow recovery after a drought and has relevance to many other species. Given predictions that droughts will become more prolonged and more severe under climate warming in eastern Australia [7], slow recovery could be expected to lead to increased vulnerability of yellow-bellied glider populations to extinction. This suggests the need to identify large populations occupying areas where droughts or their effects may be less acute.
A second implication is that the yellow-bellied glider appears to achieve unusually high abundance (outside drought years) in the present study area of Richmond Range National Park. The probability of occupancy was estimated at >0.90 in each of 10 years of study. There are few estimates for other locations, with two estimates of <0.40 [42,43], but one estimate of 0.94 [41]. However, the rate of detection during spotlighting in the latter study was half that detected pre-drought at Richmond Range suggesting lower abundance. Studies are required at many further locations, but it appears the Richmond Range population will be very significant to the conservation of this species. Richmond Range did not experience a wildfire in 2019/20 whereas these wildfires were estimated to have overlapped ~40% of the yellow-bellied glider geographic range [44], including the study area of Wintle et al. (2005) [41].
A third implication is the ability to score the local abundance of yellow-bellied gliders from recordings by audio recorders. Whilst recording the number of individuals present might appear to be more reliably achieved by human observers in the field, this study has demonstrated it can also be performed from recordings. No counts are definitive but provide an index that gives insight into group dynamics. An important feature in using audio recorders is that many hours of recording collected over many nights can be obtained at each site from which to determine the number of individuals at a site. This scoring of abundance can probably be automated given that call recognition software is readily applied, e.g., [37] but would need to be trained to the call repertoire when individuals vocally respond to each other. Another approach would be to identify the unique calls of individuals see [28], but this requires further field trials to ensure accuracy. Some individuals have very distinctive individual calls but whether the calls of all individuals can be distinguished remains to be determined.
5. Conclusions
This study, combined with a previous study [21], documents the occupancy and abundance of a population of Australia’s largest exudivorous mammal over a 10-year period. A severe drought occurred in year 6 and induced a substantial decline in abundance, but not occupancy, that reached its nadir two years after the drought ended. This study was able to demonstrate that abundance had recovered to pre-drought levels in year 10, suggesting at least three years were required to recover from the drought. The lagged decline and recovery reflect slow life history traits. Species with such traits may be predisposed to future declines as rainfall variation increases with climate warming. This study has demonstrated the effectiveness of indirect methods to assess population dynamics in a species that presents enormous challenges with conventional approaches.
Supplementary Materials
The following supporting information can be downloaded at https://www.mdpi.com/article/10.3390/f16081230/s1, Audio S1: Example audio files.
Funding
This research received no external funding.
Data Availability Statement
Data will be made available on request.
Acknowledgments
I thank the local National Park & Wildlife Service officers, Matt Wiseman, Allan Goodwin and Amanda Dudgeon, for their assistance over the course of this study. I thank Jonathan Parkyn and Darren McHugh for assistance with fieldwork during 2014–2021 that enabled the refinement of surveys for this subsequent study. I thank two anonymous referees for comments that helped improve this paper.
Conflicts of Interest
The author declares no conflicts of interest.
References
- Gordon, G.; Brown, A.S.; Pulsford, T. A koala (Phascolarctos cinereus Goldfuss) population crash during drought and heatwave conditions in south-western Queensland. Aust. J. Ecol. 1988, 13, 451–461. [Google Scholar] [CrossRef]
- Young, T.P. Natural die-offs of large mammals: Implications for conservation. Conserv. Biol. 1994, 8, 410–418. [Google Scholar] [CrossRef]
- Fisher, D.O.; Blomberg, S.P.; Hoyle, S.D. Mechanisms of drought-induced population decline in an endangered wallaby. Biol. Conserv. 2001, 102, 107–115. [Google Scholar] [CrossRef]
- Godfree, R.C.; Knerr, N.; Godfree, D.; Busby, J.; Robertson, B.; Encinas-Viso, F. Historical reconstruction unveils the risk of mass mortality and ecosystem collapse during pancontinental megadrought. Proc. Natl. Acad. Sci. USA 2019, 116, 15580–15589. [Google Scholar] [CrossRef] [PubMed]
- Bourne, A.R.; Cunningham, S.J.; Spottiswoode, C.N.; Ridley, A.R. Hot droughts compromise interannual survival across all group sizes in a cooperatively breeding bird. Ecol. Lett. 2020, 23, 1776–1788. [Google Scholar] [CrossRef] [PubMed]
- Campos-Cerqueira, M.; Aide, T.M. Impacts of a drought and hurricane on tropical bird and frog distributions. Ecosphere 2021, 12, e03352. [Google Scholar] [CrossRef]
- Kothavala, Z. The duration and severity of drought over eastern Australia simulated by a coupled ocean–atmosphere GCM with a transient increase in CO2. Environ. Model. Softw. 1999, 14, 243–252. [Google Scholar] [CrossRef]
- Dai, A. Increasing drought under global warming in observations and models. Nat. Clim. Change 2013, 3, 52–58. [Google Scholar] [CrossRef]
- Diffenbaugh, N.S.; Swain, D.L.; Touma, D. Anthropogenic warming has increased drought risk in California. Proc. Natl. Acad. Sci. USA 2015, 112, 3931–3936. [Google Scholar] [CrossRef]
- Cook, B.I.; Mankin, J.S.; Marvel, K.; Williams, A.P.; Smerdon, J.E.; Anchukaitis, K.J. Twenty-first century drought projections in the CMIP6 forcing scenarios. Earth’s Future 2020, 8, e2019EF001461. [Google Scholar] [CrossRef]
- Driscoll, D.A.; Felton, A.; Gibbons, P.; Felton, A.M.; Munro, N.T.; Lindenmayer, D.B. Priorities in policy and management when existing biodiversity stressors interact with climate change. Clim. Change 2012, 111, 533–557. [Google Scholar] [CrossRef]
- Campos, F.A.; Morris, W.F.; Alberts, S.C.; Altmann, J.; Brockman, D.K.; Cords, M.; Pusey, A.; Stoinski, T.S.; Strier, K.B.; Fedigan, L.M. Does climate variability influence the demography of wild primates? Evidence from long-term life-history data in seven species. Glob. Change Biol. 2017, 23, 4907–4921. [Google Scholar] [CrossRef]
- Paniw, M.; James, T.D.; Archer, C.R.; Römer, G.; Levin, S.; Compagnoni, A.; Che-Castaldo, J.; Bennett, J.M.; Mooney, A.; Childs, D.Z.; et al. The myriad of complex demographic responses of terrestrial mammals to climate change and gaps of knowledge: A global analysis. J. Anim. Ecol. 2021, 90, 1398–1407. [Google Scholar] [CrossRef] [PubMed]
- Healy, K.; Ezard, T.H.G.; Jones, O.R.; Salguero-Gómez, R.; Buckley, Y.M. Animal life history is shaped by the pace of life and the distribution of age-specific mortality and reproduction. Nat. Ecol. Evol. 2019, 3, 1217–1224. [Google Scholar] [CrossRef] [PubMed]
- IUCN (International Union for Conservation of Nature). The IUCN Red List of Threatened Species. 2025. Available online: http://www.iucnredlist.org (accessed on 21 May 2025).
- Morris, W.F.; Pfister, C.A.; Tuljapurkar, S.; Haridas, C.V.; Boggs, C.L.; Boyce, M.S.; Bruna, E.M.; Church, D.R.; Coulson, T.; Doak, D.F.; et al. Longevity can buffer plant and animal populations against changing climatic variability. Ecology 2008, 89, 19–25. [Google Scholar] [CrossRef]
- Promislow, D.E.L.; Harvey, P.H. Living fast and dying young: A comparative analysis of life-history variation among mammals. J. Zool. 1990, 220, 417–437. [Google Scholar] [CrossRef]
- Campos, F.A.; Kalbitzer, U.; Melin, A.D.; Hogan, J.D.; Cheves, S.E.; Murillo-Chacon, E.; Guadamuz, A.; Myers, M.S.; Schaffner, C.M.; Jack, K.M.; et al. Differential impact of severe drought on infant mortality in two sympatric neotropical primates. R. Soc. Open Sci. 2020, 7, 200302. [Google Scholar] [CrossRef]
- Department of Agriculture, Water, and the Environment [DAWE]. Conservation Advice for Petaurus australis australis (Yellow-Bellied Glider (South-Eastern)). Australian Government, Department of Agriculture, Water and the Environment: Parkes, Australia. 2022. Available online: https://www.environment.gov.au/biodiversity/threatened/species/pubs/87600-conservation-advice-02032022.pdf (accessed on 2 April 2023).
- Handayani, F.; Goldingay, R.L.; McHugh, D.; Leslie, N. Extensive range contraction predicted under climate warming for a gliding mammal in north-eastern Australia. Aust. Mammal. 2019, 41, 99–111. [Google Scholar] [CrossRef]
- Goldingay, R.L.; Parkyn, J.L.; McHugh, D. Drought-induced population decline in an exudivorous mammal and its relevance to forest management. For. Ecol. Manag. 2023, 548, 121424. [Google Scholar] [CrossRef]
- Goldingay, R.L. A review of the ecology and conservation of the yellow-bellied glider. Aust. Mammal. 2025, 47, AM24041. [Google Scholar] [CrossRef]
- Goldingay, R.L.; Kavanagh, R.P. Socioecology of the yellow-bellied glider (Petaurus australis) at Waratah Creek, N.S.W. Aust. J. Zool. 1990, 38, 327–341. [Google Scholar] [CrossRef]
- Goldingay, R.L. Loud calls of the yellow-bellied glider, Petaurus australis: Territorial behaviour by an arboreal marsupial? Aust. J. Zool. 1994, 42, 279–293. [Google Scholar] [CrossRef]
- McNabb, E.G. Predator calls and prey response. Vic. Nat. 1994, 111, 190–196. [Google Scholar]
- Kavanagh, R.P.; Rohan-Jones, W.G. Calling behaviour of the yellow-bellied glider, Petaurus australis Shaw (Marsupialia: Petauridae). Aust. Mammal. 1982, 5, 95–111. [Google Scholar] [CrossRef]
- Whisson, D.A.; McKinnon, F.; Lefoe, M.; Rendall, A.R.; Halliday, W.D. Passive acoustic monitoring for detecting the yellow-bellied glider, a highly vocal arboreal marsupial. PLoS ONE 2021, 16, e0252092. [Google Scholar] [CrossRef]
- Heise-Pavlov, S.; Prokop, C.; Goss, L. A pilot study to encode calls from the northern yellow-bellied glider. Aust. Mammal. 2024, 46, AM23026. [Google Scholar] [CrossRef]
- MacKenzie, D.I.; Nichols, J.D.; Hines, J.E.; Knutson, M.G.; Franklin, A.B. Estimating site occupancy, colonization, and local extinction when a species is detected imperfectly. Ecology 2003, 84, 2200–2207. [Google Scholar] [CrossRef]
- Burnham, K.P.; Anderson, D.R. Multimodel inference: Understanding AIC and BIC in model selection. Sociol. Methods Res. 2004, 33, 261–304. [Google Scholar] [CrossRef]
- Arnold, T.W. Uninformative parameters and model selection using Akaike’s information criterion. J. Wildl. Manage. 2010, 74, 1175–1178. [Google Scholar] [CrossRef]
- Gould, L.; Sussman, R.W.; Sauther, M.L. Natural disasters and primate populations: The effects of a 2-year drought on a naturally occurring population of ring-tailed lemurs (Lemur catta) in southwestern Madagascar. Int. J. Primatol. 1999, 20, 69–84. [Google Scholar] [CrossRef]
- Parrott, M.L.; Ward, S.J.; Temple-Smith, P.D.; Selwood, L. Effects of drought on weight, survival and breeding success of agile antechinus (Antechinus agilis), dusky antechinus (A. swainsonii) and bush rats (Rattus fuscipes). Wildl. Res. 2007, 34, 437–442. [Google Scholar] [CrossRef]
- Henry, S.R.; Craig, S.A. Diet, ranging behaviour and social organization of the yellow-bellied glider (Petaurus australis) in Victoria. In Possums and Gliders; Smith, A.P., Hume, I.D., Eds.; Australian Mammal Society: Sydney, Australia, 1984; pp. 331–341. [Google Scholar]
- Craig, S.A. Social organization, reproduction and feeding behaviour of a population of yellow-bellied gliders, Petaurus australis (Marsupialia: Petauridae). Wildl. Res. 1985, 12, 1–18. [Google Scholar] [CrossRef]
- Russell, R. Social behaviour of the yellow-bellied glider, Petaurus australis, in north Queensland. In Possums and Gliders; Smith, A.P., Hume, I.D., Eds.; Australian Mammal Society: Sydney, Australia, 1984; pp. 345–353. [Google Scholar]
- Gonsalves, L.; Law, B.; Slade, C. Landscape-scale monitoring for forest fauna is achievable: A case study using remote sensors, artificial intelligence and robust analytics. Aust. Zool. 2024, 43, 526–544. [Google Scholar] [CrossRef]
- Purvis, A.; Gittleman, J.L.; Cowlishaw, G.; Mace, G.M. Predicting extinction risk in declining species. Proc. R. Soc. Lond. B 2000, 267, 1947–1952. [Google Scholar] [CrossRef] [PubMed]
- Davey, S.M. Methods for surveying the abundance and distribution of arboreal marsupials in a south coast forest of New South Wales. Aust. Wildl. Res. 1990, 17, 427–445. [Google Scholar] [CrossRef]
- MacKenzie, D.I.; Nichols, J.D.; Royle, J.A.; Pollock, K.H.; Bailey, L.; Hines, J.E. Occupancy Estimation and Modelling: Inferring Patterns and Dynamics of Species Occurrence, 2nd ed; Academic Press: London, UK, 2018. [Google Scholar]
- Wintle, B.A.; Kavanagh, R.P.; McCarthy, M.A.; Burgman, M.A. Estimating and dealing with detectability in occupancy surveys for forest owls and arboreal marsupials. J. Wildl. Manag. 2005, 69, 905–917. [Google Scholar] [CrossRef]
- Bilney, R.J.; Kambouris, P.J.; Peterie, J.; Dunne, C.; Makeham, K.; Kavanagh, R.P.; Gonsalves, L.; Law, B. Long-term monitoring of an endangered population of yellow-bellied glider Petaurus australis on the Bago Plateau, New South Wales, and its response to wildfires and timber harvesting in a changing climate. Aust. Zool. 2022, 42, 592–607. [Google Scholar] [CrossRef]
- Lefoe, M.; Rendall, A.R.; McKinnon, F.; Whisson, D.A. Logging and wildfire limit the distribution of a vulnerable arboreal mammal. For. Ecol. Manag. 2022, 503, 119773. [Google Scholar] [CrossRef]
- Legge, S.; Woinarski, J.C.Z.; Scheele, B.C.; Garnett, S.T.; Lintermans, M.; Nimmo, D.G.; Whiterod, N.S.; Southwell, D.M.; Ehmke, G.; Buchan, A.; et al. Rapid assessment of the biodiversity impacts of the 2019–20 Australian megafires to guide urgent management intervention and recovery, and lessons for other regions. Divers. Distrib. 2022, 28, 571–591. [Google Scholar] [CrossRef]
Disclaimer/Publisher’s Note: The statements, opinions and data contained in all publications are solely those of the individual author(s) and contributor(s) and not of MDPI and/or the editor(s). MDPI and/or the editor(s) disclaim responsibility for any injury to people or property resulting from any ideas, methods, instructions or products referred to in the content. |
© 2025 by the author. Licensee MDPI, Basel, Switzerland. This article is an open access article distributed under the terms and conditions of the Creative Commons Attribution (CC BY) license (https://creativecommons.org/licenses/by/4.0/).