Article

Allometry for Biomass Estimation in Jatropha Trees Planted as Boundary Hedge in Farmers’ Fields

1
School of GeoSciences, The University of Edinburgh, Drummond Street, Edinburgh, EH8 9XP, UK
2
Bunda College of Agriculture, Lilongwe University of Agriculture and Natural Resources, P.O. Box 219, Lilongwe, Malawi
3
Bio-Energy Resources Ltd., P.O. Box 1075, Lilongwe, Malawi
4
Michigan State University, 101 Manly Miles, East Lansing, MI 48824-1222101, USA
*
Author to whom correspondence should be addressed.
Forests 2013, 4(2), 218-233; https://doi.org/10.3390/f4020218
Submission received: 19 February 2013 / Revised: 25 March 2013 / Accepted: 26 March 2013 / Published: 11 April 2013
(This article belongs to the Special Issue Forest Restoration and Regeneration)

Abstract

:
Regrowth and planted trees in agricultural landscapes are rarely protected from clearing under national Forest Acts. There is, therefore, some question over the long-term security of any value they might provide to biodiversity and the global carbon cycle. Engaging landholders in carbon credits that are conditioned on planted areas being maintained into the future could improve the situation. To begin carbon trading, landholders need precise and accurate estimates of the carbon sequestered by the trees in their fields. Accurate estimates of carbon stocks depend to a greater degree on the availability and adequacy of the allometric equations that are used to estimate tree biomass. The present study has developed an allometric model for estimating the woody biomass of Jatropha trees planted as boundary hedges in agricultural landscapes under smallholder farming systems in Malawi. The predictive performance of the model was assessed and was subsequently compared with the published Jatropha models. The results showed that the statistical fits of our model were generally good, enabling one to use it with confidence for estimating wood biomass in Jatropha stands from which they were derived. The published Jatropha models consistently overestimated the woody biomass by as much as 55%, rendering them unsuitable for application in estimating woody biomass in our study sites.

Graphical Abstract

1. Introduction

Vegetation clearance has perhaps been the most significant threat to forests and woodlands in the countries of sub-Saharan Africa. The net loss of forests and woodlands in the region was recently estimated at 4 million ha per year over the last two decades (1990–2010) [1]. Malawi alone lost an estimated 33,000 ha per year, representing a 2.6% annual loss of forests and woodlands on freehold land in the country. During the same period, many landholders in Malawi replanted forests and encouraged regrowth of indigenous woodlands. These restored forest areas contributed over 70% of the total forests (3.2 million hectares) on freehold land in 2010 [1]. However, as these planted forests and regrowth are not protected from clearing under the Malawi Forest Act of 1997 [2], there is a serious question over the security of the long-term value they provide to biodiversity and the global carbon cycle. This situation can be improved through revenue earned from carbon credits that is conditioned on areas, that have been planted, being maintained into the future, as is the case under the emissions trading schemes of Clean Development Mechanism (CDM) of the Kyoto Protocol [3] and the Reducing Emissions from All Land Uses (REALU or REDD++) [4]. These schemes allow landholders to sell the carbon sequestered in trees and forest stands to industries and governments to offset some of their greenhouse gas emissions [3].
To begin carbon trading, landholders need reliable estimates of the carbon sequestered in their forest stands. Accurate estimates of carbon stocks depend to a great degree on the availability and adequacy of the allometric equations that are used to estimate tree biomass [3,5,6]. Allometric equations are a fundamental tool for the non-destructive estimation of biomass in woody vegetation and their value depends on the empirical data used to construct such equations [7]. These equations express tree biomass as a function of easy-to-measure parameters such as diameter, height, wood density, or a combination of these [6,8]. The equations are generated from a small sample of trees and are then used to estimate biomass on a larger scale.
Several generalized allometric equations for biomass estimation in broad types of forest ecosystems have been developed for tropical forests, especially in the Amazon Basin [6,9,10,11,12,13]. However, generalized whole ecosystem equations can be inaccurate when used to estimate biomass of individual tree species [10,14,15,16]. Species-specific models remain more accurate than the generalized models [16]. This is because individual species allometry takes into account differences in wood density, tree form, and its architecture, all of which can affect the modeled relationship between the easy-to-measure parameters and the biomass of individual trees [9].
Species-specific allometric equations do exist for many forest ecosystems [17,18,19] but they are not widely available for tropical trees. Even where these models exist, they are not often transferable to the same species growing in a different environment, as they tend to be site specific [17]. This is due to the fact that tree growth is affected by site characteristics and climatic conditions [20]. Species- and site-specific allometric equations are the most accurate and precise [16] and they are recommended for estimating the biomass of high value tree species. Typical examples are the tree species that are planted and/or managed for carbon sequestration potential under the emissions trading schemes of CDM and REDD++ and these tree species require precise and accurate estimates of their biomass in order to attain credibility in the carbon markets [12].
Jatropha curcas (Jatropha) is extensively planted by smallholder farmers in Malawi as a high value tree species used as a feedstock for the production of bio fuel. Establishment of Jatropha has been successful in drier regions of the tropics with an annual rainfall of 300–1000 mm. It favors lower altitudes (0–500 m) with average annual temperatures of 20–28 °C, but can grow at higher altitudes and tolerates slight frost [21]. Its seeds are rich in highly extractible oil. The oil produces minimal smoke and has better efficiency than diesel in its pure or mixed forms [21,22,23]. The planting of Jatropha in Malawi is predominantly promoted by a private bio-energy company (Bio-Energy Resources Limited). The company seeks to acquire carbon financial payments through carbon stocks sequestered by the growing of Jatropha trees. Robust allometric equations that estimate the carbon stocks of the growing trees on the farmers’ fields is a prerequisite to the acquisition of Verified Carbon Units (VCUs) under most existing verification standards (e.g., VCS v3.0 2011 [24]).
Ghezehei et al. [23] and Achten et al. [25] developed allometric models for estimating aboveground biomass in Jatropha. The work by Achten et al. [25] was based on data from Jatropha seedlings and Ghezehei’s work was based on data from Jatropha trees that were grown under research trial conditions with prescribed and scheduled silvicultural operations. Our study uses data from Jatropha trees that are planted and managed together with other agricultural crops under smallholder farming systems. Kuyah et al. [7] and Brassard et al. [26] observed that applying forest-based allometric models to trees that are growing under farm conditions are constrained by factors that influence biomass allocation. For example, trees on a farm are often managed through pruning and coppicing, and they periodically benefit from agricultural operations such as fertilization intended to improve crop production. This study therefore aims to determine local allometric equations for estimating the woody biomass of Jatropha trees growing under smallholder farming systems.

2. Materials and Methods

2.1. Study Sites

The allometric equations were developed using data that was collected from Jatropha, aged 12 to 33 months. All of the trees sampled were planted and managed by smallholder farmers in the Central and Northern Regions of Malawi (Salima, Nkhotakota, Dowa, Kasungu, and Mzimba, respectively). Salima and Nkhotakota are located along the shores of Lake Malawi and the districts experience a warm tropical climate (Table 1). The soils vary from clay-loam and alluvial deposits to deep dark clay and shallow stony. Dowa, Kasungu, and Mzimba are located on a plateau (Table 1) with a cooler tropical climate compared to the shores of Lake Malawi. The soils are predominantly ferralic and chronic cumbisols, characterised by sandy clay loam such that they are inherently low in nitrogen and phosphorus.
Table 1. Location and climatic conditions of study sites.
Site (District)LatitudeLongitudeAltitude (masl)Mean annual Temperature (°C)Rainfall (mm yr−1)
Salima13°45′0″S34°35′0″E51224.01266
Nkhotakota12°55′0″S34°17′0″E50023.51649
Dowa13°39′0″S33°55′6″E151419.3906
Kasungu13°02′0″S33°29′0″E134220.9802
Mzimba11°53′0″S33°37′0″E134919.6903
Malawi experiences population and land pressures that result in a high demand for agricultural land. In light of this, Bio Energy Resources Limited (the company that predominantly promotes the growth of Jatropha in Malawi) has Standard Operating Procedures that stipulate that Jatropha should only be grown as a boundary crop around agricultural fields and homesteads. This ensures that smallholder farmers can continue planting their primary (food) and secondary (cash) crops whilst realizing an additional income from the sale of Jatropha seed. Furthermore, the Standard Operating Procedures ensure that Jatropha trees are planted with a 1 m spacing and that standard silvicultural practices (e.g., weeding) are implemented. Pruning is not recommended because it has been observed that this practice increases incidences of pests and diseases attacking Jatropha in farmers’ fields. However, the timing and frequency of these management practices vary from farmer to farmer [27].

2.2. Sampling and Tree Harvests

The study area was stratified according to the ecological classification for tree planting in Malawi [28]. The Salima and Nkhotakota sites were grouped to constitute stratum 1, whereas Dowa, Kasungu, and Mzimba together formed stratum 2. 180 and 459 trees were systematically selected for harvest from strata 1 and 2, respectively. The selected trees were measured for basal stem diameter and height. Basal stem diameter (measured at 10 cm above the tree base) was used instead of, the more popular, Diameter at Breast Height (DBH) because the stem of Jatropha rarely grows to this height before branching. At harvest, the aboveground woody components (stems and twigs) of each tree were separated, bagged, and weighed. Sub-samples of the woody tree component were collected and oven-dried to a constant weight; this allowed the woody dry weight of each tree to be determined.

2.3. Data Analysis

Raw data was screened through the means of scatter plots to identify outliers. Quantitative detection of the outlier and/or leverage values in the raw dataset was completed by calculating Cook’s distance statistics of the residuals. Any data value that had a residual Cook’s distance value of equal to or greater than 1 was cross-checked with the original dataset to validate its accuracy. Six and 17 data points in stratum 1 and 2 respectively could not be verified. These were dropped in subsequent analysis. The description of the final dataset that is used to construct the allometric equation is given in Table 2.
Table 2. Description of the final dataset.
Tree variableNMinMaxMeanStd. dev.
Stratum 1
Wood biomass (kg)1740.0107.3900.4660.716
Basal diameter (cm)1741.412.83.7701.504
Height (m)1740.053.160.8230.494
Stratum 2
Wood biomass (kg)4420.0062.6160.1680.256
Basal diameter (cm)4421.58.42.9710.993
Height (m)4420.032.00.4900.281
Note: N = total number of trees harvested and used in model development; Min. and Max. are minimum and maximum sizes of the trees, respectively; Std. dev. = standard deviation.
The allometric power function was selected to fit the regression line on the dataset. A growing tree maintains the proportions between different parts of the tree and the empirical relationships of these tree variables are analytically expressed as power functions [29]. The function assumes the form:
W = β0 × Dβ1
where W is biomass of the tree component; D is tree diameter and; β0 and β1 are the scaling coefficient and exponent, respectively [10,25,30]. In most cases the variability of D explains largely the variability of W. This correlation makes D a good predictor for W [31].
The power function was linearized to log-log transformation in order to fit it on the empirical data with linear regression. Ghezehei et al. [23] recommends base 10 logarithmic transformation because it yields a lower sum of squares in the regression analysis than it does with natural logarithmic transformation. The transformed power function became:
Log10 (W) = Log10 (β0) + β1 × Log10 (D)
Transforming data using log-transformation techniques subjects the antilog values of the predicted outputs to systematic biases [3,6,32,33]. The biases in the predicted outputs were corrected by multiplying the antilog of the outputs by a “correction factor − CF”. CF as a correction factor was computed using the formula:
CF = Exp (MSE/2)
where MSE is the mean square error of the regression.
The data from each tree variable was subjected to a log10-log10 transformation. Linear regression was performed on the logarithmically transformed datasets using IBM SPSS 20.0. The transformed woody biomass was fitted as a response variable, and basal diameter alone and basal diameter in combination with tree height as predictor variables. In the models that included basal diameter in combination with tree height as predictors, each variable was fitted separately so that they each could attribute their own scaling parameter. This is necessary as the identical scaling rule inhibits a detailed assessment of the effect that an additional predictor variable can have on the response variable. The fitted models are presented in Table 3.
Table 3. The allometric models fitted on the data.
Allometric model
Log10 (wood biomass) = Log10 ( β0) + β1 × Log10 (BD)I
Log10 (wood biomass) = Log10 ( β0) + β1 × Log10 (BD) + β1 × Log10 (Ht)II
Note: BD and Ht are the basal diameter and height of the modelled trees, respectively.
The compliance of using linear regression to fit the model on the dataset was evaluated by analyzing scatterplots of residuals to check for their linearity, homoscedasticity, and normality. The strength of the underlying relationship of the predictor and response variables was evaluated by analyzing the regression coefficients of the fitted models. The coefficient of determination (R2) was used to evaluate the variability of the predictor variable in estimating biomass of individual tree components. The predictive performance (goodness of fit) of the models was evaluated by calculating the mean relative prediction error (MPE%) and its 95% confidence interval (CI) as a measure of bias and the root mean squared relative prediction error (RMSE%) and its 95% CI as a measure of imprecision. These statistical measures were calculated using the following formulae:
Forests 04 00218 i001
Forests 04 00218 i002
Forests 04 00218 i003
where n is the number of data pairs (i.e., measured and predicted wood biomass values), and pe is the relative prediction error (log Wood biomasspredicted − log Wood biomassmeasured). The 95% CI for RMSE% was obtained by calculating the 95% CI of the mean squared relative prediction error and extracting the root.
The published Jatropha allometric equations developed by Achten et al. [25] and Ghezehei et al. [23] were tested to determine their suitability in estimating tree biomass in the study area. In both cases, basal stem diameter was measured in millimetres and the estimated biomass in grams. These equations are:
Achten equation: W = 0.029 × BD2.328
Ghezehei equation: W = 0.000907 × BD3.354
where W is woody tree biomass, and BD are as presented above.

3. Results

3.1. Model Specifications

Scatterplots of woody biomass against basal diameter showed a curvilinear relationship of the two variables. The log-log transformation changed the scale and spacing of the two variables, and an approximate linear relationship was observed between the two variables in both strata (Figure 1).
Figure 1. Relationship of woody biomass with basal diameter.
Forests 04 00218 g001
The results of the regression analysis on the logarithmically transformed woody biomass and basal stem diameter, the “correction factors” (CF) and the corrected allometric equations are presented in Table 4. Model I showed a significant association (p < 0.001) between woody biomass and basal stem diameter for both strata. The inclusion of tree height as an additional predictor variable in model II showed no significant improvement in the predictive ability of the models, i.e., the additional scaling parameter in the model (β2) was not significant (p > 0.05). Model II was therefore dropped from further analyses.
Table 4. Estimated values of the regression parameters with their statistical measures of fit.
ModelStratumNLog β0β1β2R2CFCorrected equation
I1172−2.1962.891-0.7261.039W = 0.0067 × BD2.891
(0.077)(0.136)
2442−2.2812.769-0.5561.046W = 0.0055 × BD2.769
(0.055)(0.118)
II1172−2.1312.8020.0990.728
(0.095)(0.157)(0.088)
2442−2.2212.6890.0650.557
(0.093)(0.155)(0.081)
Note: β0 is the intercept, β1 and β2 are the scaling exponents of the regression and the values in parentheses are their standard errors; R2 is the coefficient of determination; and CF is the correction factor. Model I: Log (woody biomass) = Log (β0) + β1 × Log (BD); Model II: Log (woody biomass) = Log (β0) + β1 × Log (BD) + β2 × Log (Ht).
The values of the “correction factors” were very low (close to one). A CF of one indicates a highly significant relationship of the two variables. Hence, the results confirm the significant relationship between woody biomass and basal diameter. The 95% confidence limits (CI) for the estimated scaling exponents for the two strata were 2.622–3.160 and 2.538–3.001. The overlap observed in the confidence limits results indicates that the estimated scaling exponents for the two strata were not significantly different, i.e., a unit increase in basal diameter results in a marginal increase in woody biomass which is not significantly different between the two strata. However, the larger coefficient of determination (R2) for stratum 1 (0.726) shows that basal diameter varies more in estimating woody biomass in stratum 1 than it does for stratum 2.

3.2. Residual Scatterplots

The residual plots showing the adequacy of the models in fulfilling the key assumptions of linear regression are presented in Figure 2.
Figure 2. Testing for adequacy of the model on three important assumptions of using linear regression. A and B = testing for linearity; C and D = testing for homoscedasticity; and E and F = testing for normality.
Forests 04 00218 g002
The random distribution of the scatter-points of the residuals along the logarithmically transformed basal diameter values (Figure 2A,B) indicates that the fitted linear model was correctly specified and adequately describes the linear relationship between the two variables. Similarly, the random distribution of the scatter-points of the prediction errors along the predicted woody biomass values (Figure 2C,D) shows the stability of the model in predicting the woody biomass across different tree sizes, i.e., the variance of the residuals remained constant with increasing trees sizes in both strata. The results of Figure 2E,F show the residuals falling along the 45° diagonal line with very few of them falling away from the line at both ends. These observations are firstly, an indication that the residuals of the fitted model were normally distributed, and secondly an indication that the assumptions associated with the use of probability distribution in describing the sampling distributions of the regression coefficients (β0, β1 and β2) and R2 were correctly specified. The open funnel at both ends of the diagonal line is normal and acceptable.

3.3. Goodness of Fit of the Model

The bias and imprecision results of the model in predicting woody biomass is presented in Table 5. The results show that none of the predicted woody biomass in the two strata was significantly biased. This is demonstrated by the inclusion of the zeros in the range of values of their 95% confidence limits. The average predictive performance of the models to over- or under-estimate the woody biomass was less that 1% in both strata (Table 5).
Table 5. Predictive performance of the allometric model in the validation dataset.
ModelStratumNBias MPE% 95% CIImprecision RMSE% 95% CI
111720.01−4.11 to 4.1327.3523.98 to 30.72
2442−0.05−2.87 to 2.7730.1328.64 to 31.62
Figure 3 shows the pattern in distribution of prediction errors along the size classes of basal stem diameter in stratum 1 and 2, respectively. The distribution pattern of the mean prediction errors is relatively consistent across basal diameter classes (Figure 3A,B). However there is a slight over-estimate of the woody biomass in 0.78 cm (log scale) diameter class in stratum 1, which has possibly resulted in a positive MPE(%) value for the stratum (Table 5). Similarly, a slight under-estimate in woody biomass is observed in 0.65 cm (log scale) diameter class, rendering a negative MPE(%) value for stratum 2 (Table 5).
The mean prediction error of single trees (RMSE%) was relatively high in both strata (Table 5). This is an expected observation as RMSE% shows how individual observations in the dataset deviate from the mean: The distribution pattern of deviations of individual trees across tree size classes are shown in Figure 3C,D. The results show that many bigger trees are precisely estimated in stratum 1 than smaller ones, while the pattern in stratum 2 was relatively random.
Figure 3. Disaggregation of prediction errors by tree sizes. A and B = mean prediction errors (MPE%); C and D = Root mean squared error (RMSE%).
Forests 04 00218 g003

3.4. Other Published Jatropha Models

Table 6 provides predictive performances of the two published models for biomass estimation in Jatropha trees [23,25]. Both models gave significant biases (MPE%) in estimating biomass in both strata of the study area as shown by inclusion of non-zero values in their 95% confidence limits. The models consistently over-estimated the biomass with values ranging from −38.96 to 54.77% (Table 6). Figure 4 shows the distribution pattern of the mean prediction errors of the two models. They both show consistent over-estimation across the basal diameter classes in the dataset.
Table 6. Predictive performance of the allometric model in the validation dataset.
ModelStratumNBias MPE% 95% CIImprecision RMSE% 95% CI
Achten Model1173−38.96−43.00 to −34.9247.4042.50 to 52.30
Ghezehei model1173−54.77−59.16 to −50.3862.1655.77 to 68.55
Achten model2293−20.02−23.41 to −16.6335.6432.29 to 38.99
Ghezehei model2293−45.14−48.77 to −41.5155.0950.56 to 59.62
Figure 4. Distribution of prediction errors based on Ghezehei et al. (A) and Achten et al. (B) models.
Forests 04 00218 g004

4. Discussion

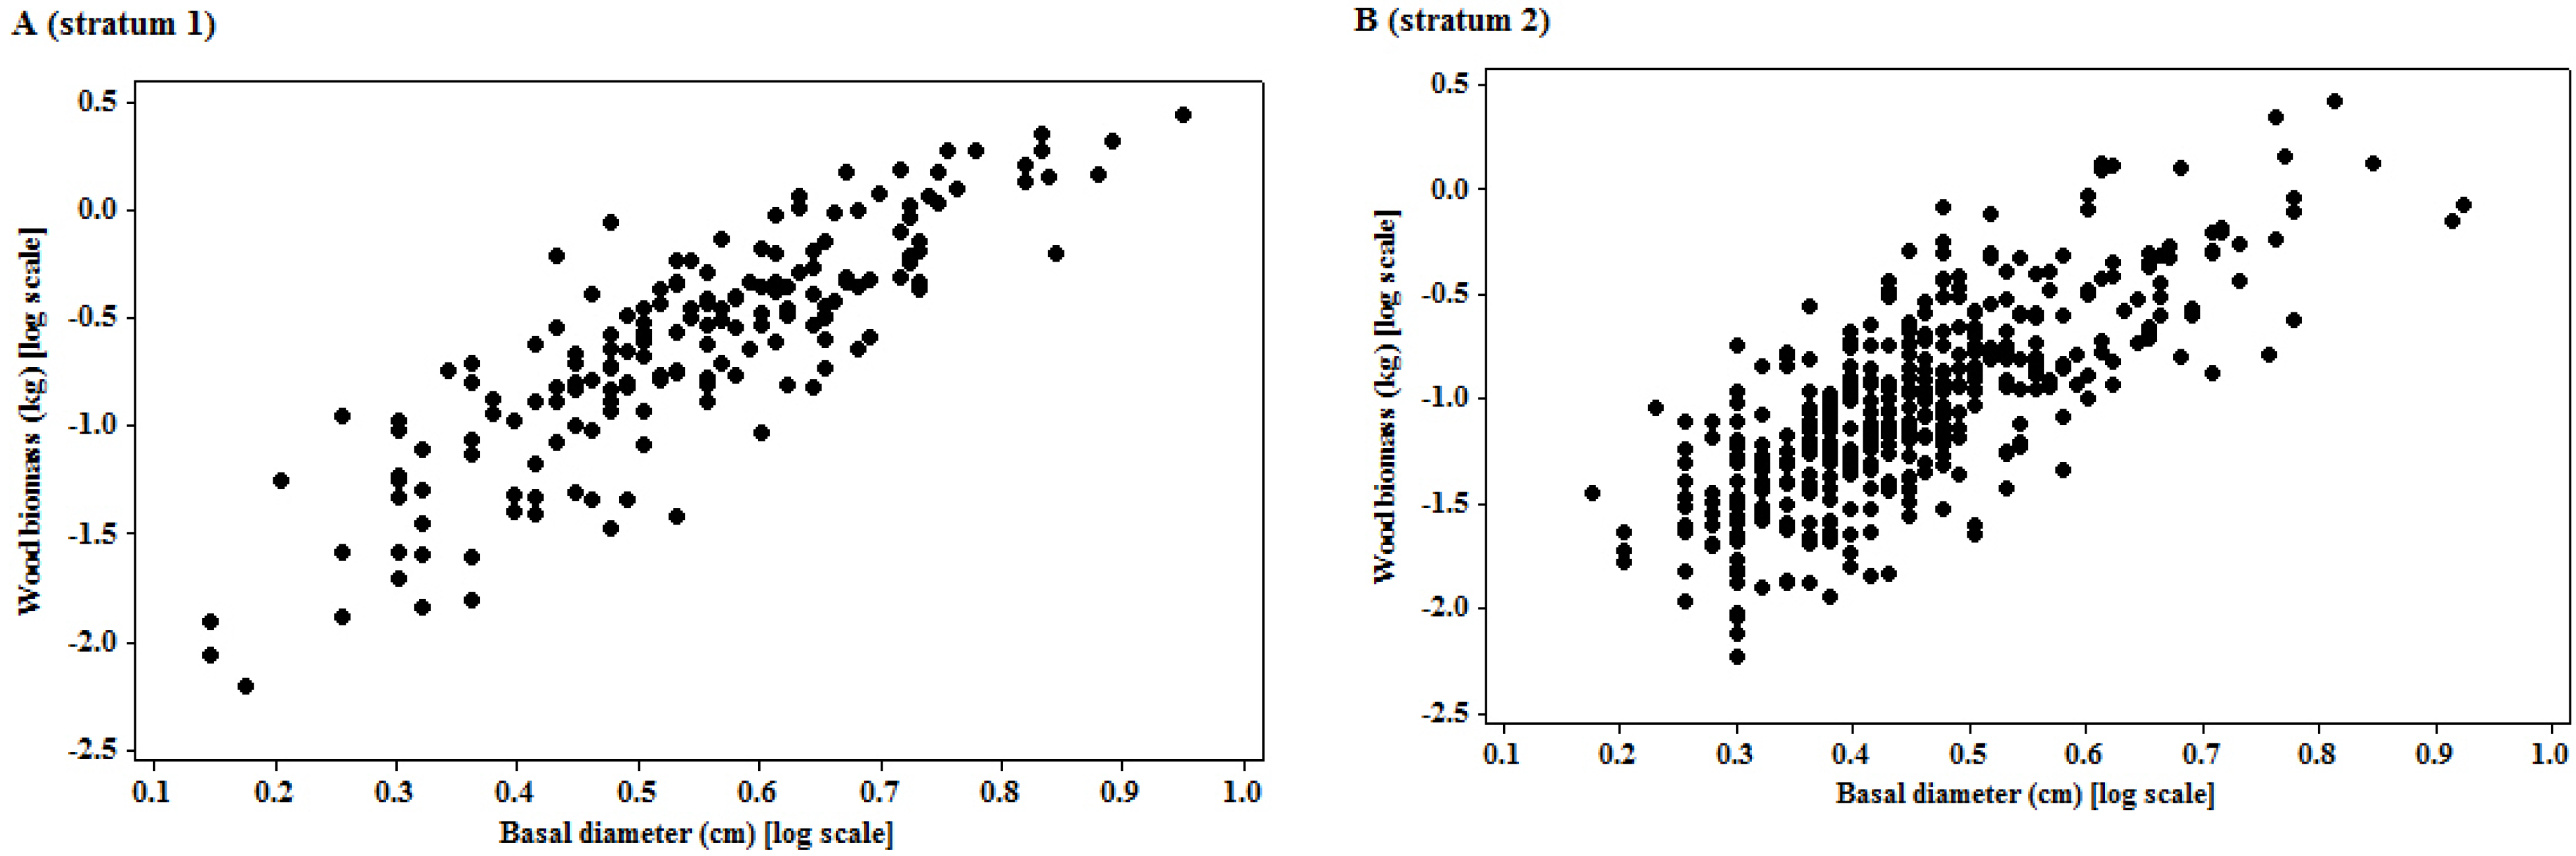
The logarithmic transformation of the basal diameter and woody biomass had put the two variables on a multiplicative scale, which was appropriate for interpreting most size variables, since biological growth is a multiplicative process [34]. Converting arithmetic data to logarithms, however, is a nonlinear transformation that fundamentally alters the relationship between predictor and response variables [35]. The change in the relationship is such that influential outliers in the arithmetic domain may be drawn toward the centre of the distribution, and can thereby go undetected, potentially introducing bias into the analysis [36]. In order to avoid this in our study, the detection of influential outliers was first done on data expressed in arithmetic scale as recommended by Packard et al. [36]. Transformation of the two variables was done thereafter.
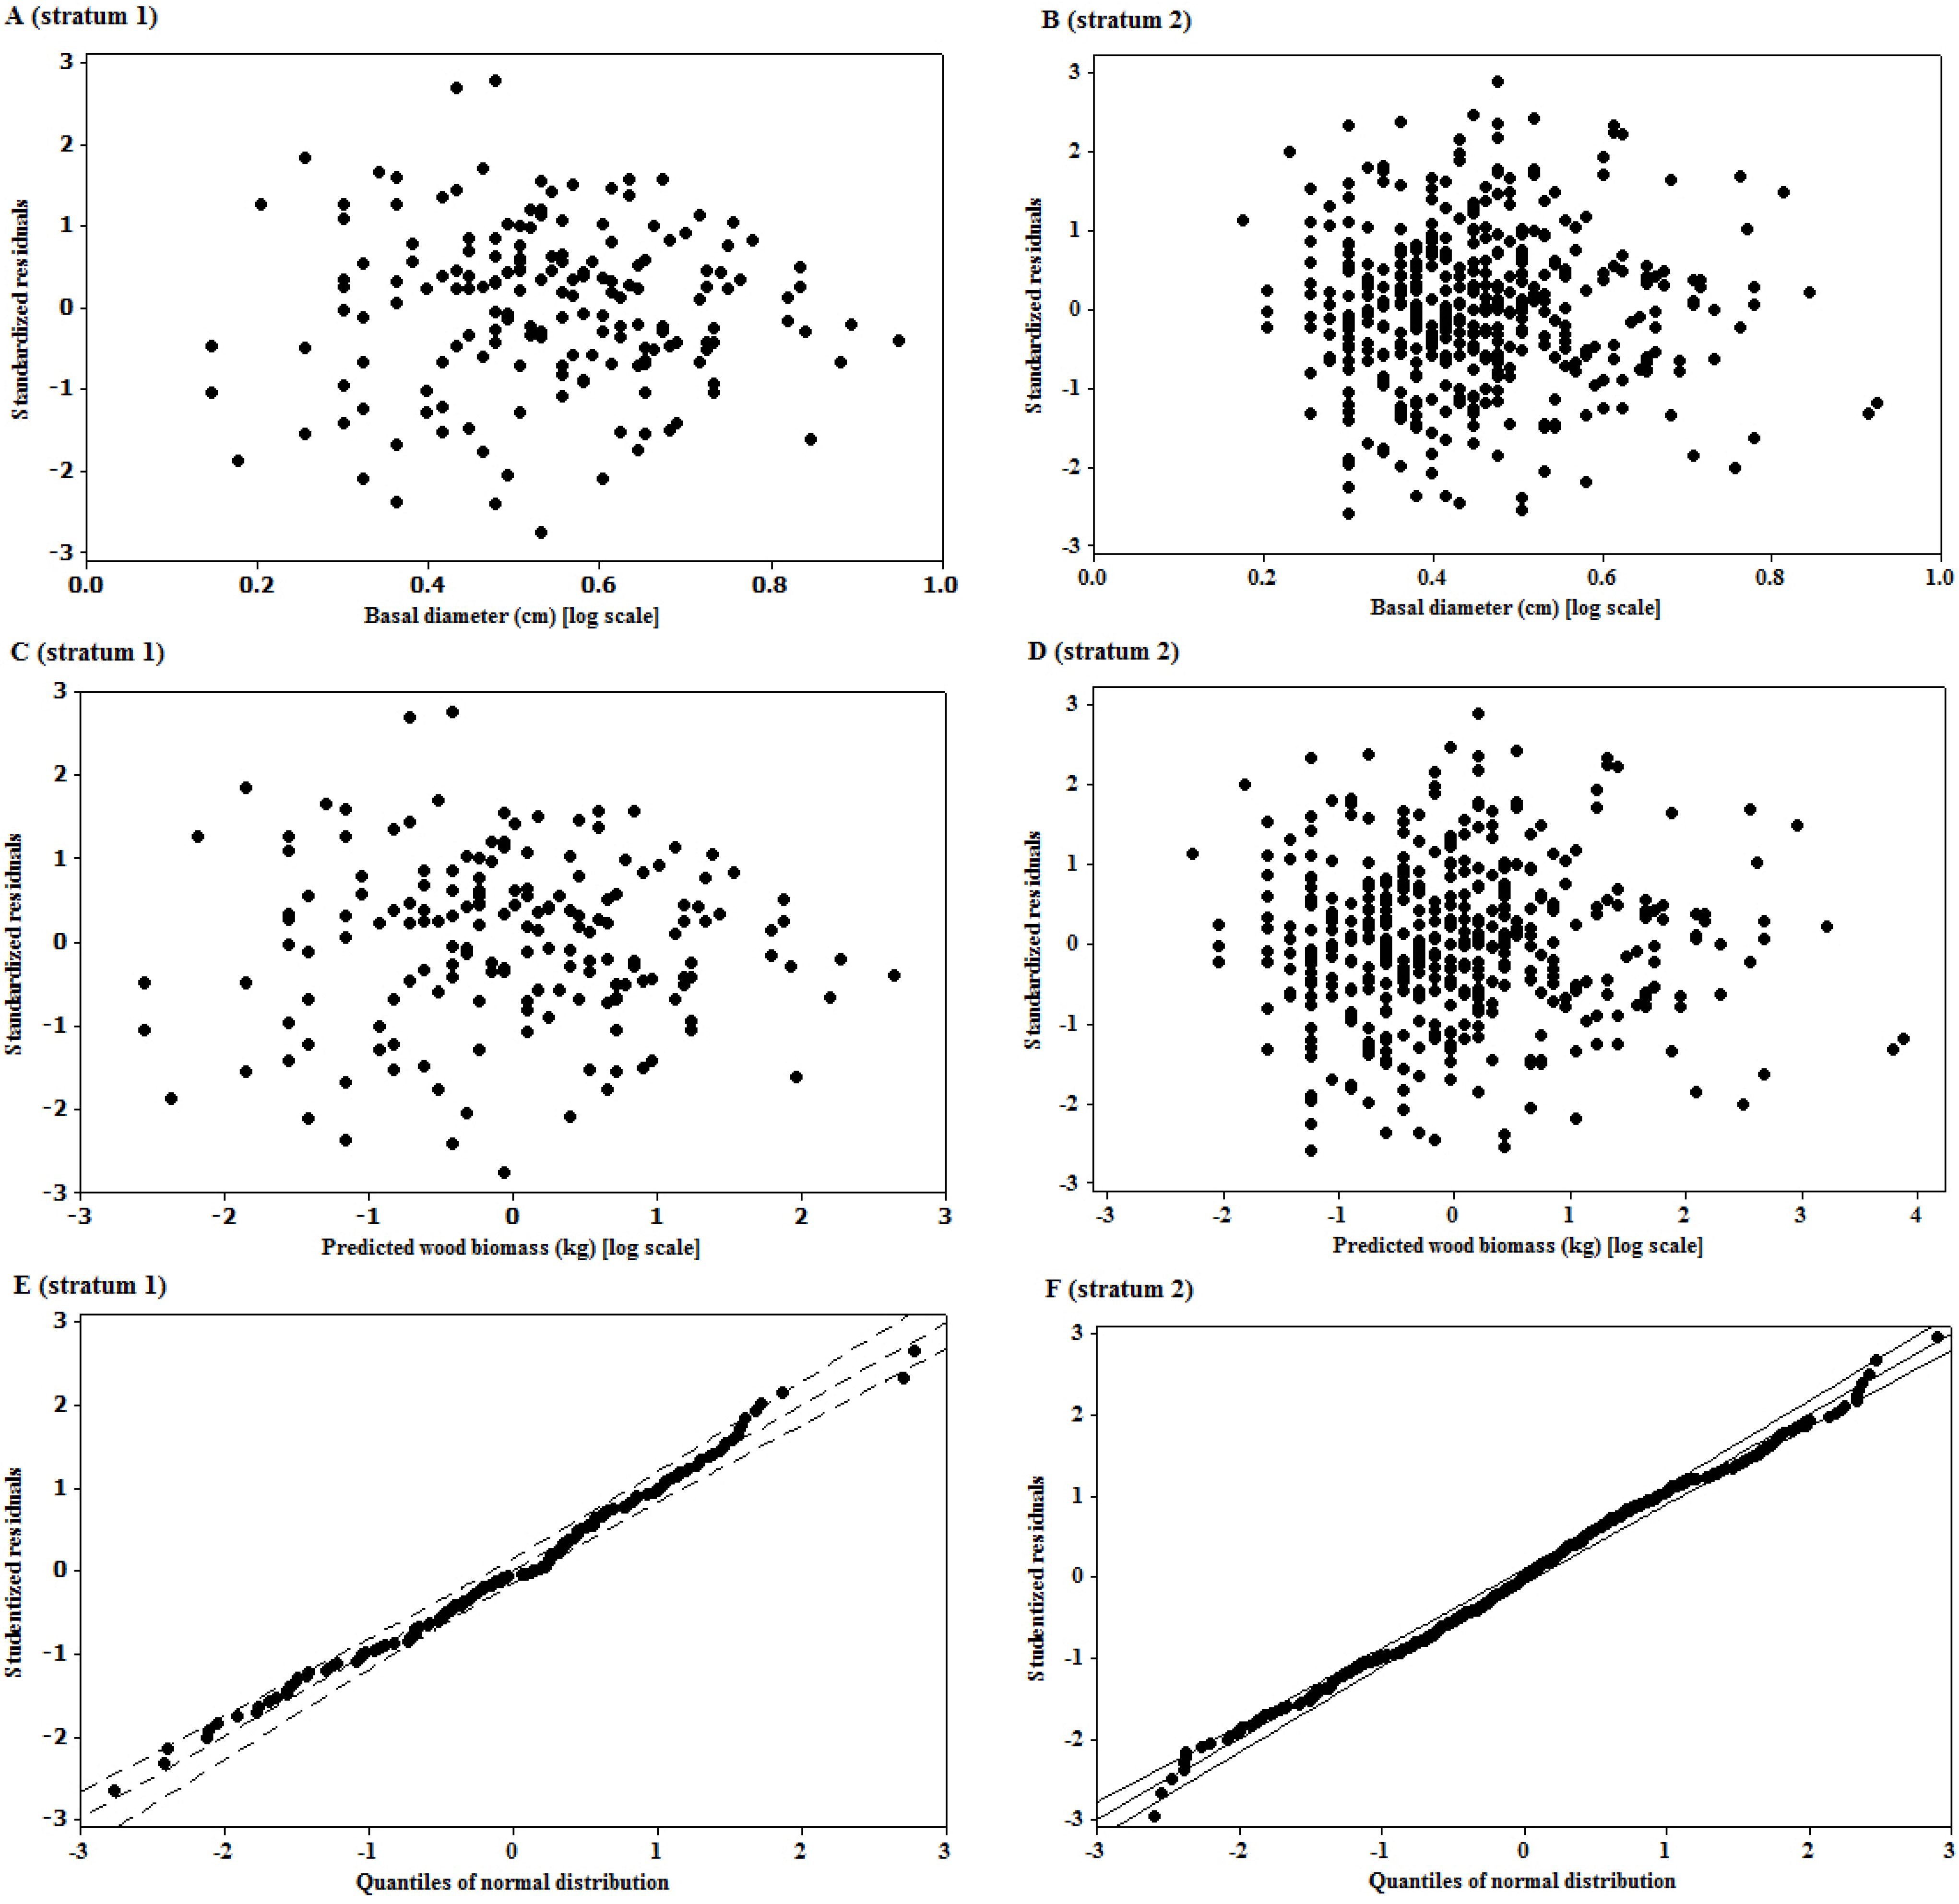
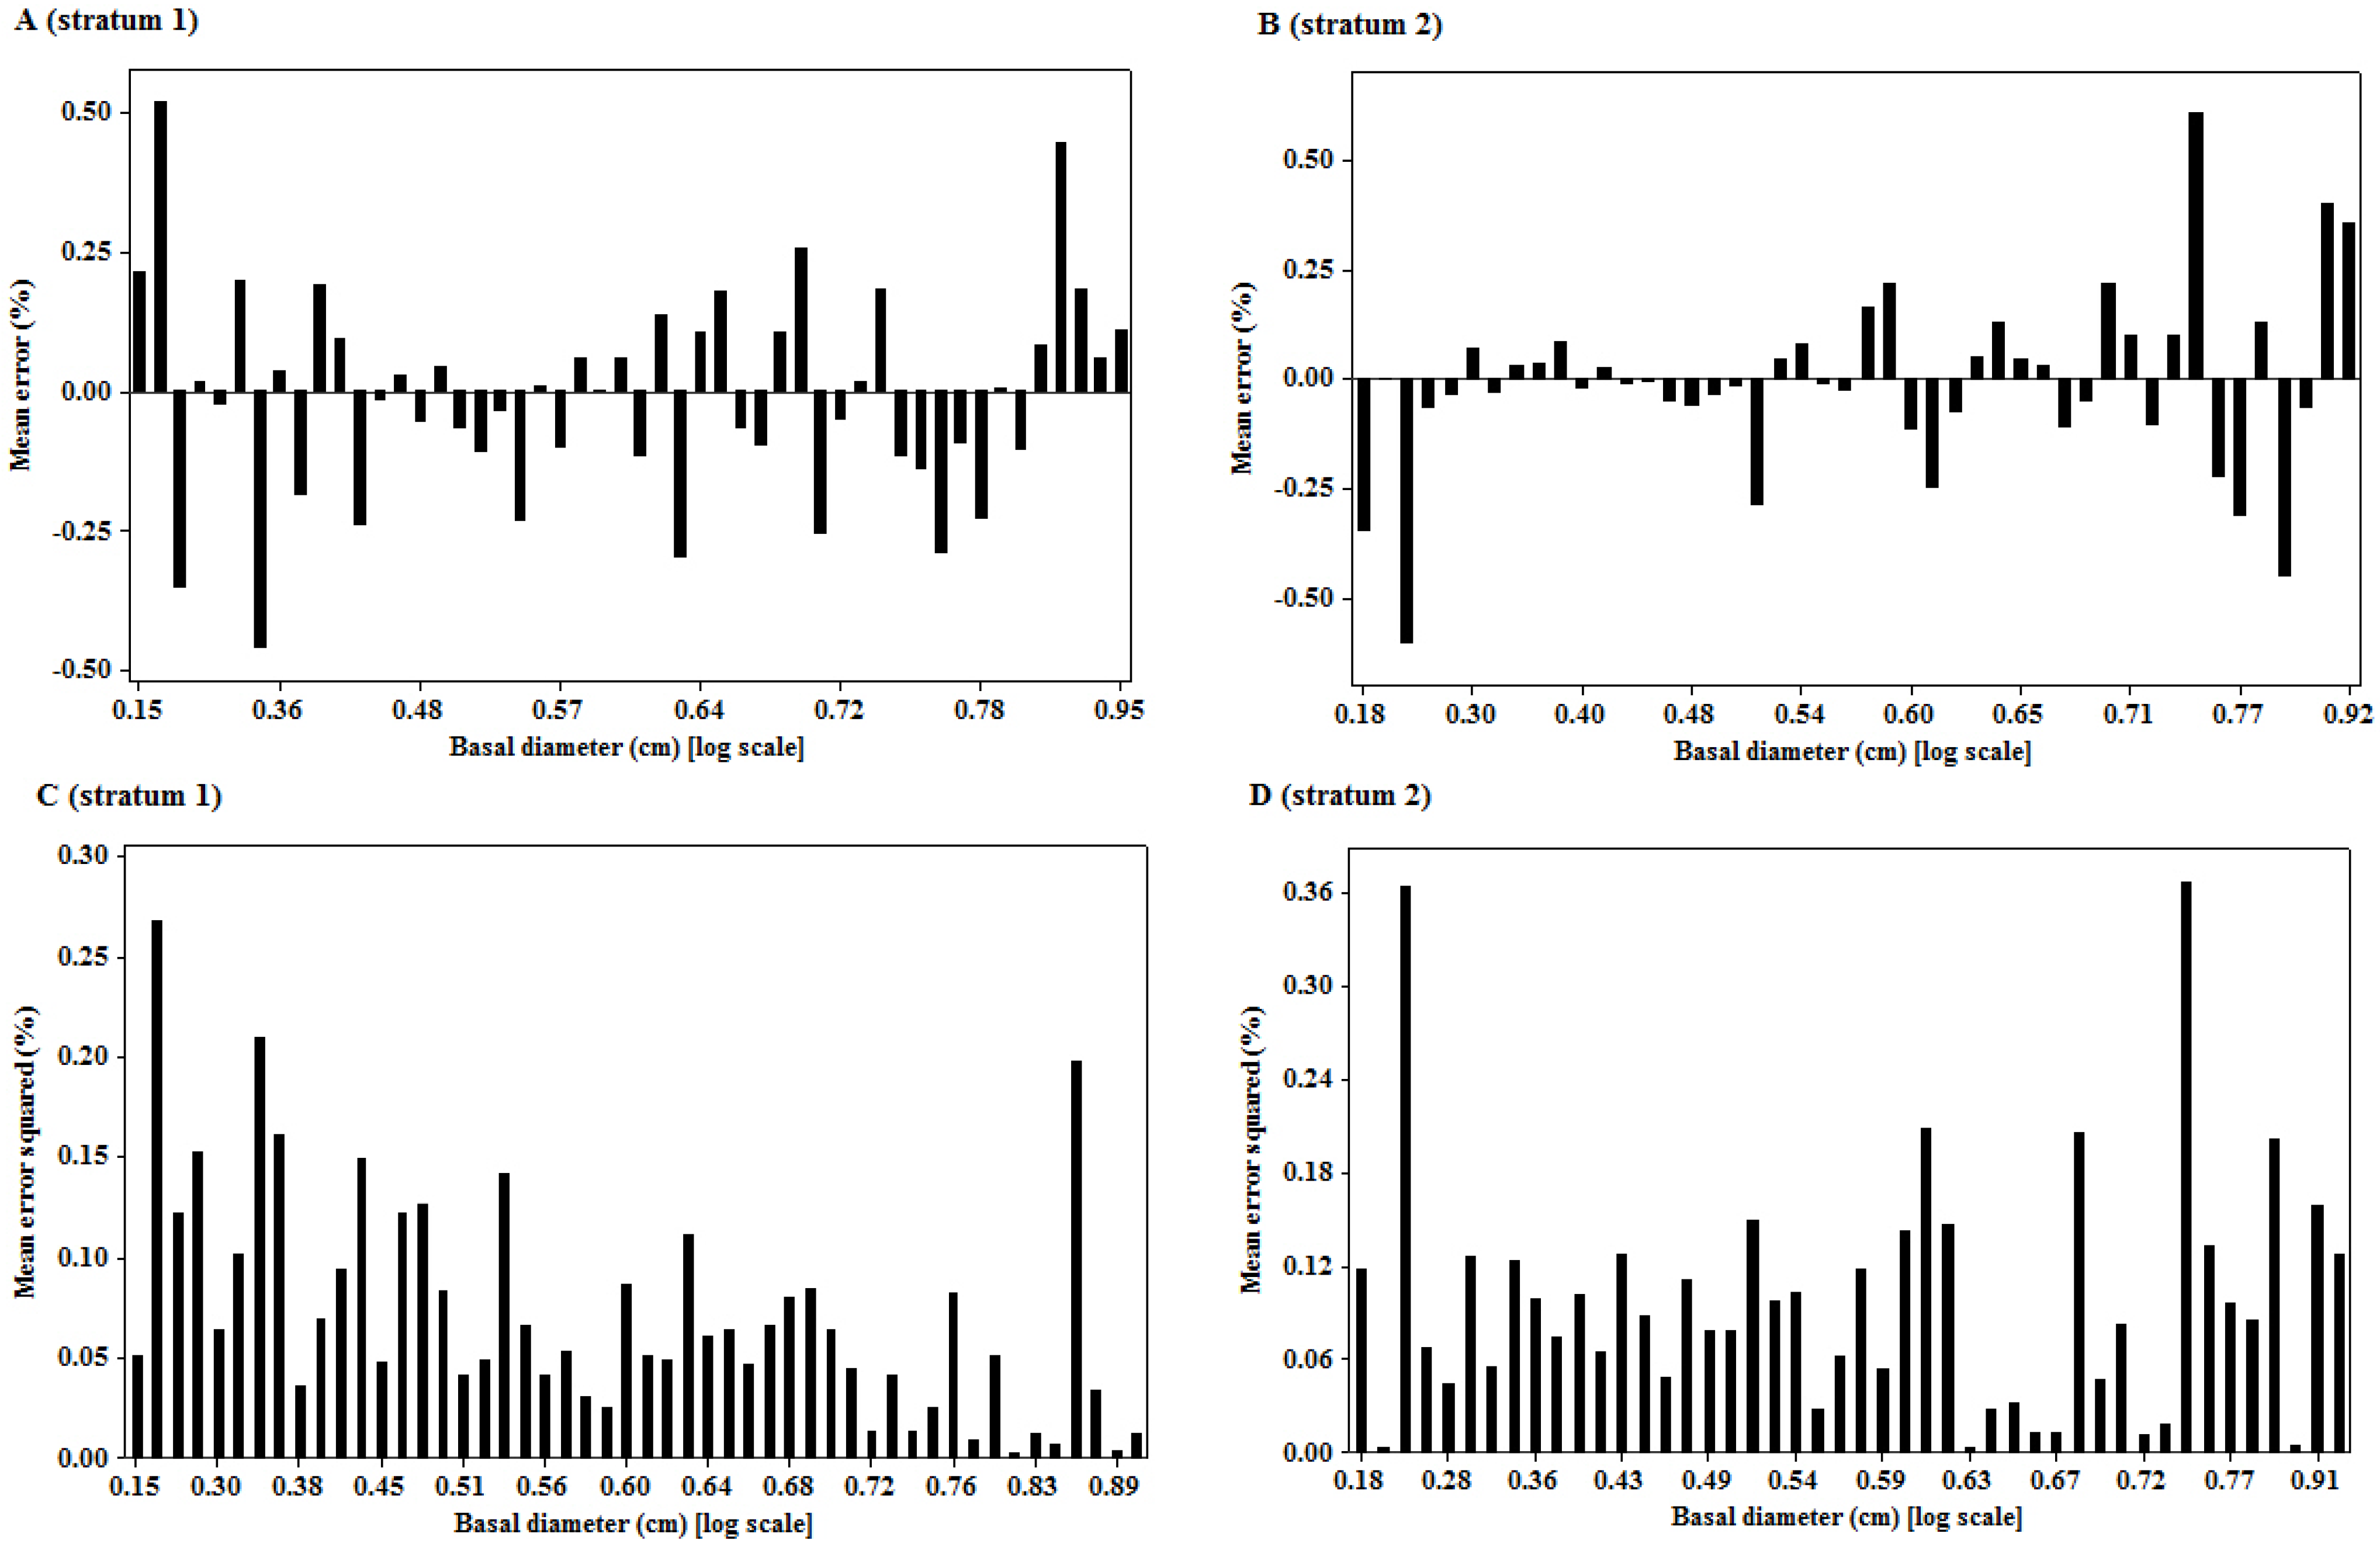
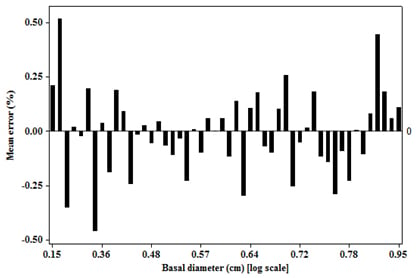
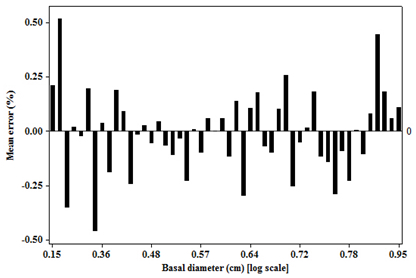
The significant linear relationship observed on the transformed variables is neither surprising nor new. The importance of the relationship of the two variables is underpinned by the size of the mean prediction errors, as the quality of landscape scale measures depend on this [7]. The unbiased estimates of the woody biomass observed in the study sites are an indication of the robustness of the model in providing such unbiased estimates at the landscape level. However, when considering the prediction of biomass of individual trees, the root mean square error (RMSE), as a measure of deviation of the estimated individual tree biomass from their mean, is more important than bias [7]. RMSE helped to get the variability of bias, as zero bias might result when under- or over-estimates cancel out while predicting a lot of trees, but the prediction of an individual tree may be inaccurate. The values of RMSE (%) observed in this study provide a measure of imprecision of the model for individual tree estimations. The imprecision of the model observed in this study might have been introduced by the rotational distortion that accompanies regression analyses performed on logarithms. Because of the nonlinear relationship between values expressed in arithmetic and logarithmic scales, small arithmetic values for predictor and response have a much greater influence than large values on parameters (scaling coefficient, β0, and exponent, β1) of the linear equations fitted on logarithmic transformations [36].
The weak relationship observed between tree height and woody biomass in this study may be due to the fact that the stem of Jatropha rarely grows to diameter at breast height (DBH) before branching [23]. Cole and Ewel [37] reported that complicated branching patterns of woody dicots (in which Jatropha is a member) obfuscate the form-function relationship that results in a weak relationship between the two size variables. These observations agree with our findings of a weak relationship between tree height that defines tree form and woody biomass (functional variable). Tree height is more tedious to measure in woody dicots and, as noted in this study, may not explain more of the variance at the site where the data originated. Ketterings et al. [38] observed, however, that the incorporation of tree height in allometric models has the advantage of increasing the equation’s potential applicability to different sites. This argument might apply for monocots, which show a strong relationship between the two size variables [37].
The consistent over-estimation of tree biomass estimates across the basal diameter size classes by other published Jatropha models (Ghezehei et al. [23] and Achten et al. [25]) indicates that these models are not appropriate for application in their present form for our study sites. The variations are mainly due to differences in the site characteristics, silvicultural practices, and development stage of the Jatropha plants on which allometric data was collected. Our study used data from actively growing Jatropha plants aged 12 to 33 months old that were planted and managed under smallholder farming systems, whereas the work by Achten et al. [25] was based on data from Jatropha seedlings that were planted in greenhouses, and Ghezehei’s work [23] was based on data from Jatropha trees that were grown under trial conditions with prescribed and scheduled silvicultural operations.
The most recent allometric research in trees and forests tends to focus on explaining the scaling of structural and functional properties of trees with measures of their body sizes (e.g., diameters, heights) [36]. West et al. [29] suggested that the scaling exponent (β1) should scale against tree diameter with a universal exponent β1 ≈ 2.67 on trees whose height increments are at their maximum. Pilli et al. [10] confirmed this theoretical value for adult plants and showed that the scaling exponent values are lower for younger trees (β1≈ 2.08–2.51). The lower exponent values for young trees (seedlings) were confirmed by Achten at al. [25]. The scaling exponent values for our study (β1 ≈2.891 and 2.769 for stratum 1 and 2 respectively) lie within 2.53 and 3.16 at the 95% confidence limits (Table 4). As such the above presented empirical allometric relationship of woody biomass fits well in a universal model [10] and confirms the results of Achten et al. [25] that Jatropha follows the universal allometric model described by [29] and confirmed by [5,10].

5. Conclusions

The present work has developed an allometric model for estimating the woody biomass of Jatropha planted on an agricultural landscape under a smallholder farming systems in Malawi. The predictive performance of the model was assessed and provided satisfactory estimates of woody biomass in the study sites with insignificant biases. The results of the statistical fits of the model were generally good, enabling one to use the model with confidence for the estimation of woody biomass in Jatropha stands on agricultural landscapes from which they were derived. The published Jatropha models of Achten et al. [25] and Ghezehei et al. [23] were tested and the results showed consistent over-estimation of tree biomass across the basal diameter classes, rendering them unsuitable for application in estimating tree biomass in our study sites.
Although the model provides precise estimates of the woody biomass of Jatropha, its use is limited to the range of the tree sizes that were used in its development and sites from where the data was collected (Salima, Nkhotakota, Dowa, Kasungu, and Mzimba districts). Outside these ranges, the model needs to be tested against the field data to determine its appropriateness. The observed robustness and precision of the model could have been enhanced if the effects of rotational distortion that accompanies regression analyses performed on logarithms was detected and eliminated, thereby reducing the imprecision of estimating individual tree biomass.

Acknowledgments

This study was funded by Bio-Energy Resources Limited (BERL) as part of the carbon monitoring system for the company. The financial support is gratefully acknowledged. During the course of this research, many individuals were involved in biomass sampling; we thank Adrian Semba and Boyd Zulu for coordinating and overseeing the field and laboratory work. We also thank the field staff and farmers of BERL who measured the sampled trees and acquired biomass samples for dry weight determination. The constructive and insightful comments provided by two anonymous reviewers are greatly acknowledged.

Conflict of Interest

The authors declare no conflict of interest.

References

  1. FAO, Forest Resource Assessment 2010; FAO: Rome, Italy, 2010.
  2. Government of Malawi, National Forest Act; Lilongwe, Malawi.
  3. Mascaro, J.; Litton, C.M.; Hughes, R.F.; Uowolo, A.; Schnitzer, S.A. Minimizing bias in biomass allometry: Model selection and log-transformation of data. Biotropica 2011, 43, 649–653. [Google Scholar] [CrossRef]
  4. Angelsen, A.; Brown, S.; Loisei, C.; Peskett, L.; Streck, C.; Zarin, D. Reducing Emissions from Deforestation and Forest Degradation (REDD); Technical Report for the Government of Norway; Meridian Institute: Washington, DC, USA, 2009. Available online: www.redd-oar.org (accessed on 7 November 2012).
  5. Preece, N.D.; Crowley, G.M.; Lawes, M.J.; van Oosterzee, P. Comparing aboveground biomass among forest types in wet tropics: Small stems and plantation types matter in carbon accounting. For. Ecol. Manag. 2012, 264, 228–237. [Google Scholar] [CrossRef]
  6. Chave, J.; Andalo, C.; Brown, S.; Cairns, M.A.; Chambers, J.Q.; Eamus, D.; Folster, H.; Fromard, F.; Higuchi, N.; Kira, T.; et al. Tree allometry and improved estimation of carbon stocks and balance in tropical forests. Oecologia 2005, 145, 87–99. [Google Scholar] [CrossRef]
  7. Kuyah, S.; Dietz, J.; Muthuri, C.; Jamnadass, R.; Mwangi, P.; Coe, R.; Neufeldt, H. Allometric equations for estimating biomass in agricultural landscapes: I. Aboveground biomass. Agric. Ecosyst. Environ. 2012, 158, 216–224. [Google Scholar] [CrossRef]
  8. Brown, S. Measuring carbon in forests: Current status and future challenges. Environ. Pollut. 2012, 116, 363–372. [Google Scholar] [CrossRef]
  9. Chave, J.; Condit, R.; Lao, S.; Caspersen, J.P.; Foster, R.B.; Hubbell, S.P. Spatial and temporal variation of biomass in a tropical forest: Results from a large census plot in Panama. J. Ecol. 2003, 91, 240–252. [Google Scholar] [CrossRef]
  10. Pilli, R.; Anfodillo, T.; Carrer, M. Towards a functional and simplified allometry for estimating forest biomass. For. Ecol. Manag. 2006, 237, 583–593. [Google Scholar] [CrossRef]
  11. Urquiza-Haas, T.; Dolman, P.M.; Peres, C.A. Regional scale variation in forest structure and biomass in the Yucatan Peninsula, Mexico: Effects of forest disturbance. For. Ecol. Manag. 2007, 247, 80–90. [Google Scholar] [CrossRef]
  12. Navar, J. Allometric equations for tree species and carbon stocks for forests of northwestern Mexico. For. Ecol. Manag. 2009, 257, 427–434. [Google Scholar] [CrossRef]
  13. Alvarez, E.; Duque, A.; Saldarriaga, J.; Cabrera, K.; de Las Salas, G.; del Valle, I.; Lema, A.; Moreno, F.; Orrego, S.; Rodriguez, L. Tree above-ground biomass allometries for carbon stocks estimation in the natural forests of Colombia. For. Ecol. Manag. 2012, 267, 297–308. [Google Scholar] [CrossRef]
  14. Chave, J.; Condit, R.; Aguilar, S.; Hernandez, A.; Lao, S.; Perez, R. Error propagation and scaling for tropical forest biomass estimates. Philos. Trans. R. Soc. B 2004, 359, 409–420. [Google Scholar] [CrossRef]
  15. Litton, C.M.; Sandquist, D.R.; Cordell, S. Effects of non-native grass invasion on aboveground carbon pools and tree population structure in a tropical dry forest of Hawaii. For. Ecol. Manag. 2006, 231, 105–113. [Google Scholar] [CrossRef]
  16. Litton, C.M.; Kauffman, J.B. Allometric models for predicting aboveground biomass in two widespread woody plants in Hawaii. Biotropica 2008, 40, 313–320. [Google Scholar] [CrossRef]
  17. Fonseca, W.; Alice, F.E.; Rey-Benayas, J.M. Carbon accumulation in aboveground and belowground biomass and soil of different age native forest plantations in the humid tropical lowlands of Costa Rica. New For. 2012, 43, 197–211. [Google Scholar]
  18. Morote, F.A.G.; Serrano, F.R.L.; Andreas, M.; Rubino, E.; Jimenez, J.L.G.; de las Heras, J. Allometries, biomass stocks and biomass allocation in the thermophilic Spanish juniper woodlands of Southern Spain. For. Ecol. Manag. 2012, 270, 85–93. [Google Scholar] [CrossRef]
  19. Stewart, J.L.; Dunsdon, A.J.; Hellin, J.J.; Hughes, C.E. Wood biomass estimation of Central American dry zone species. In Tropical Forestry Papers; Oxford Forestry Institute: Oxford, UK, 1992; p. 83. [Google Scholar]
  20. Eamus, D.; McGuinness, K.; Burrows, W. Review of Allometric Relationships for Estimating Woody Biomass for Queensland, the Northern Territory and Western Australia. National Carbon Accounting System (NCAS), Australian Greenhouse Office: Canberra, Australia, 2000. [Google Scholar]
  21. Openshaw, K. A review of Jatropha curcas: An oil plant of unfulfilled promise. Biomass Bioenerg. 2000, 19, 1–15. [Google Scholar] [CrossRef]
  22. Rasmussen, L.V.; Rasmussen, K.; Bruun, T.B. Impacts of Jatropha-based biodiesel production on above and belowground carbon stocks. A case study from Mozambique. Energy Policy 2012, 51, 728–736. [Google Scholar] [CrossRef]
  23. Ghezehei, S.B.; Annandale, J.G.; Everson, C.S. Shoot allometry of Jatropha curcas. South. For. 2009, 71, 279–286. [Google Scholar]
  24. Verified Carbon Standard—Agriculture, Forestry and Other Land Use Requirements, VCS v3.0 2011. Available online: www.v-c-s.org (accessed on 18 January 2013).
  25. Achten, W.M.J.; Maes, W.H.; Reubens, B.; Mathijs, E.; Singh, V.P.; Verchot, L.; Muys, B. Biomass production and allocation in Jatropha curcas L. seedlings under different levels of drought stress. Biomass Bioenerg. 2010, 34, 667–676. [Google Scholar] [CrossRef]
  26. Brassard, B.W.; Chen, H.Y.H.; Bergeron, Y.; Pare, D. Coarse root biomass allometric equations for Abies balsamea, Picea mariana, Pinus banksiana, and Populus tremuloides in the boreal forest of Ontario, Canada. Biomass Bioenerg. 2011, 35, 4189–4196. [Google Scholar] [CrossRef]
  27. Mponela, P.; Jumbe, C.B.L.; Mwase, W.F. Determinants and extent of land allocation for Jatropha curcas L. cultivation among smallholder farmers in Malawi. Biomass Bioenerg. 2011, 35, 2499–2505. [Google Scholar] [CrossRef]
  28. Hardcastle, P.D. A Preliminary Silvicultural Classification of Malawi; Forerstry Research Institute of Malawi: Zomba, Malawi, 1978. [Google Scholar]
  29. West, G.B.; Brown, J.H.; Enquist, B.J. A general model for the structure and allometry of plant vascular systems. Nature 1999, 400, 664–667. [Google Scholar]
  30. Kaitaniemi, P. Testing allometric scaling laws. J. Theory Biol. 2004, 228, 149–153. [Google Scholar] [CrossRef]
  31. Djomo, A.N.; Ibrahima, A.; Saborowski, J.; Gravenhorst, G. Allometric equations for biomass estimations in Cameroon and pan moist tropical equations including biomass data from Africa. For. Ecol. Manag. 2010, 260, 1873–1885. [Google Scholar] [CrossRef]
  32. Parresol, B.R. Assessing tree and stand biomass: A review with examples and critical comparisons. For. Sci. 1999, 45, 573–593. [Google Scholar]
  33. Ong, J.E.; Gong, W.K.; Wong, C.H. Allometry and partitioning of the mangrove, Rhizophora apiculata. For. Ecol. Manag. 2004, 188, 395–408. [Google Scholar] [CrossRef]
  34. Warton, D.I.; Wright, I.J.; Falster, D.S.; Westoby, M. Bivariate line-fitting methods for allometry. Biol. Rev. 2006, 81, 259–291. [Google Scholar]
  35. Osborne, J.W. Notes on the use of data transformations. Pract. Assess. Res. Eval. 2002. Available online: http://PAREonline.net/getvn.asp?v=8&n=6 (accessed on 13 March 2013).
  36. Packard, G.C.; Birchard, G.F.; Boardman, T.J. Fitting statistical models in bivariate allometry. Biol. Rev. 2011, 86, 549–563. [Google Scholar] [CrossRef]
  37. Cole, G.; Ewel, J.J. Allometric equations for four valuable tropical species. For. Ecol. Manag. 2006, 229, 351–360. [Google Scholar] [CrossRef]
  38. Ketterings, Q.M.; Coe, R.; Noordwijk, M.; Ambagau, Y.; Palm, C.A. Reducing uncertainty in the use of allometric biomass equations for predicting above-ground tree biomass in mixed secondary forests. For. Ecol. Manag. 2001, 146, 199–209. [Google Scholar] [CrossRef]

