Specific Gravity of Hybrid Poplars in the North-Central Region, USA: Within-Tree Variability and Site × Genotype Effects


Abstract
:
1. Introduction

| Study Location | Age (yrs) | Genomic Group 1 | Clones (#) | Specific Gravity | Reference |
|---|---|---|---|---|---|
| Gorgan, Iran | 22 | D × N | 1 | 0.33–0.36 | Kord et al. [26] |
| Quebec, Canada | 10, 12 | D | 4 | 0.37–0.39 | Pliura et al. [24] |
| T × D | 3 | 0.34–0.36 | |||
| D × N | 4 | 0.32–0.34 | |||
| M × B | 4 | 0.29–0.31 | |||
| B × N | 4 | 0.31–0.34 | |||
| Overall | 19 | 0.29–0.45 | |||
| Quebec, Canada | 10 | D | 3 | 0.36–0.37 | Pliura et al. [23] |
| T × D | 3 | 0.33–0.34 | |||
| D × N | 3 | 0.32–0.35 | |||
| M × B | 3 | 0.28–0.32 | |||
| Overall | 12 | 0.26–0.38 | |||
| New York, USA | 3 | D × N | 5 | 0.33–0.37 | Tharakan et al. [22] |
| N × M | 2 | 0.34–0.36 | |||
| Quebec, Canada | 3 | Overall 2 | 21 | 0.27–0.48 | Zhang et al. [33] |
| Washington, USA | 9 | T | 1 | 0.31–0.46 | DeBell et al. [30] |
| T × D | 2 | 0.29–0.47 | |||
| Iowa, USA | 4 | A × A | 1 | 0.32–0.42 | Semen et al. [34] |
| A × G | 1 | 0.29–0.35 | |||
| A × Tr | 1 | 0.36–0.37 | |||
| Kansas, USA | 4 | D | 9 | 0.34–0.40 3 | Geyer et al. [29] |
| D × N | 2 | 0.35–0.37 | |||
| Quebec, Canada | 9 | D × N | 10 | 0.30–0.40 | Hernández et al. [32] |
| Hungary | 10, 15 | D × N | 3 | 0.30–0.36 | Mátyás and Peszlen [21] |
| Ontario, Canada | 12 | B | 90 | 0.29–0.41 | Ivkovich [31] |
| Quebec, Canada | 9 | D × N | 10 | 0.28–0.41 | Beaudoin et al. [28] |
| Pennsylvania, USA | 4 | M × T | 1 | 0.39–0.46 | Blankenhorn et al. [35] |
| Mississippi Valley, USA | 3 | D | 75 | 0.27–0.39 | Olson et al. [25] |
| Pennsylvania, USA | 4 | M | 1 | 0.41–0.48 | Murphey et al. [36] |
| T | 1 | 0.40–0.50 | |||
| M × T | 1 | 0.39–0.49 |
2. Experimental Section
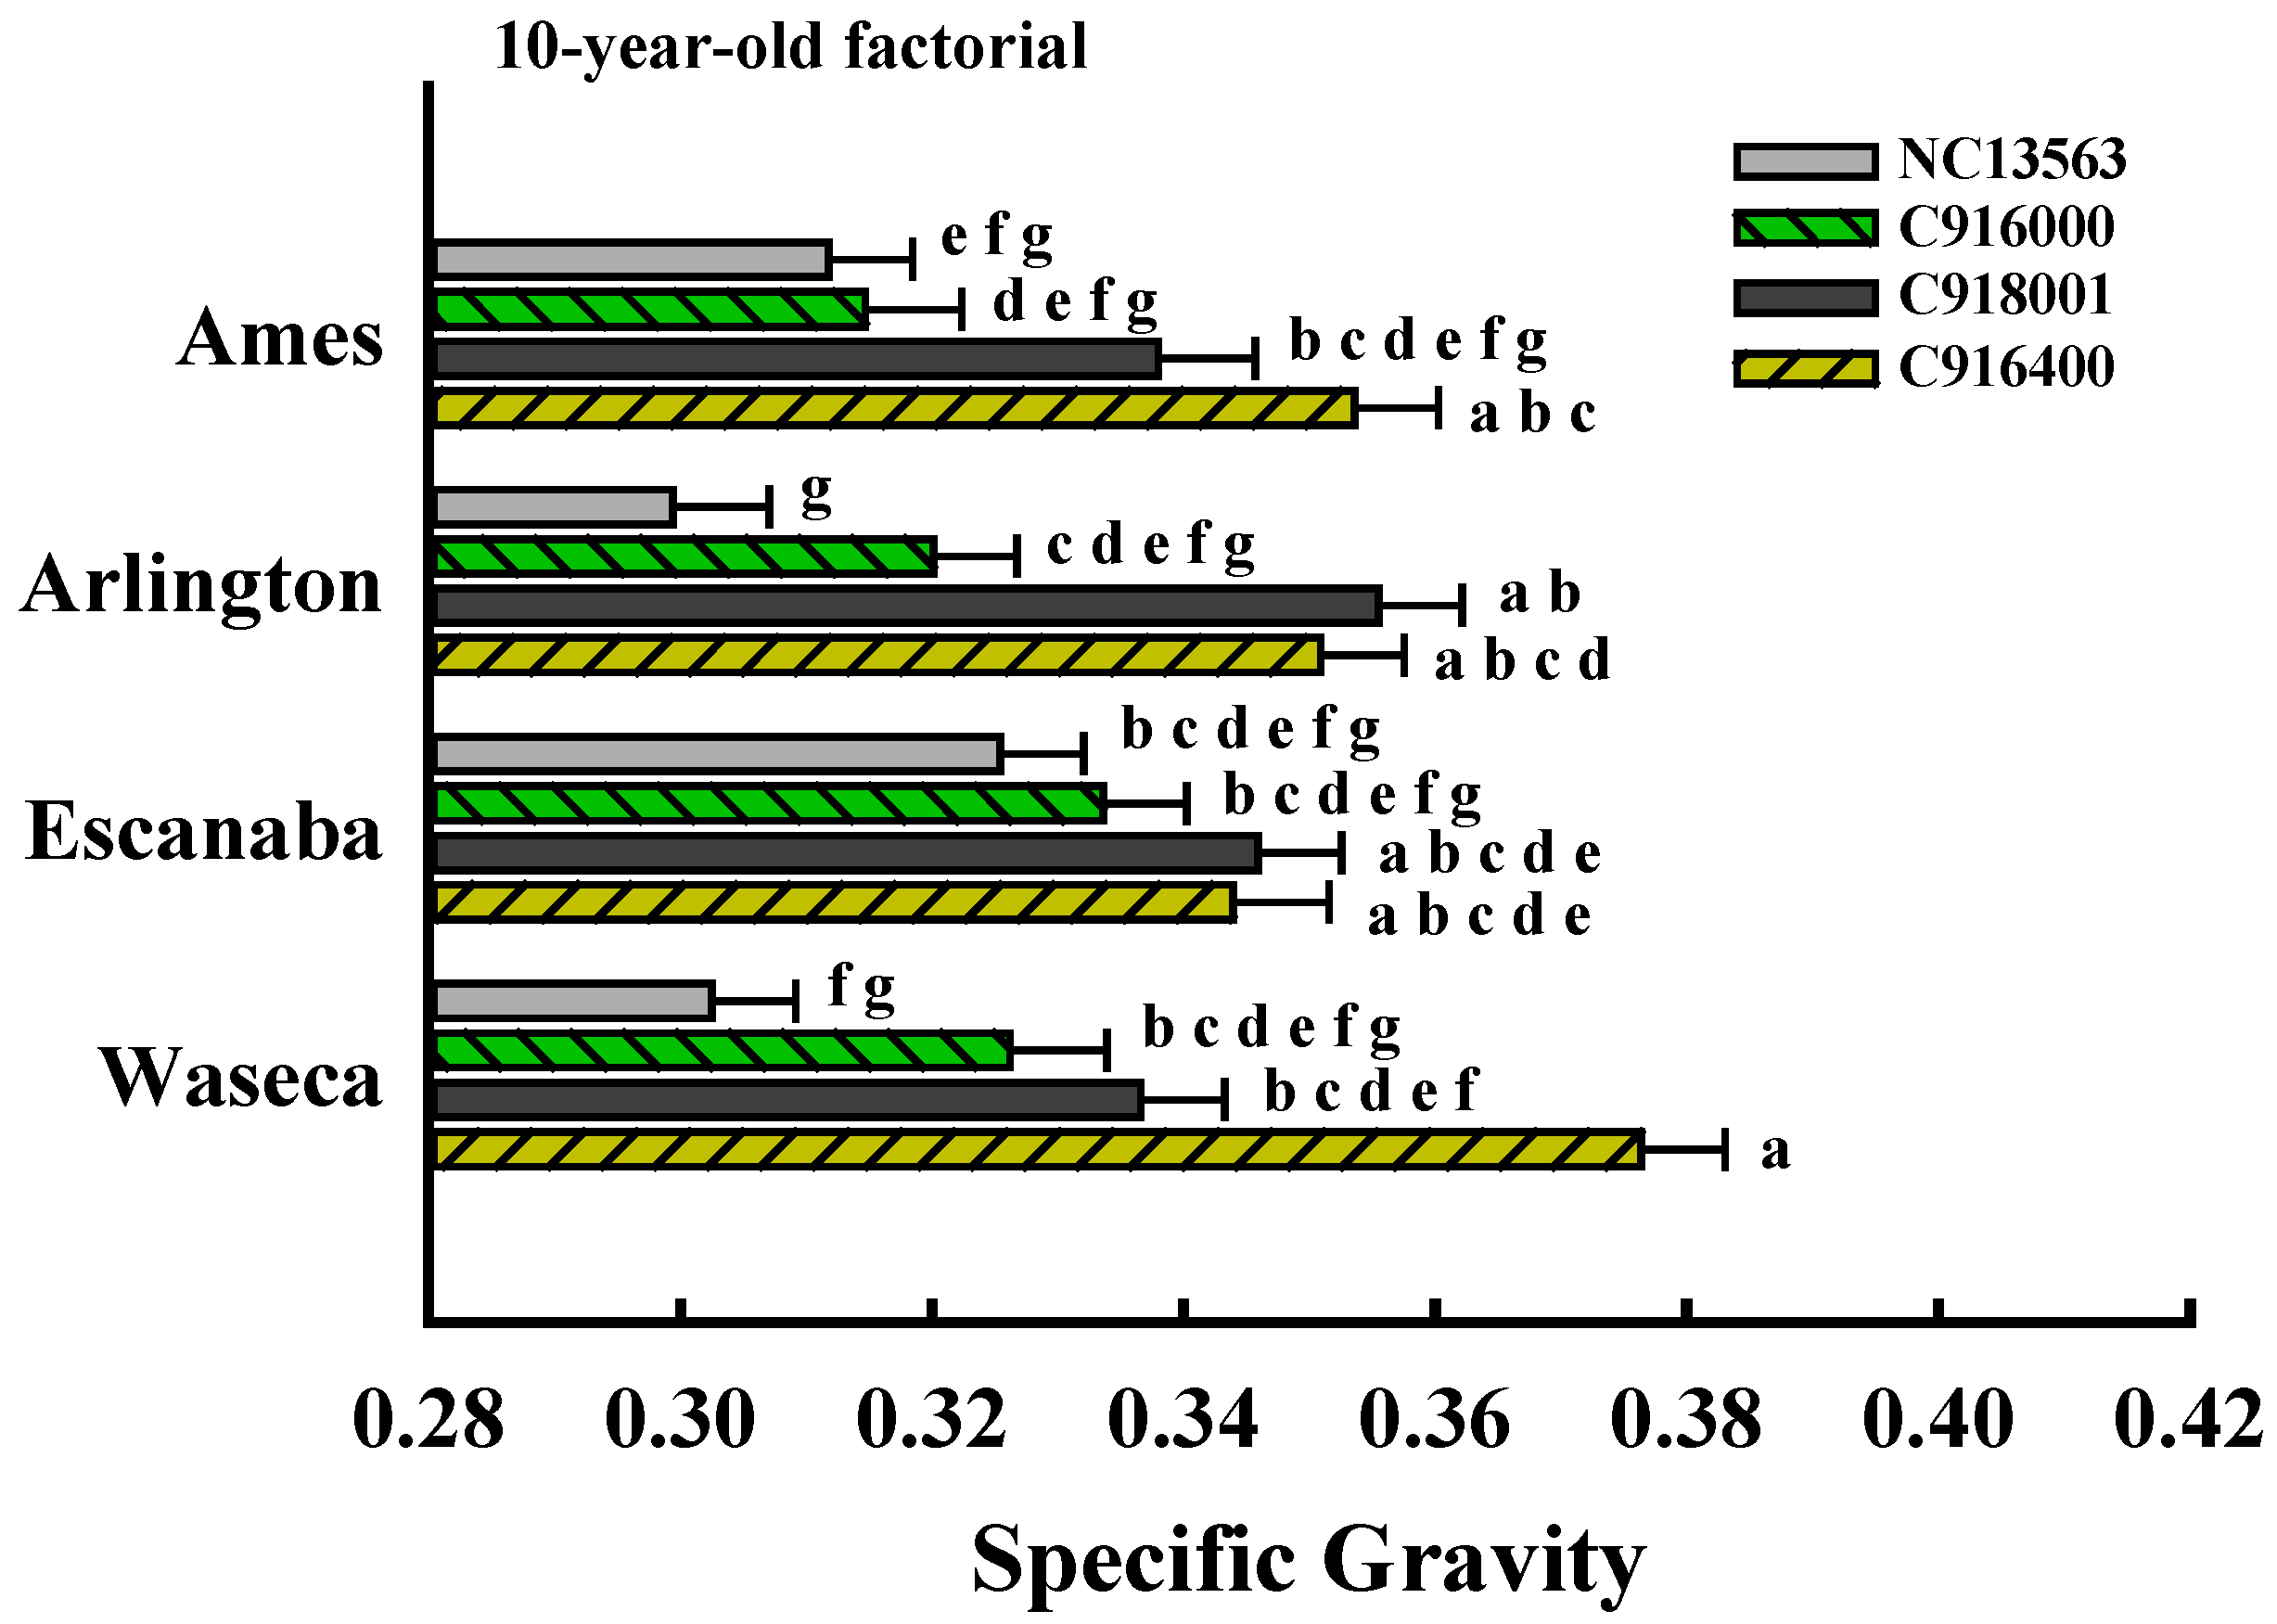
2.1. Site and Clone Selection

| State 1 | Site | Year Planted | Height (m) 2 | Lat (°N) 3 | Long (°W) 3 | Soil Texture | ASW (cm) 4 | WT (cm) 4 | P (mm) 5 | Tavg (°C) 5 | Tdiff (°C) 5 |
|---|---|---|---|---|---|---|---|---|---|---|---|
| IA | Ames | 2000 | 15.1 ± 0.4 | 42.05 | 93.66 | Fine Sandy Loam | 17.36 | 122 | 880.6 | 17.0 | 12.6 |
| IA | Kanawha | 1995 | 18.7 ± 0.3 | 42.93 | 93.80 | Clay Loam | 18.65 | 0 | 849.4 | 15.8 | 11.9 |
| IA | Sutherland | 1995 | 18.5 ± 0.6 | 42.93 | 95.54 | Silty Clay Loam | 20.40 | 0 | 780.3 | 16.3 | 13.9 |
| MI | Escanaba | 2001 | 12.5 ± 0.2 | 45.77 | 87.20 | Fine Sandy Loam | 15.01 | >200 | 728.2 | 12.6 | 11.1 |
| MN | Belgrade | 1990 | 17.2 ± 0.4 | 45.67 | 95.11 | Loam | 18.20 | 76 | 653.0 | 15.3 | 14.3 |
| MN | Bemidji | 1988 | 17.9 ± 0.3 | 47.58 | 94.93 | Loamy Sand | 10.39 | >200 | 676.4 | 12.7 | 11.8 |
| MN | Fairmont | 1988 | 18.7 ± 0.2 | 43.69 | 94.35 | Clay Loam | 18.35 | 15 | 830.8 | 16.5 | 11.4 |
| MN | Granite Falls | 1987 | 21.4 ± 0.8 | 44.80 | 95.52 | Loam | 19.09 | 75 | 726.7 | 15.3 | 12.8 |
| MN | Lamberton | 1988 | 18.7 ± 0.9 | 44.25 | 95.29 | Clay Loam | 18.00 | 15 | 709.7 | 15.6 | 13.3 |
| MN | Milaca | 1989 | 19.4 ± 0.3 | 45.78 | 93.63 | Silt Loam | 18.39 | 15 | 748.3 | 14.1 | 12.9 |
| MN | Ulen | 1989 | 14.4 ± 0.5 | 47.09 | 96.18 | Loam | 16.90 | 15 | 628.1 | 14.3 | 13.2 |
| MN | Warren | 1989 | 20.8 ± 0.7 | 48.14 | 96.65 | Fine Loamy Sand | 9.73 | 60 | 547.6 | 13.4 | 14.3 |
| MN | Waseca | 2000 | 16.3 ± 0.4 | 44.06 | 93.54 | Clay Loam | 18.36 | 45 | 907.3 | 15.9 | 11.9 |
| WI | Arlington | 2000 | 18.0 ± 0.3 | 43.29 | 89.37 | Silt Loam | 21.64 | 61 | 869.2 | 14.7 | 13.9 |
| WI | Lancaster | 1991 | 22.5 ± 1.3 | 42.82 | 90.79 | Silt Loam | 15.23 | >200 | 898.4 | 15.5 | 10.9 |
| WI | Mondovi | 1988 | 19.3 ± 0.3 | 44.52 | 91.65 | Silt Loam | 21.12 | >200 | 881.1 | 15.4 | 15.0 |
| WI | Rhinelander | 1988 | 21.5 ± 0.6 | 45.63 | 89.46 | Loamy Sand | 7.43 | 61 | 675.4 | 13.0 | 12.9 |

2.2. Field and Laboratory Sampling
2.3. Specific Gravity Measurements
2.4. Experimental Design and Data Analysis
| Dataset | Number of: | |||
|---|---|---|---|---|
| Trees | Sites 1 | Clones 1 | Site × Clone Combinations | |
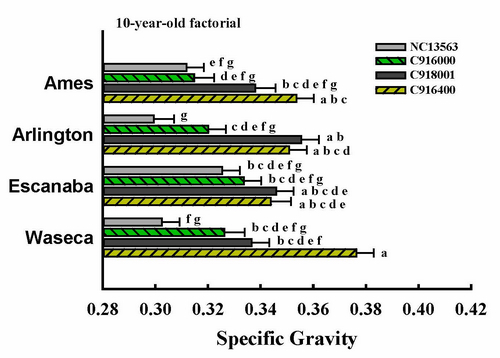
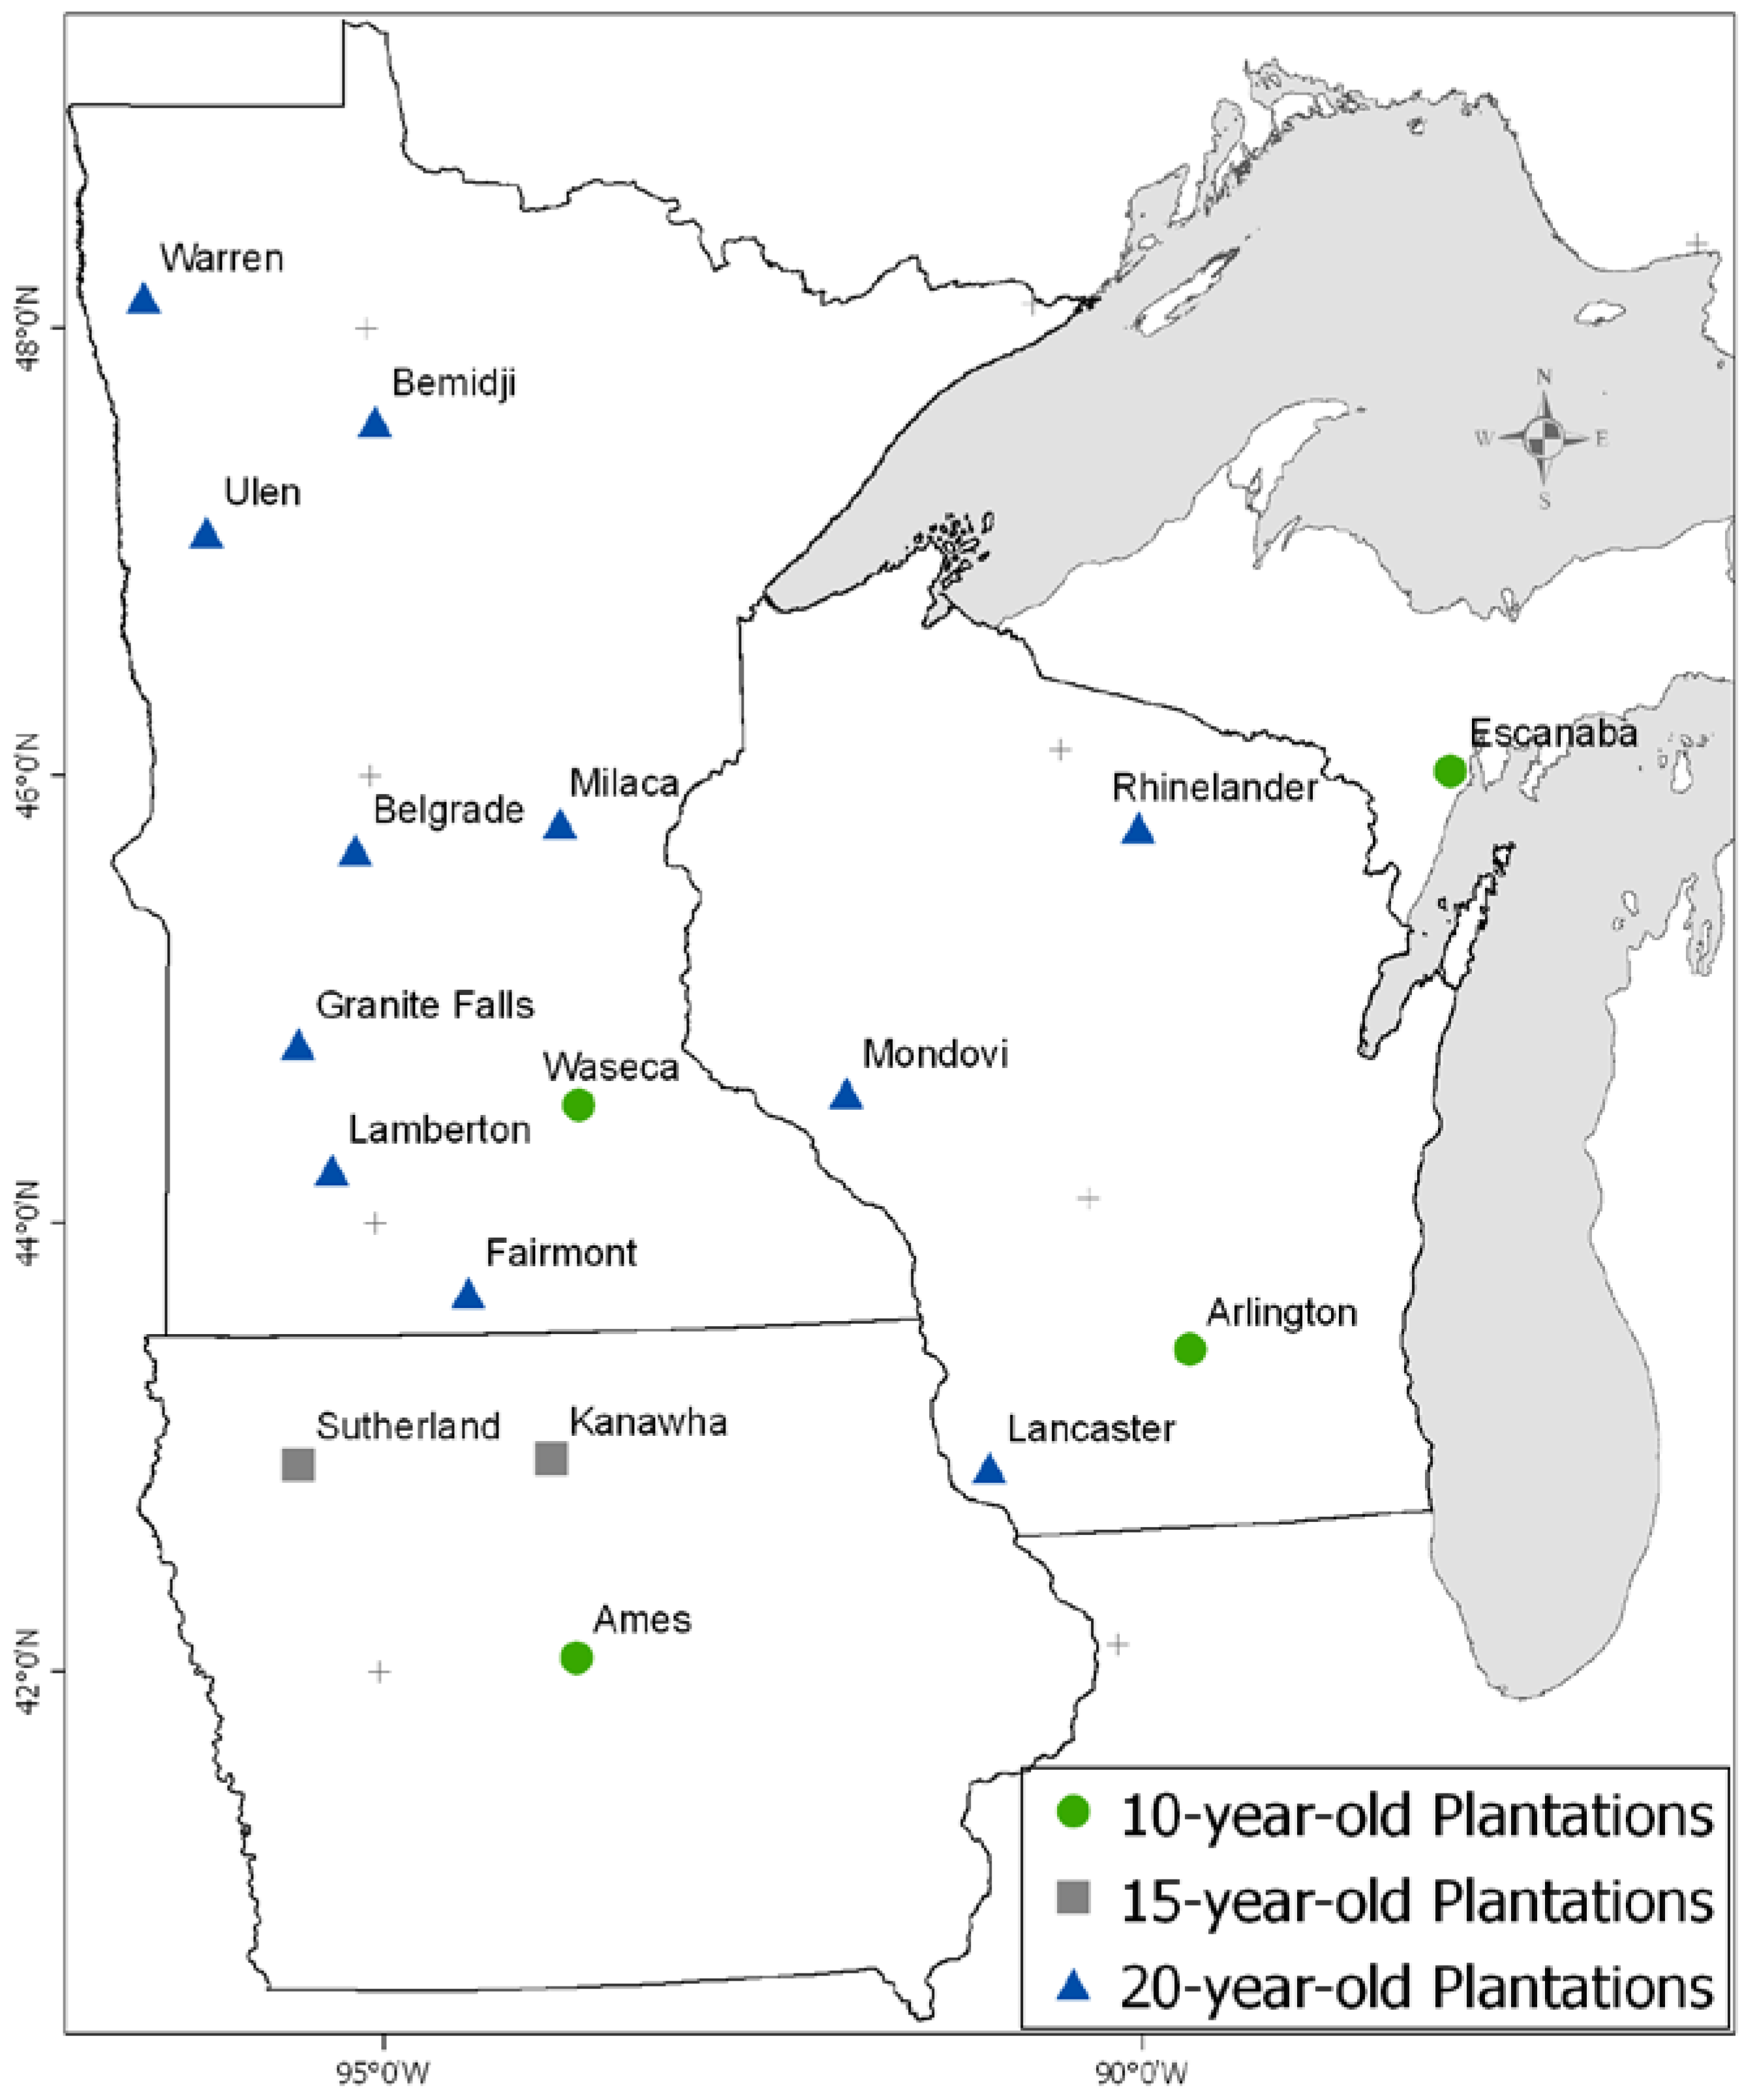
| 10-year-old factorial | 59 | 4 | 4 | 16 |
| 20-year-old factorial | 71 | 9 | 2 | 18 |
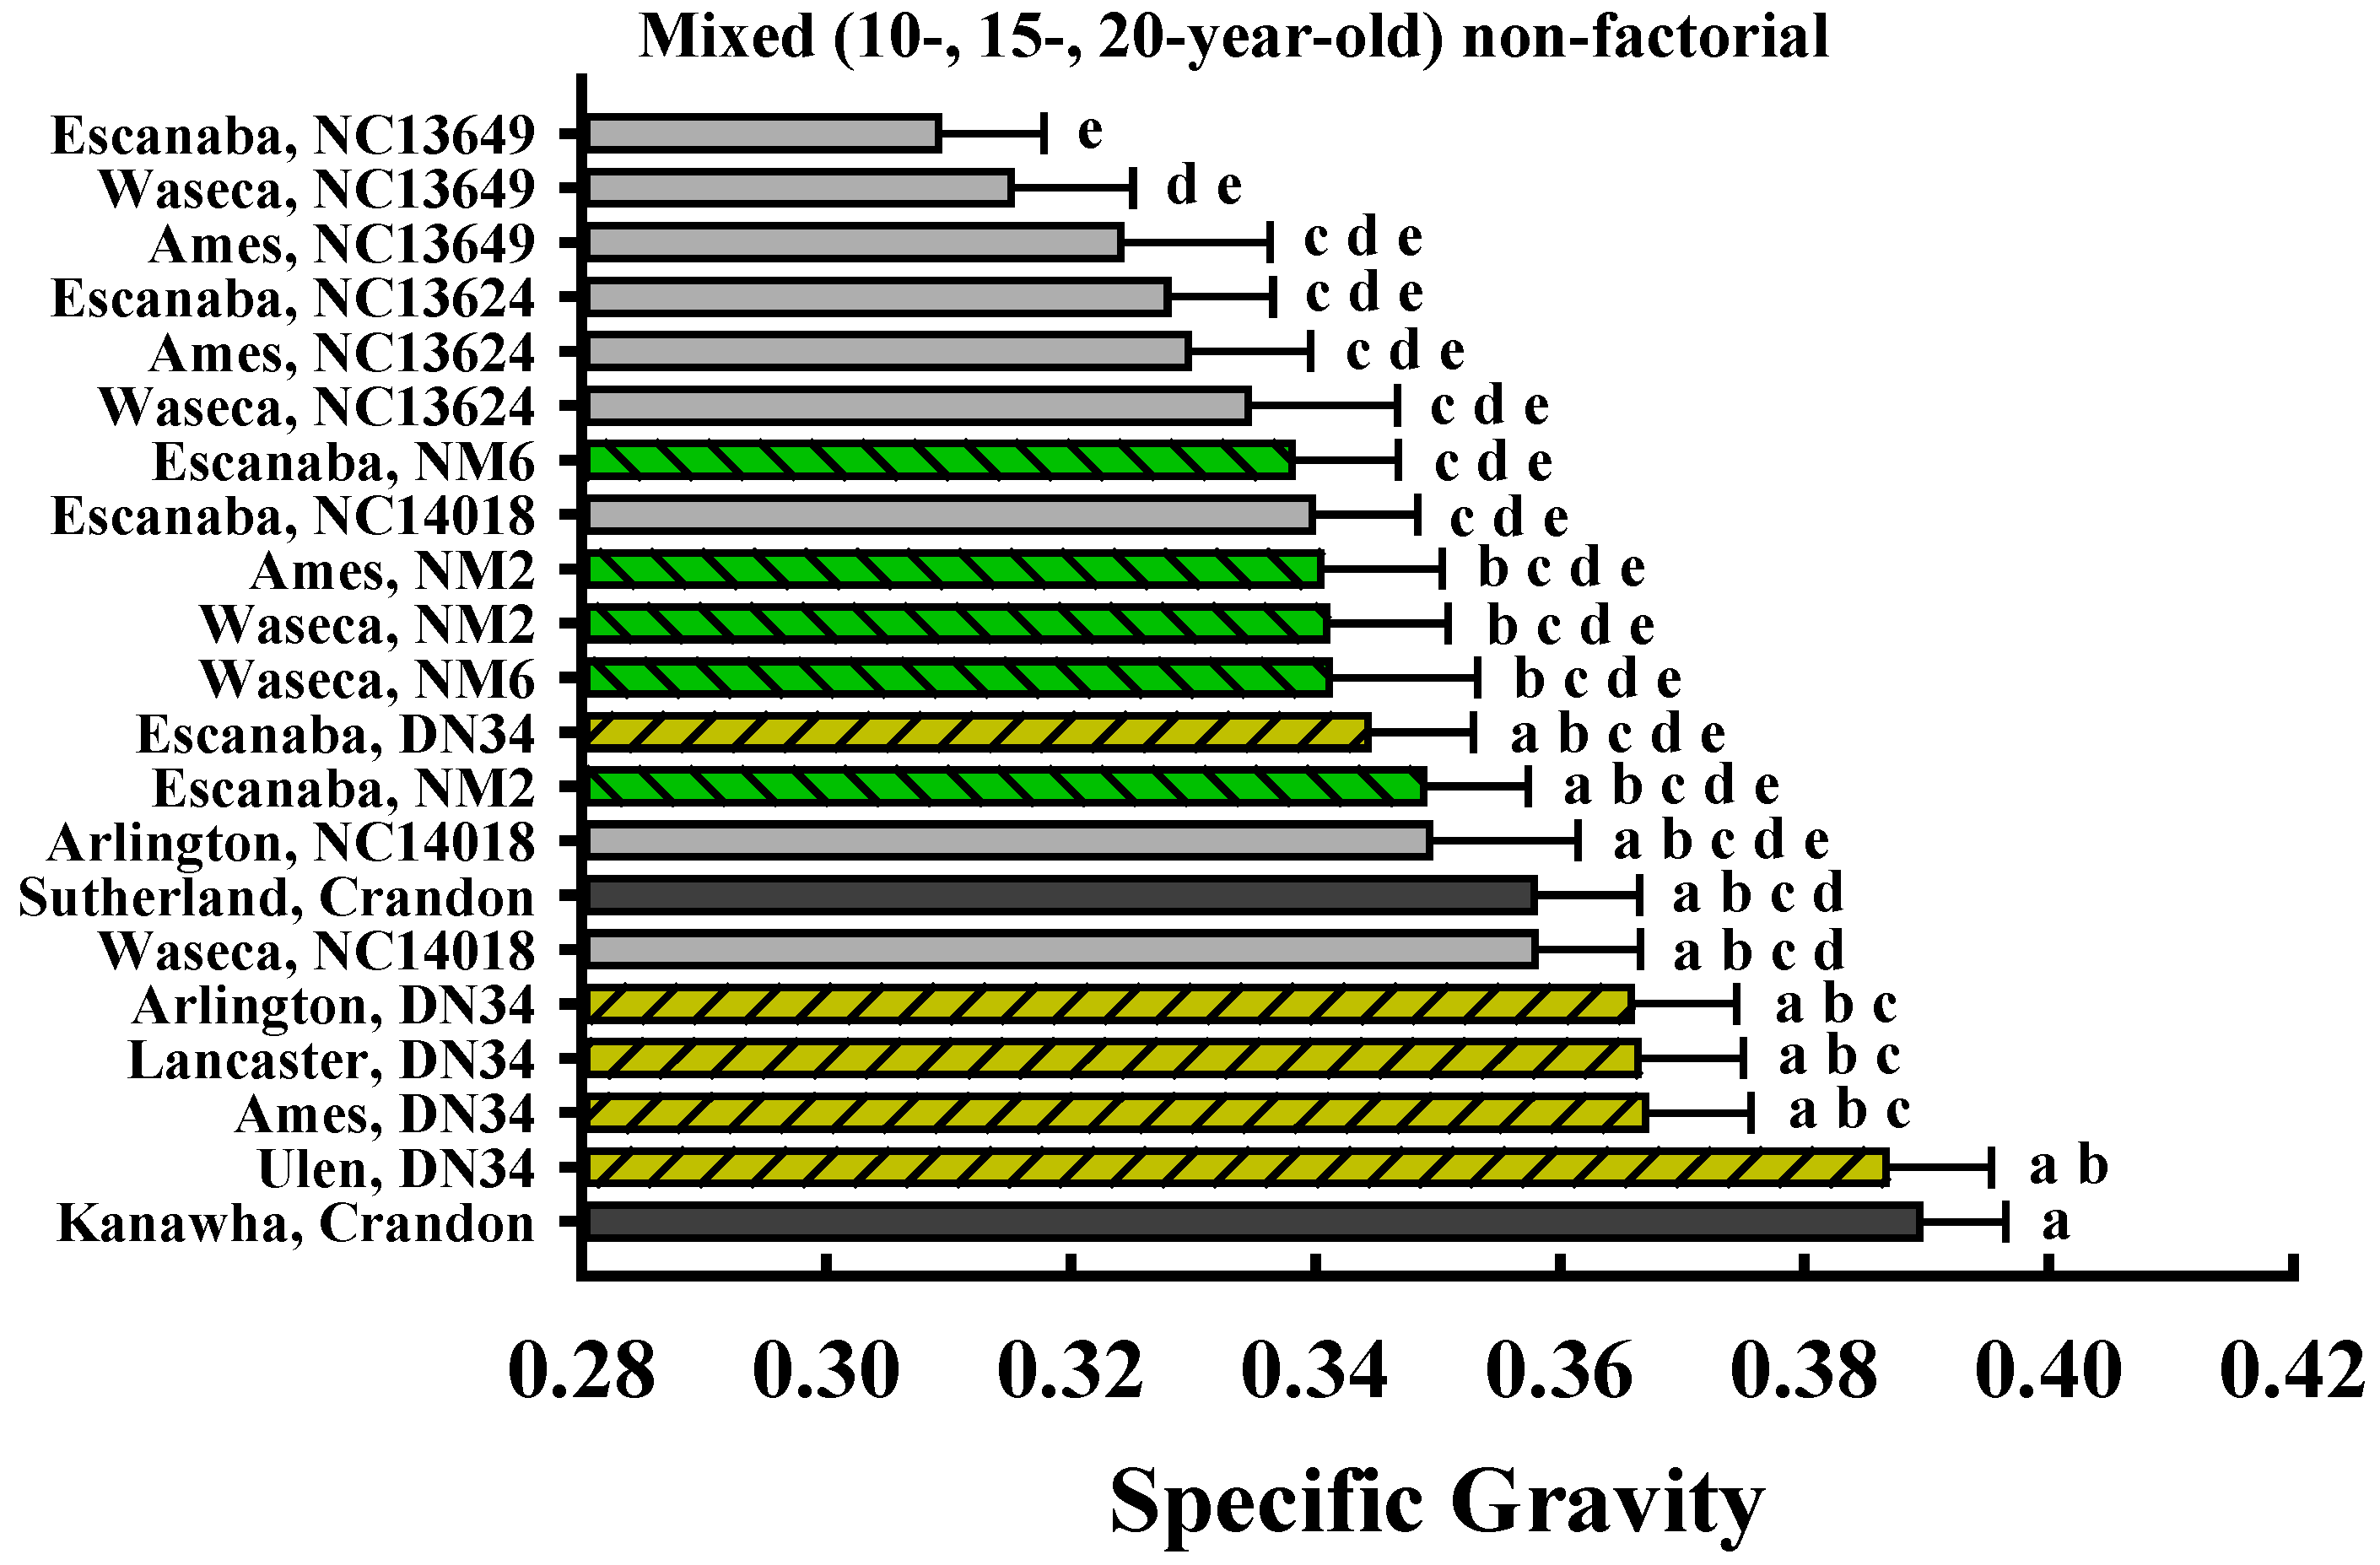
| Mixed (10-, 15-, and 20-year-old) non-factorial 2 | 74 | 8 | 7 | 21 |
3. Results and Discussion
3.1. ANOVA Results
| Source of Variation | p-Value |
|---|---|
| ------- 10-year-old factorial ------- | |
| Site | 0.4011 |
| Clone | <0.0001 |
| Site × Clone | 0.0078 |
| Position | 0.0002 |
| Position × Site | 0.1293 |
| Position × Clone | 0.5963 |
| Position × Site × Clone | 0.5212 |
| ------- 20-year-old factorial ------- | |
| Site | <0.0001 |
| Clone | 0.4529 |
| Site × Clone | 0.0430 |
| Position | <0.0001 |
| Position × Site | 0.0010 |
| Position × Clone | 0.0183 |
| Position × Site × Clone | 0.1918 |
| ------- Mixed (non-factorial) ------- | |
| Site × Clone | <0.0001 |
| Position | <0.0001 |
| Position × Site × Clone | 0.1213 |

| Site | Position 1 | Specific Gravity |
|---|---|---|
| Belgrade | 2/3 | 0.412 ± 0.007 a |
| Fairmont | 2/3 | 0.405 ± 0.007 ab |
| Milaca | 2/3 | 0.400 ± 0.007 abc |
| Fairmont | 1/3 | 0.397 ± 0.007 abcd |
| Bemidji | 2/3 | 0.396 ± 0.007 abcde |
| Rhinelander | 2/3 | 0.395 ± 0.007 abcde |
| Lamberton | 2/3 | 0.387 ± 0.007 bcdef |
| Granite Falls | 2/3 | 0.380 ± 0.008 cdefg |
| Lamberton | 1/3 | 0.379 ± 0.007 defg |
| Warren | 2/3 | 0.377 ± 0.007 efgh |
| Warren | DBH | 0.372 ± 0.007 fghi |
| Belgrade | 1/3 | 0.371 ± 0.007 fghi |
| Milaca | 1/3 | 0.370 ± 0.007 fghij |
| Warren | 1/3 | 0.366 ± 0.007 ghijk |
| Mondovi | 2/3 | 0.364 ± 0.007 ghijkl |
| Bemidji | 1/3 | 0.362 ± 0.007 ghijklm |
| Lamberton | DBH | 0.359 ± 0.007 hijklmn |
| Fairmont | DBH | 0.358 ± 0.007 hijklmn |
| Granite Falls | 1/3 | 0.353 ± 0.008 ijklmno |
| Rhinelander | 1/3 | 0.353 ± 0.007 ijklmno |
| Bemidji | DBH | 0.351 ± 0.007 jklmno |
| Belgrade | DBH | 0.346 ± 0.007 klmno |
| Milaca | DBH | 0.345 ± 0.007 lmno |
| Granite Falls | DBH | 0.342 ± 0.008 mno |
| Rhinelander | DBH | 0.340 ± 0.007 no |
| Mondovi | 1/3 | 0.339 ± 0.007 no |
| Mondovi | DBH | 0.333 ± 0.007 o |


3.2. Interpretation of Position Effects
3.3. Interpretation of Site × Clone Interactions Using Site Covariates
| Clone | Age (y) | Slope(Clone × WT) | P(Slope = 0) |
|---|---|---|---|
| C916000 | 10 | 0.000015 | 0.8636 |
| C916400 | 10 | −0.000186 | 0.0394 |
| C918001 | 10 | −0.000038 | 0.6669 |
| DN34 | 10 | −0.000234 | 0.0411 |
| DN34 | 20 | −0.000070 | 0.1084 |
| DN182 | 20 | −0.000138 | 0.0105 |
| NC13563 | 10 | 0.000124 | 0.1625 |
| NC13624 | 10 | −0.000062 | 0.5159 |
| NC13649 | 10 | −0.000058 | 0.5440 |
| NC14018 | 10 | −0.000139 | 0.1216 |
| NM2 | 10 | 0.000031 | 0.7426 |
| NM6 | 10 | −0.000039 | 0.6836 |
3.4. Correlations between Specific Gravity and Growth Rate
3.5. Genetic Trends in Specific Gravity
4. Conclusions
Acknowledgments
Conflict of Interest
References
- Zalesny, R.S., Jr.; Donner, D.M.; Coyle, D.R.; Headlee, W.L. An approach for siting poplar energy production systems to increase productivity and associated ecosystem services. For. Ecol. Manag. 2012, 284, 45–58. [Google Scholar] [CrossRef]
- Millennium Ecosystem Assessment (MEA). In Ecosystems and Human Well-Being: Synthesis; Island Press: Washington, DC, USA, 2005; p. 155.
- Thelemann, R.; Johnson, G.; Sheaffer, C.; Banerjee, S.; Cai, H.; Wyse, D. The effect of landscape position on biomass crop yield. Agron. J. 2010, 102, 513–522. [Google Scholar] [CrossRef]
- Headlee, W.L. Productivity and Biometry of Hybrid Poplars with Respect to Establishment, Regeneration, Regional Modeling, and Utilization of Bio-Energy Byproducts. Ph.D. Thesis, Iowa State University, Ames, IA, USA, 2012. [Google Scholar]
- Burken, J.G.; Schnoor, J.L. Predictive relationships for uptake of organic contaminants by hybrid poplar trees. Environ. Sci. Technol. 1998, 32, 3379–3385. [Google Scholar] [CrossRef]
- Zalesny, J.A.; Zalesny, R.S., Jr.; Wiese, A.H.; Sexton, B.T.; Hall, R.B. Uptake of macro- and micro-nutrients into leaf, woody, and root tissue of Populus after irrigation with landfill leachate. J. Sust. For. 2008, 27, 303–327. [Google Scholar] [CrossRef]
- Headlee, W.L.; Zalesny, R.S., Jr.; Donner, D.M.; Hall, R.B. Using a process-based model (3-PG) to predict and map hybrid poplar biomass productivity in Minnesota and Wisconsin, USA. Bioenergy Res. 2013, 6, 196–210. [Google Scholar] [CrossRef]
- Stanton, B.; Eaton, J.; Johnson, J.; Rice, D.; Schuette, B.; Moser, B. Hybrid poplar in the Pacific Northwest: The effects of a market-driven management. J. For. 2002, 100, 28–33. [Google Scholar]
- Johnson, J.M.F.; Coleman, M.D.; Gesch, R.; Jaradat, A.; Mitchell, R.; Reicosky, D.; Wilhelm, W.W. Biomass-bioenergy crops in the United States: A changing paradigm. Am. J. Plant Sci. Biotechnol. 2007, 1, 1–28. [Google Scholar]
- U.S. Department of Energy, U.S. Billion-Ton Update: Biomass Supply for a Bioenergy and Bioproducts Industry; Perlack, R.D.; Stokes, B.J. (Eds.) Oak Ridge National Laboratory: Oak Ridge, TN, USA, 2011; p. 227.
- Langholtz, M.; Graham, R.; Eaton, L.; Perlack, R.; Hellwinkel, C.; de la Torre Ugarte, D. Price projections of feedstocks for biofuels and biopower in the U.S. Energy Pol. 2012, 41, 484–493. [Google Scholar] [CrossRef]
- Berndes, G.; Hoogwijk, M.; van den Broek, R. The contribution of biomass in the future global energy supply: A review of 17 studies. Biomass Bioenergy 2003, 25, 1–28. [Google Scholar] [CrossRef]
- Zhu, J.Y.; Pan, X.; Zalesny, R.S., Jr. Pretreatment of woody biomass for biofuel production: Energy efficiency, technologies, and recalcitrance. Appl. Microbiol. Biotechnol. 2010, 87, 847–857. [Google Scholar] [CrossRef]
- Wang, Z.J.; Zhu, J.Y.; Zalesny, R.S., Jr.; Chen, K.F. Ethanol production potential from poplar wood through enzymatic saccharification and fermentation. Fuel 2012, 95, 606–614. [Google Scholar] [CrossRef]
- Jenkins, B.M.; Baxter, L.L.; Miles, T.R., Jr.; Miles, T.R. Combustion properties of biomass. Fuel Proc. Technol. 1998, 54, 17–46. [Google Scholar] [CrossRef]
- Weber, J.C.; Stettler, R.F.; Heilman, P.E. Genetic variation and productivity of Populus trichocarpa and its hybrids. I. Morphology and phenology of 50 native clones. Can. J. For. Res. 1985, 15, 376–383. [Google Scholar] [CrossRef]
- Rajora, O.P.; Zsuffa, L. Allozyme divergence and evolutionary relationships among Populus deltoides, P. nigra, and P. maximowiczii. Genome 1990, 33, 44–49. [Google Scholar]
- Eckenwalder, J.E. Systematics and Evolution of Populus. In Biology of Populus and Its Implications for Management and Conservation; Stettler, R.F., Bradshaw, H.D., Jr., Heilman, P.E., Hinckley, T.M., Eds.; NRC Research Press, National Research Council of Canada: Ottawa, ON, Canada, 1996; Chapter 1; pp. 7–32. [Google Scholar]
- Kenney, W.A.; Sennerby-Forsse, L.; Layton, P. A review of biomass quality research relevant to the use of poplar and willow for energy conversion. Biomass 1990, 21, 163–188. [Google Scholar] [CrossRef]
- Kenney, W.A.; Gambles, R.L.; Sennerby-Forsse, L. Feedstock Characteristic and Quality. In Ecophysiology of Short Rotation Forest Crops; Mitchell, C.P., Ford-Robertson, J.B., Hinckley, T., Sennerby-Forsse, L., Eds.; Elsevier: London, UK, 1992; Chapter 10; pp. 267–284. [Google Scholar]
- Mátyás, C.; Peszlen, I. Effect of age on selected wood quality traits of poplar clones. Silvae Gen. 1997, 46, 64–72. [Google Scholar]
- Tharakan, P.J.; Volk, T.A.; Abrahamson, L.P.; White, E.H. Energy feedstock characteristics of willow and hybrid poplar clones at harvest age. Biomass Bioenergy 2003, 25, 571–580. [Google Scholar] [CrossRef]
- Pliura, A.; Yu, Q.Y.; Zhang, S.Y.; MacKay, J.; Périnet, P.; Bousquet, J. Variation in wood density and shrinkage and their relationship to growth of selected young poplar hybrid crosses. For. Sci. 2005, 51, 472–482. [Google Scholar]
- Pliura, A.; Zhang, S.Y.; MacKay, J.; Bousquet, J. Genotypic variation in wood density and growth traits of poplar hybrids at four clonal trials. For. Ecol. Manag. 2007, 238, 92–106. [Google Scholar] [CrossRef]
- Olson, J.R.; Jourdain, C.J.; Rousseau, R.J. Selection for cellulose content, specific gravity, and volume in young Populus deltoides clones. Can. J. For. Res. 1985, 15, 393–396. [Google Scholar] [CrossRef]
- Kord, B.; Kialashaki, A.; Kord, B. The within-tree variation in wood density and shrinkage, and their relationship in Populus euramericana. Turk. J. Agric. For. 2010, 34, 121–126. [Google Scholar]
- Riemenschneider, D.E.; Berguson, W.E.; Dickmann, D.I.; Hall, R.B.; Isebrands, J.G.; Mohn, C.A.; Stanosz, G.R.; Tuskan, G.A. Poplar breeding and testing strategies in the north-central US: Demonstration of potential yield and consideration of future research needs. For. Chron. 2001, 77, 245–253. [Google Scholar]
- Beaudoin, M.; Hernández, R.E.; Koubaa, A.; Poliquin, J. Interclonal, intraclonal and within-tree variation in wood density of poplar hybrid clones. Wood Fiber Sci. 1992, 24, 147–153. [Google Scholar]
- Geyer, W.A.; DeWyke, J.; Walawender, W.P. Biomass and gasification properties of young Populus clones. Wood Fiber Sci. 2000, 32, 375–384. [Google Scholar]
- DeBell, D.S.; Singleton, R.; Harrington, C.A.; Gartner, B.L. Wood density and fiber length in young Populus stems: Relation to clone, age, growth rate, and pruning. Wood Fiber Sci. 2002, 34, 529–539. [Google Scholar]
- Ivkovich, M. Genetic variation of wood properties in balsam poplar (Populus balsamifera L.). Silvae Gen. 1996, 45, 119–124. [Google Scholar]
- Hernández, R.E.; Koubaa, A.; Beaudoin, M.; Fortin, Y. Selected mechanical properties of fast-growing poplar hybrid clones. Wood Fiber Sci. 1998, 30, 138–147. [Google Scholar]
- Zhang, S.Y.; Yu, Q.; Chauret, G.; Koubaa, A. Selection for both growth and wood properties in hybrid poplar clones. For. Sci. 2003, 49, 1–8. [Google Scholar]
- Semen, E.; Kuo, M.; Su, Y.C.; Hall, R.B.; Stokke, D.D. Physical properties of kraft pulp from four-year-old aspen hybrids and crosses. Wood Fiber Sci. 2001, 33, 140–147. [Google Scholar]
- Blankenhorn, P.R.; Bowersox, T.W.; Strauss, C.H.; Kessler, K.R.; Stover, L.R.; Kilmer, W.R.; DiCola, M.L. Effects of management strategy and site on specific gravity of a Populus hybrid clone. Wood Fiber Sci. 1992, 24, 274–279. [Google Scholar]
- Murphey, W.K.; Bowersox, T.W.; Blankenhorn, P.R. Selected wood properties of young Populus hybrids. Wood Sci. 1979, 11, 263–267. [Google Scholar]
- Zalesny, R.S., Jr.; Hall, R.B.; Zalesny, J.A.; Berguson, W.E.; McMahon, B.G.; Stanosz, G.R. Biomass and genotype × environment interactions of Populus energy crops in the Midwestern United States. Bioenergy Res. 2009, 2, 106–122. [Google Scholar] [CrossRef]
- Hansen, E. Mid-Rotation Yields of Biomass Plantations in the North Central U.S.; Res. Pap. NC-309; U.S. Department of Agriculture, Forest Service, North Central Forest Experiment Station: St. Paul, MN, USA, 1992; p. 8. [Google Scholar]
- Hansen, E.A.; Ostry, M.E.; Johnson, W.D.; Tolsted, D.N.; Netzer, D.A.; Berguson, W.E.; Hall, R.B. Field Performance of Populus in Short-Rotation Intensive Culture Plantations in the North-Central U.S.; Res. Paper NC-320; U.S. Department of Agriculture, Forest Service, North Central Forest Experiment Station: St. Paul, MN, USA, 1994; p. 13. [Google Scholar]
- Netzer, D.A.; Tolsted, D.; Ostry, M.E.; Isebrands, J.G.; Riemenschneider, D.E.; Ward, K.T. Growth, Yield, and Disease Resistance of 7- to 12-Year-Old Poplar Clones in the North Central United States; General Technical Report NC-229; U.S. Department of Agriculture, Forest Service, North Central Research Station: St. Paul, MN, USA, 2002; p. 31. [Google Scholar]
- Web Soil Survey. Available online: http://websoilsurvey.nrcs.usda.gov (accessed on 21 February 2013).
- National Climatic Data Center (NCDC) monthly summaries. Available online: http://www.ncdc.noaa.gov/oa/ncdc.html (accessed on 21 February 2013).
- SAS Institute Inc, SAS/STAT® 9.3 User’s Guide; SAS Institute Inc: Cary, NC, USA, 2011.
- Farmer, R.E. Variation and inheritance of eastern cottonwood growth and properties under two soil moisture regimes. Silvae Genet. 1970, 19, 5–8. [Google Scholar]
- Pitre, F.E.; Pollet, B.; Lafarguette, F.; Cooke, J.E.K.; MacKay, J.J.; Lapierre, C. Effects of increased nitrogen supply on the lignification of poplar wood. J. Agric. Food Chem. 2007, 55, 10306–10314. [Google Scholar] [CrossRef]
- Hacke, U.G.; Plavcová, L.; Almeida-Rodriguez, A.; King-Jones, S.; Zhou, W.; Cooke, J.E.K. Influence of nitrogen fertilization on xylem traits and aquaporin expression in stems of hybrid poplar. Tree Physiol. 2010, 30, 1016–1025. [Google Scholar] [CrossRef]
© 2013 by the authors; licensee MDPI, Basel, Switzerland. This article is an open access article distributed under the terms and conditions of the Creative Commons Attribution license (http://creativecommons.org/licenses/by/3.0/).
Share and Cite
Headlee, W.L.; Jr., R.S.Z.; Hall, R.B.; Bauer, E.O.; Bender, B.; Birr, B.A.; Miller, R.O.; Randall, J.A.; Wiese, A.H. Specific Gravity of Hybrid Poplars in the North-Central Region, USA: Within-Tree Variability and Site × Genotype Effects. Forests 2013, 4, 251-269. https://doi.org/10.3390/f4020251
Headlee WL, Jr. RSZ, Hall RB, Bauer EO, Bender B, Birr BA, Miller RO, Randall JA, Wiese AH. Specific Gravity of Hybrid Poplars in the North-Central Region, USA: Within-Tree Variability and Site × Genotype Effects. Forests. 2013; 4(2):251-269. https://doi.org/10.3390/f4020251
Chicago/Turabian StyleHeadlee, William L., Ronald S. Zalesny Jr., Richard B. Hall, Edmund O. Bauer, Bradford Bender, Bruce A. Birr, Raymond O. Miller, Jesse A. Randall, and Adam H. Wiese. 2013. "Specific Gravity of Hybrid Poplars in the North-Central Region, USA: Within-Tree Variability and Site × Genotype Effects" Forests 4, no. 2: 251-269. https://doi.org/10.3390/f4020251
APA StyleHeadlee, W. L., Jr., R. S. Z., Hall, R. B., Bauer, E. O., Bender, B., Birr, B. A., Miller, R. O., Randall, J. A., & Wiese, A. H. (2013). Specific Gravity of Hybrid Poplars in the North-Central Region, USA: Within-Tree Variability and Site × Genotype Effects. Forests, 4(2), 251-269. https://doi.org/10.3390/f4020251