2.2. Design of the Field Experiment and Measurements
This study focused on young stands on abandoned agricultural lands that had not been used for agriculture for at least six years. The Slovenia Forest Service database [
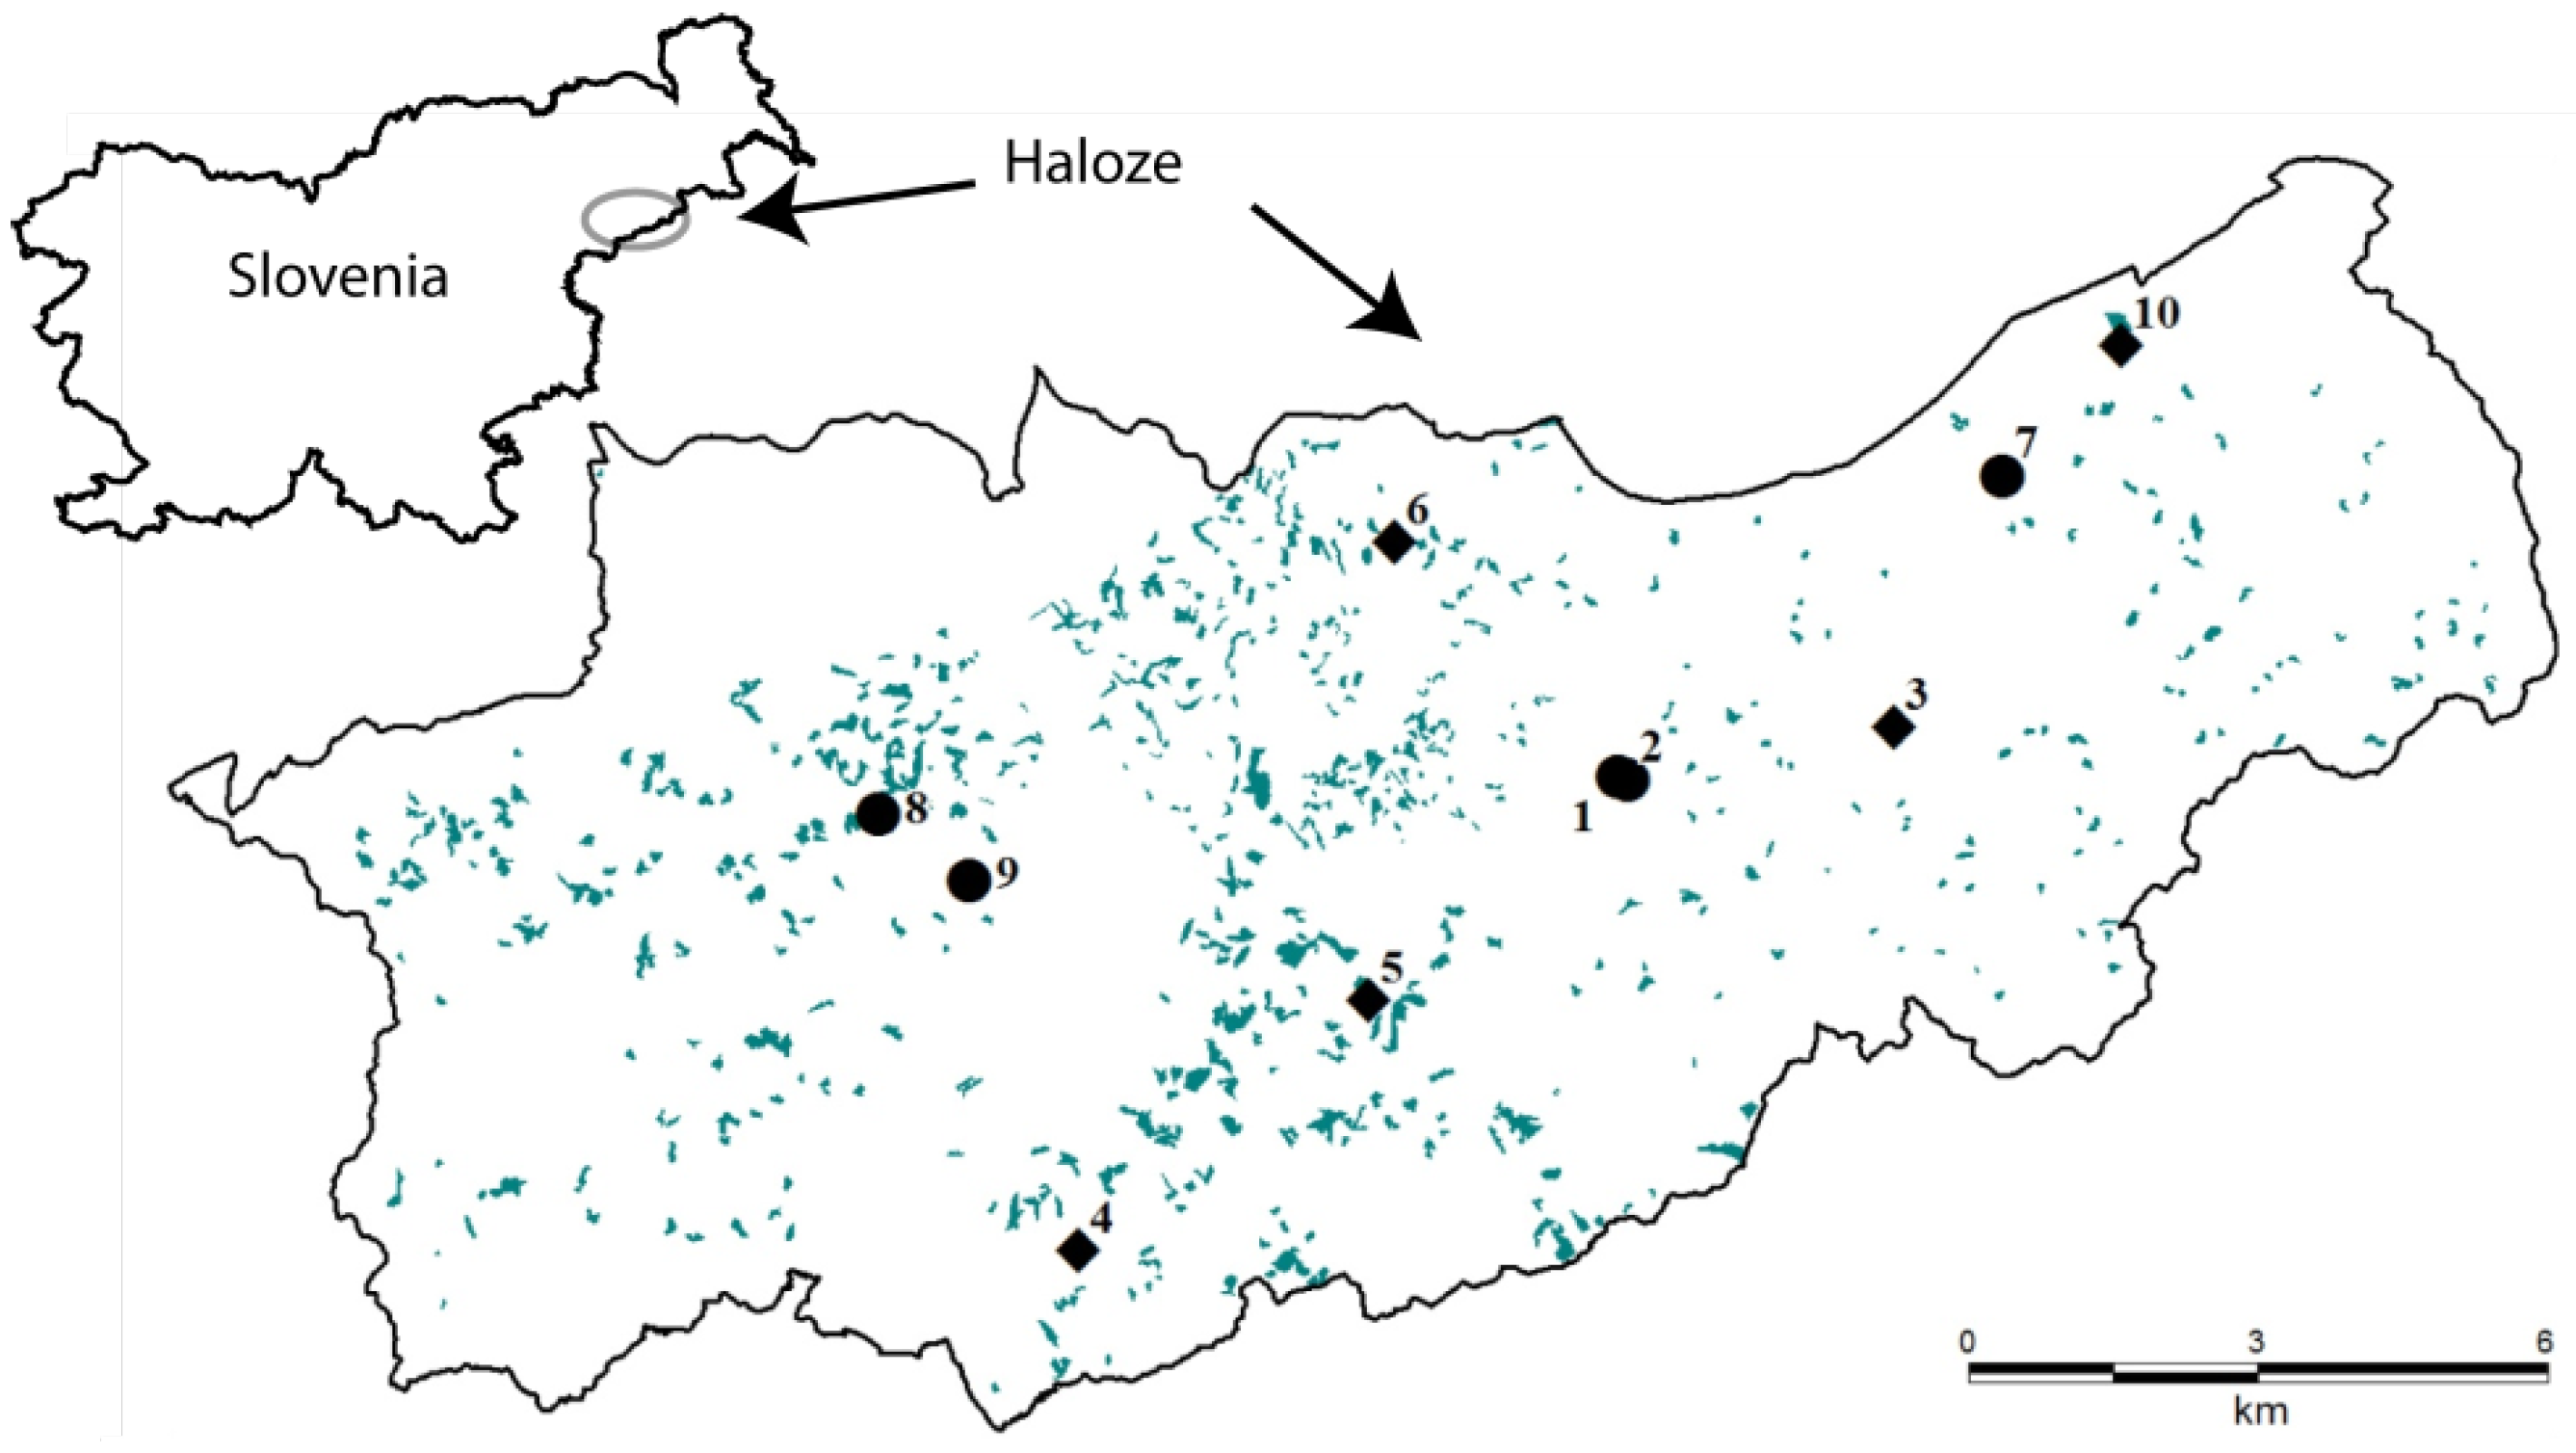
28] was used as the basis for the collection of data on spontaneous forest expansion on abandoned agricultural lands. Plot locations were chosen on the basis of digital orthophotos (DOF) (scale 1:5.000) taken within the period of cyclical aerial photography between 1995 and 2005. Each plot’s size was 20 m × 20 m. Due to long-lasting successional development on abandoned agricultural lands, a chronosequence method was applied to represent different developmental phases. Five stands were selected in young growth (h < 2 m), 15 stands in thicket, and 17 stands in pole stand (hereinafter: Succession). The number of plots was proportional to the cumulative area of developmental phases. All plots were located in the immediate vicinity of late-successional (LS) forest. Most of the plots were located within former meadows and pastures and a few within orchards. Agriculture was practiced at low intensity and parcels were small.
In order to analyze differences between the young stands in Succession and within LS forest, we further selected 15 plots in the regeneration gaps in nearby forests on comparable sites (hereinafter: Forest): five plots (20 m × 10 m) in young growth, five plots in thicket, and five plots in pole stand. The regeneration gaps were created by traditional small-scale management with irregular shelterwood (gaps of up to 0.1 ha); only natural regeneration that had not been managed was present. Forest plots were surrounded by (semi-) natural LS forest stands dominated by Fagus sylvatica L. and Quercus petraea (Matt.) Liebl., which were being managed for multiple objectives.
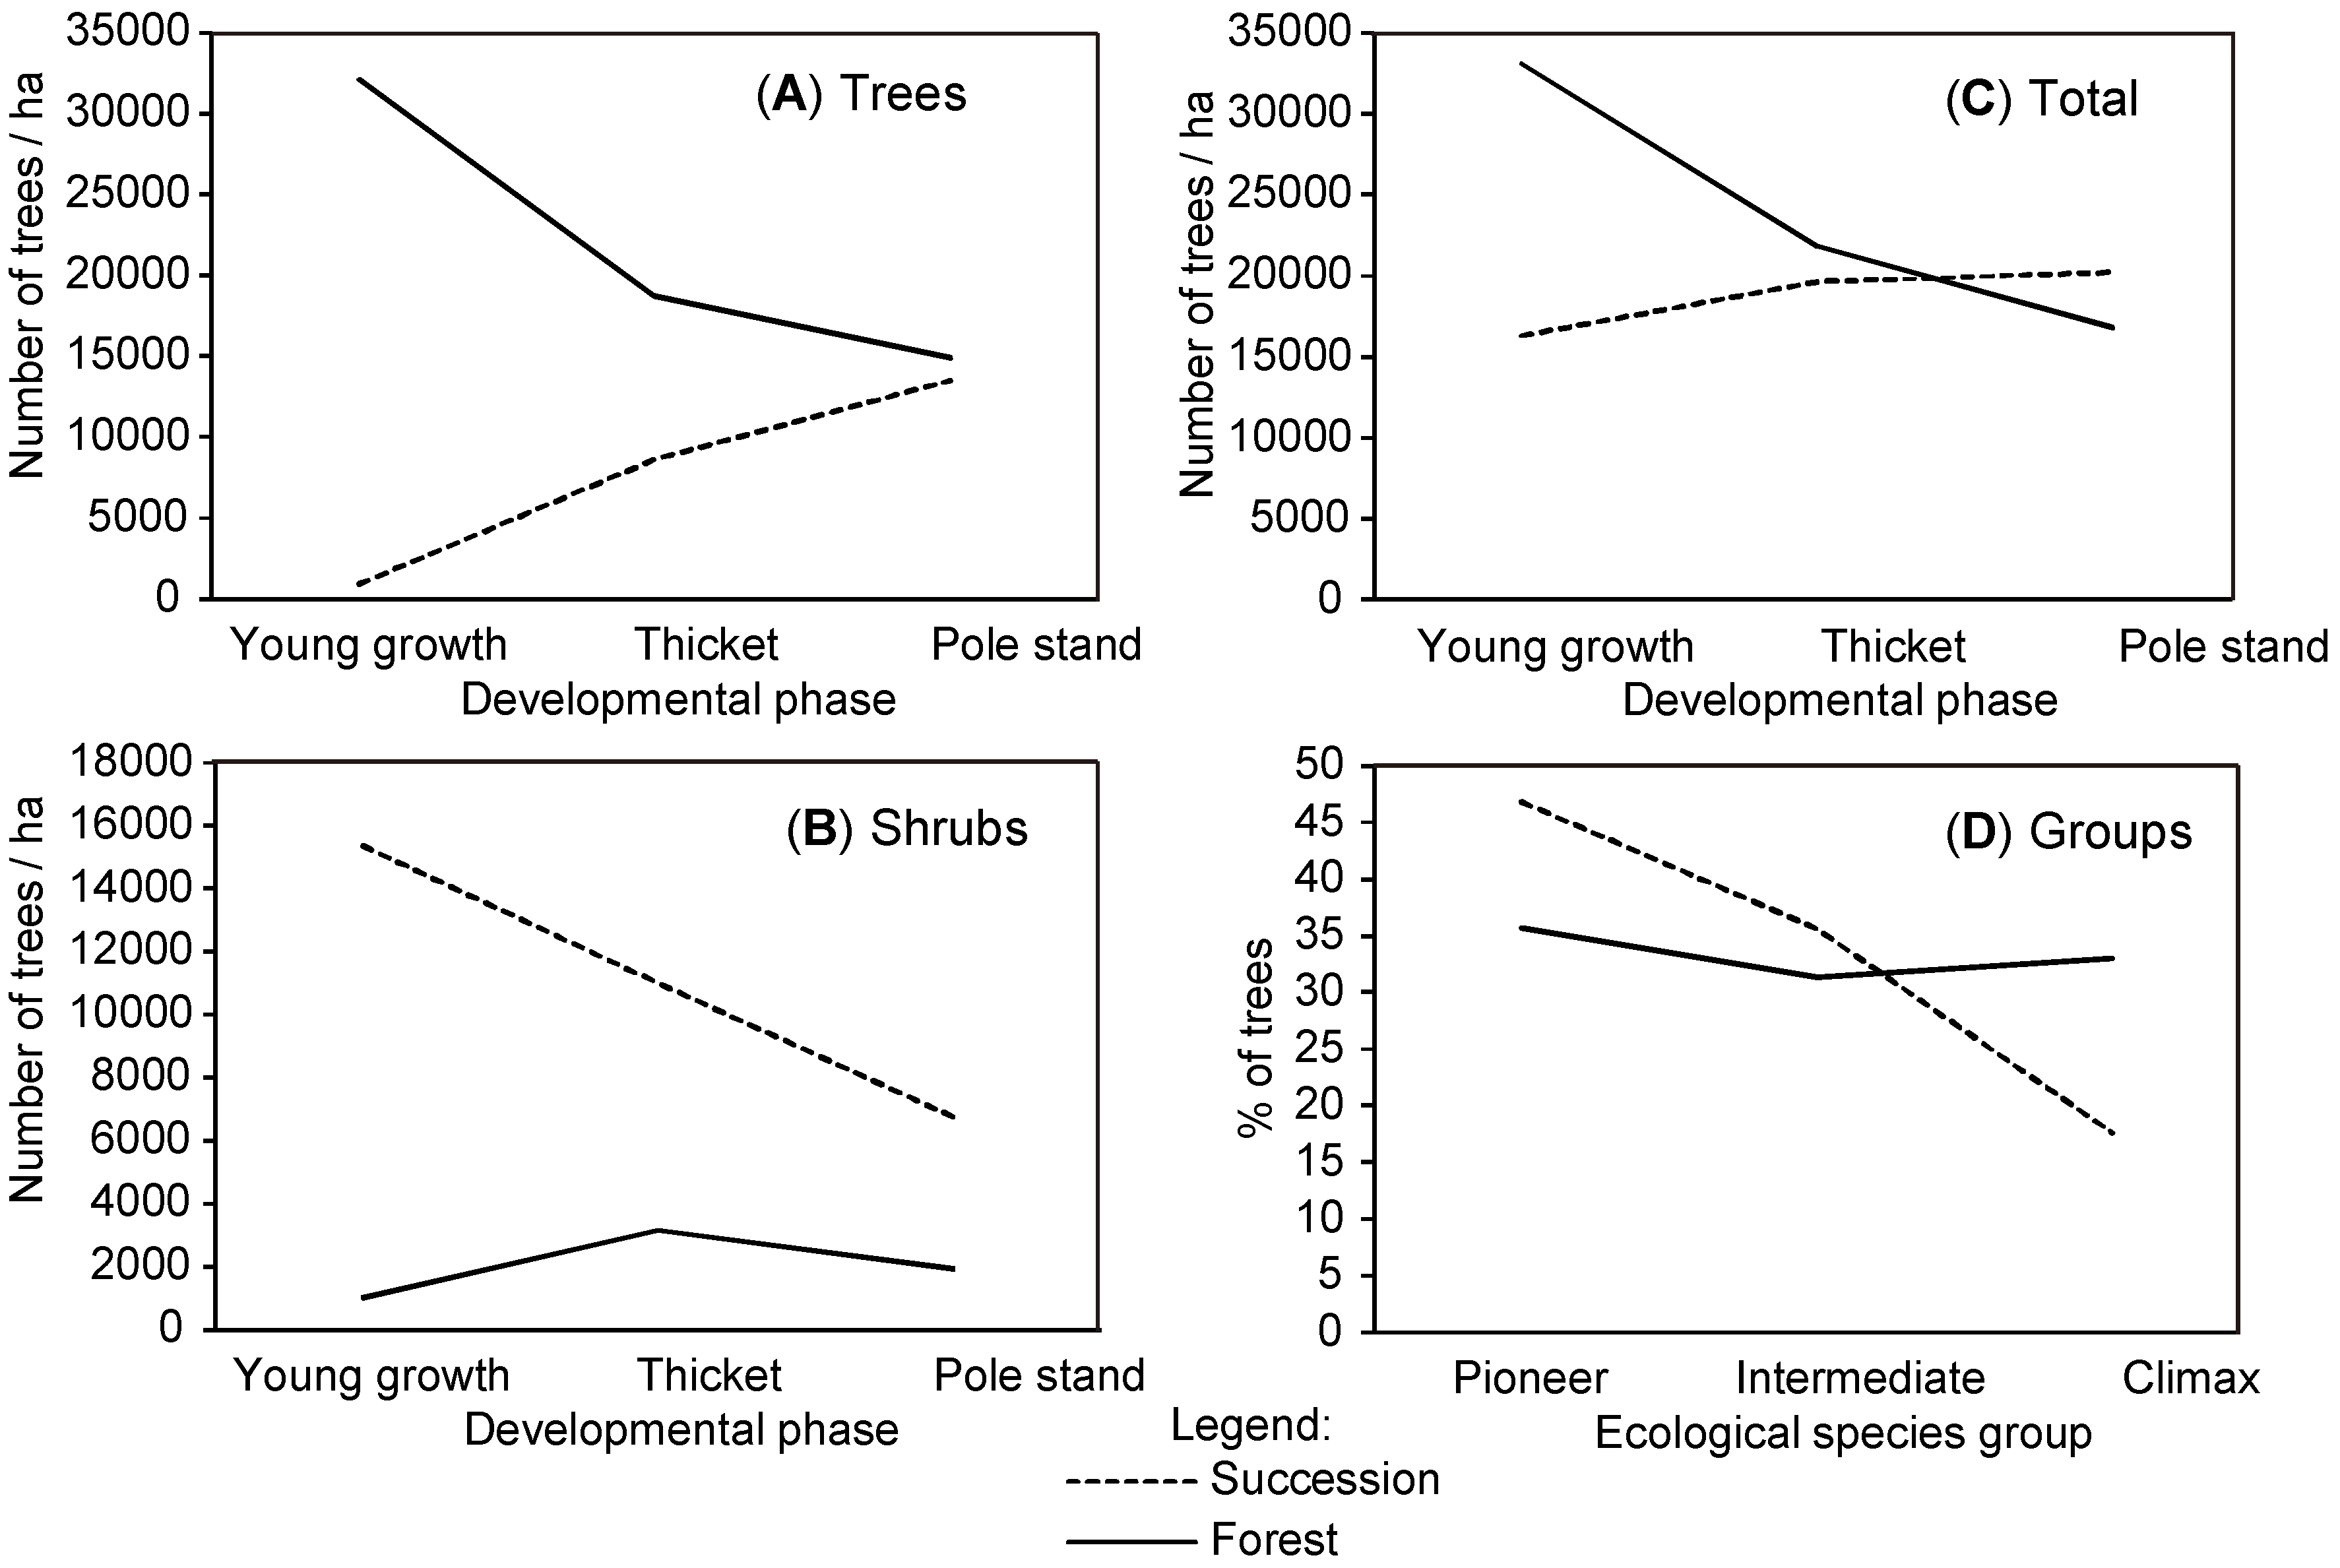
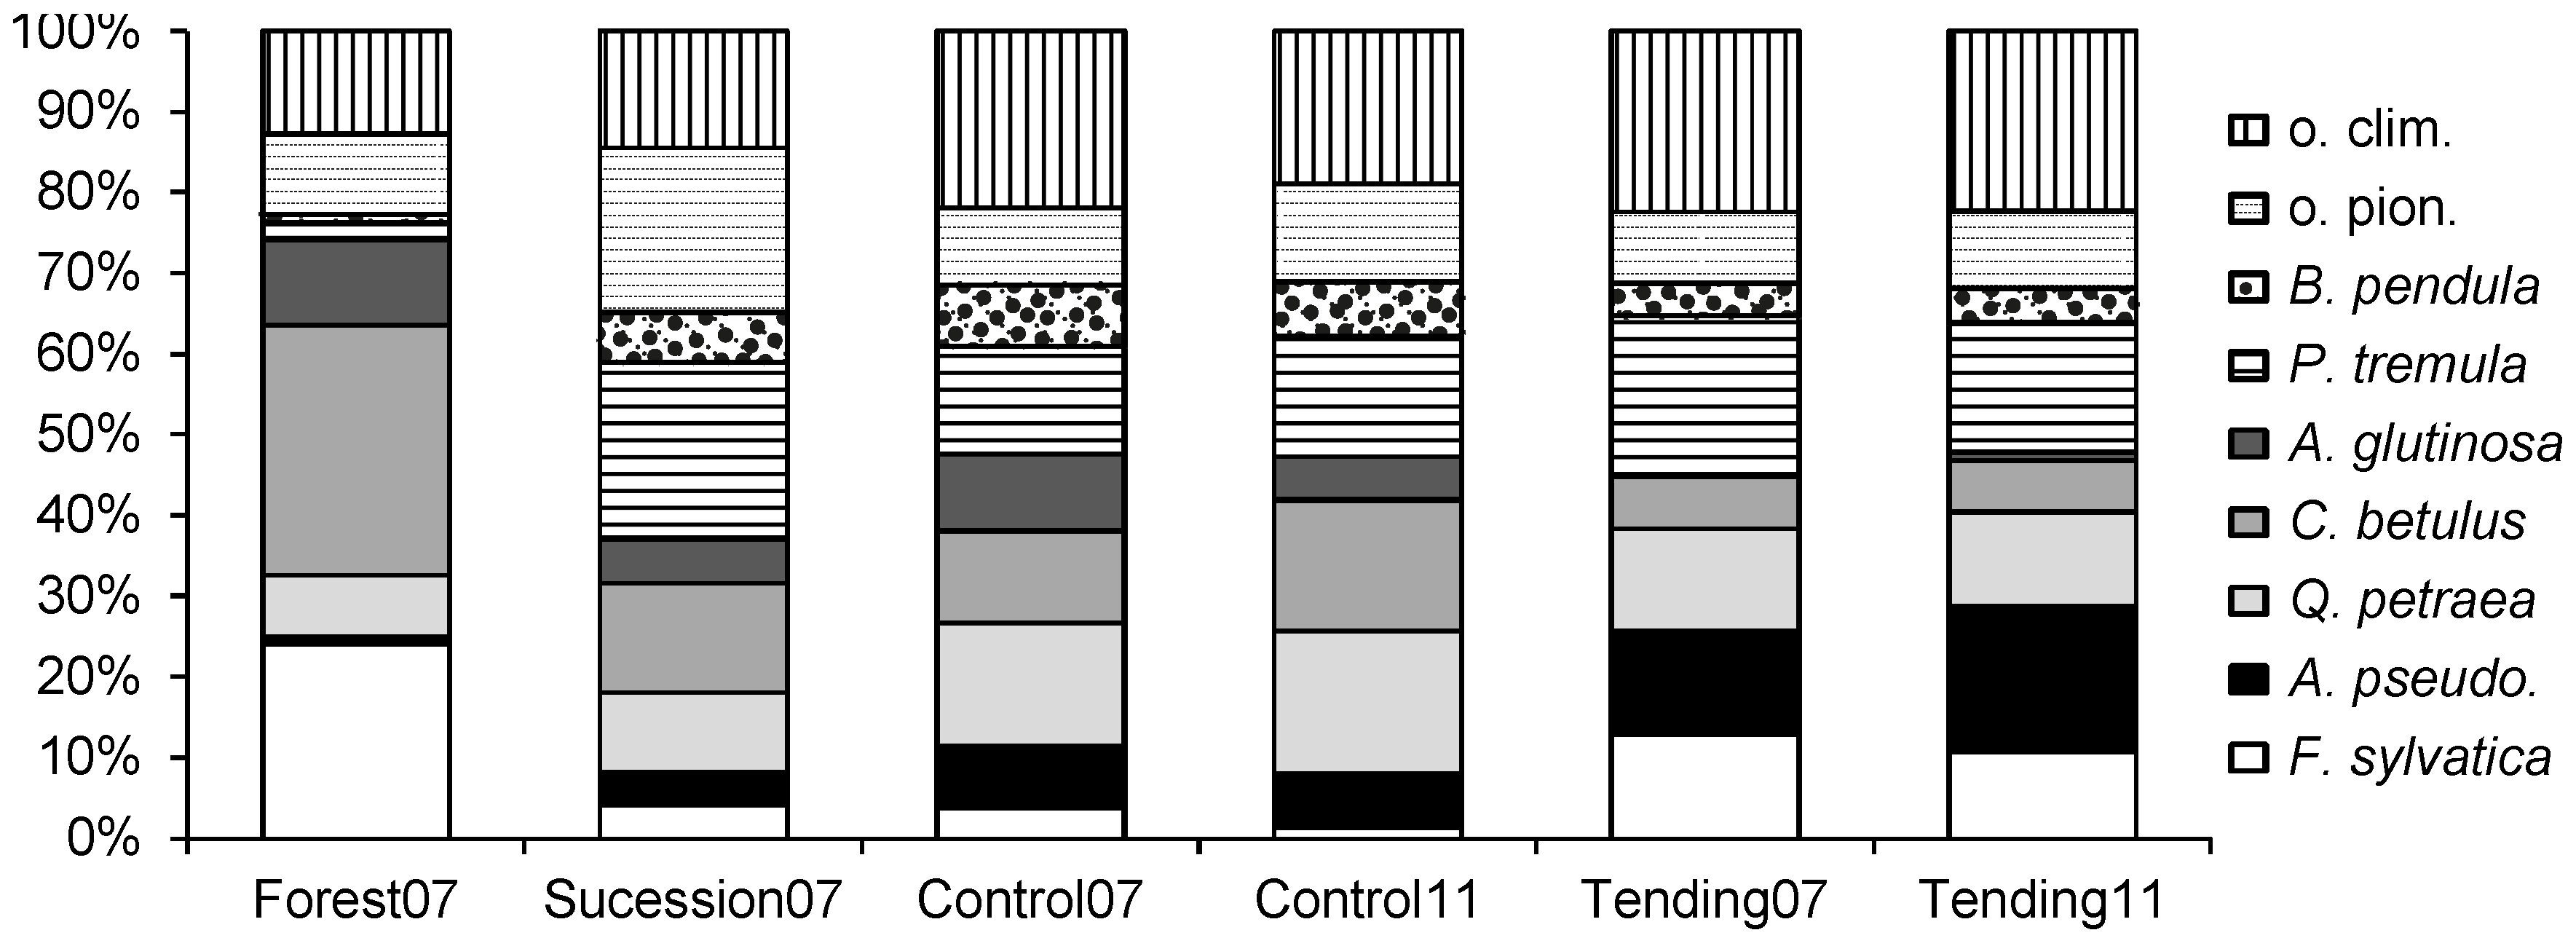
Within Forest and Succession, all woody plants were tallied according to species. The trees were grouped into three ecological species groups (
sensu [
29]): (1) early (pioneers); (2) intermediate; and (3) late successional species (climax species). The following were treated as pioneer species:
Acer campestre L.,
Fraxinus ornus L.,
Populus tremula L.,
Populus alba L.,
Alnus glutinosa (L.) Gaertn.,
Betula pendula Roth, and
Salix caprea L. The following were classified as climax species:
Picea abies (L.) H.Karst.,
Abies alba Mill.,
Pinus sylvestris L.,
Castanea sativa Mill.,
F. sylvatica and
Q. petraea (
Table A2).
P. sylvestris was classified as a climax species since in the studied area it mainly grows on acid soils in dry ridge habitats where it is a stand-forming species. In other habitats, only individual trees of
P. sylvestris are present. Seventeen other species were treated as intermediate successional species, including the following:
Sorbus torminalis (L.) Crantz,
Tilia cordata Mill.,
Ulmus minor Mill., and
Fraxinus excelsior L.
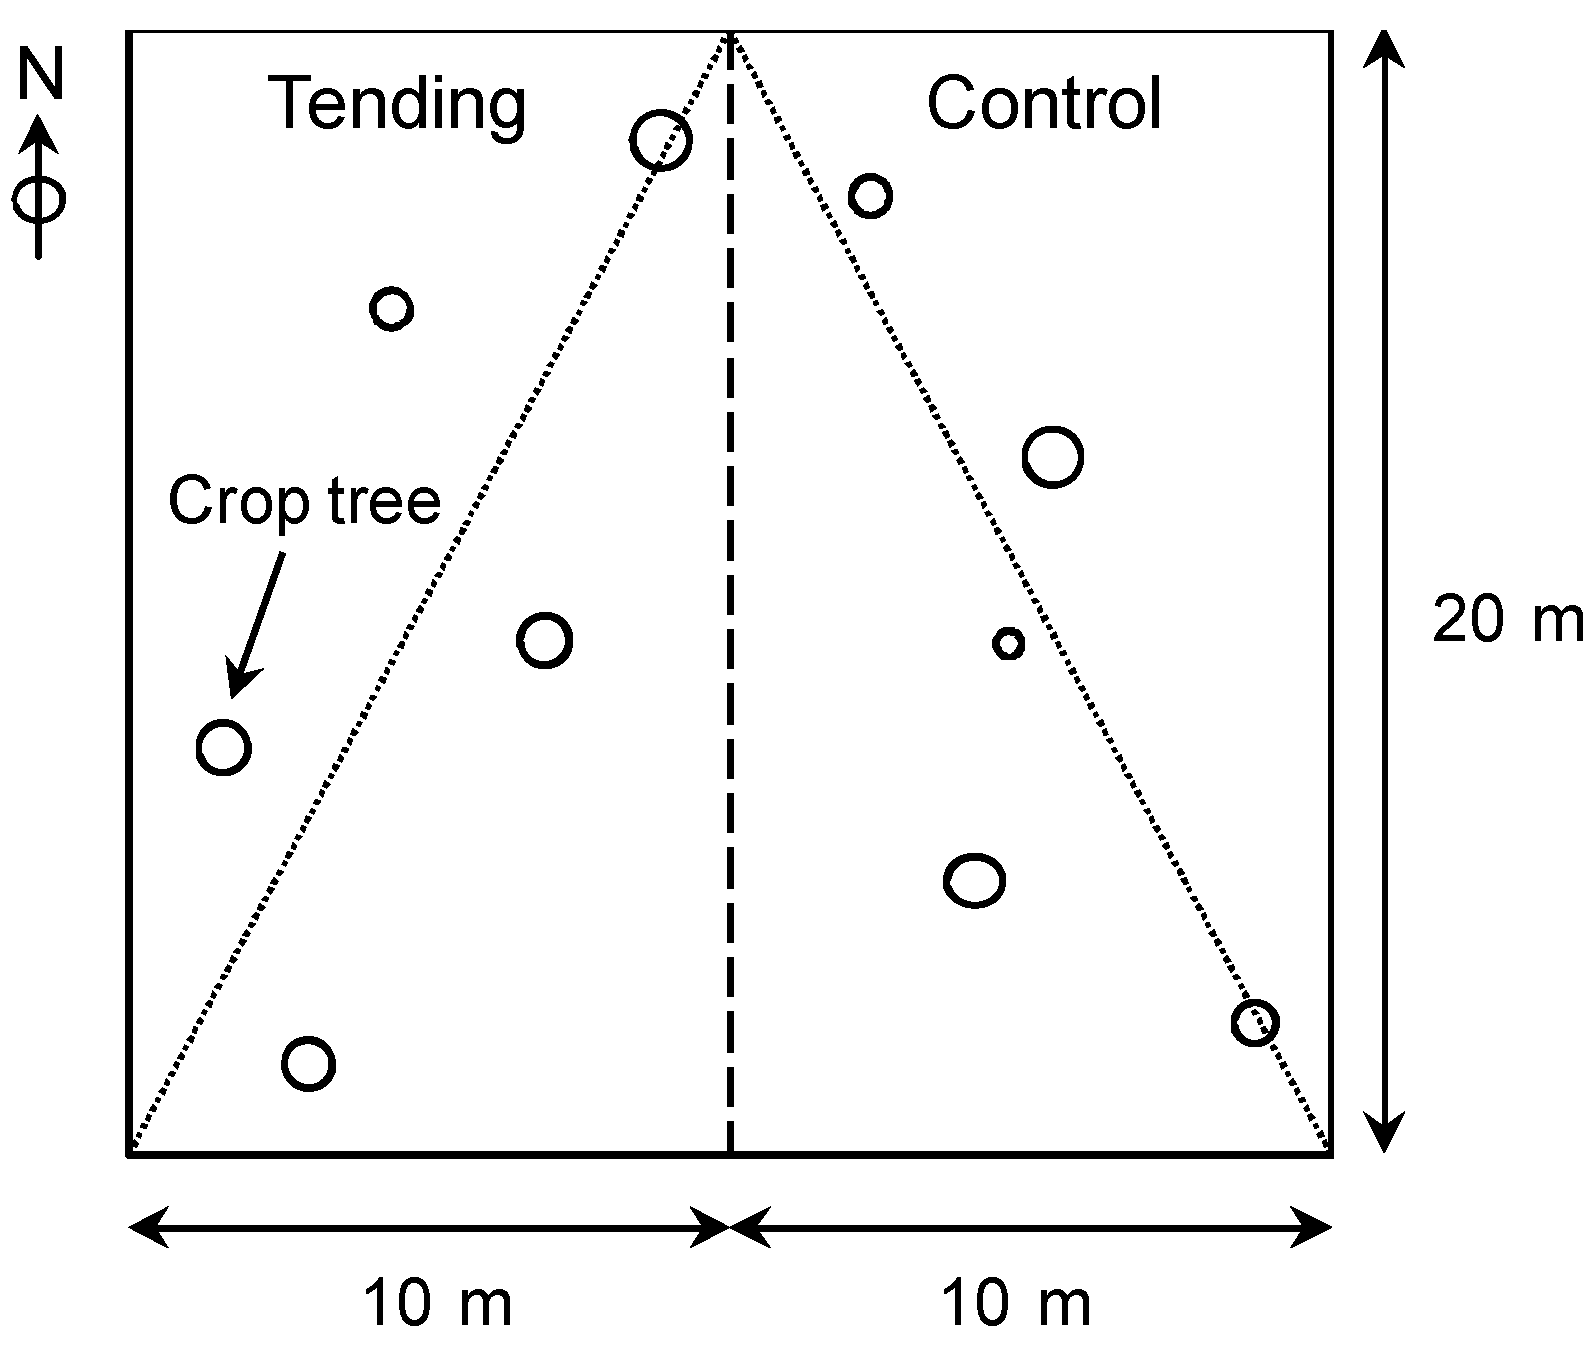
In order to analyze tending effects on stands in succession, five plots in the thicket stage and five plots in the pole stand stage were selected. Each plot was divided into two equal parts measuring 20 m × 10 m. On the left subplot (observed on location from the bottom), tending was carried out (hereinafter: Tending), while the right subplot was left untreated (hereinafter: Control,
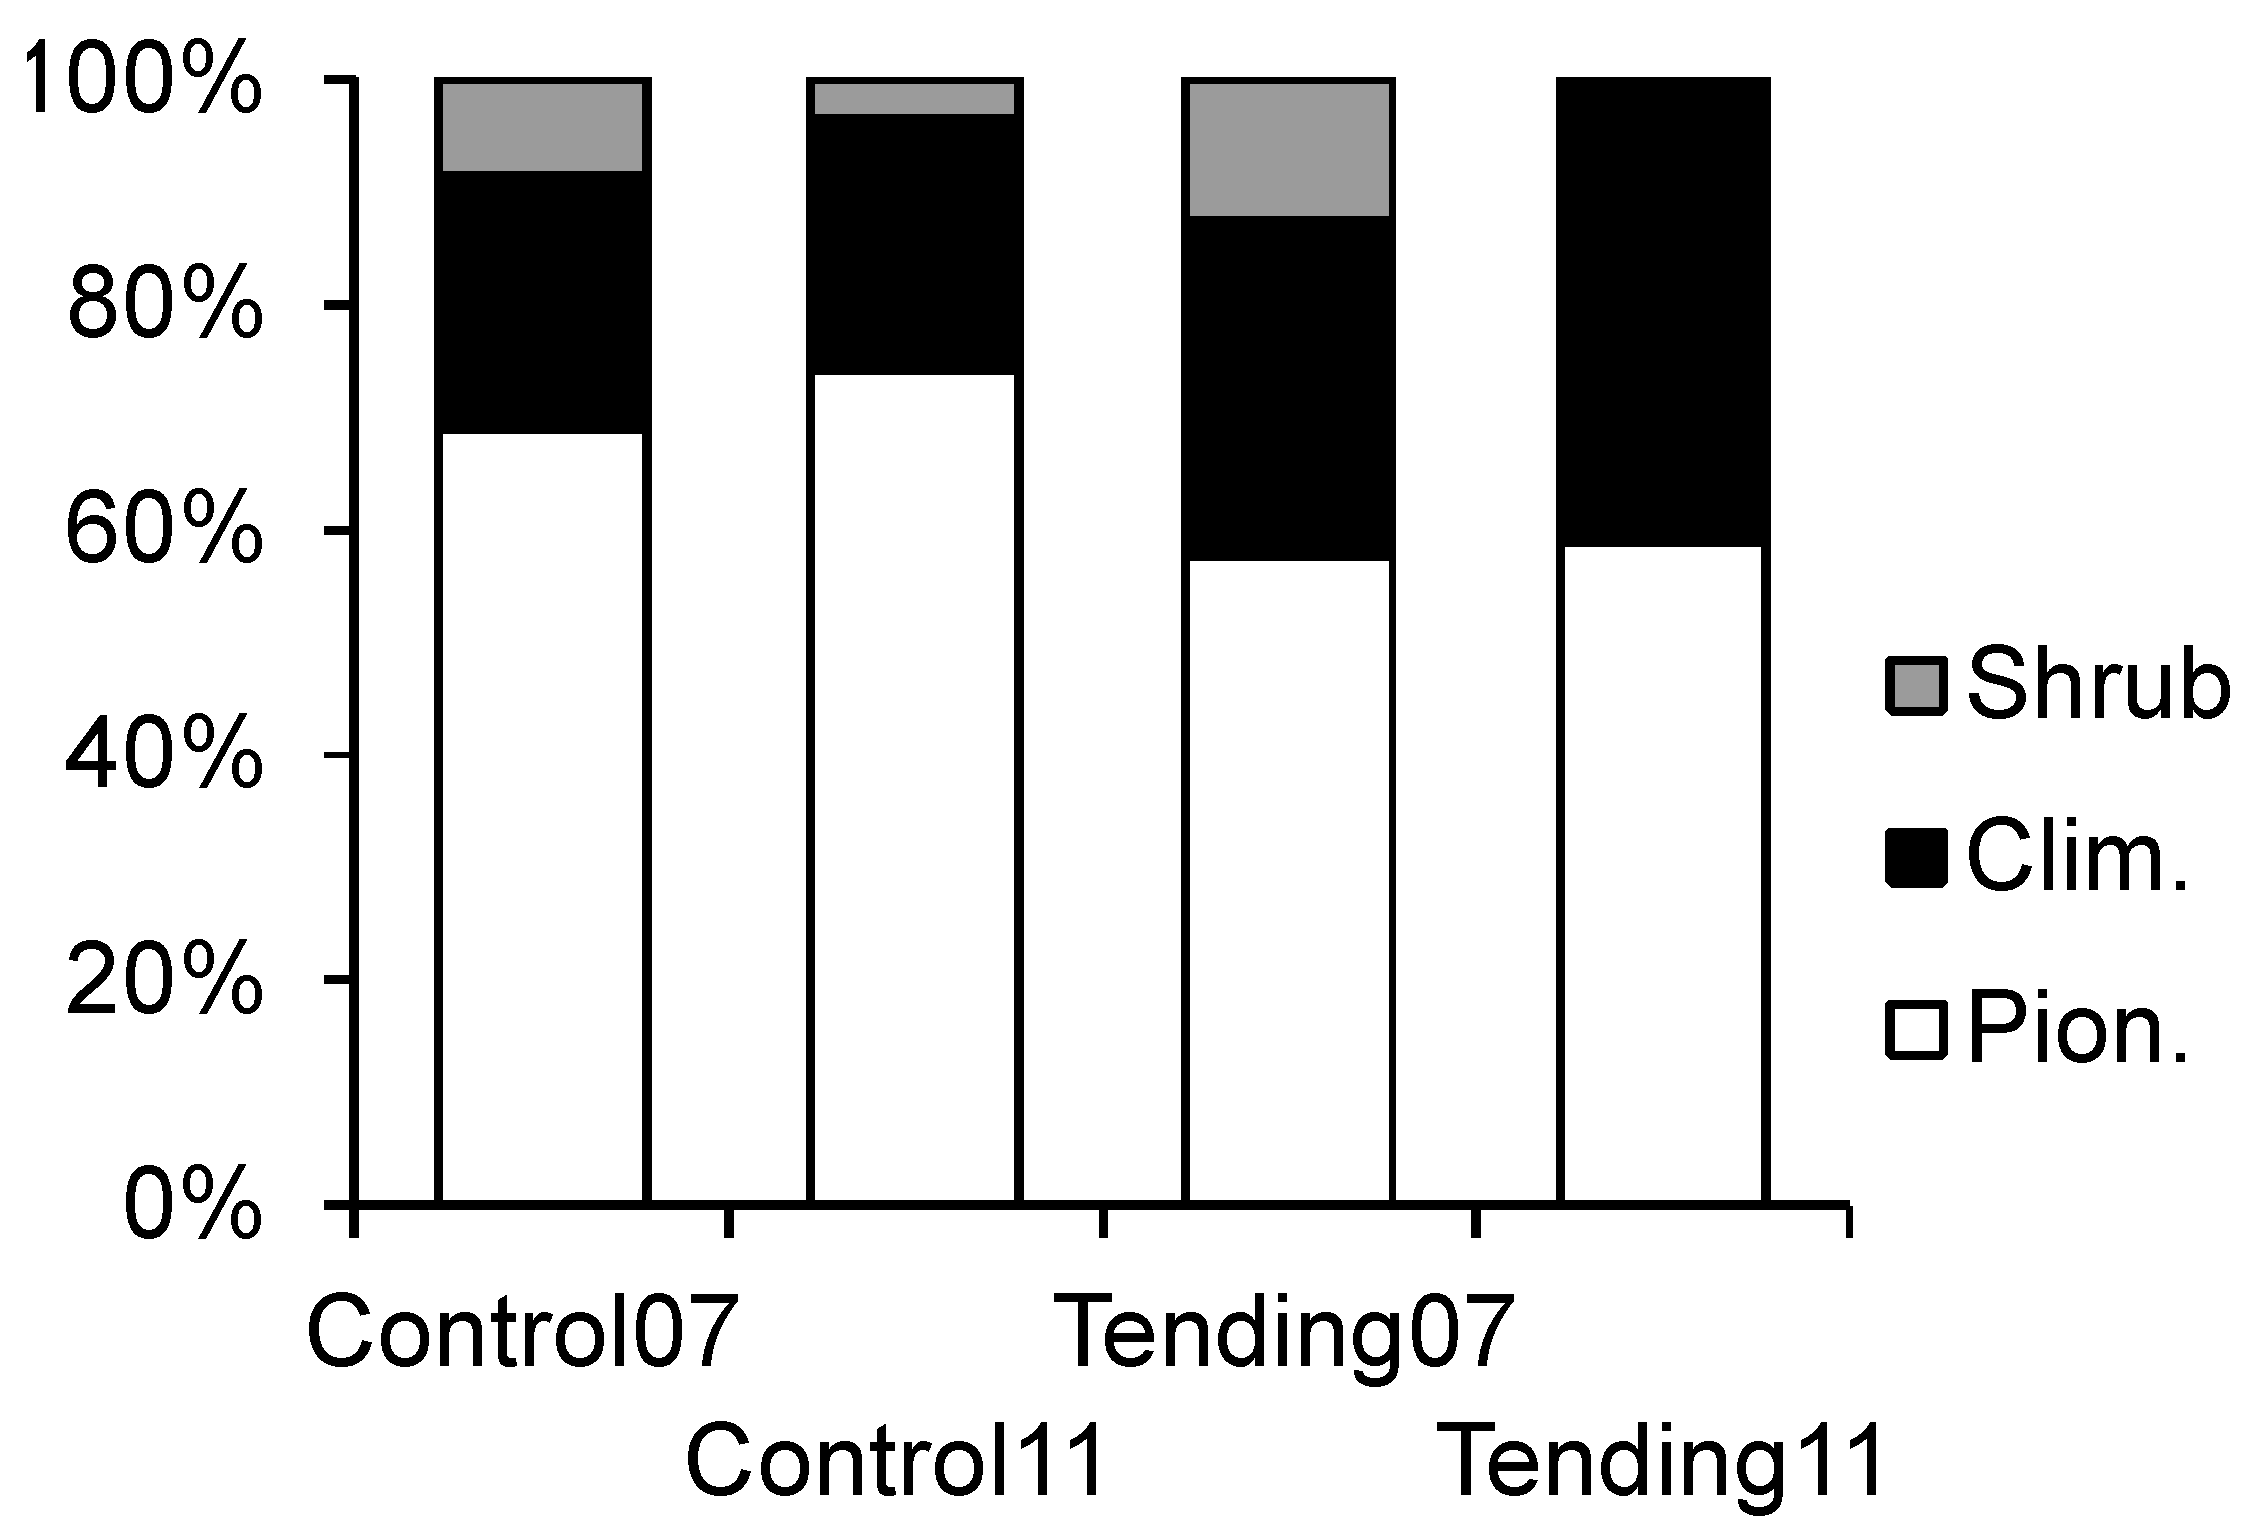
Figure 2). Division of plots resulted in 10 Tending subplots and 10 Control subplots at the beginning of the experiment. All plots were selected using a stratified random approach to cover the entire research area. For the analysis of tending effects, we merged intermediate and late successional species into one extended group of climax species since crop trees were predominately selected from these two groups.
Figure 2.
The division of original plots into two subplots for the tending experiment and the selection of crop trees for measuring heights.
Figure 2.
The division of original plots into two subplots for the tending experiment and the selection of crop trees for measuring heights.
The tending experiment was conducted in three parts and lasted five growing seasons. The first part comprised a survey of the stand parameters and the implementation of tending. Both were carried out in winter 2007 (January and February). The second and third parts comprised two surveys of stand parameters and were carried out after the end of the growing season in autumn 2009 and autumn 2011.
In the first part of the experiment (2007), the following parameters were estimated: the frequency and species composition of all woody plants; diameter at breast height (d.b.h.) of all trees with d.b.h. >2 cm; the number and d.b.h. of crop trees and their competitor trees (hereinafter: competitors); the quality of crop trees; the social position of crop trees; the age of the oldest competitor on the plot; the time needed for marking the crop trees and their competitors; and the time needed to completely carry out silvicultural measures.
On each subplot crop trees were selected and marked with numbers. The selection was based on the following characteristics: the adequacy of tree and shrub species (climax and intermediate successional species as well as fruit bearing trees were favored); the quality of individuals, i.e., the quality of the trunk and the quality of the crown; and the progressive developmental trend regarding neighboring trees (tendency).
The future commercial quality of trees (high, intermediate, and low—according to tree architecture and damage) and their social position (dominant, intermediate, and suppressed—depending on the height class membership) were evaluated according to the IUFRO classification [
30,
31]. Tending of thickets in Central Europe may be based on positive or negative selection depending on stand structure, although positive selection prevails from the pole stage onwards [
30]. In this study, the emphasis was on early positive selection, as the crop trees and their competitors were already selected in the thicket stage. The reasons for early selection were the following: (1) in Succession social stratification was already strongly expressed due to lower tree density; (2) valuable tree species were favored and they were often suppressed and diffusely represented; (3) most crop trees were light-demanding; and (4) only the most necessary tasks were carried out, in accordance with biological rationalization and concentration principles [
21].
On each subplot separately, we determined the tending measures following the short-term silvicultural goals [
30] based on the current stand status and considering the species composition, site conditions, and developmental phase of the stand. Similar measures were applied in the tending of thicket and pole stands, as the stand structure was small-scale and patchy with unclear transitions between developmental phases. The main focus was on the release of crop trees (positive selection). In thicket, there was slightly more emphasis on favoring groups of trees and negative selection (e.g., the removal of climbers, shrubs, wolf trees, as well as diseased and damaged specimens, regulating stand density). Occasionally, we also carried out the additional measure of pruning (all silvicultural measures
sensu [
30]).
In order to study the costs of tending, the time needed to mark crop trees and their competitors by a local forest ranger was measured. The time needed to carry out each tending measure was also measured. In the latter case, measuring began when a chainsaw (hereinafter: CS; model Husqvarna 154) was already running. The sum of the measured times amounted to the effective or net time. The time needed for transitions from one competitor to another was also measured (the transition time). The time for tending is the sum of the effective time and transition time. This time equals the time needed by a silvicultural worker with a CS. Time was expressed in h:mm:ss. The labor cost of a silvicultural worker with a CS and the labor cost of a local forest ranger, expressed in ha−1, are the product of the time consumed and the cost of a working hour. The sum of both costs is the cost of tending.
The costs of tending were calculated on the basis of costs for the year 2013. In determining the costs of tending for thicket and pole stands, the cost of a working hour of a silvicultural worker with a CS was applied on the basis of the Regulations for State Forests [
32] and the cost of a working hour of a local forest ranger employed by the Slovenia Forest Service (
i.e., a local forest ranger III; the cost of a working hour in March 2013). The following figures were taken as bases: the cost of a working hour of a silvicultural worker with a CS was EUR 17.78; the cost of a working hour of a local forest ranger was EUR 7.02.
The second part of the experiment was conducted in 2009 when crop trees were selected and analyzed again. Due to stand damage, four subplots (two in Control and two in Tending) were lost. Therefore, the initial comparison with LS forests and the tending cost study are based on 10 Tending and 10 Control subplots, while comparisons in 2009 and 2011 are based on eight Control and eight Tending subplots. The d.b.h. of all crop trees was measured, their quality was determined, they were classified by appropriate social layer, and once again their competitors were selected. In certain cases the role of a crop tree was taken over by a competitor and occasionally by a new individual.
In 2011 the crop trees were re-analyzed following the same procedure as in 2009. We also added the following parameters (as described below): branchiness, height, slenderness coefficient, and stem inclination. We then selected a network of superior crop trees. Tree heights were estimated based on a sample of the five crop trees closest to the plot diagonal (
Figure 2).
The slenderness coefficient SC was calculated using the formula:
A stem inclination score of 1–3 (vertical growth—strongly inclined tree) was assigned to each crop tree based on stem inclination from vertical. In Tending and Control, crop trees at half of the final spacing were identified (superior crop trees). In order to evaluate tending effects, measured variables (the number of crop trees, the number of their competitors, d.b.h., quality, and height) were compared among years (2007, 2009, and 2011) and treatments (Tending v. Control). As the differences in stand structure in Succession between thicket and pole stand almost entirely converged in the five growing seasons, a comparison of the parameter values for both phases combined is presented.
The Central European tending approach allows the adaptation of the crop tree network at each stand entrance [
30]. Therefore, evaluation of the thinning effect was done separately for the entire population of crop trees (all crop trees) and separately for the crop trees that remained the same throughout the experiment (identical crop trees).


