1. Introduction
Carbon emissions from tropical forests represent between 6 and 17% of global carbon emissions [
1]. The Reduction of Emissions from Deforestation and forest Degradation, including conservation, sustainable management of forests and enhancement of forest carbon stocks (REDD+) is a mechanism for mitigating climate change with opportunities for payments associated with emissions reductions and maintenance of forest carbon stocks [
2]. The need to measure emissions reductions with accuracy is therefore vital to REDD+ implementation and success [
3]. However, measurements are still hampered by the complexity of national and subnational situations (e.g., lack of capacity and organizations to conduct measurements at local levels, risk of corruption regarding the distribution of incentives, lack of clarity about the international standards to be applied) [
4].
Building knowledge for an efficient and equitable Measurement, Reporting, and Verification (MRV) system for carbon and non-carbon data, across different levels of governance, is crucial for accurate and trustworthy information on which to base decisions for climate change mitigation [
5]. ‘Measurement’ in MRV refers to the monitoring and quantification of carbon stocks and their change over time. ‘Reporting’ is the information provided by governments on emission levels, and government policies and measures. ‘Verification’ refers to the “process of independently checking the accuracy and reliability of reported information or the procedures used to generate information” [
6].
The United Nations Framework Convention on Climate Change (UNFCCC) recognizes the need for local community participation in carbon stock estimations [
7], in order to improve social safeguards, benefit sharing [
8,
9,
10], and to promote sustainable forest management. However, few methods have been developed and no
de facto method accepted by those implementing community participation in MRV. Recent studies [
11,
12,
13] have built on experience from participatory biodiversity monitoring to compare cost efficiency and quality of the data collected by local communities. Some have even compared community-collected data with carbon stock estimations made by scientists [
14]. Although it is generally recognized that local people can (with training) estimate aboveground carbon, there is a lack of information about how to sustain such a system in the long-term.
There is little to no information on local people’s participation in reporting data on forest inventories to national and international levels, and the role they could have in validation and verification. Danielsen
et al. [
14] and Phelps
et al. [
15] consider local communities for their possible role in data collection and as key stakeholders in approving (or not) REDD+ projects. However, according to Phelps
et al. [
15], central governments should manage carbon accounting. How the data flows from local communities to these national databases is still to be determined. Lotsch and Skutsch [
9] mentioned the role of governments at the national level in clarifying the reporting structure between local communities and organizations responsible for managing national databases, including what their benefits would be.
We propose an approach that considers local people’s participation in MRV at the measurement, reporting and verification stages, as a whole. In this research, we do not focus solely on one of these components independent of the other two. According to Danielsen
et al. [
14,
16], it is possible for local people to learn how to estimate carbon stocks or carbon emissions in the context of REDD+. MRV also includes the measurement and monitoring of non-carbon data, such as the multiple benefits from the forest (e.g., from biodiversity, water and non timber forest products), the identification of drivers of change in forest cover and in local livelihoods [
17]. However, it is more challenging to include non-carbon data measurements in a standardized data flow, and to consider how it affects decisions on land use. More challenges come from considering local people’s contributions to the reporting and verification parts of MRV and any subsequent benefits. Visseren-Hamakers
et al. [
18] emphasize the necessity to use interdisciplinary research to address the multiple and complex challenges related to REDD+, including MRV.
In our research, we asked what is the feasibility and sustainability of local community participation in MRV for carbon and non-carbon data in Indonesia. To answer this question, we used a multidisciplinary approach that integrates social and spatial data, something that has been done before [
19,
20,
21], but has never been applied to MRV. We analyzed the local communities’ capacity to participate in MRV, their time, willingness, and experience in participating in communal activities. We examined existing structures in the health and forestry sectors and compared them to understand the local communities’ contribution to information flows and reporting systems. Last, we studied the overlaps and gaps between changes in forest cover from local and scientific perspectives.
The research started in 2013. This methodological article presents the approach we used, as a first step; the results of the analysis will be reported in subsequent articles. The paper is organized as follows: we first describe how we developed our approach, including the research design and site selection; then we present and discuss the methods used in this feasibility study.
2. Developing a Multidisciplinary Approach
A team of researchers, including specialists in forestry and health governance, social scientists, and remote sensing experts, developed an approach to study the feasibility and sustainability of PMRV. This was used to compare different village conditions across Indonesia.
2.1. Pilot Sites
A few countries have developed a UN-REDD national program, which includes the creation of an MRV institution to manage a national carbon database for use in international negotiations on climate change mitigation. We decided to conduct our study in Indonesia because it was one of the nine pilot countries initially supported by a UN-REDD program [
22]. The REDD+ Agency in Indonesia was officially created in late 2013 (Presidential Decree No 62/2013, signed on 2 September 2013) [
23]. Our study could be particularly relevant to this new agency for the development of its programs.
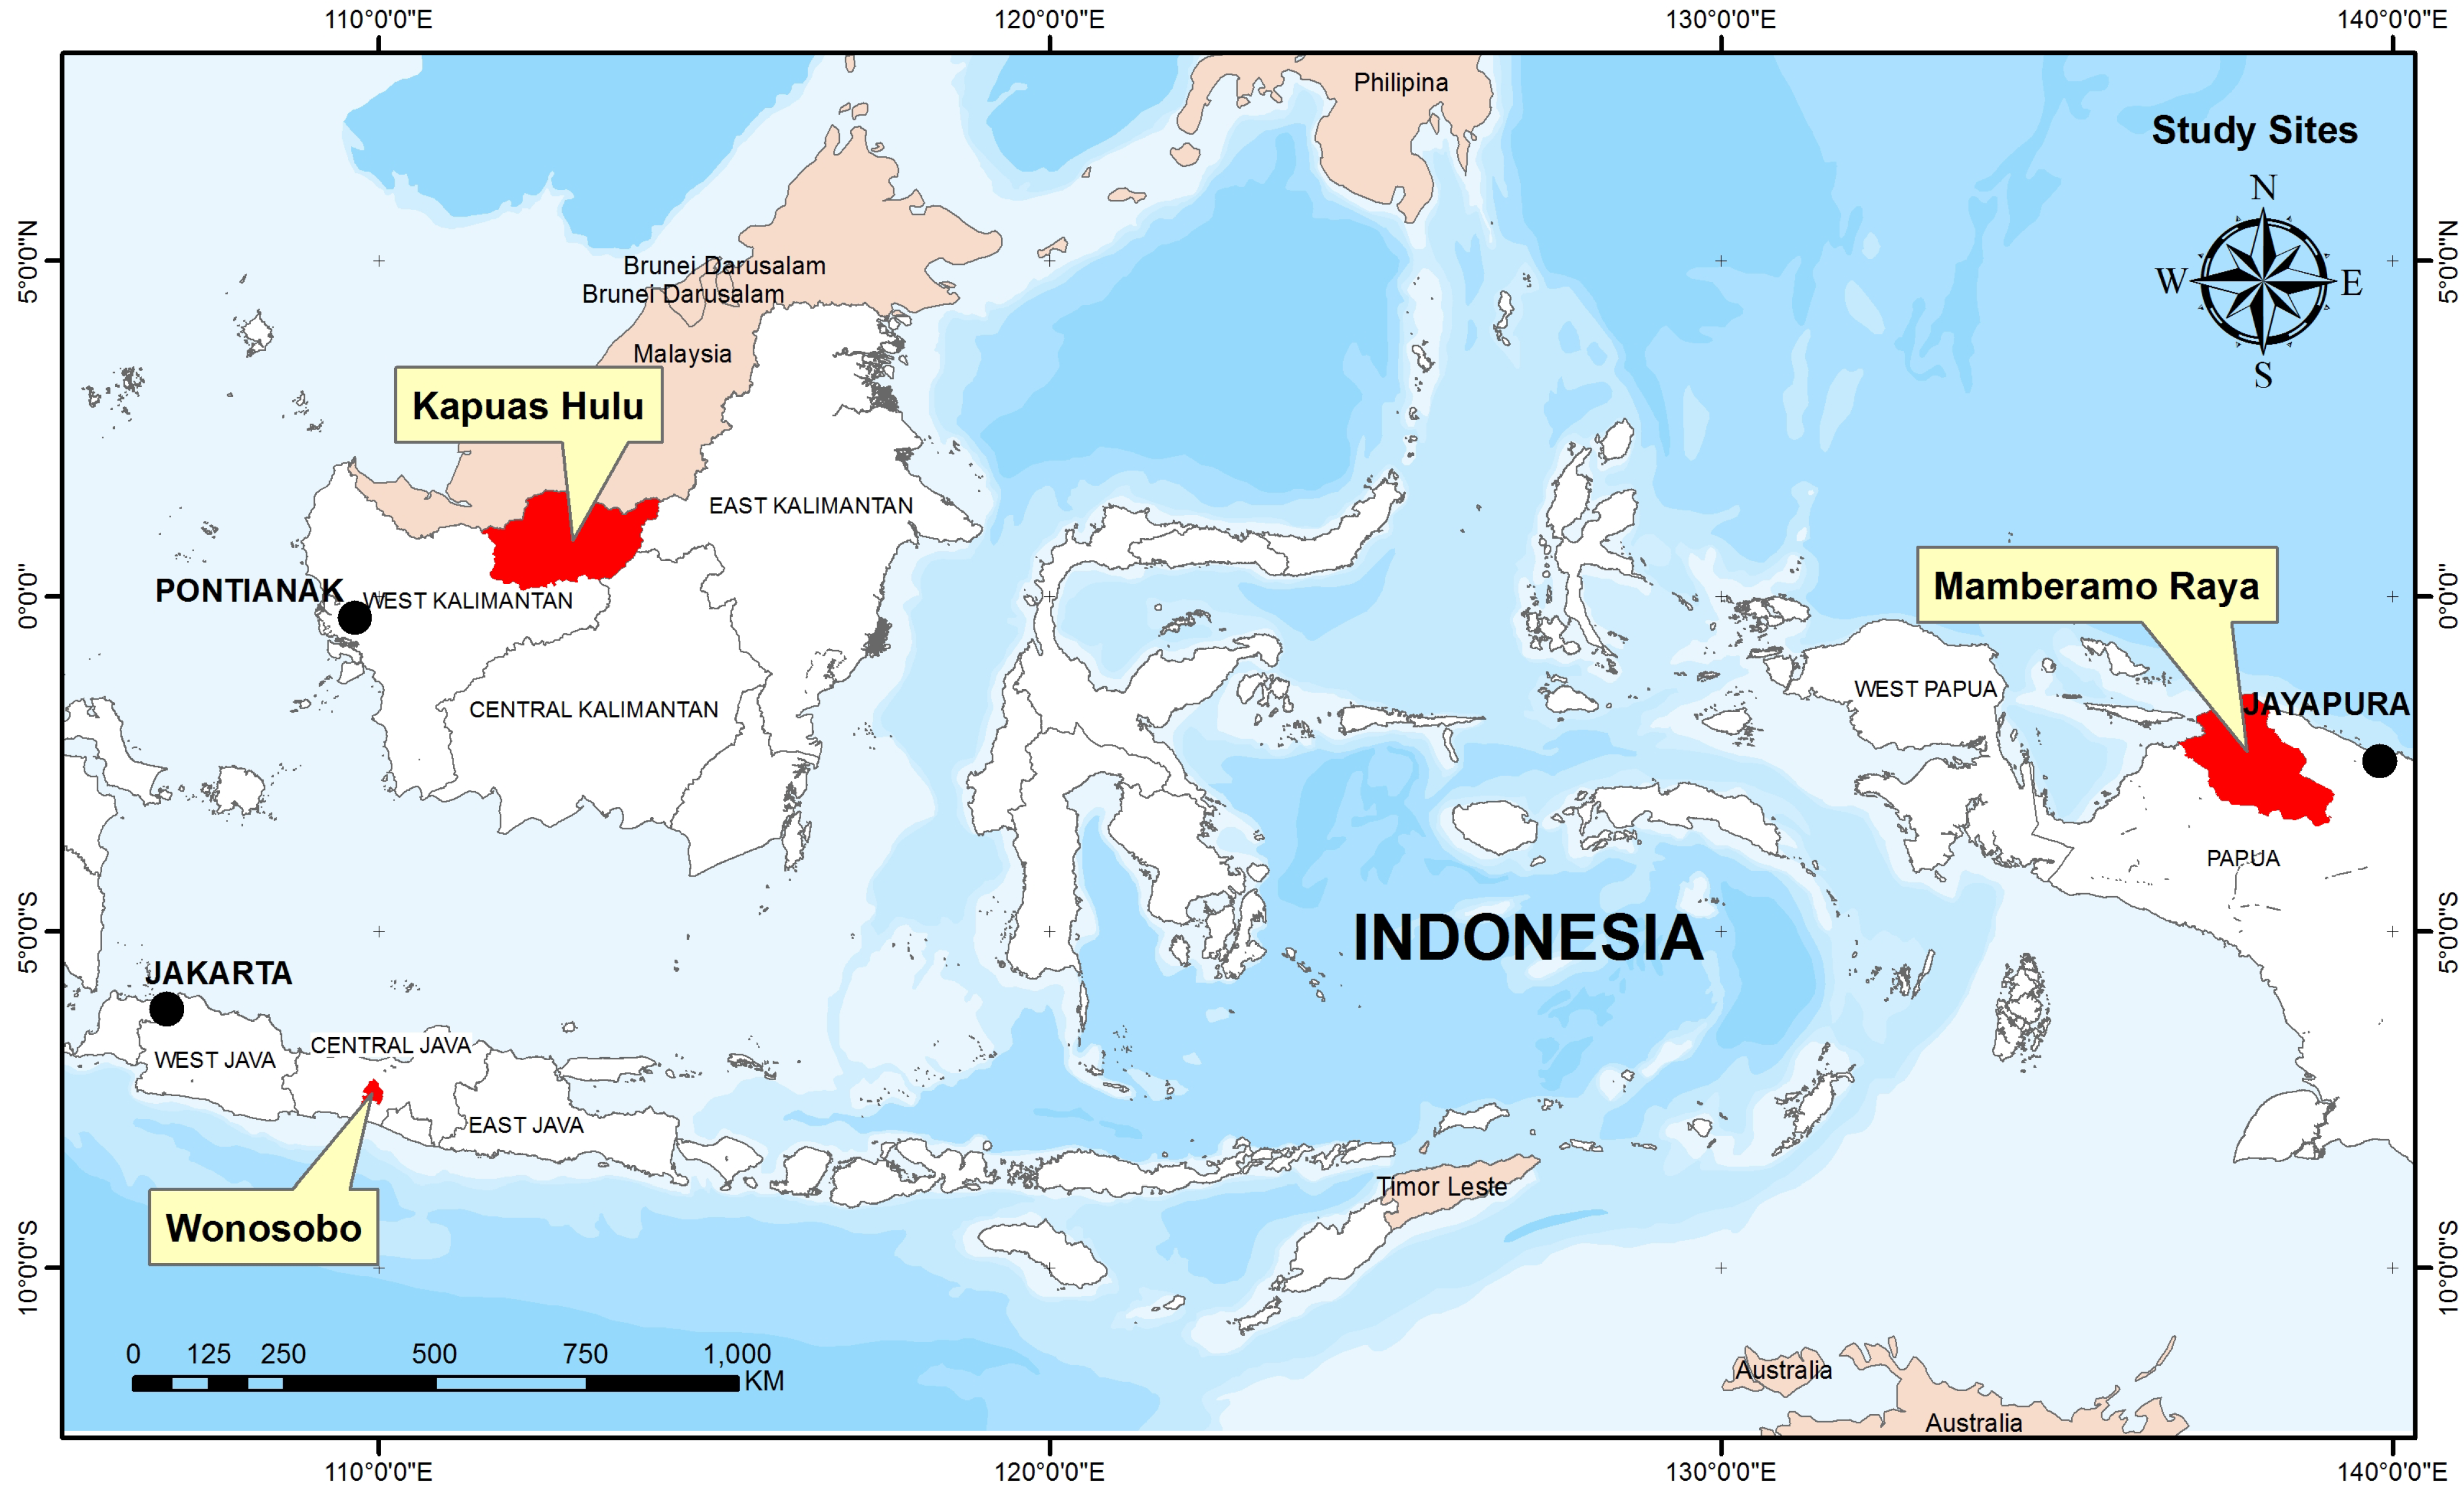
We selected pilot sites that represent different conditions (different levels of forest degradation along a gradient in forest transition; population density; and socio-economic context) in three provinces of Indonesia (
Figure 1), based on the criteria presented in
Table 1: Papua, West Kalimantan, and Central Java. We intentionally chose research sites outside of REDD+ demonstration activities, to avoid the local communities (and their answers) being influenced by their relationships with the proponents.
We chose the criteria in
Table 1 as they best show how situations in the three sites are contrasted along a forest transition curve. The criteria cover the environment (presence of natural forest), human capital (demographic pressure), site accessibility (difficulty to communicate), economic pressure (presence of the private sector), and presence of local schemes for environmental management (community forests). Activities included not only the village level, but also research at the district, provincial, and national levels. A multivariate cluster analysis was conducted for each site using secondary data from the Indonesian Central Statistics Agency [
24], based on the criteria presented in
Table 1, and combined with our knowledge of each local condition to select the sites.
Figure 1.
Map of the research sites in Papua, West Kalimantan, and Central Java.
Figure 1.
Map of the research sites in Papua, West Kalimantan, and Central Java.
Table 1.
Criteria for selecting research sites in Indonesia.
Table 1.
Criteria for selecting research sites in Indonesia.
| Sites | Natural forest cover | Demography | Accessibility | Economic pressure | Importance of community forestry |
|---|
| Papua (Mamberamo Raya) | ++ | − | − | + | − |
| West Kalimantan (Kapuas Hulu) | + | + | + | ++ | + |
| Central Java (Wonosobo) | − | ++ | ++ | ++ | ++ |
Table 1 illustrates the gradient of natural forest cover in Indonesia from high in Papua to low in Java. Our site in Papua, with the most natural forest cover, has a low population density, low accessibility, medium economic pressure and community forestry is absent. Our site in West Kalimantan, with a medium population density, follows a transition from natural forest cover to agro-forests and smallholder plantations. Economic pressure is increasing, and access is easier than in Papua, with an important network of roads. Our site in Central Java has lost most of its natural forests due to high demographic and economic pressure, but community forestry is well developed.
To understand the forest cover changes in the different research sites, we created maps of land cover for years 1991, 2000, 2001, 2005, and 2011, using multi-spectral and multi-temporal optical data from different sensors, Landsat Thematic Mapper 5 and Spot 5. Before classification, pre-processing of satellite imagery was conducted to correct atmospheric disturbance and terrain effects. A combination of spectral data and spatial information was used to assess anthropogenic disturbance of forest cover and to assess the performance of spectral reflectance, vegetation indices (i.e. the Normalized Difference Vegetation Index and Enhanced Vegetation Index), common band ratios, and spatial information from co-occurrence texture matrices to improve the accuracy of land cover analysis.
2.2. Defining Research Questions
Projects using participatory approaches are, in general, limited in time [
25]. Looking at long-term engagement of local communities in MRV is essential when developing a participatory approach. The local communities’ capacity to contribute to MRV depends not only on their skills and education, but also on a set of indicators such as knowledge of and dependency on forest resources, previous participation in similar activities and land security. We combined these requirements to propose the following research question: What do we need to know if PMRV is to be feasible and sustainable?
Based on this main question, each group of researchers prepared sub research questions described in
Table 2. A group of social scientists worked on the local conditions for PMRV to be successful in the three pilot sites, based on assets as defined in the Sustainable Livelihoods Approach [
26]: social, human, natural, physical and financial capitals. Reporting is about how information flows, or how data is communicated from one level to a higher one, about the feedback each level gets and the efficiency of the system. The group of governance specialists compared how information flows from local to national levels in the forestry and health sectors. It was useful to learn, from existing experience, about reporting in these two sectors. We chose to study the health sector in Indonesia because it shows clear and functioning information flows, with local community participation, in contrast to the forestry sector. The last group, remote sensing experts, worked on the potential role of remote sensing in the validation of information provided by local communities and in the selection of sites for future measurements. They focused on characterizing forest degradation in each site, looking at overlaps and gaps with maps developed together with villagers.
Table 2.
Main research question and its subset of research questions by theme and their links to MRV.
Table 2.
Main research question and its subset of research questions by theme and their links to MRV.
| Main research question | Components of MRV | Social science study | Governance study | Remote sensing study |
|---|
| What do we need to know if PMRV is to be feasible and sustainable? | M, R, V | x | x | x |
| Subset of research questions |
| What conditions make it possible for local people to conduct PMRV? | M | x | | |
| What is needed for people to be willing to participate in PMRV? | M | x | | |
| What existing organizations can support PMRV and what can PMRV learn from current and past organizations? | M, R | x | x | |
| How can existing systems in Indonesia that include MRV be used for PMRV in the context of REDD+? | R | | x | |
| What is the existing approach to verify or validate the credibility of MRV data? | R | | x | |
| How can we use various actors’ perceptions to provide information about the robustness of the current MRV system? | R | | x | |
| What scale of deforestation and forest degradation can be measured using spatial data and remote sensing analysis? | V | | | x |
| How to use remote sensing (RS) and geographical information systems (GIS) to select relevant sites for local communities to estimate carbon and drivers of forest changes? | M, V | | | x |
| How can RS/GIS be used in the development of PMRV? | V | | | x |
2.3. Developing a Research Design (Indicators and Methods) Based on the Research Questions
Based on the research questions we developed a set of indicators that helped us develop research methods. These indicators aided collaboration between the different research groups (the indicators are described in
Table 3,
Table 4 and
Table 5). Despite their different backgrounds, the researchers had to collaborate to make the approach integrative. Social scientists and remote sensing specialists worked together on improving the accuracy of satellite imagery interpretations based on the forest conditions according to local communities and ground checks. They also designed common methods, such as participatory maps. Both teams considered the potential role of local people in verification. The social science team collaborated with the governance team to look at the reporting systems and how information flows at the village level.
Some of these methods were adapted from multidisciplinary studies, in particular Sheil
et al. [
27] and Chambers [
28] for participatory mapping, focus group discussions and household surveys; Mercado [
29] and Geilfus [
30] for Venn Diagrams and sociograms, and seasonal calendar; and Larson [
31] and Liswanti
et al. [
32] for research related to land tenure. The different methods are explained in detail in
Table 6.
The research objectives and the methods were presented in each village, during several community meetings. Occasionally this process required several additional sessions of explanations and discussion, initiated by the local communities, before they would agree to our methods and give their approval for the research to start.
3. An Integrated Approach to Study the Feasibility of PMRV
In this section, we first describe the three studies (social science, governance, and remote sensing (RS) and geographical information systems (GIS)). These three studies were developed together in an integrated way, in the same locations, to answer the main research questions. We present the links between research questions, sets of indicators and methods.
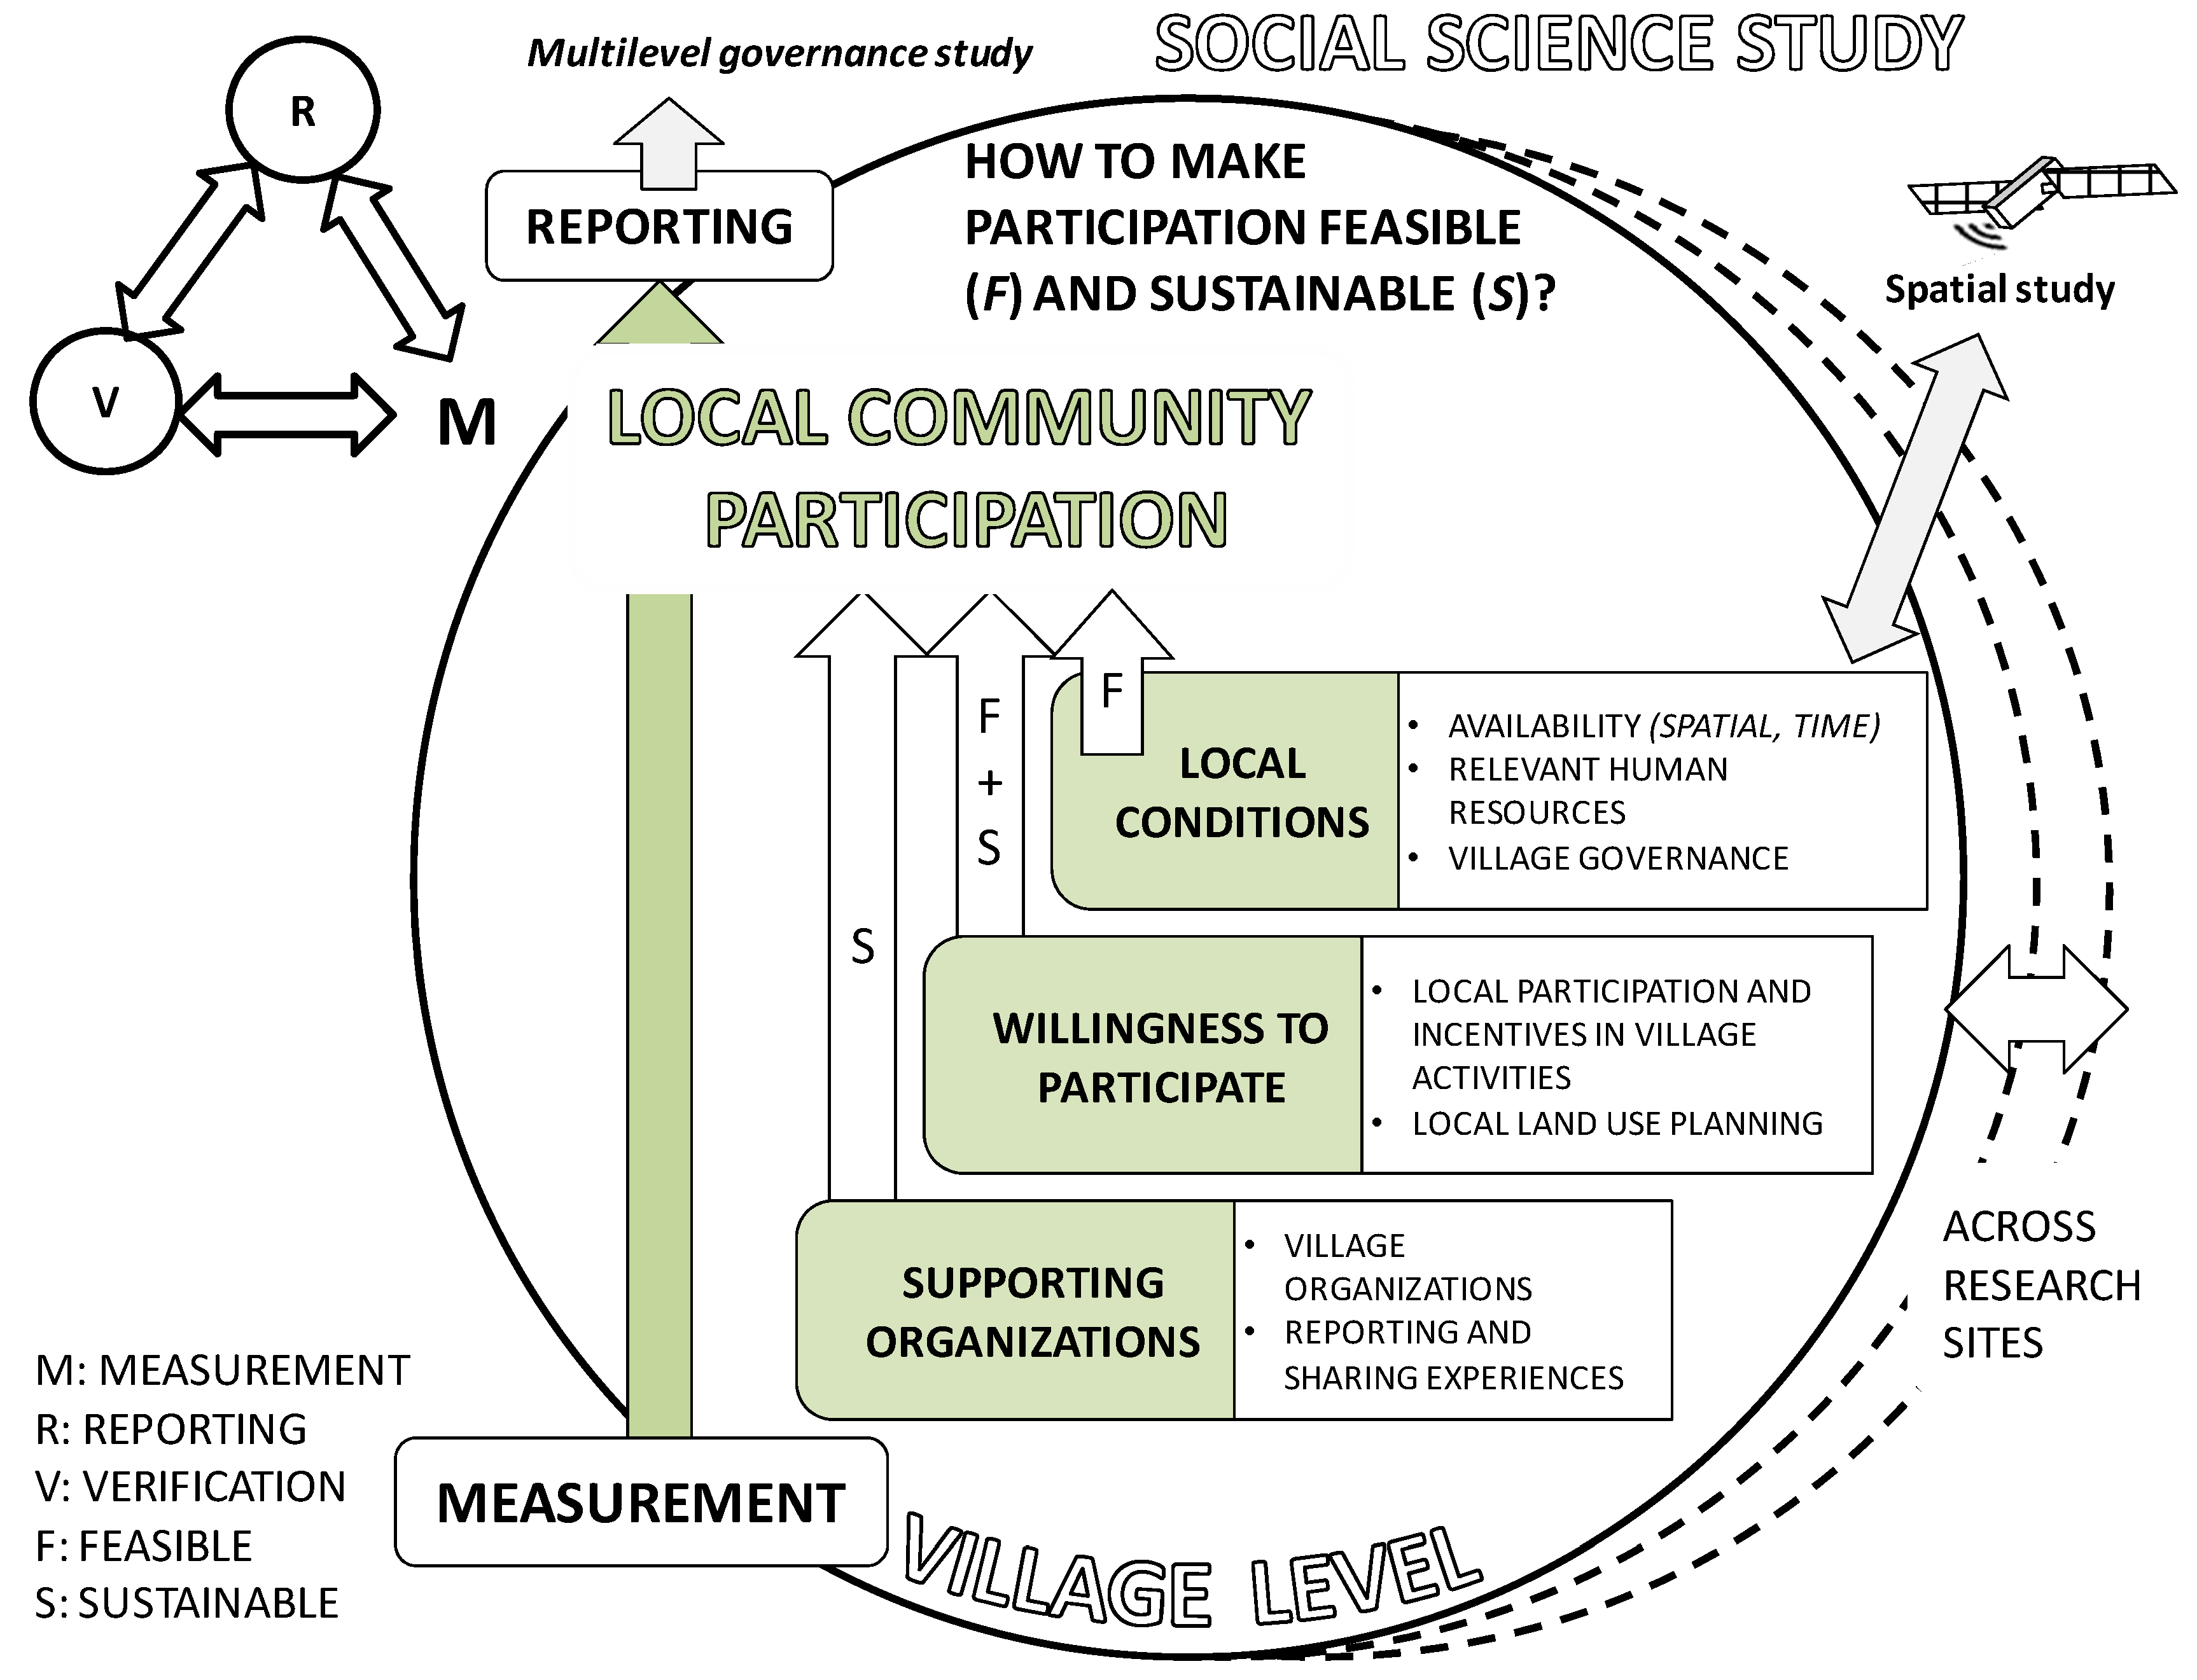
3.1. Measurements: a Social Science Study
The social science study focused on measurement (M—of MRV) at the village level and the other two components to a lesser extent. We learned from past and existing local reporting (R) experience within and between villages, government institutions, as well as from the private sector. The verification (V) part of the study was in collaboration with the GIS/RS team for participatory mapping and ground checks.
Figure 2 illustrates how the social science team conducted its investigations in each local context. The same set of questions, indicators, variables, and methods were used in each of the study sites.
From the main research question (
Table 2) we recognized the importance of considering both sustainability and feasibility for PMRV and developed the methods described in
Table 3. One method could be used to follow more than one indicator. Sustainability and feasibility were addressed by considering the local conditions, the willingness of villagers to participate and what supporting organizations could be used in developing PMRV, especially for reporting.
We studied the enabling local conditions for PMRV, by analyzing the village demography, governance, and villagers’ availability to take measurements.
Local people’s willingness to participate depends largely on the kind of incentive they can expect. We looked at past and present experiences the villagers have had of participating in activities related to environmental issues and the kind of benefits they have received. Land tenure and land use were also important aspects to consider for future MRV, especially the site selection for the measurements, and the villagers who would be involved. Learning from local village organizations and their experience in data reporting and sharing helped us to identify the necessary conditions for sustainable measuring and reporting at the local level.
Figure 2.
The social science research design.
Figure 2.
The social science research design.
Table 3.
Social science research design and the conditions for local participation in MRV.
Table 3.
Social science research design and the conditions for local participation in MRV.
| Research questions | Indicators | Factors | Methods used |
|---|
| 1-What conditions make it possible for local people to participate in MRV? | Availability | - Demography: age, gender, and occupation distribution | HH survey; KII general information; FGD forest management; FGD drivers of change; FGD seasonal calendar; participatory mapping |
| - Time structure: occupation time frames, livelihood activities by gender, and seasonal employment |
| - Sources of livelihoods: livelihood diversity, sources of income |
| - Dependency on natural resources: forest related livelihoods, as cash income or subsistence |
| - Local people’s settlement: distance to urban areas, form of settlement (temporary or permanent) |
| - Infrastructure facilities: village infrastructure, people’s access and mobility |
| Human resources | - Technical knowledge: level of education, experience with technology | HH survey; FGD forest management; FGD drivers of change; FGD seasonal calendar; participatory mapping |
| - Local knowledge: knowledge about the territory, land uses, ownership distribution and regulations, forest management practices, drivers of deforestation and forest degradation. |
| Local governance | - Status: villagers’ social status or involvement in organizations that may influence participation | HH survey; KII general information; KII land tenure; KII experience mechanism; FGD forest management; FGD drivers of change; FGD sociogram; participatory mapping |
| - External governance: government authorities in the village; villagers’ relationships and experience with national government |
| - Internal governance: power relations between groups; local power relationships influence information sharing |
| - Land tenure: resources and land ownership; local tenure arrangements and regulations |
| 2-What factors influence people’s willingness to participate in PMRV? | Forest service valuation | - Forest service valuation: forest benefits; forest products; most important timber products, NTFPs and game | HH survey; KII general information; KII land tenure; FGD forest management; FGD drivers of change |
| - Village perspectives on forest trends: future state of forest; plans for the future use of forest and non-forest lands |
| Drivers of forest cover change | Drivers of change: current and past local land cover and land uses (livelihood activities); causes of change; link between forest changes and forest service trends; local forest management systems. | HH survey; KII general information; FGD forest management; FGD drivers of change |
| Local motivation to participate | - Local participation: people’s motivations to participate in groups, organizations or activities | HH survey; KII experience mechanism; FGD drivers of change |
| - Incentives: incentives or compensation provided by past projects or activities, traditional benefit sharing systems, and future village needs and desires. |
| 3-How can current and past organizations inform and support PMRV? | Village organizations | Village organizations: existing organizations and groups in the village, their roles and structures, organizations local people identify they want to work with or think match PMRV activities. | HH survey; FGD sociogram; KII experience mechanism |
| Reporting experience | Reporting experience: local organizations’ relationships with external authorities or groups, and experience in reporting. | KII experience mechanism; FGD Forest management; FGD sociogram |
| Sharing mechanisms | Sharing mechanisms: village experience with benefit sharing or resource distribution, details about the structure and sharing mechanism. | HH survey; KII experience echanism; FGD sociogram |
| Perceptions about organizations | Perceptions about organizations: villagers’ perceptions of the role and structure of organizations in their village, including an assessment of functionality, trustworthiness and other relevant MRV capacities; reasons for wanting or not wanting to work with an organization | HH survey; FGD sociogram |
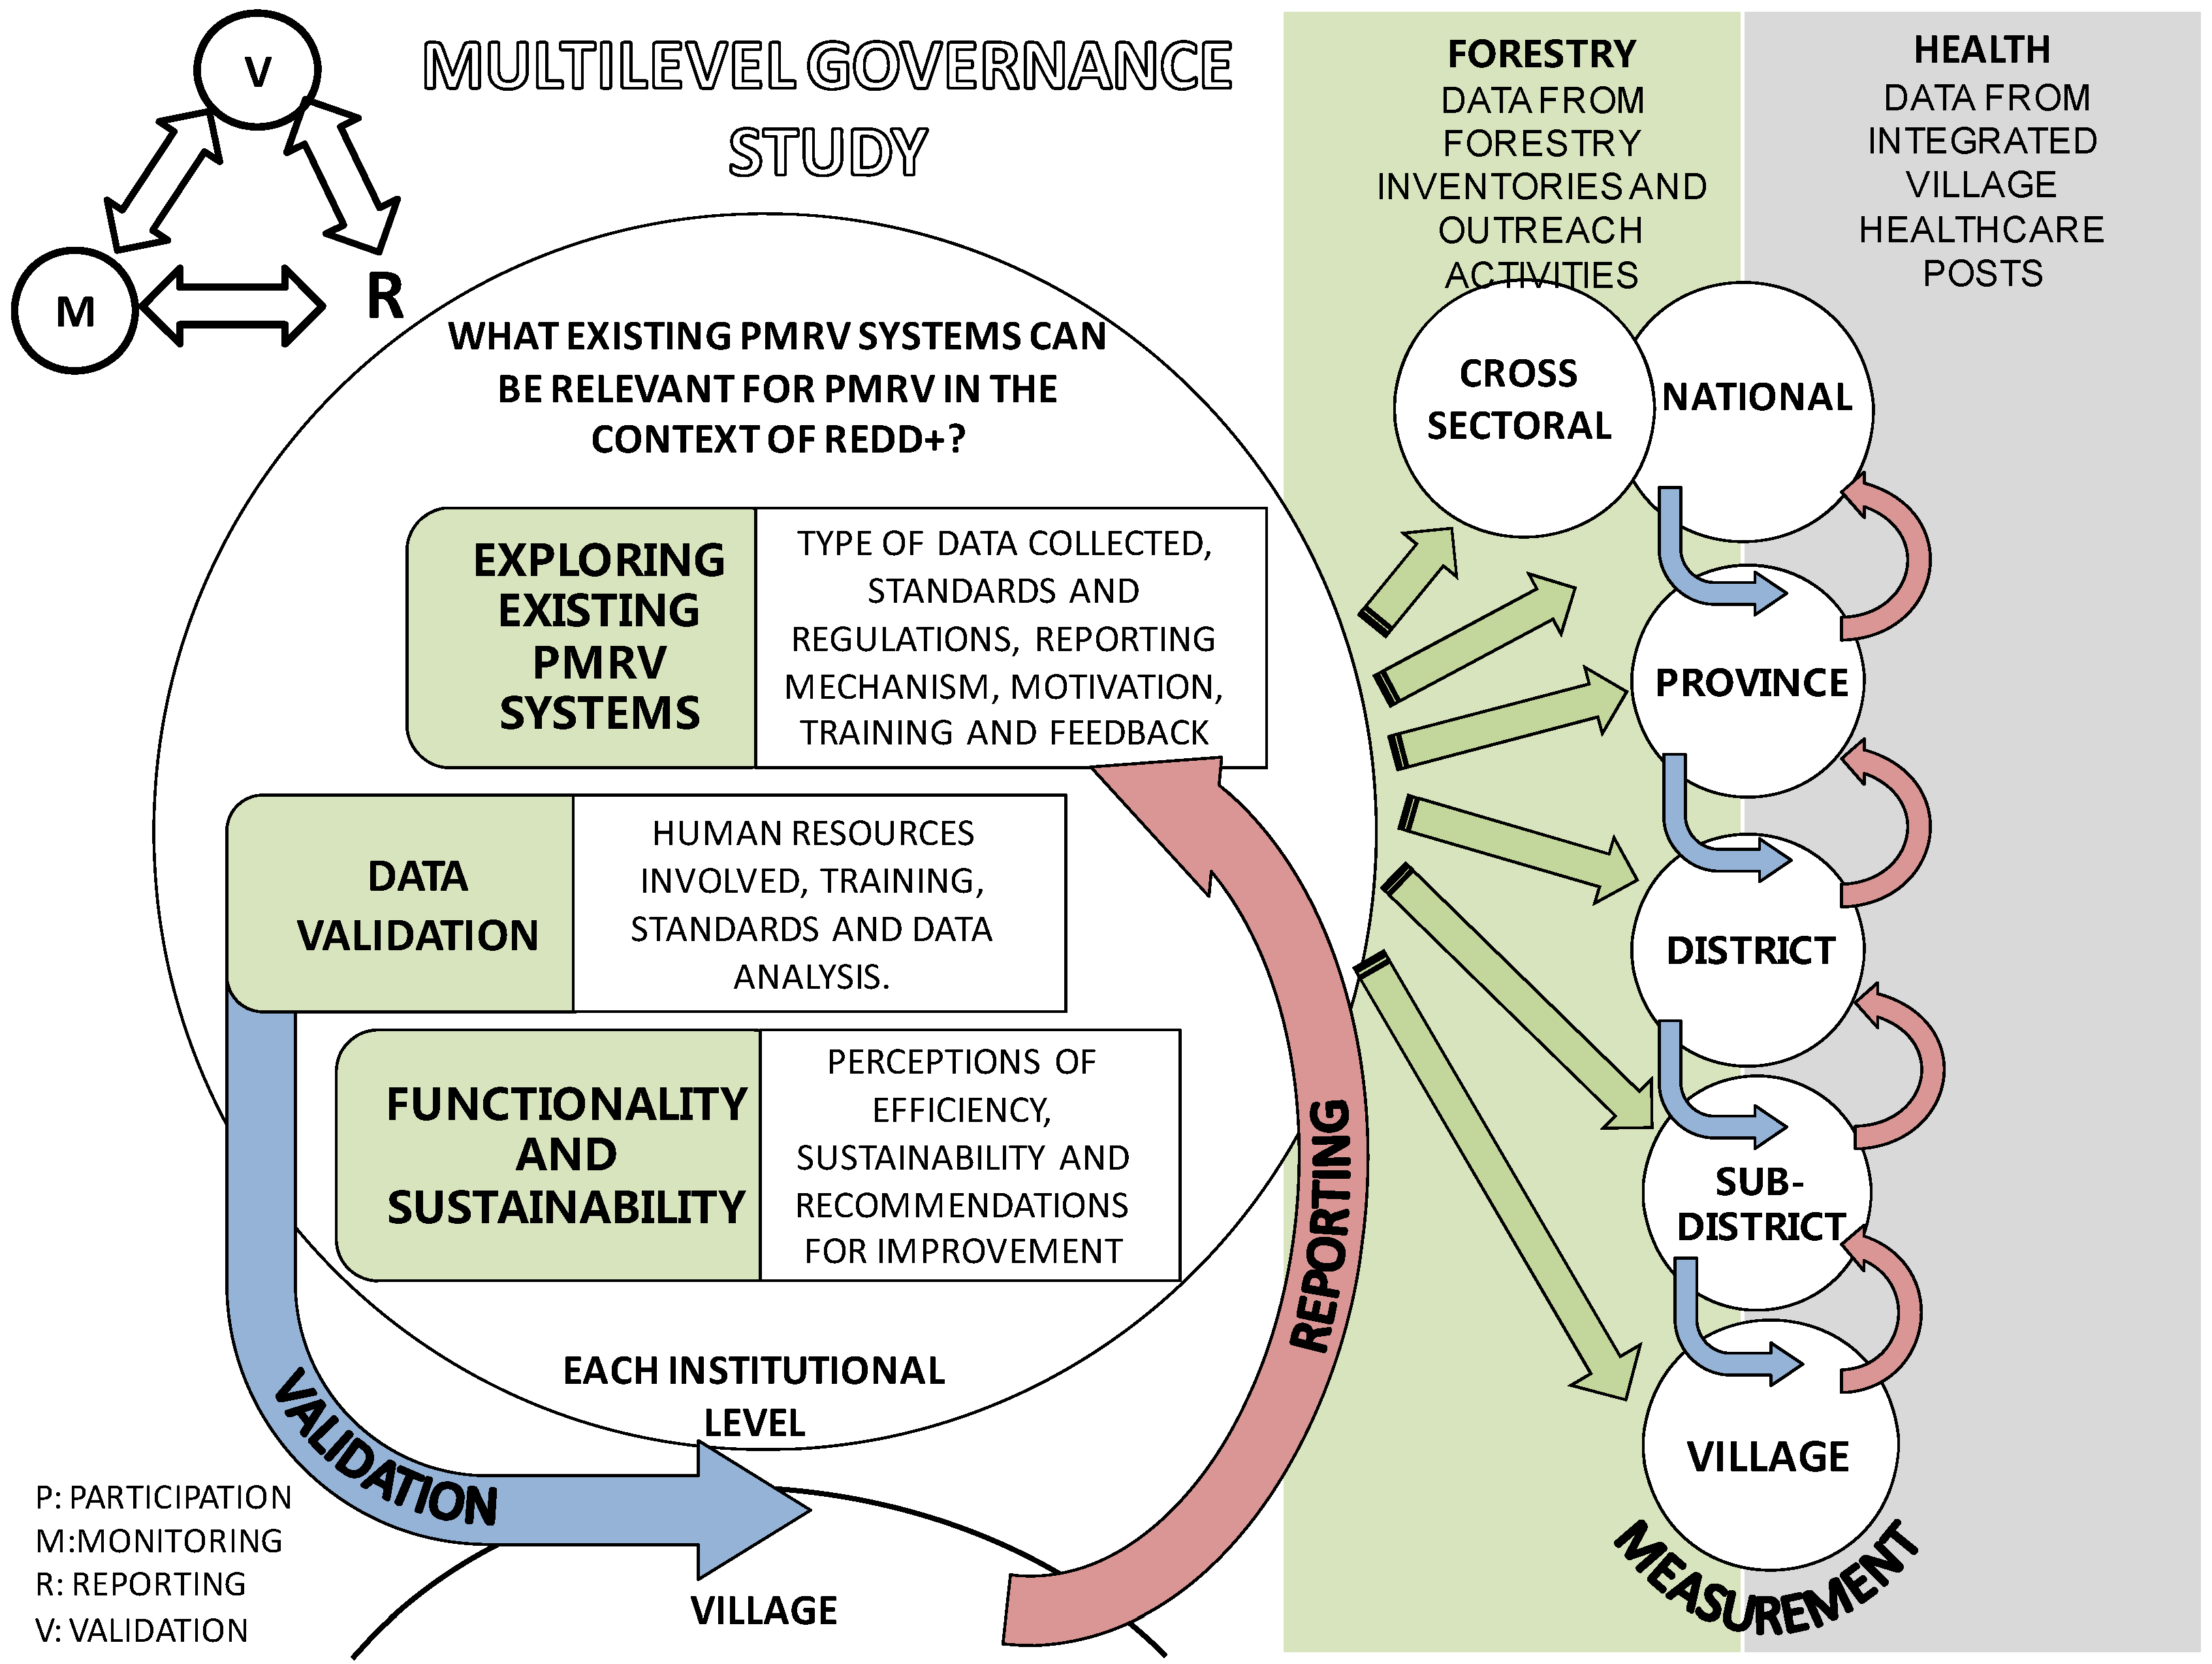
3.2. Reporting: a Governance Study of Information Flows
Two pre-existing systems, the Indonesian healthcare and forestry information systems, were chosen for an in-depth multilevel governance study (
Figure 3). We worked in the same villages as for the other research activities. We also worked at higher governance levels: sub-district, district, provincial and national, to obtain a complete picture of how information flows across the different levels, to allow comparisons and reveal challenges.
We explored the healthcare system because community involvement in monitoring and reporting in “integrated health posts’’ (Pos Pelayanan Terpadu—Posyandu) has existed in Indonesia for over 30 years. The current forestry dataflow was also studied in order to describe the current actors, organizations and institutions, level of community participation and possible challenges.
We studied how data is collected in both sectors at the community level, reported to higher institutional levels, and whether feedback and validation existed (
Figure 3). We hoped that the implementation of PMRV (in the context of REDD+) could learn from these existing systems.
In
Table 4 we summarize the two sectors according to the research questions, the main indicators and research methods. We kept as much as possible to the same structure for both sectors to allow comparison.
Figure 3.
The governance research design.
Figure 3.
The governance research design.
During the interviews at each level, we asked about the existing systems’ data flow, standard procedures, existence of training for those managing data, human resources in each organization, and the perception of what works and what could be improved in terms of efficiency and participation of local communities (
Table 4).
Table 4.
Research design for the multilevel governance study on reporting in the health and forestry sectors.
Table 4.
Research design for the multilevel governance study on reporting in the health and forestry sectors.
| Research questions | Indicators | Factors | Methods used |
|---|
| 1-How can existing systems in Indonesia that include MRV be used for PMRV in the context of REDD+? | People and organizations currently involved in MRV | Participant’s motivation and contribution (level of participation in health system); characteristics of organizations or institutions involved: name, structure, human resources (people involved and training); how budget is allocated and by whom; and the type of data collected. | Forestry and health open-ended questionnaire interviews |
| Standard procedures | Standard procedures for PMRV, targets and existing feedback at each level, and challenges of meeting the targets at various levels. | Forestry and health open-ended questionnaire interviews |
| System sustainability | History of current system, development and objectives; characteristics of database information systems; and participant’s criteria for a successful PMRV system. | Forestry and health open-ended questionnaire interviews |
| 2-What is the existing approach to validate MRV data? | People involved in validation | Characteristics of individuals and groups involved in validation: competence, training, and commitment to data quality. | Forestry and health open-ended questionnaire interviews |
| Validation procedures | Means of validation; standard procedures; frequency and purpose; and raw data, data cleaning mechanism, and preliminary analysis. | Forestry and health open-ended questionnaire interviews |
| 3-How do various actors perceive the robustness of the current MRV systems? | Perceptions of functionality | Key informants’ perceptions of the efficiency of the existing systems’ functionality, reasons for inefficiency, strengths, and lessons learned. | Forestry and health open-ended questionnaire interviews |
| Perceptions of sustainability | Criteria to ensure sustainability of the existing PMRV systems according to perceptions, including minimal human resources, budget, and facilities needed. | Forestry and health open-ended questionnaire interviews |
| Possible or expected improvement | Recommendations to improve the existing systems, possible inclusion (in the system) of data the community have collected, improvement of data quality. | Forestry and health open-ended questionnaire interviews |
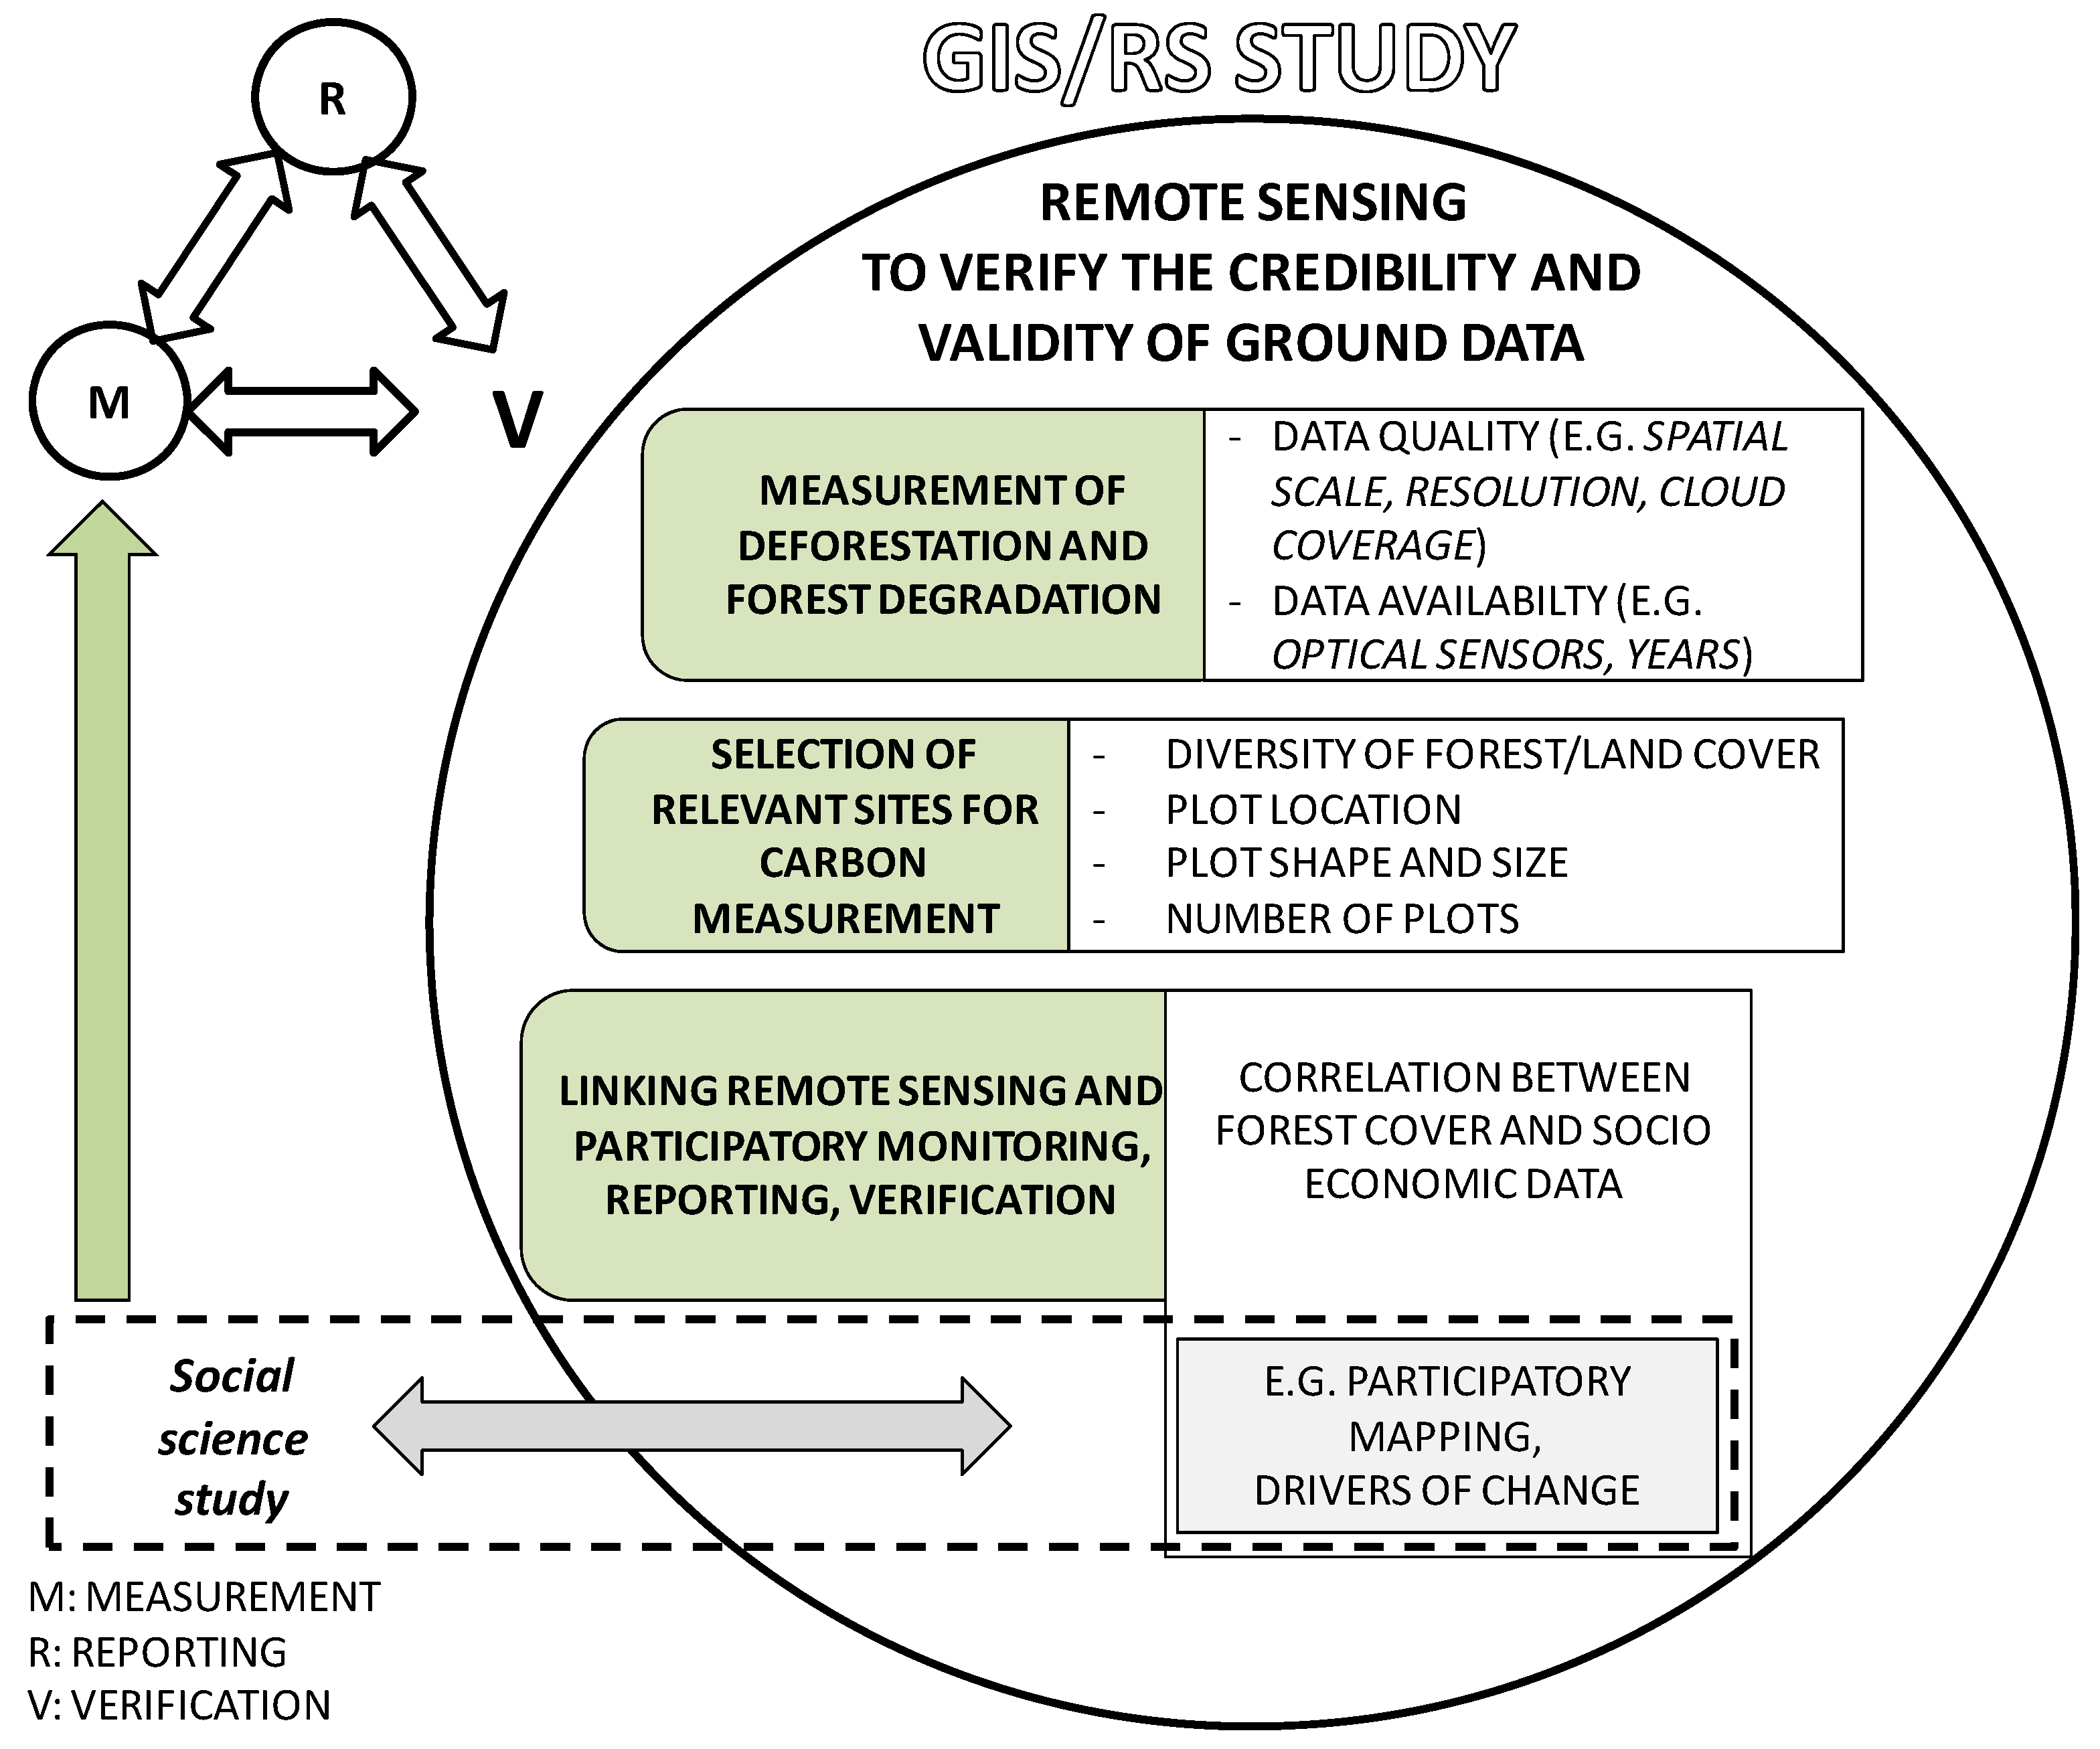
3.3. Verification: Addressing the Gaps between Local and Scientific Perceptions
Measurement, Reporting and Verification needs cost effective and reliable methods for verification. We looked at the conditions needed to develop a relatively simple and cost-effective method using remote sensing and geographical information systems to collect information on land use (LU) and land cover change (LCC) (
Figure 4). Using satellite imagery interpretation as well as information from local people, we identified the land uses, the drivers of deforestation and forest degradation, and their resulting impacts.
We considered the scale of deforestation and forest degradation, still using satellite data and spatial analysis, and the information needed to select relevant sites for local communities to estimate carbon stocks and drivers of forest cover change. We also developed, in collaboration with the social scientists, participatory mapping with the local communities.
Figure 4.
The remote sensing research design.
Figure 4.
The remote sensing research design.
To address the three objectives presented in
Figure 4, we used different indicators (
Table 5).
First, we studied how to best measure deforestation and forest degradation. A first indicator is data quality: we considered spatial resolution (size of the pixel), spectral resolution (wavelength width of each band), radiometric resolution (intensities of radiation), temporal resolution (for time series analysis), scale of data to be used, and the size of the area. We then considered the maximum tolerance of cloud coverage, clear and identifiable features in the image, and readiness of the data to be used. The last indicator was the availability of the data, whether it was free access or not, and its coverage of the research area.
Second, looking at relevant sites for carbon measurements we should understand the diversity and homogeneity of forest and land cover (
Figure 4). The analysis focused on diversity of the land use types and forest cover, and their relevance to the monitoring of carbon stock and forest change. Details about plot measurements included location, shape and size, and number of plots needed.
Third, in order to link RS/GIS and the social science study we needed to determine how local people could be involved in the identification of critical areas, in which changes in forest cover are happening. Participatory mapping helped to characterize these critical areas for the selection of measurement plots.
Table 5.
Research design for verification of local measurements using remote sensing and geographical information systems.
Table 5.
Research design for verification of local measurements using remote sensing and geographical information systems.
| Research questions | Indicators | Factors | Methods used |
|---|
| 1-What scale of deforestation and forest degradation can be measured using spatial data and remote sensing analysis? | Data resolution | Spatial resolution (pixel size); spectral resolution (wavelength width of each band); radiometric resolution (radiation intensities); temporal resolution (time series analysis), scale of data to be used; and the size of the area. | Desk study—RS and GIS analysis |
| Data quality | Maximum tolerance of cloud coverage; clear and identifiable features in the image; and ready to use data. | Ground checks of land cover |
| Data availability | Cost of the data (free access or pay) and data coverage of the research area. | Desk study—RS and GIS analysis |
| 2-How to use RS/GIS to select relevant sites for local communities to monitor carbon and drivers of forest change? | Diversity or homogeneity of forest/land cover | Diversity of land use type and forest cover and relevance of monitoring carbon and forest change (comparability with different forest cover, land use and land cover change dynamics in the area). | Ground checks of land cover; desk study - RS and GIS analysis |
| Measurement location | Accessibility of the measurement area (terrain conditions, local regulations), infrastructure available in the area and measurement requirements including the number of samples. | Desk study—RS and GIS analysis |
| Measurement, shape and size | Shape and size of sample plot and element measured (above ground biomass or other). | Desk study—RS and GIS analysis |
| Number of measurements | Minimum number of plots necessary to conduct the measurements and relations between the number of measurements and land diversity. | Desk study—RS and GIS analysis |
| 3-How is RS/GIS relevant to PMRV development? | Correlation between forest cover and socio-economic data. | Link RS/GIS with social team through socio-economic survey and involvement of local people in plot determination and map validation. | Desk study—RS and GIS analysis |
3.4. Description of the Methods Used by Each Research Component
A summary of the methods used in our research is presented in
Table 6. This set of methods was developed based on the research questions previously identified in
Table 2, and the indicators developed in
Table 3,
Table 4 and
Table 5. In this section, we provide more detailed information on the main methods used for each component of the research.
Table 6.
Description of the research methods.
Table 6.
Description of the research methods.
| Method | Description |
|---|
| 1 | Household Survey | Using simple random sampling, these surveys covered topics including family demography, sources of income, livelihood diversity, forest product use, time utilization, and natural resource trends over the last 10 years. This method gives a representative sample of each village and quantitatively comparable information about forest dependency, livelihoods, income, knowledge, capacity, and availability. |
| 2 | KII General Information | These interviews were about village history, livelihood changes since the village was first settled until the present, current political structure, and current infrastructure. |
| 3 | KII Land Tenure | These interviews covered land access, use, management, exclusion, and transfer of rights as understood and practiced by the communities across their territories. |
| 4 | KII Experience Mechanism | These interviews provided information about current and past community experience with and perceptions of resource distribution, government aid, and outside organizations; the structure of resource distribution currently practiced by village organizations; and people’s motivations to participate in these organizations. |
| 5 | FGD Forest management | These group discussions were about individuals’ current actions, knowledge, and systems of monitoring and managing particular forest resources deemed important to them. |
| 6 | FGD Drivers of changes | These group discussions gave information about local knowledge and perceptions about past, current, and future forest cover change, the impact of such changes on ecosystems and communities, and how they felt these impacts could or should be addressed in the future. |
| 7 | FGD Seasonal calendar | These group discussions were about individuals’ seasonal activities, a gradient of time availability for potential participation, and any gender differences between the two. |
| 8 | FGD Organizational sociogram | These group discussions discussed environmentally focused organizations in the community, relevant information about cooperation, conflict and authority, and those organizations individuals felt best suited the PMRV activities and those they would most like to work with. |
| 9 | Participatory mapping | This activity was conducted to spatially represent the communities’ land use, land cover change, and photographic documentation of particular use and change areas. This method was designed to give us an understanding of how locals conceptualize their territory, use their resources, and perceive forest change in order to gain both local knowledge and spatial nuance for designing PMRV activities. |
| 10 | Forestry open-ended questionnaire interviews | Open-ended questionnaires allowed for in-depth interviews with informants involved in the monitoring, reporting and verification system. The questionnaires were adapted to each level of governance. Forestry questionnaires were adapted according to the organization being interviewed (private and public). |
| 11 | Health open-ended questionnaire interviews | Open-ended questionnaires allowed for in-depth interviews with informants involved in the monitoring, reporting and verification system. The healthcare team conducted interviews with government workers at each level of governance and village health volunteers. |
| 12 | Desk study—RS and GIS analysis | The desk study work and data pre-processing, analyzed ground check data for land cover. We also generated initial land cover maps, and participatory maps of land cover and land use. The data used: Landsat, SPOT, ALOS, RapidEye, Google Earth Pro, land cover data from the Ministry of Forestry of Indonesia, the Forest Governance Agreement Map (Tata Guna Hutan Kesepakatan – TGHK), and spatial planning (Rencana Tata Ruang Wilayah—RTRW). |
| 13 | Ground checks of land cover | Collection of information to refine the land cover map(s) previously produced during the desk study. GPS points together with land cover identification have been collected in the three provinces (Kalimantan, Java and Papua). |
3.4.1. Methods Used in the Social Science Study
The methods developed were used in the three research sites to enable comparisons across different socio-economic and ecological contexts (
Table 6).
Focus group discussions (FGD), conducted with men and women separately, provided information on the conditions to design and implement PMRV. This exercise, organized in groups of five or eight participants, allowed free discussion within the group and the collection of more exhaustive information. Focus group discussions covered a large group of topics, i.e., local forest management, perceptions of the drivers of change and livelihoods (according to a seasonal calendar), and organizational sociogram to capture villagers’ interactions with different organizations.
Household surveys, using random sampling, allowed a more systematic data collection at the village level on land status, dependency on forest products, individual participation in village activities, and perceptions of environmental trends. In total 409 households were surveyed.
Key informant interviews provided in-depth information on tenure, benefit sharing, and changes in livelihoods. We selected the informants during community meetings and informal discussions. In general, four villagers were interviewed per village.
Participant observations were also used. These were based on daily, opportunistic and random observations of villagers’ activities by the researchers. Relevant observations were compiled in a logbook or field report that enabled a deeper understanding of local people’s social and daily activities.
3.4.2. Methods Used in the Multilevel Governance Study
The main methods used for this study were open-ended questionnaires allowing in-depth interviews with individual informants involved in both the healthcare and forestry database systems (
Table 6). The questionnaires examined the scope and scale of community-based monitoring and the optimum scale achievable by communities that can provide scientifically meaningful data through successive levels of governance. Questionnaires were adapted according to each level of involvement and the organization being interviewed, whether it was private or government owned. Seventy-seven people were interviewed, including health volunteers in each village and civil servants working at the different governance levels.
3.4.3. Methods Used in the GIS/RS Study
We produced a first set of land cover maps for the three project sites, only based on analysis of satellite imagery, where compositions of forest structure differ due to different levels of deforestation and forest degradation (
Table 6).
A second set of maps was produced on current and past land use and land cover (LULC) changes. We worked with the elders and other villagers, who have deep knowledge of their land, during focus group discussions. We used hardcopy false color composites of the remotely sensed data for each village and its surroundings as the base map. This could only be made after discussions with local key stakeholders (head of the village and customary head). One facilitator led the activity during the FGD. Transparent paper was used on top of the satellite image to draw polygons and symbols for each LULC type. Legends were added and notes were taken through the process. The resulting maps were converted into digital GIS format for clearer visualization and observation, but also for possible analysis. Ground checks were conducted with key informants to geo-reference the different key features and land cover previously identified, and to verify the position and truth of the data from the maps prepared during the FGD.
These LULC maps were superimposed on the satellite images. This helped to identify the gaps and overlaps between the two. We could also calculate statistical errors and assess accuracy and validity.
4. Discussion
The results from the different surveys described in this article were still being analyzed at the time of submission. Here we present the discussion of our methodological approach; further papers will present the results of the implementation of this approach. It is too early to propose a tool that embeds locally collected data into Indonesia’s national database, as the REDD+ institutions and monitoring mechanisms still need to be clarified [
33], and the national database is still under construction. We do not propose therefore a PMRV tool (ready to use), but an approach to help decision makers understand the local readiness concerning PMRV in Indonesia, and the best conditions required for it to work. We were able to identify the main advantages and potential caveats from using this integrated approach, and discuss whether PMRV is feasible or not and under what conditions.
4.1. An Integrated Approach
We studied local community participation in measurement, reporting and verification of carbon and non-carbon data. The literature (so far) has considered participatory MRV as a whole when defining the concepts [
10,
13]. When being more specific about the ways to achieve participation in MRV, the authors focused on individual letters (components) of MRV. For example, M—the role of local communities in carbon stocks and emission estimates [
3,
16,
34], R—the importance of a clear and efficient system for reporting [
9,
35], and V – the way validation should be conducted [
36].
In order to secure social safeguards at the local level, and to ensure that benefit sharing reaches local communities, local participation in REDD+ has been recognized as essential [
7]. The difficulty is still to define the nature and extent of local participation. According to Larrazábal
et al. [
37] local participation should go beyond carbon monitoring and should involve local communities in defining not only the procedures but also the focus of the monitoring. We propose to consider local community involvement beyond the monitoring aspect. Reporting information that they collect about the forest conditions enables local people to play an active role in negotiations related to the reduction of deforestation and forest degradation at the village level. This in turn should allow them to better voice their needs in terms of conservation and development. This is a first step to involve local people not only in an MRV of actions (
i.e., reducing carbon emissions) but also in anticipation of MRV and the transactions related to REDD+ [
5]. Verification in REDD+ MRV is conducted by an independent extra-national team to verify if the implementation of REDD+ is as agreed and planned. In the context of PMRV, verification, using remote sensing, concerns information reported by local communities on forest cover changes and carbon estimates. Local communities can also be part of the verification process. For example, participatory maps can be compared to those from remote sensing for quality control. These maps can then assist decision-makers in the correct use of local community information.
4.2. The Contributions Multidisciplinary Approaches Make to Research on PMRV
In this multidisciplinary approach we combined biophysical information (carbon stock estimations), social science information (local participation in measurements, reporting and verification), and remote sensing information (maps using satellite images and local people’s knowledge). Which synergies can be highlighted? The first and most described in the literature is how local community participation can benefit remote sensing analysis [
19]. The use of remote sensing is limited when it is the only tool for estimating biomass [
38]. However, forest inventories can contribute to address this limitation [
39]. Participatory mapping may also help by involving local people in drawing land cover maps according to their perceptions [
40]. Local communities can identify vegetation types for each land cover [
41]. Ground checks would still be necessary to confirm the gaps on remote sensing maps.
Decision makers have recognized the importance of identifying and monitoring the drivers of change [
7]. Remote sensing and GIS cannot provide that much information on the drivers of change without local community participation. They give a more complete vision of why forest cover is changing [
40] and hence the reasons for carbon stock fluctuations in time and space. Collaboration between remote sensing and social science is therefore essential for developing PMRV.
Remote sensing experts, when working together with local communities, can also provide information on critical areas that require particular attention for monitoring or plot measurements (e.g., areas of high conservation value [
42]).
The importance of linking local level participation in data reporting and the national data reporting system also needs to be acknowledged. These links would strengthen accuracy in reported information and cooperation among the various stakeholders [
43], and help synchronize information across the different governance levels [
35]. It could also provide those considering REDD+ co-benefits and the role of each stakeholder in PMRV, with essential, contextual information. This would be particularly true for social science and multilevel governance studies aimed at understanding the role of local communities in reporting information, especially non-carbon data.
The social scientists in our study looked at local people’s experience dealing with environmental programs, including data management, while the governance team focused on data flow and feedback from village to national levels. These two studies are complementary and their combined results will help when developing a participatory reporting system.
4.3. Why Should Local Communities Participate in MRV?
The importance of involving local communities in MRV has been widely recognized [
7,
13,
37]. Often participatory monitoring approaches have been used as a reference for engaging local people in carbon stock estimations [
14,
16]. When we developed our approach, we worked on a set of indicators (see tables 3, 4 and 5) without assuming that local communities should or are willing to participate. There is more likelihood of villagers participating in a project if there is some form of benefit for the individual or group [
44]. Incentives can be financial, political (e.g., empowerment, participation in decision making), or indirect benefits. The latter could involve sustainable forest management, for example community forestry. The local communities could use PMRV to monitor changes in the forests for which they are responsible.
However, local interest and incentives are not enough [
44]. For example, if the villagers rarely go to the forest to look for forest products and their livelihoods depend essentially on rice cultivation or labor in plantations, then successful adoption of PMRV is unlikely, as they will lack environmental knowledge to have an effective contribution. This approach takes into account villagers’ formal education from which they attain writing skills for note taking, writing reports
etc., skills in mathematics to measure tree diameter and height and/or computer skills to communicate the results of measurements.
Local participation should also be about reporting measurement results and monitoring to the national database. Some studies on participatory approaches propose to provide villagers with training in the use of Personal Digital Assistants (PDA) or using Short Message Service [
5,
45,
46]. However, there are technical issues to overcome with these suggestions, for example, PDA can stop working and mobile phone (PDA) signals are often absent in the forest. Instead of proposing a new system, we decided to look at what already exists, how it could be improved, and to learn from past and current experience. There is a lot to learn from sectors not directly related to forestry, such as health care. The comparison between the structure and caveats in information flow systems of the health and forestry sectors should provide useful information to develop an efficient participatory reporting system.
Another interesting issue is whether local community participation should be promoted or not when addressing the issue of verification and validation. Participation in verification could be checking what use is made of the data they collect, what decisions may affect their livelihoods based on the information they provide, and what benefits from REDD+ they can expect. Local people could also help validate data collected through remote sensing for MRV based on Tier 3, even if there may be some technical issues (e.g., lack of local capacity, difficult access to the information). So far, validation through remote sensing has been proposed to check the accuracy of measurements made by local people. During our research, we compared satellite imagery analysis and interpretation based on remote sensing, and participatory mapping, without assuming from the start that one of these two methods is more precise or accurate.
In summary, local communities may participate in one or more MRV activities where they have the capacity or have acquired it; however, local willingness will have to be considered before launching PMRV on a national scale.
4.4. PMRV and Social Safeguards
Our approach did not consider all the co-benefits of REDD+, however, it did look at some of the social safeguards, a critical issue in REDD+ implementation [
8]. We especially looked into two main safeguards: effective participation and tenure security. Villagers expressed their expectations and concerns about being involved in MRV for carbon and non-carbon data. We also looked into local people’s relations with government authorities, and how land rights and land tenure were locally managed. If PMRV is proven feasible under specific conditions and situations, we will integrate information on tenure and the effectiveness of local people’s participation into the PMRV tool.
5. Conclusions: Realizing PMRV
We have presented a framework to study the feasibility of PMRV in different contexts in Indonesia, not to directly develop PMRV. The implementation of this framework is to be considered in further research. If considered an effective, efficient and viable solution for MRV, for addressing issues of co-benefit sharing and social safeguards, and local interest and willingness to participate is secured, PMRV will still need to be developed as a tool and adopted by the REDD+ institutions. Such a tool should be linked to the national and subnational levels especially regarding information sharing. To be operational, it needs to be embedded in the national MRV, not only to follow IPCC guidelines, but also to take into account each specific local situation. Before reaching that stage, the scientific community must agree first on the relevance of involving local communities in MRV, to what extent local people should be engaged, and to identify the steps and conditions for PMRV to be feasible.
We tested our approach in seven pilot sites in Indonesia; however, in order to get a better sample of different situations for comparison, more sites need to be added, not only in Indonesia but also in other countries where REDD+ is recognized as an important issue. In selecting these new sites, different contexts must be taken into account, including areas where REDD+ demonstration activities are being implemented, and in different landscapes.
Once the feasibility of PMRV is clarified, key stakeholders and decision-makers need to be involved in the discussion. This would include national REDD+ agencies, scientific community, donors, and civil society. Their role would be to develop a solid system based on clear understanding of each local situation, challenges, and stakeholders’ expectations.
Beyond the topic of MRV and the more general research on climate change, working on local participation is of interest to researchers studying, for example, community based conservation and development, how to engage local farmers in agricultural innovation, or participatory monitoring of natural resources. However, we do need to understand what local communities lose and gain from being involved in activities away and beyond their daily activities in order to avoid taking their participation for granted.


