Abstract
Global climate change represents one of the most extensive and pervasive threats to wildlife populations. Amphibians, specifically salamanders, are particularly susceptible to the effects of changing climates due to their restrictive physiological requirements and low vagility; however, little is known about which landscapes and species are vulnerable to climate change. Our study objectives included, (1) evaluating species-specific predictions (based on 2050 climate projections) and vulnerabilities to climate change and (2) using collective species responses to identify areas of climate refugia for conservation priority salamanders in the northeastern United States. All evaluated salamander species were projected to lose a portion of their climatic niche. Averaged projected losses ranged from 3%–100% for individual species, with the Cow Knob Salamander (Plethodon punctatus), Cheat Mountain Salamander (Plethodon nettingi), Shenandoah Mountain Salamander (Plethodon virginia), Mabee’s Salamander (Ambystoma mabeei), and Streamside Salamander (Ambystoma barbouri) predicted to lose at least 97% of their landscape-scale climatic niche. The Western Allegheny Plateau was predicted to lose the greatest salamander climate refugia richness (i.e., number of species with a climatically-suitable niche in a landscape patch), whereas the Central Appalachians provided refugia for the greatest number of species during current and projected climate scenarios. Our results can be used to identify species and landscapes that are likely to be further affected by climate change and potentially resilient habitats that will provide consistent climatic conditions in the face of environmental change.
1. Introduction
Forest ecosystem dynamics can be shaped by a number of complex interactions occurring between the leaf litter and soil, some of which are mediated by forest floor biota [1,2]. Because of their exceptionally abundant biomass, amphibians are known to greatly influence nutrient cycling [3,4,5] and leaf-litter food webs [2]. Furthermore, salamanders are important for structuring invertebrate communities in primary stream [5,6] and forested [7,8] environments, sequestering forest carbon stocks [8], and providing a significant and nutritious prey source for other predators [3].
Prompt conservation of amphibians and the ecosystem services they provide is suggested given the rapid declines of many amphibian species. During a seminal World Congress of Herpetology in 1989, researchers provided multiple accounts of amphibians declining globally; amphibians are now considered the most threatened class of vertebrates worldwide, with approximately one third of all species imperiled [9]. Habitat disturbances (e.g., fragmentation, urbanization, and intensive forestry), invasive species, aquatic pollution, emerging pathogens, and global climate change are primary factors in these declines [10,11]. Each of these stressors plays a unique role in amphibian declines and can operate synergistically in their influence on amphibian populations [12]. With respect to other ongoing threats, especially habitat destruction and emerging pathogens, climate change is likely a lesser threat for amphibians over the short-term; however, it represents one of the greatest threats for persistence of vulnerable amphibian populations over the long-term [13]. Salamanders, in particular, possess a variety of adaptations (e.g., cutaneous respiration, low vagility) that make them sensitive to environmental modifications, such as stream alteration and urbanization [14,15], forest management [16,17], and emerging pathogens [18,19]. These same characteristics and sensitivities also make forest salamanders useful biological indicators [20] of global climate change effects.
Overwhelming evidence exists for climate-induced phenological and spatial shifts in species’ geographic ranges throughout many ecosystems worldwide [21,22]. For example, >50 bird species in California recently have shifted geographic ranges to match the climatic niche (i.e., the collective climatic patterns that regulate an organism’s distribution) of their ranges originally observed in the early 20th century [23]. Birds, along with other mobile wildlife species (e.g., large mammals) have a distinct advantage over smaller vertebrates in their ability to move large distances over short time scales. In contrast, amphibians have low vagility and in the case of some salamander species [24], have low reproductive rates and close associations with isolated habitat patches. The inability to rapidly adapt or migrate in the face of environmental change emphasizes the importance of resilient landscapes, which are those that retain function, structure, and feedbacks in response to perturbation [25] for long-term conservation of amphibians and other vulnerable forest taxa.
Not all landscapes equally experience the effects of climate change. A variety of factors, including topographic complexity, aspect, and slope can have a large influence on the climatic patterns experienced at a given locale [26,27]. Collectively, landscapes that provide relatively consistent local temperature and moisture conditions in the face of climate change offer the greatest potential as habitat refugia for vulnerable species. The northeastern United States (U.S.) has experienced a variety of landuse changes over the past three centuries, including urbanization, forest clearing followed by subsequent reforestation, and habitat fragmentation [28]. In addition, the southern terminus of this region is projected to experience relatively large temperature and precipitation increases owing to climate change throughout the next century [29,30]. The synergistic effects of on-going habitat disturbance and climate change emphasize the importance of identifying climate refugia and understanding species-specific vulnerabilities for long-term conservation of amphibian populations.
Previous studies have evaluated potential effects of climate change on a subset of priority amphibian species (including salamanders) in the southeastern U.S. [31,32]; however, we are unaware of studies that have modeled the vulnerability of salamanders in the northeastern U.S. to climate change. Given the importance of salamanders to forest ecosystems [2,4,5,6] and relatively high salamander richness and abundance in much of the northeastern region, our primary objective was to evaluate the vulnerability of conservation priority salamander species (23 total species) to climate change based on changes in the climatic niche. We modeled the climatic niche for each species and projected these distributions onto current-day climatic data (1950–2000 interpolated average) and 2050 projected climatic data to estimate changes in the climate niche over the next 40 years. We defined climatic refugia based on the “macrorefugia” concept [33] owing to the large geographic scale and number of species examined in the study. Overall, our work provides a methodology to (a) rank relative sensitivity of conservation priority species and (b) identify areas that provide potential climate refugia for salamanders and other vulnerable forest taxa.
2. Experimental Section
2.1. Priority Species Selection
We modeled the bioclimatic niche of conservation priority salamander species in the northeastern U.S. due to their potential sensitivity to climate change. Our objective was to identify potential climate refugia for conservation that would protect these priority species, thereby also protecting populations of species with lower conservation concern status. The geographic focus of our study centered on states that are part of the North Atlantic Landscape Conservation Cooperative (NALCC; Figure 1). The LCCs (www.lccnetwork.org) seek to complement conservation efforts among states, particularly those pertaining to large-scale stressors such as climate change. Although West Virginia is not part of the NALCC, we included priority species from this state in our analysis because it borders the NALCC, is part of the Northeast Partners in Amphibian and Reptile Conservation (NEPARC) network, and possesses relatively rich salamander species diversity.
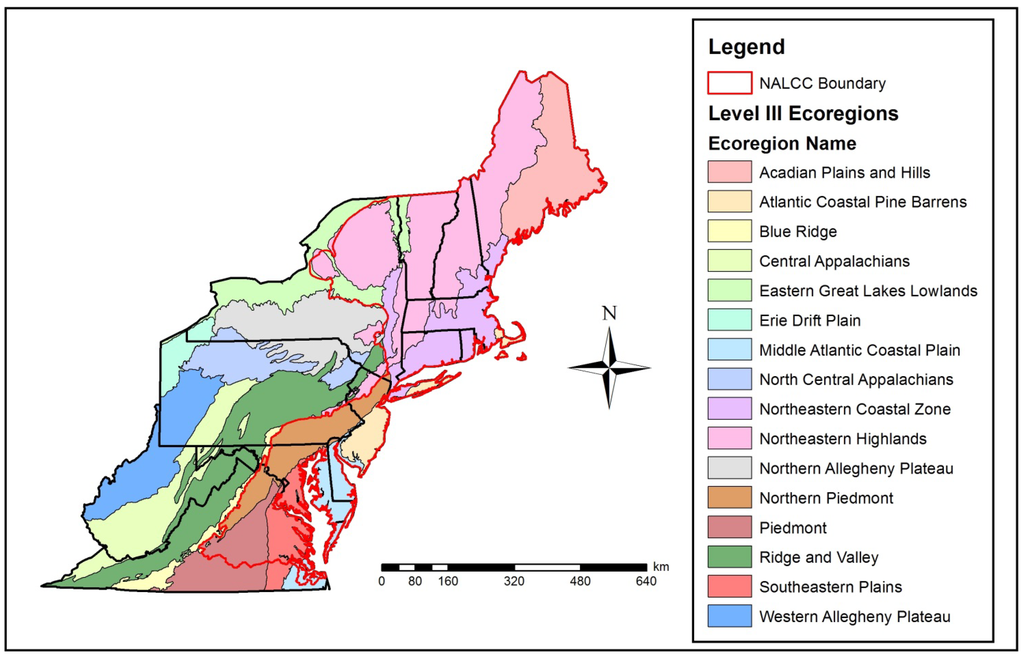
Figure 1.
Study site extent in the northeastern U.S. depicting EPA Level III ecoregions and the North Atlantic Landscape Conservation Cooperative (NALCC) Boundary (area within red boundary). This figure should be used to reference Table 1 and Table 2.
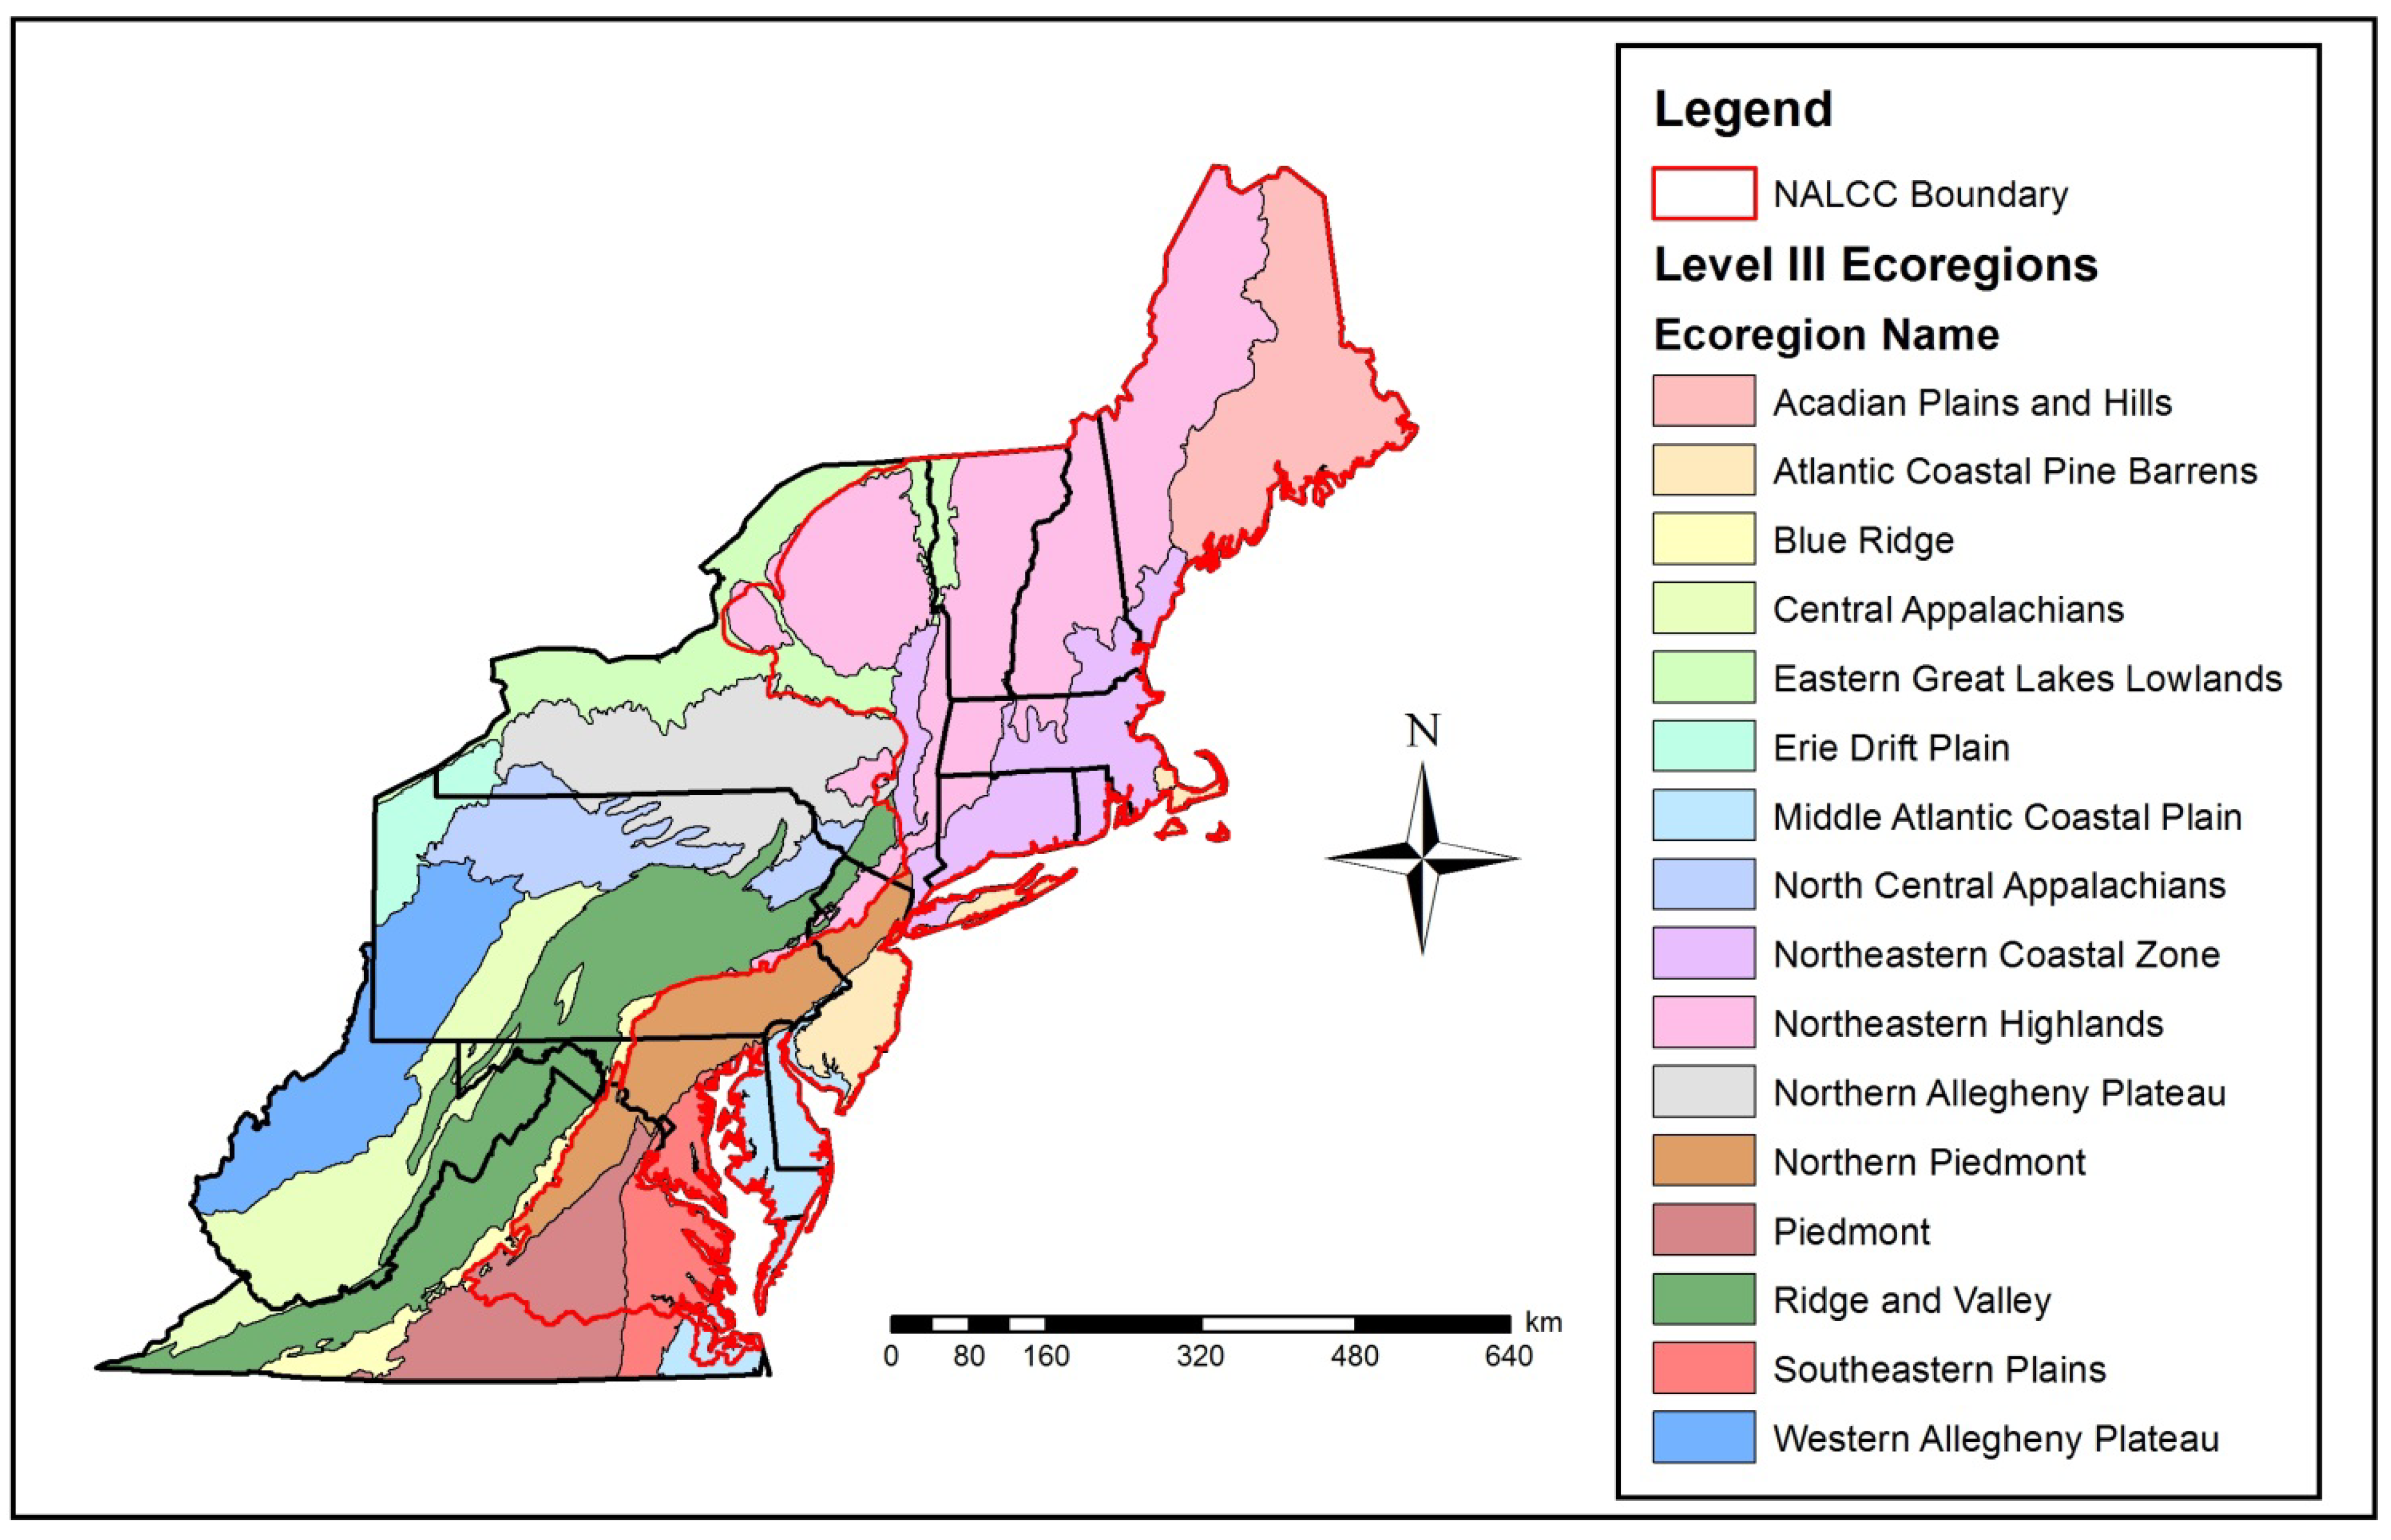

Table 1.
Mean climate refugia richness (i.e., number of salamander species with a climatically-suitable niche in a landscape patch) within U.S. EPA Level III Ecoregions in the northeastern U.S. (Figure 1) based on current and 2050 projected climatic conditions. Mean refugia richness was calculated for both current and projected scenarios among two Global Climate Models (CCSM4 (CCSM) and HadGEM2-CC (Hadley)) and two Representative Concentration Pathways (RCP 4.5 and 8.5).
| Level III Ecoregion | Current Average (± SE) | RCP 4.5 Average (± SE) | RCP 8.5 Average (± SE) |
|---|---|---|---|
| Acadian Plains and Hills | 3.01 ± 0.62 | 2.68 ± 0.47 | 2.15 ± 0.47 |
| Atlantic Coastal Pine Barrens | 3.48 ± 1.98 | 3.85 ± 0.93 | 3.20 ± 0.73 |
| Blue Ridge | 8.50 ± 2.37 | 7.72 ± 1.10 | 5.96 ± 1.22 |
| Central Appalachians | 11.00 ± 1.79 | 9.07 ± 1.14 | 6.94 ± 1.45 |
| Eastern Great Lakes Lowlands | 5.23 ± 1.02 | 4.06 ± 0.83 | 3.74 ± 0.79 |
| Erie Drift Plain | 8.92 ± 1.59 | 6.40 ± 1.41 | 5.94 ± 1.33 |
| Middle Atlantic Coastal Plain | 3.28 ± 1.35 | 2.87 ± 0.52 | 2.26 ± 0.47 |
| North Central Appalachians | 8.86 ± 1.41 | 7.04 ± 1.39 | 6.23 ± 1.36 |
| Northeastern Coastal Zone | 3.39 ± 1.40 | 3.37 ± 0.78 | 2.81 ± 0.55 |
| Northeastern Highlands | 4.50 ± 0.60 | 3.66 ± 0.64 | 3.37 ± 0.65 |
| Northern Allegheny Plateau | 7.79 ± 1.23 | 6.36 ± 1.19 | 5.90 ± 1.20 |
| Northern Piedmont | 6.70 ± 1.96 | 5.37 ± 0.96 | 4.16 ± 0.90 |
| Piedmont | 4.82 ± 1.93 | 4.42 ± 0.52 | 3.15 ± 0.57 |
| Ridge and Valley | 9.50 ± 2.08 | 7.34 ± 1.27 | 5.67 ± 1.35 |
| Southeastern Plains | 3.73 ± 1.33 | 3.23 ± 0.39 | 2.28 ± 0.56 |
| Western Allegheny Plateau | 10.59 ± 1.99 | 7.17 ± 1.24 | 5.15 ± 1.26 |

Table 2.
Mean change in climate refugia richness (i.e., number of salamander species with a climatically-suitable niche in a landscape patch) within U.S. EPA Level III ecoregion of the northeastern U.S. (Figure 1) based on 2050 projected climatic scenarios (CCSM4 (CCSM) and HadGEM2-CC (Hadley)) and two Representative Concentration Pathways (RCP 4.5 and 8.5). Negative numbers indicate a decrease in the average number of priority salamander species for which an ecoregion provides suitable climatic conditions.
| Level III Ecoregion | CCSM RCP 4.5 | Hadley RCP 4.5 | CCSM RCP 8.5 | Hadley RCP 8.5 | Average Change (± SE) |
|---|---|---|---|---|---|
| Acadian Plains and Hills | –0.15 | –0.52 | –0.72 | –1.00 | –0.60 ± 0.18 |
| Atlantic Coastal Pine Barrens | +0.06 | +0.67 | –0.23 | –0.33 | +0.04 ± 0.23 |
| Blue Ridge | –0.97 | –0.61 | –2.14 | –2.95 | –1.67 ± 0.54 |
| Central Appalachians | –1.25 | –2.59 | –3.25 | –4.86 | –2.99 ± 0.75 |
| Eastern Great Lakes Lowlands | –0.86 | –1.47 | –1.25 | –1.71 | –1.32 ± 0.18 |
| Erie Drift Plain | –1.85 | –3.19 | –2.43 | –3.53 | –2.75 ± 0.38 |
| Middle Atlantic Coastal Plain | –0.52 | –0.30 | –0.65 | –1.39 | –0.71 ± 0.24 |
| North Central Appalachians | –0.97 | –2.67 | –1.71 | –3.54 | –2.22 ± 0.56 |
| Northeastern Coastal Zone | +0.07 | –0.09 | –0.39 | –0.77 | –0.29 ± 0.18 |
| Northeastern Highlands | –0.44 | –1.25 | –0.94 | –1.32 | –0.99 ± 0.20 |
| Northern Allegheny Plateau | –0.66 | –2.20 | –1.44 | –2.33 | –1.66 ± 0.39 |
| Northern Piedmont | –1.48 | –1.18 | –2.16 | –2.92 | –1.94 ± 0.39 |
| Piedmont | –0.23 | –0.55 | –0.64 | –2.68 | –1.03 ± 0.56 |
| Ridge and Valley | –1.81 | –2.51 | –3.26 | –4.41 | –3.00 ± 0.56 |
| Southeastern Plains | –0.12 | –0.89 | –0.30 | –2.60 | –0.98 ± 0.57 |
| Western Allegheny Plateau | –3.01 | –3.82 | –4.71 | –6.17 | –4.43 ± 0.68 |
We used multiple data sources to develop a catalog of conservation priority salamander species in the northeastern U.S. (Table 3). We considered a salamander species “priority” if it was included in the International Union for the Conservation of Nature (IUCN) Redlist (Near Threatened, Vulnerable, Endangered, or Critically Endangered), Natureserve Global Conservation Rank Listing (G1–G3 ranking), U.S. Endangered Species Act List (Federally Threatened or Endangered), and State-Level Threatened and Endangered Species Lists. We also used the NEPARC Priority Species List [34] to identify species of regional concern (i.e., species in which 50% of the geographic range occurs in NEPARC states) and/or species that occur on at least 50% of northeastern state Wildlife Action Plans. Several priority species were represented as species complexes (i.e., Jefferson’s Salamander (A. jeffersonianum)/Blue-spotted (Ambystoma laterale) complex and the Northern Slimy (Plethodon glutinosus)/Cumberland Plateau Slimy (P. kentucki)/White-spotted Slimy Salamander (P. cylindraceus) complex; Table 3) owing to ecological similarities and known difficulties with reliable identification on appearance alone in a field setting.
2.2. Climate Scenario Selection
Because we focused on the climatic niche, we limited our modeling efforts to variables representing temperature and precipitation patterns. We accounted for known variability in projected climate data by modeling the climatic niche with two future (based on 2050 projected data) global climate models (GCMs), the CCSM4 (CCSM) and the HadGEM2-CC (Hadley). Although there is no consensus on what makes an “accurate” GCM, it is highly recommended to consider outputs from multiple GCMs to increase accuracy of climate projections [35]. Our choice of both the CCSM and Hadley GCMs was based on hindcast accuracy of these GCMs in the northern hemisphere [33], along with the availability of the projected data at both the 4.5 and 8.5 representative concentration pathways (RCPs). The RCPs (RCP 2.6, 4.5, 6.0, and 8.5) represent a range of four greenhouse gas concentrations denoted by the amount of radiative forcing (i.e., difference of sunlight absorbed by the Earth and energy radiated back to space) projected into the future compared to pre-industrial values [36]. Each scenario represents a different greenhouse gas emission trajectory. For example, RCP 2.6 indicates future mitigation of greenhouse emissions (i.e., a scenario where greenhouse gas concentrations are projected to decrease over the long-term), whereas RCP 8.5 indicates a fully unmitigated greenhouse gas trajectory (i.e., a scenario where greenhouse gas concentrations are projected to increase drastically in the future). We included RCP 4.5 and RCP 8.5 trajectories to provide multiple perspectives of increased greenhouse emissions—one being a gradual increase in greenhouse emissions (RCP 4.5) and the other a rapid increase in greenhouse emissions (RCP 8.5).
We obtained current and projected climatic data from the Worldclim database (www.worldclim.org). Current (1950–2000) bioclimatic data [37] were available during the implementation of this study, but not for projected climate scenarios at the 4.5 and 8.5 RCPs. We used maximum temperature, minimum temperature, and precipitation data for both the Hadley and CCSM GCMs at both 4.5 and 8.5 RCPs to develop the same 19 bioclimatic variables as the current bioclimatic data via the biovars procedure in Program R with the Dismo, Raster, and Rgdal packages. We removed eight highly correlated (>0.75) variables [31,32,38] and retained a final set of 11 bioclimatic variables (Table 4) to model the climatic niche for each species based on current and projected climatic data.

Table 3.
Conservation rankings for priority salamander species in the North Atlantic Landscape Conservation Cooperative and the Northeastern Partners in Amphibian and Reptile Conservation (NEPARC) regional networks. Abbreviations are as follows: IUCN (International Union for the Conservation of Nature), T (Threatened), E (Endangered), NT (Near Threatened), VU (Vulnerable), CE (Critically Endangered), and G1–G3 (Natureserve Global Conservation Ranks). The number in parentheses under the “State” ranking refers to the number of states in the northeastern U.S. that a given species is Threatened or Endangered. A ranking of “Y” in the last two columns denotes whether a species is a NEPARC regional responsibility species and is listed in ≥50% of northeastern state Wildlife Action Plans.
| Scientific Name | Common Name | Federally (T or E) | NatureServe (G1–G3) | IUCN Red List (NT, VU, E, or CE) | State T or E (# States) | NEPARC (Regional Responsibility Species) | ≥50% of States Listed in Species Wildlife Action Plan |
|---|---|---|---|---|---|---|---|
| Ambystoma barbouri | Streamside Salamander | --- | --- | NT | --- | --- | --- |
| Ambystoma jeffersonianum/ Ambystoma laterale | Jefferson’s Salamander/Blue-spotted Salamander | ---/--- | ---/--- | ---/--- | ---/Y(3) | Y/--- | Y/Y |
| Ambystoma opacum | Marbled Salamander | --- | --- | --- | Y(2) | --- | Y |
| Ambystoma mabeei | Mabee’s Salamander | --- | --- | --- | Y(1) | --- | --- |
| Ambystoma tigrinum | Eastern Tiger Salamander | --- | --- | --- | Y(5) | --- | Y |
| Aeneides aeneus | Green Salamander | --- | G3 | NT | Y(2) | --- | Y |
| Cryptobranchus alleganiensis | Hellbender | --- | G3 | NT | Y(1) | --- | Y |
| Desmognathus fuscus | Northern Dusky Salamander | --- | --- | --- | --- | Y | --- |
| Desmognathus monticola | Seal Salamander | --- | --- | --- | --- | Y | --- |
| Desmognathus ochrophaeus | Allegheny Mountain Dusky Salamander | --- | --- | --- | --- | Y | --- |
| Desmognathus organi | Northern Pygmy Salamander | --- | G3 | --- | --- | Y | --- |
| Eurycea bislineata | Northern Two-lined Salamander | --- | --- | --- | --- | Y | --- |
| Eurycea longicauda | Long-tailed Salamander | --- | --- | --- | Y(1) | Y | Y |
| Gyrinophilus porphyriticus | Spring Salamander | --- | --- | --- | Y(1) | Y | --- |
| Gyrinophilus subterraneus | West Virginia Spring Salamander | --- | G1 | E | --- | Y | --- |
| Necturus maculosus | Common Mudpuppy | --- | --- | --- | --- | --- | Y |
| Plethodonglutinosus/ Plethodon kentucki/ Plethodon cylindraceus | Northern Slimy Salamander/Cumberland Plateau Slimy Salamander/White-spotted Slimy Salamander | ---/---/--- | ---/---/--- | ---/---/--- | Y(1)/---/--- | Y/Y/Y | ---/---/--- |
| Plethodon hoffmani | Valley and Ridge Salamander | --- | --- | --- | --- | Y | --- |
| Plethodon hubrichti | Peaks of Otter Salamander | --- | G2 | VU | --- | Y | --- |
| Plethodon nettingi | Cheat Mountain Salamander | T | G2 | NT | Y(1) | Y | --- |
| Plethodon punctatus | Cow Knob Salamander | --- | G3 | NT | --- | Y | --- |
| Plethodon shenandoah | Shenandoah Salamander | E | G1 | VU | Y(1) | Y | --- |
| Plethodon sherando | Big Levels Salamander | --- | G2 | VU | --- | Y | --- |
| Plethodon virginia | Shenandoah Mountain Salamander | --- | G2 | NT | --- | Y | --- |
| Plethodon wehrlei | Wehrle’s Salamander | --- | --- | --- | --- | Y | --- |
| Plethodon welleri | Weller’s Salamander | --- | G3 | E | --- | --- | --- |
| Pseudotriton montanus | Mud Salamander | --- | --- | --- | Y(3) | --- | Y |
| Pseudotriton ruber | Red Salamander | --- | --- | --- | --- | Y | Y |

Table 4.
Bioclimatic variables used to model the climatic niche for priority salamanders based on current and 2050 projected climate scenarios (CCSM4 (CCSM) and HadGEMCC-2 (Hadley)) in the northeastern U.S.
| Bioclimatic Variable | Bioclimatic Variable Description |
|---|---|
| BIO1 | Annual Mean Temperature |
| BIO2 | Mean Diurnal Range (Mean of monthly (max temp–min temp)) |
| BIO3 | Isothermality (Mean Diurnal Range/Minimum Temp Range) X 100 |
| BIO7 | Temperature Annual Range (Max Temperature of Warmest Month–Max Temperature of Coldest Month) |
| BIO8 | Mean temperature of Wettest Quarter |
| BIO9 | Mean temperature of Driest Quarter |
| BIO15 | Precipitation seasonality (Coefficient of Variation) |
| BIO16 | Precipitation of Wettest Quarter |
| BIO17 | Precipitation of Driest Quarter |
| BIO18 | Precipitation of Warmest Quarter |
| BIO19 | Precipitation of Coldest Quarter |
2.3. Data Preparation and Climate Modeling
We compiled locality data throughout the known geographic range of all priority salamander species using multiple sources including HerpNet (www.herpnet.org), the Biodiversity Information Serving our Nation (BISON) database (www.bison.usgs.ornl.gov), and state natural heritage databases for Maine, New Hampshire, Vermont, New Jersey, New York, Massachusetts, Connecticut, Maryland, West Virginia, and Virginia. We acquired additional locality data for the following species from the corresponding southeastern states in which we lacked adequate locality data: Hellbender (Cryptobranchus alleganiensis) in Tennessee, North Carolina, and Georgia; Mabee’s Salamander (Ambystoma mabeei) in North Carolina; and Weller’s Salamander (Plethodon welleri) in North Carolina and Tennessee. To increase accuracy of modeling outputs, we used locality data that included at least four decimal places in at least one of the latitude/longitude coordinate fields [39]. Our accuracy requirement of four decimal places was chosen based on the 1 km2 spatial extent of the bioclimatic data used to model the current and future climate niche of priority salamander species during this study. We used the Maximum Entropy Algorithm (MaxEnt; [40]) to model the current and projected climate niche for priority salamander species. We chose MaxEnt over other correlative, presence-only distribution models owing to the growing body of literature illustrating the utility and accuracy of this method as a species distribution modeling technique (e.g., [41]). The inability to assign a probability to apparent “absences” is one of the primary criticisms of presence-only modeling techniques. We acknowledge this criticism and agree that approaches using repeated samples to acquire a sampling history through species detections and non-detections (e.g., [42]) are likely superior to presence-only modeling techniques. However, as repeated sample detection data are rarely available across large geographic scales for most species, presence-only techniques provide an alternative approach for modeling species distributions [31,32].
An additional criticism of presence-only models is the inability to assign confidence levels to the historical data used to model species distributions. Often in presence-only modeling efforts, locality data are acquired from multiple sources, making it difficult to differentiate between sites with large populations and sites that have been surveyed at relatively greater intensity, such as research stations and national parks. We reduced the potential effects associated with oversampling bias by filtering records with a 5 km buffer. The choice of the 5 km buffer was somewhat arbitrary; however, this distance was supported by the generally low vagility of salamanders and therefore represents a biological relevant estimate [43]. We allocated background data samples using a targeted background approach (e.g., [44]) to reduce potential errors associated with randomly distributed background samples. A targeted background approach is particularly useful when the sampling history of the presence data is unknown or likely to be regionally biased [44]. The regional bias was particularly true in our study due to the abundance of species locality data from the northeastern U.S. Therefore, we used all available northeastern U.S. records of conservation priority amphibians and reptiles as a target background to simulate biases associated with acquisition of species locality data (e.g., sampling near roads and well-known diversity hot-spots). We included records from all priority amphibian and reptiles species rather than just salamanders to assure we maximized the available number of background samples. We removed duplicate and spatially clustered points in the background layer with a 100 m filter, which ensured that we allocated as many background points as possible to model the climate niche for each species.
We buffered all species ranges (www.naturserve.org) by 50 km to account for the potential lack of sampling and subsequent non-detection of records near the edge of published species ranges. We included all occurrences for a given species if they fell in this buffered range and removed outlier points that fell outside of the ranges. We also used these buffered species ranges to clip the filtered background points layer to standardize the geographic inference of both the presence and background layers [45]. We extracted climatic data from each of the 11 bioclimatic layers for both the presence and background layer points and used these data to determine climatic distributions under current and projected (i.e., CCSM 4.5, CCSM 8.5, Hadley 4.5, and Hadley 8.5) climate scenarios for each priority species.
We used the species-with-data format with a replicated runs approach (10 total replicates per scenario) to obtain a mean estimate of the climatic niche for each species. We projected the resulting climatic niche onto five climatic distributions including the current, CCSM-RCP 4.5, CCSM-RCP 8.5, Hadley-RCP 4.5, and Hadley-RCP 8.5 climate projections to obtain geographic niche predictions for each species. We used three thresholding approaches, including the minimum training presence ((mtp); threshold with all training points correctly predicted), the fixed 10 cumulative ([f10]; threshold resulting in 10% omission of training data), and the minimum training sensitivity plus specificity threshold (mtr) to produce a range of liberal to conservative binary data layers that predict suitable and unsuitable climate distributions for the current and each of the projected climate distributions [31,32]. The thresholding process resulted in 15 total binary distributions (3 current and 12 projected distributions) for each salamander species.
2.4. Analysis of Species/Climate Distributions
We evaluated model fit with Area Under the Curve (AUC) estimates obtained from a test via cross-validation of sub-sampled replicates (10 total). We considered a model informative if the mean AUC score was >0.70 [46]. Although the limitations of AUC values as a proxy for model support have been discussed extensively in the published literature [45,47], we used these values as a basic indicator of model performance and a general ability to characterize the climatic niche. In addition, we avoided significant errors associated with this metric by restricting our modeled area to the known range of the focal species in question [32,45]. We evaluated the relative contribution of individual bioclimatic variables to the climate niche using the permutation importance test in MaxEnt. We evaluated average variable contribution among salamander families (Ambystomatidae, Plethodontidae, and all taxa) and breeding categories (pond breeder, stream breeder, terrestrial breeder, and all taxa).
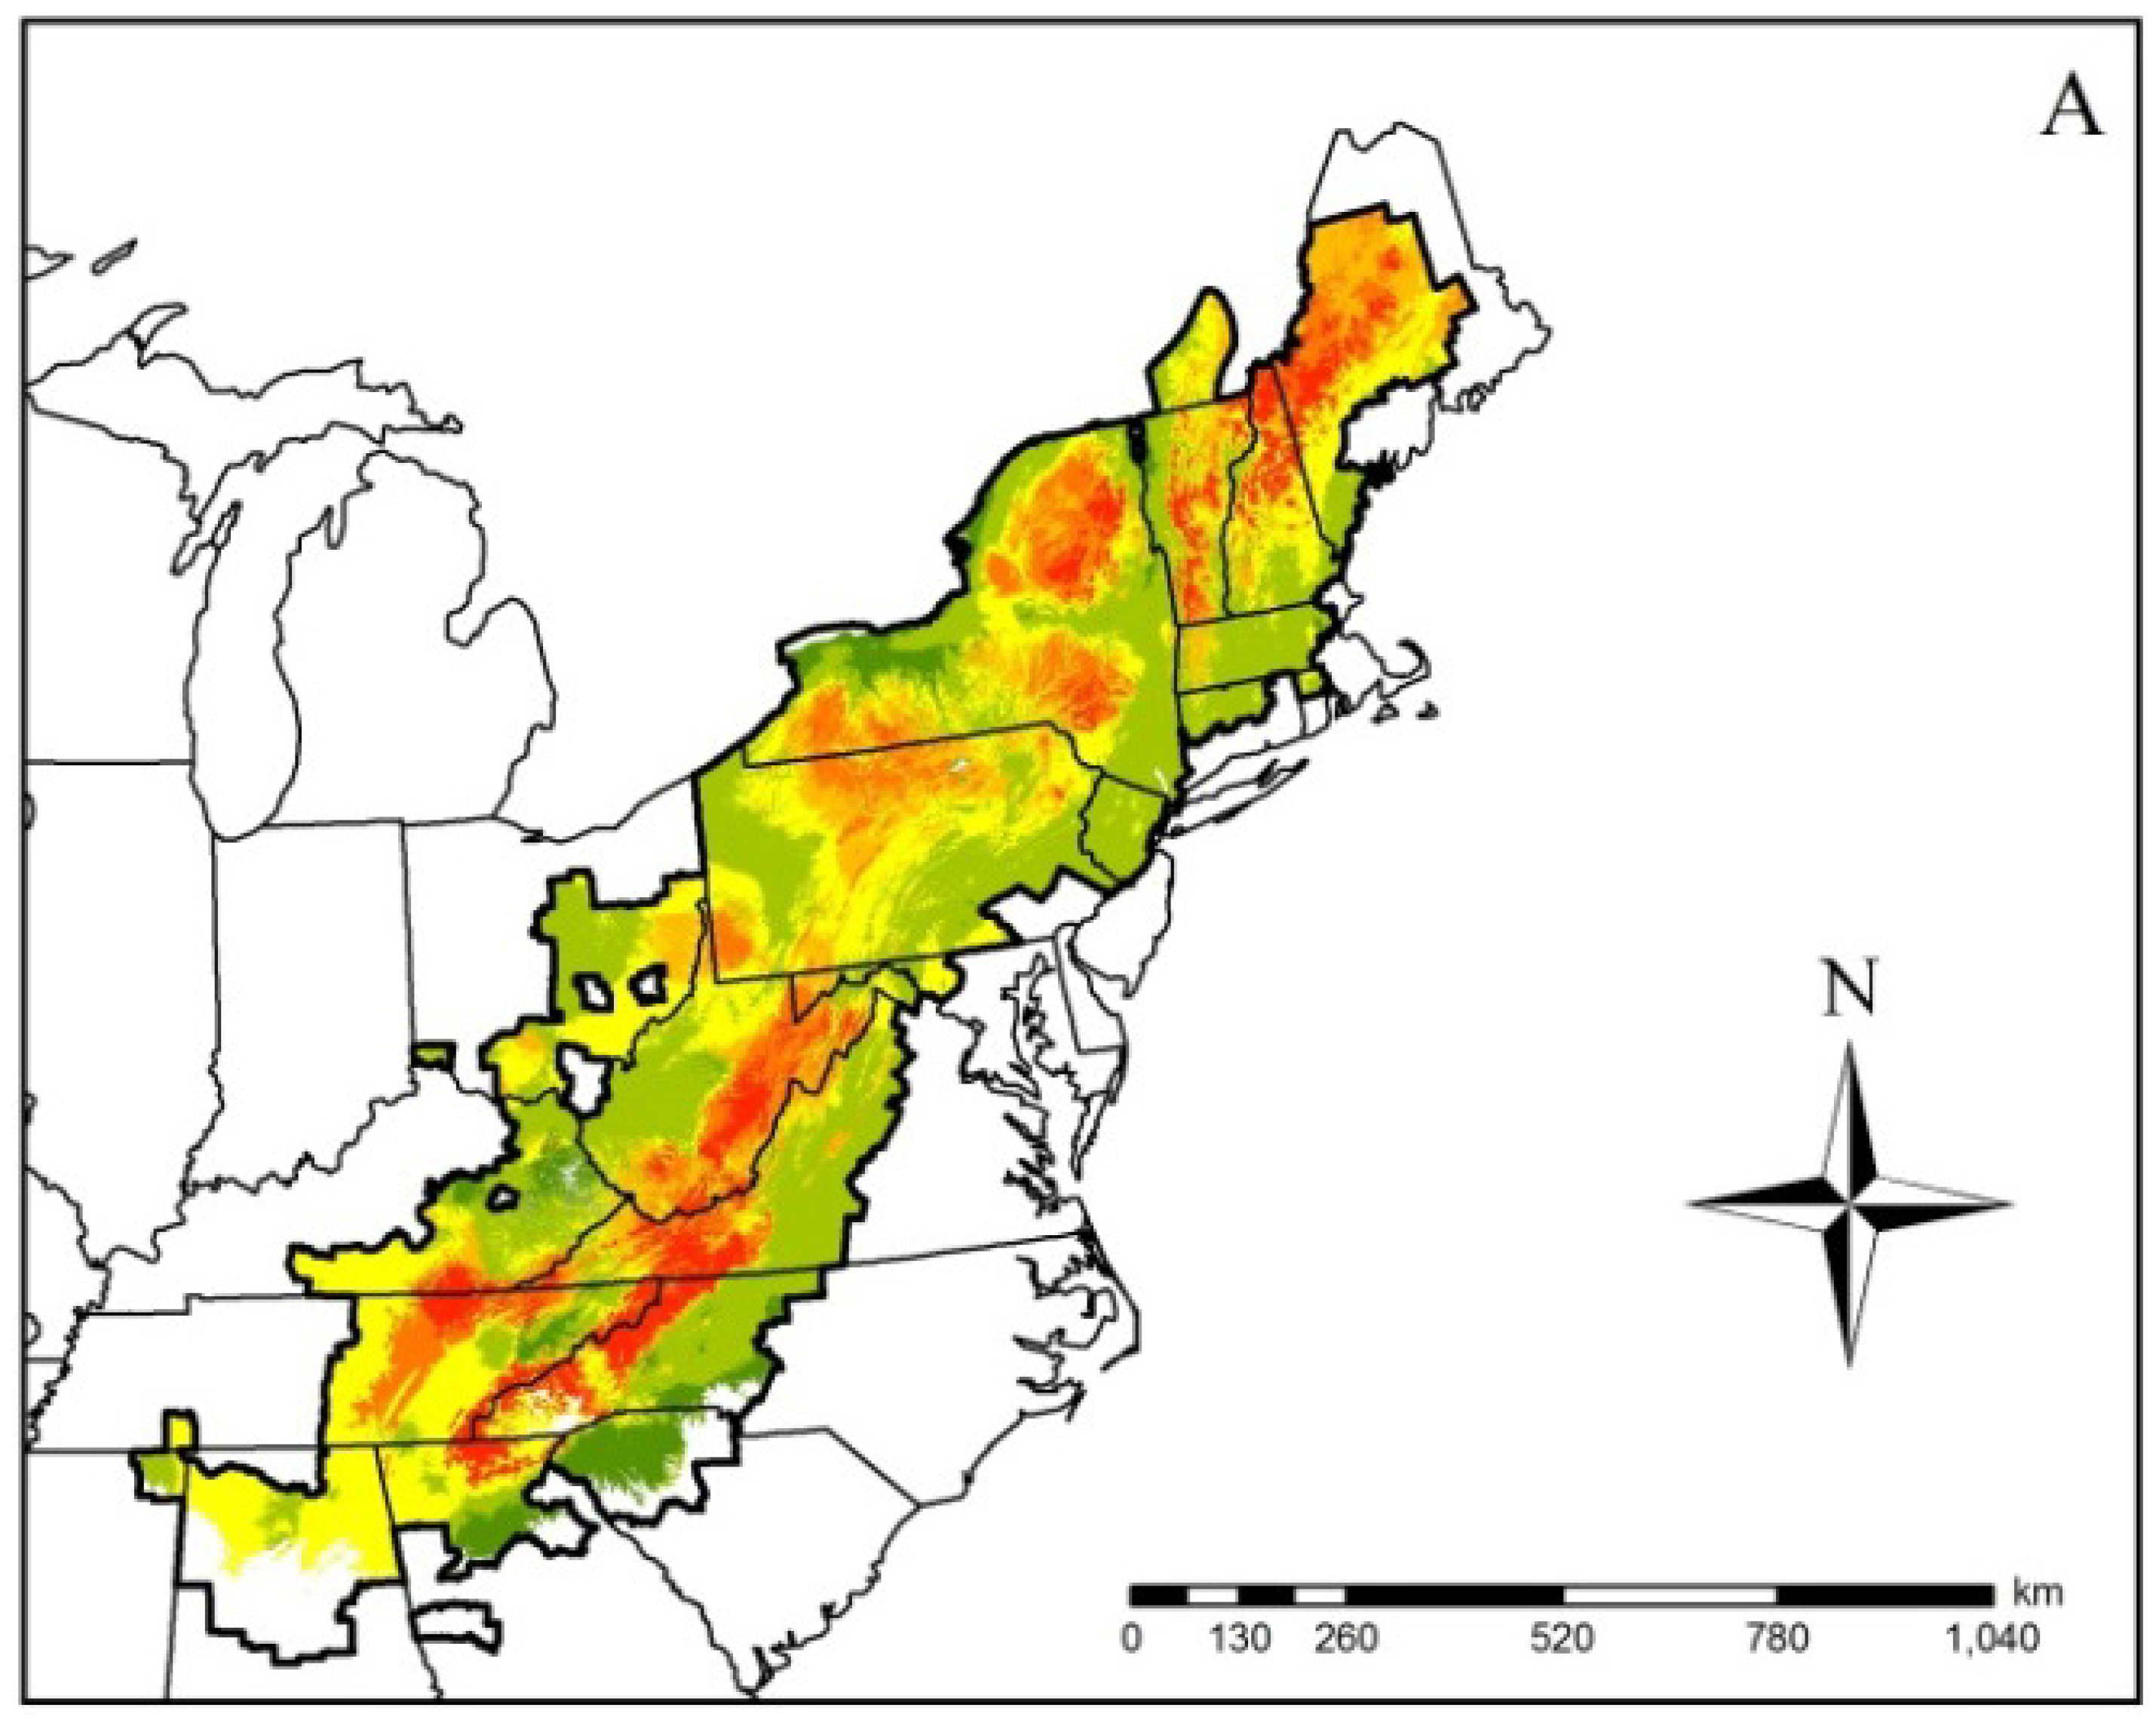
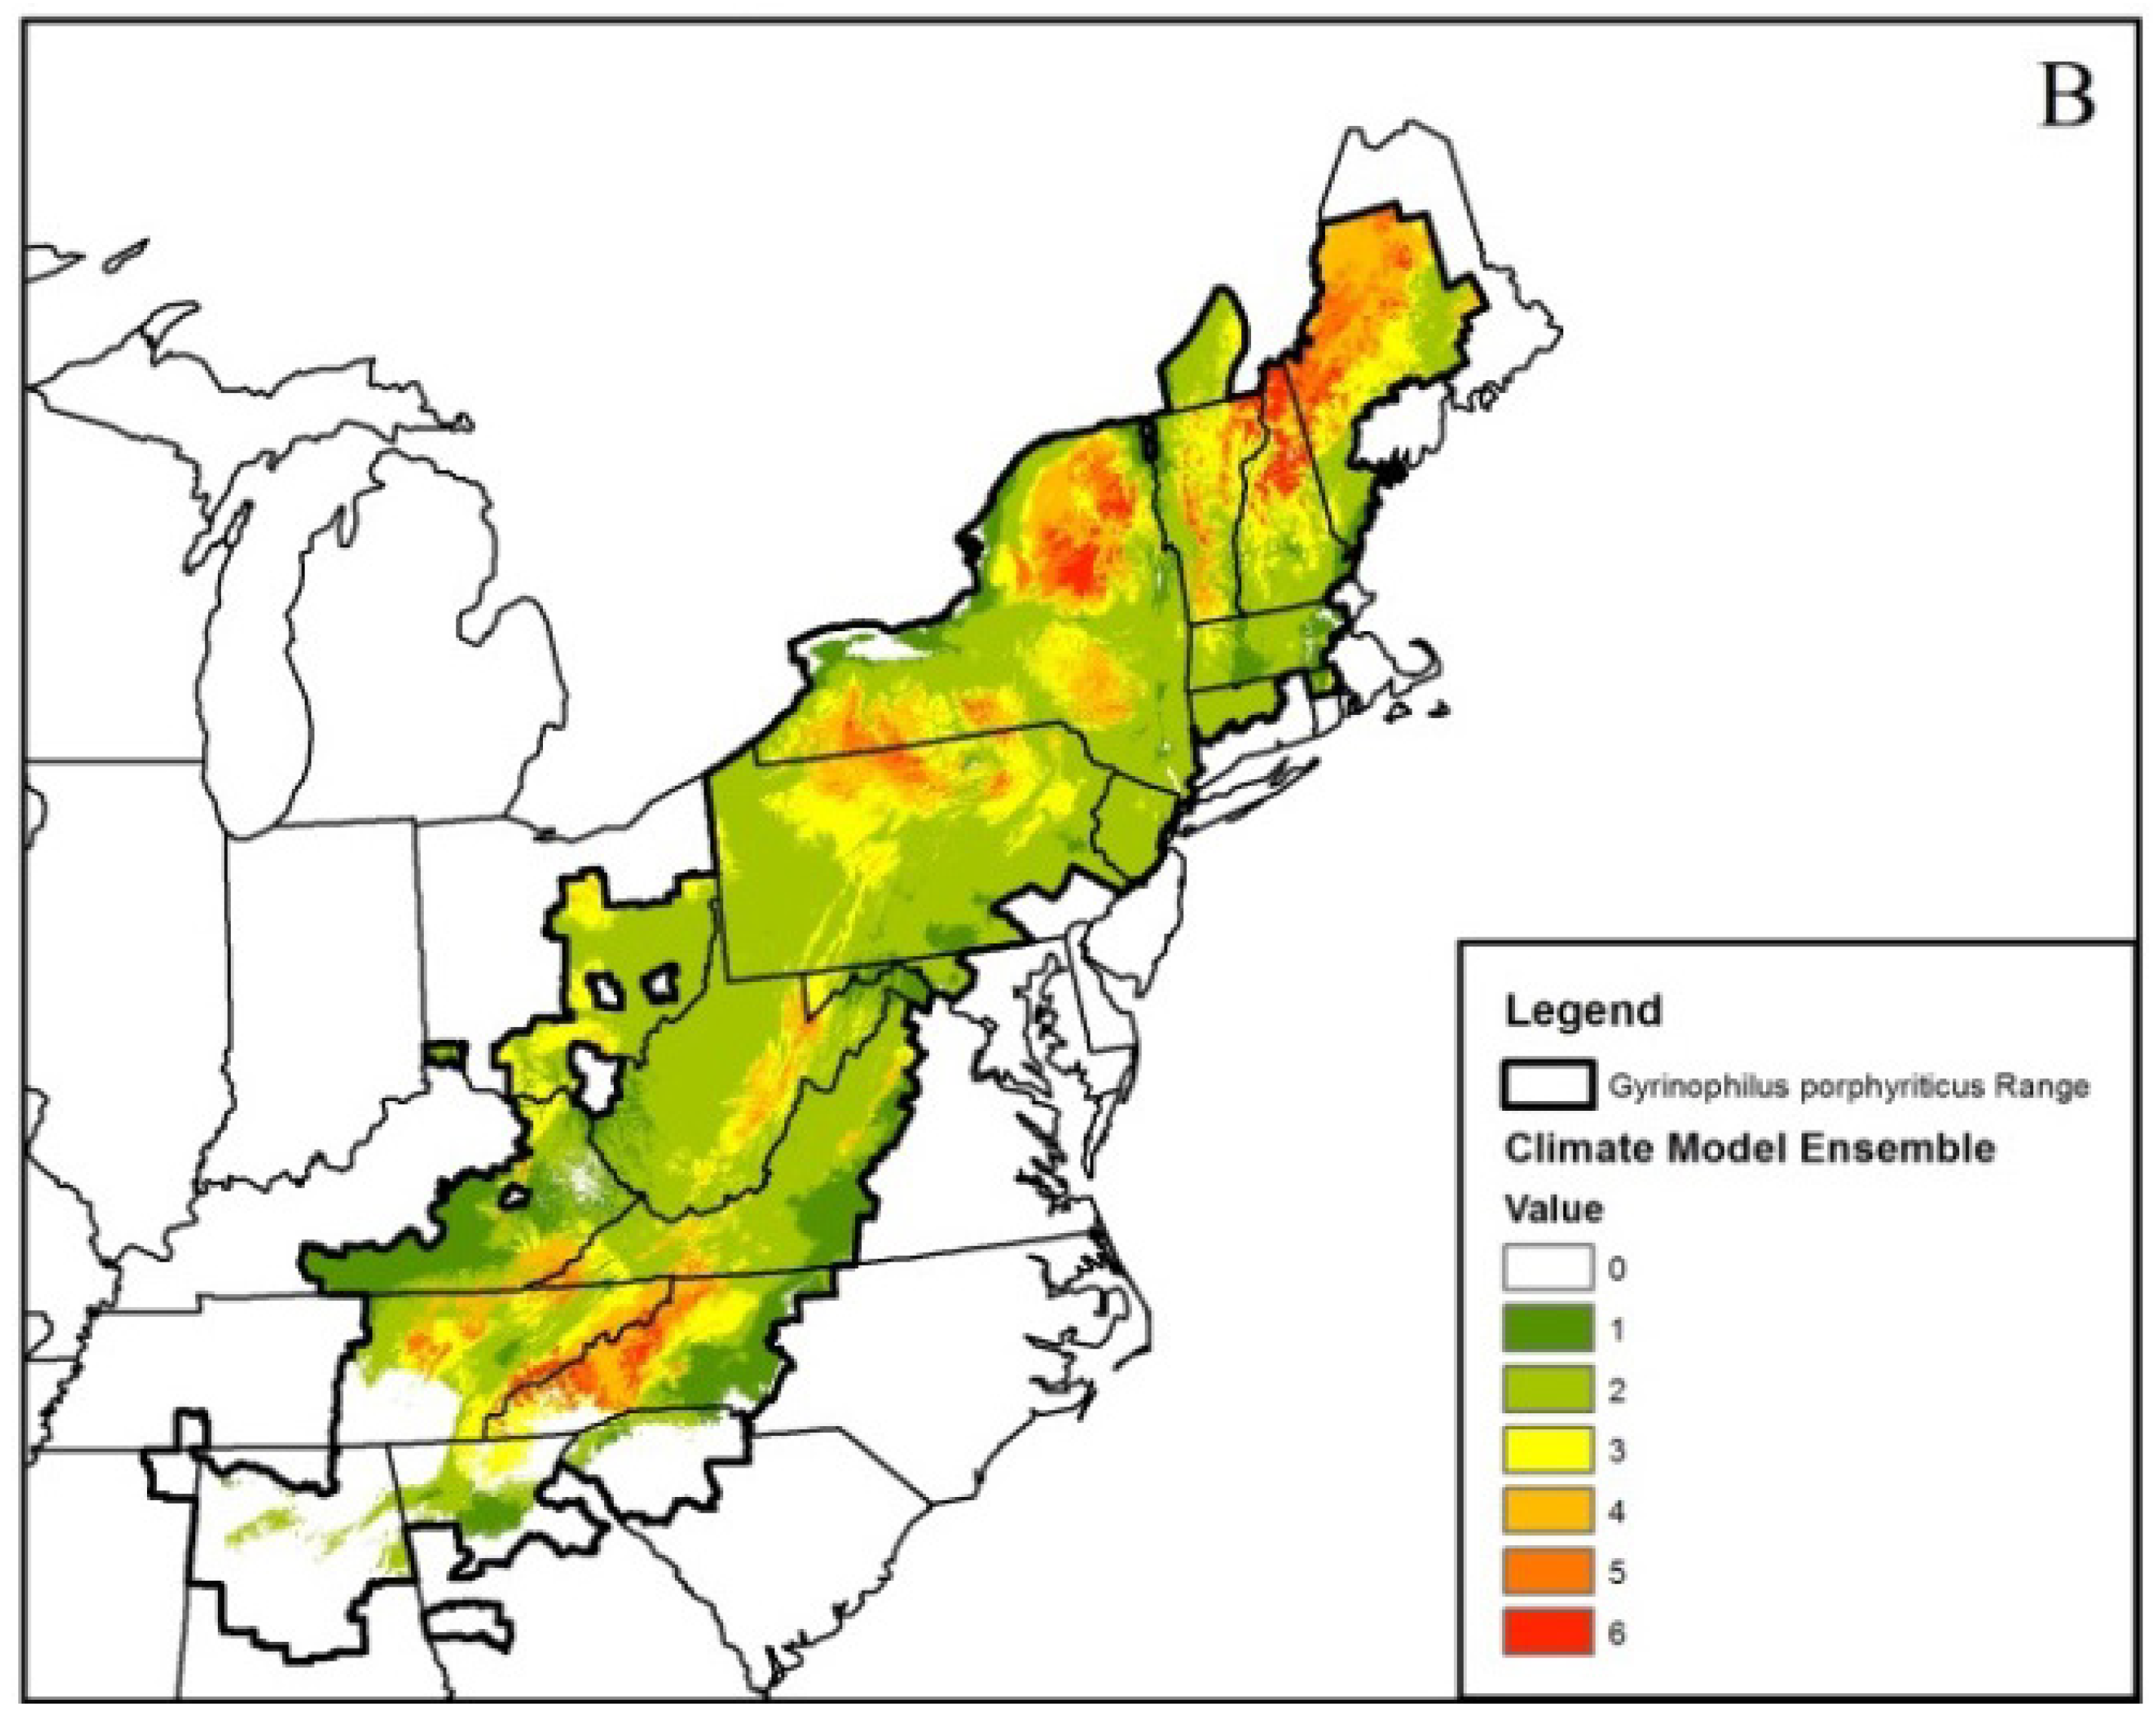
We summed the resulting binary climate outputs to produce a climatic ensemble (e.g., [48]) for each species at both the 4.5 and 8.5 RCP climate trajectories. This process resulted in each species receiving a score 0–6, which indicated a range of suitability from no climatic suitability (0) to high climatic suitability (6) across both GCMs (i.e., Hadley and CCSM; Figure 2). We determined proportional changes in climate refugia for each priority species by subtracting raster cells in the current distribution threshold layers from each of the projected, thresholded raster cells for each GCM/RCP combination. We divided this difference by the total number of suitable rasters in the current distribution threshold layer to derive a proportional loss/gain value (i.e., proportional climate niche change). We averaged these loss/gain values within a given GCM/RCP combination and overall (Table 5).
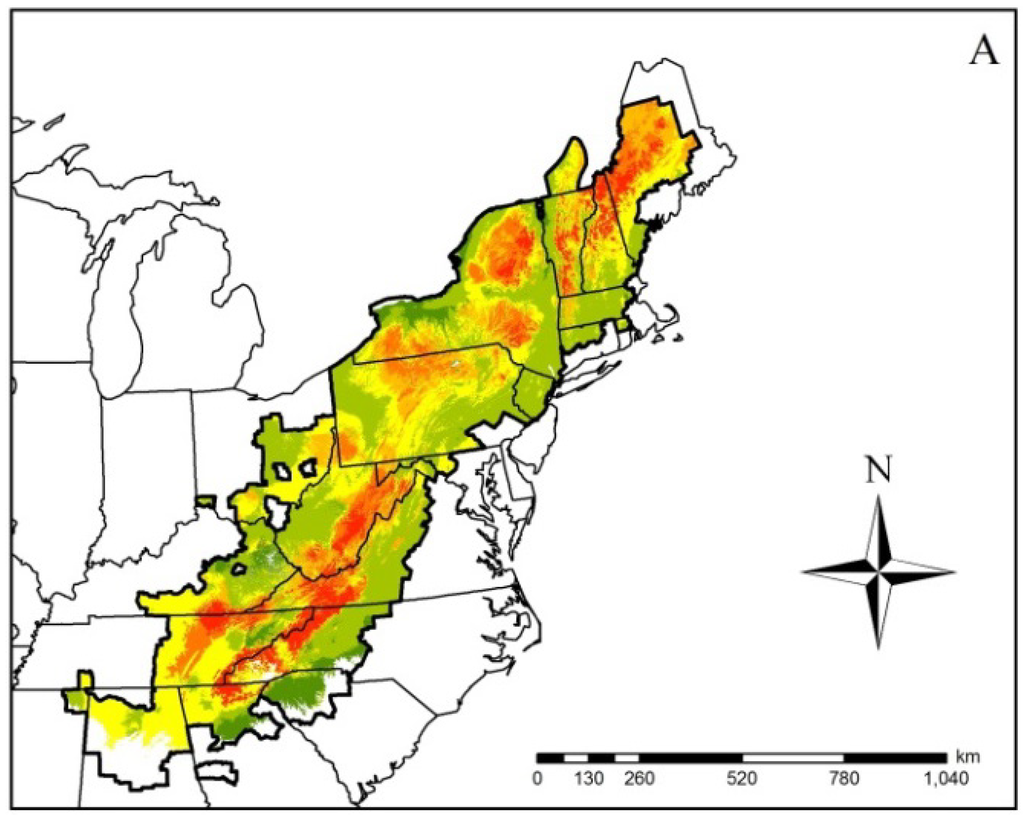
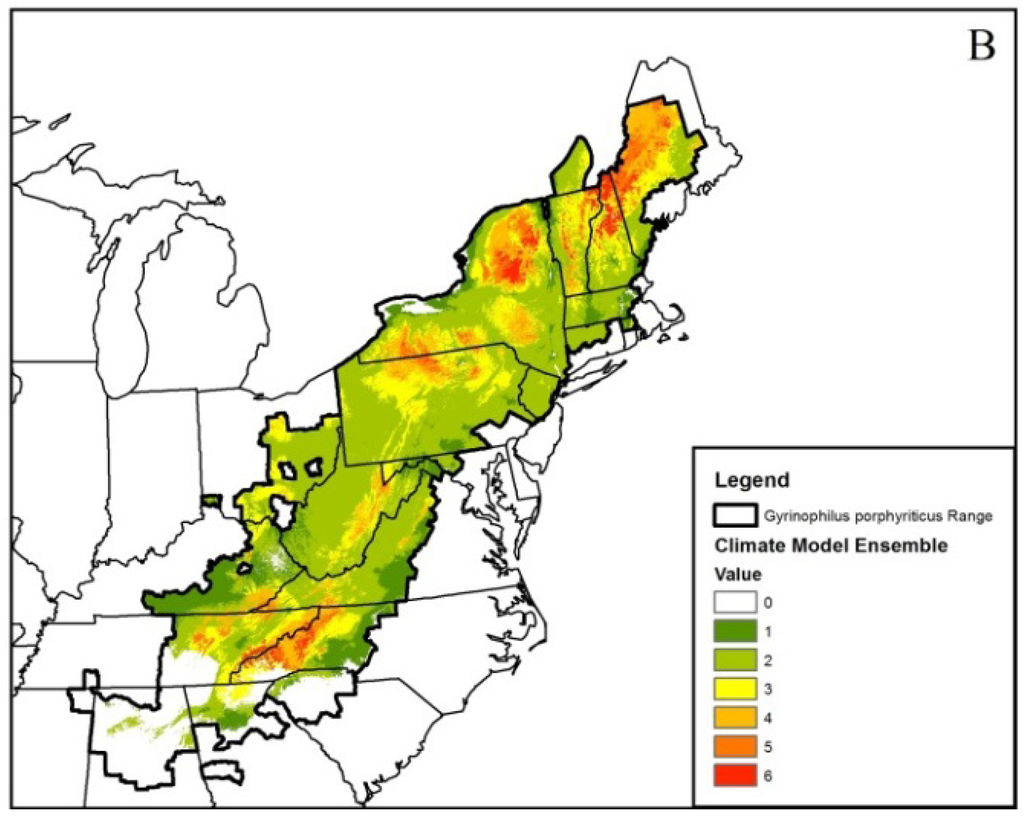
Figure 2.
Ensembled climatic distribution within the known geographic range (area with the dark black border) of the Spring Salamander (Gyrinophilus porphyriticus) based on two Global Circulation Models (CCSM4 (CCSM) and HadGEMCC-2 (Hadley)) and two Representative Concentration Pathway (RCP) trajectories (RCP 4.5 (Figure 1A) and 8.5 (Figure 1B)) for 2050. The scale of 0–6 in the legend refers to the number of projected models that represent a suitable climatic niche. Areas within the geographic range with no model agreement indicate a climatically unsuitable niche. Maps such as this were generated for all modeled species.
We summed each of the binary distribution layers for each species within a particular current or projected GCM, RCP trajectory (4.5 and 8.5), and threshold (mtp, f10, and mtr) layer to derive an estimate of overall climatic suitability and to identify potential refugia throughout the northeastern U.S. This process resulted in 15 total summed climate suitability maps (e.g., 3 current, 6 CCSM, and 6 Hadley). We then developed an overall average climate refugia richness (i.e., number of species with a climatically-suitable niche in a given landscape patch) map by averaging across the summed threshold layers within the current, RCP 4.5, and RCP 8.5 trajectories. We determined potential gains and losses in overall climate refugia richness by calculating the difference between each GCM/RCP/threshold suitability raster and the respective current climate distribution raster. We calculated the overall averages of species refugia richness within each RCP trajectory and between both RCP trajectories.

Table 5.
Projected proportional change between the current climatic niche and the 2050 projected climatic niche for priority salamander species (Table 3) in the northeastern U.S. We report average percent suitable climate niche based on current and projected climate scenarios (CCSM4 (CCSM) and HADGEM2-CC (Hadley)) under two Representative Concentration Pathway (RCP) scenarios (RCP 4.5 and RCP 8.5).
| Species | N | AUC (± SD) | CCSM RCP 4.5 | Hadley RCP 4.5 | CCSM RCP 8.5 | Hadley RCP 8.5 | Average Change (± SE) |
|---|---|---|---|---|---|---|---|
| Ambystoma barbouri | 34 | 0.76 ± 0.13 | –0.98 | –0.98 | –0.94 | –1.00 | –0.97 ± 0.01 |
| *Ambystoma jeffersonianum/*Ambystoma laterale | 527 | 0.76 ± 0.03 | –0.03 | –0.10 | –0.06 | –0.10 | –0.07 ± 0.02 |
| Ambystoma mabeei | 35 | 0.79 ± 0.09 | –0.98 | –0.99 | –1.00 | –1.00 | –0.99 ± 0.05 |
| Ambystoma opacum | 497 | 0.76 ± 0.02 | –0.03 | –0.11 | –0.15 | –0.11 | –0.10 ± 0.03 |
| Ambystoma tigrinum | 145 | 0.80 ± 0.08 | –0.22 | –0.16 | –0.20 | –0.10 | –0.17 ± 0.03 |
| Aneides aeneus | 171 | 0.86 ± 0.04 | –0.13 | –0.57 | –0.52 | –0.75 | –0.49 ± 0.13 |
| Cryptobranchus alleganiensis | 342 | 0.89 ± 0.02 | –0.37 | –0.60 | –0.66 | –0.79 | –0.61 ± 0.09 |
| Desmognathus fuscus | 1394 | 0.74 ± 0.02 | –0.16 | –0.37 | –0.28 | –0.54 | –0.34 ± 0.08 |
| Desmognathus monticola | 397 | 0.78 ± 0.03 | –0.33 | –0.80 | –0.49 | –0.84 | –0.61 ± 0.12 |
| Desmognathus ochrophaeus | 359 | 0.79 ± 0.03 | –0.70 | –0.75 | –0.89 | –0.93 | –0.81 ± 0.05 |
| Desmognathus organi | 16 | 0.91 ± 0.06 | –0.99 | –1.00 | –0.77 | –0.98 | –0.94 ± 0.05 |
| Eurycea bislineata | 953 | 0.75 ± 0.02 | +0.05 | –0.09 | +0.01 | –0.09 | –0.03 ± 0.03 |
| Eurycea longicauda | 515 | 0.73 ± 0.03 | –0.31 | –0.41 | –0.52 | –0.63 | –0.47 ± 0.07 |
| Gyrinophilus porphyriticus | 764 | 0.76 ± 0.02 | –0.34 | –0.62 | –0.52 | –0.73 | –0.55 ± 0.08 |
| Necturus maculosus | 143 | 0.83 ± 0.03 | –0.09 | –0.15 | –0.12 | –0.09 | –0.11 ± 0.01 |
| *Plethodon glutinosus/*Plethodon kentucki/*Plethodon cylindraceus | 1741 | 0.76 ± 0.02 | –0.25 | –0.52 | –0.39 | –0.74 | –0.48 ± 0.10 |
| Plethodon hoffmani | 212 | 0.79 ± 0.03 | –0.90 | –0.96 | –0.93 | –0.93 | –0.93 ± 0.01 |
| Plethodon nettingi | 34 | 0.92 ± 0.06 | –0.94 | –0.99 | –1.00 | –1.00 | –0.98 ± 0.02 |
| Plethodon punctatus | 17 | 0.88 ± 0.15 | –1.00 | –1.00 | –1.00 | –1.00 | –1.00 ± 0.00 |
| Plethodon virginia | 24 | 0.88 ± 0.06 | –1.00 | –1.00 | –1.00 | –1.00 | –1.00 ± 0.00 |
| Plethodon wehrlei | 150 | 0.80 ± 0.07 | –0.32 | –0.84 | –0.54 | –0.88 | –0.65 ± 0.13 |
| Plethodon welleri | 15 | 0.74 ± 0.10 | –0.15 | –0.99 | –0.74 | –0.94 | –0.71 ± 0.20 |
| Pseudotriton montanus | 97 | 0.79 ± 0.08 | –0.05 | –0.33 | –0.17 | –0.61 | –0.29 ± 0.12 |
| Pseudotriton ruber | 719 | 0.69 ± 0.02 | 0.00 | –0.52 | –0.18 | –0.59 | –0.33 ± 0.14 |
* Indicates individual species analyzed as a species complex.
3. Results
We modeled the current and projected climatic niche for 24 of 28 priority salamander species or species complexes in the NALCC and NEPARC networks (Table 3). Geographic ranges for the four remaining species, including the Peaks of Otter Salamander (Plethodon hubrichti), Shenandoah Salamander (Plethodon shenandoah), Big Levels Salamander (Plethodon sherando), and West Virginia Spring Salamander (Gyrinophilus subterraneus) were too small (<50 km2) to model the climatic niche with confidence. Several of the modeled salamander species were identified as regional priorities based on multiple conservation listing criteria, including the Cheat Mountain Salamander (Plethodon nettingi), Green Salamander (Aneides aeneus), Hellbender (Cryptobranchus alleganiensis), Shenandoah Mountain Salamander (Plethodon virginia), Cow Knob Salamander (Plethodon punctatus), and Long-tailed Salamander (Eurycea longicauda; Table 3).
All priority salamander species evaluated in this study were projected to lose a proportion of the current climatic niche owing to climate change (Table 5). Two species, the Cow Knob Salamander and Shenandoah Mountain Salamander were projected to lose 100% of the current climatic niche (Table 5). The Cheat Mountain Salamander, Ridge and Valley Salamander (Plethodon hoffmani), Northern Pygmy Salamander (Desmognathus organi), Mabee’s Salamander (Ambystoma mabeei), and Streamside Salamander (Ambystoma barbouri) were predicted to lose an average of at least 90% of their respective climatic niche (Table 5). Only the Northern Two-lined Salamander (Eurycea bislineata), Jefferson’s/Blue-spotted Salamander complex (Ambystoma jeffersonianum/laterale), and Marbled Salamander (Ambystoma opacum) were projected to lose ≤10% of their climatic niche (Table 5). Of the other highest priority salamander species, the Green Salamander and Hellbender were projected to lose 49% and 61% of their climatic niche, respectively (Table 4). AUC estimates ranged 0.69–0.92 (mean = 0.80) across all species, suggesting adequate model fit for most species. Although the Red Salamander (Pseudotriton ruber) had a relatively low AUC value (0.69 ± 0.02), we chose to include this species in calculations of climate refugia richness because the standard deviation estimate included the lower bound of the AUC evaluation threshold (AUC = 0.70).
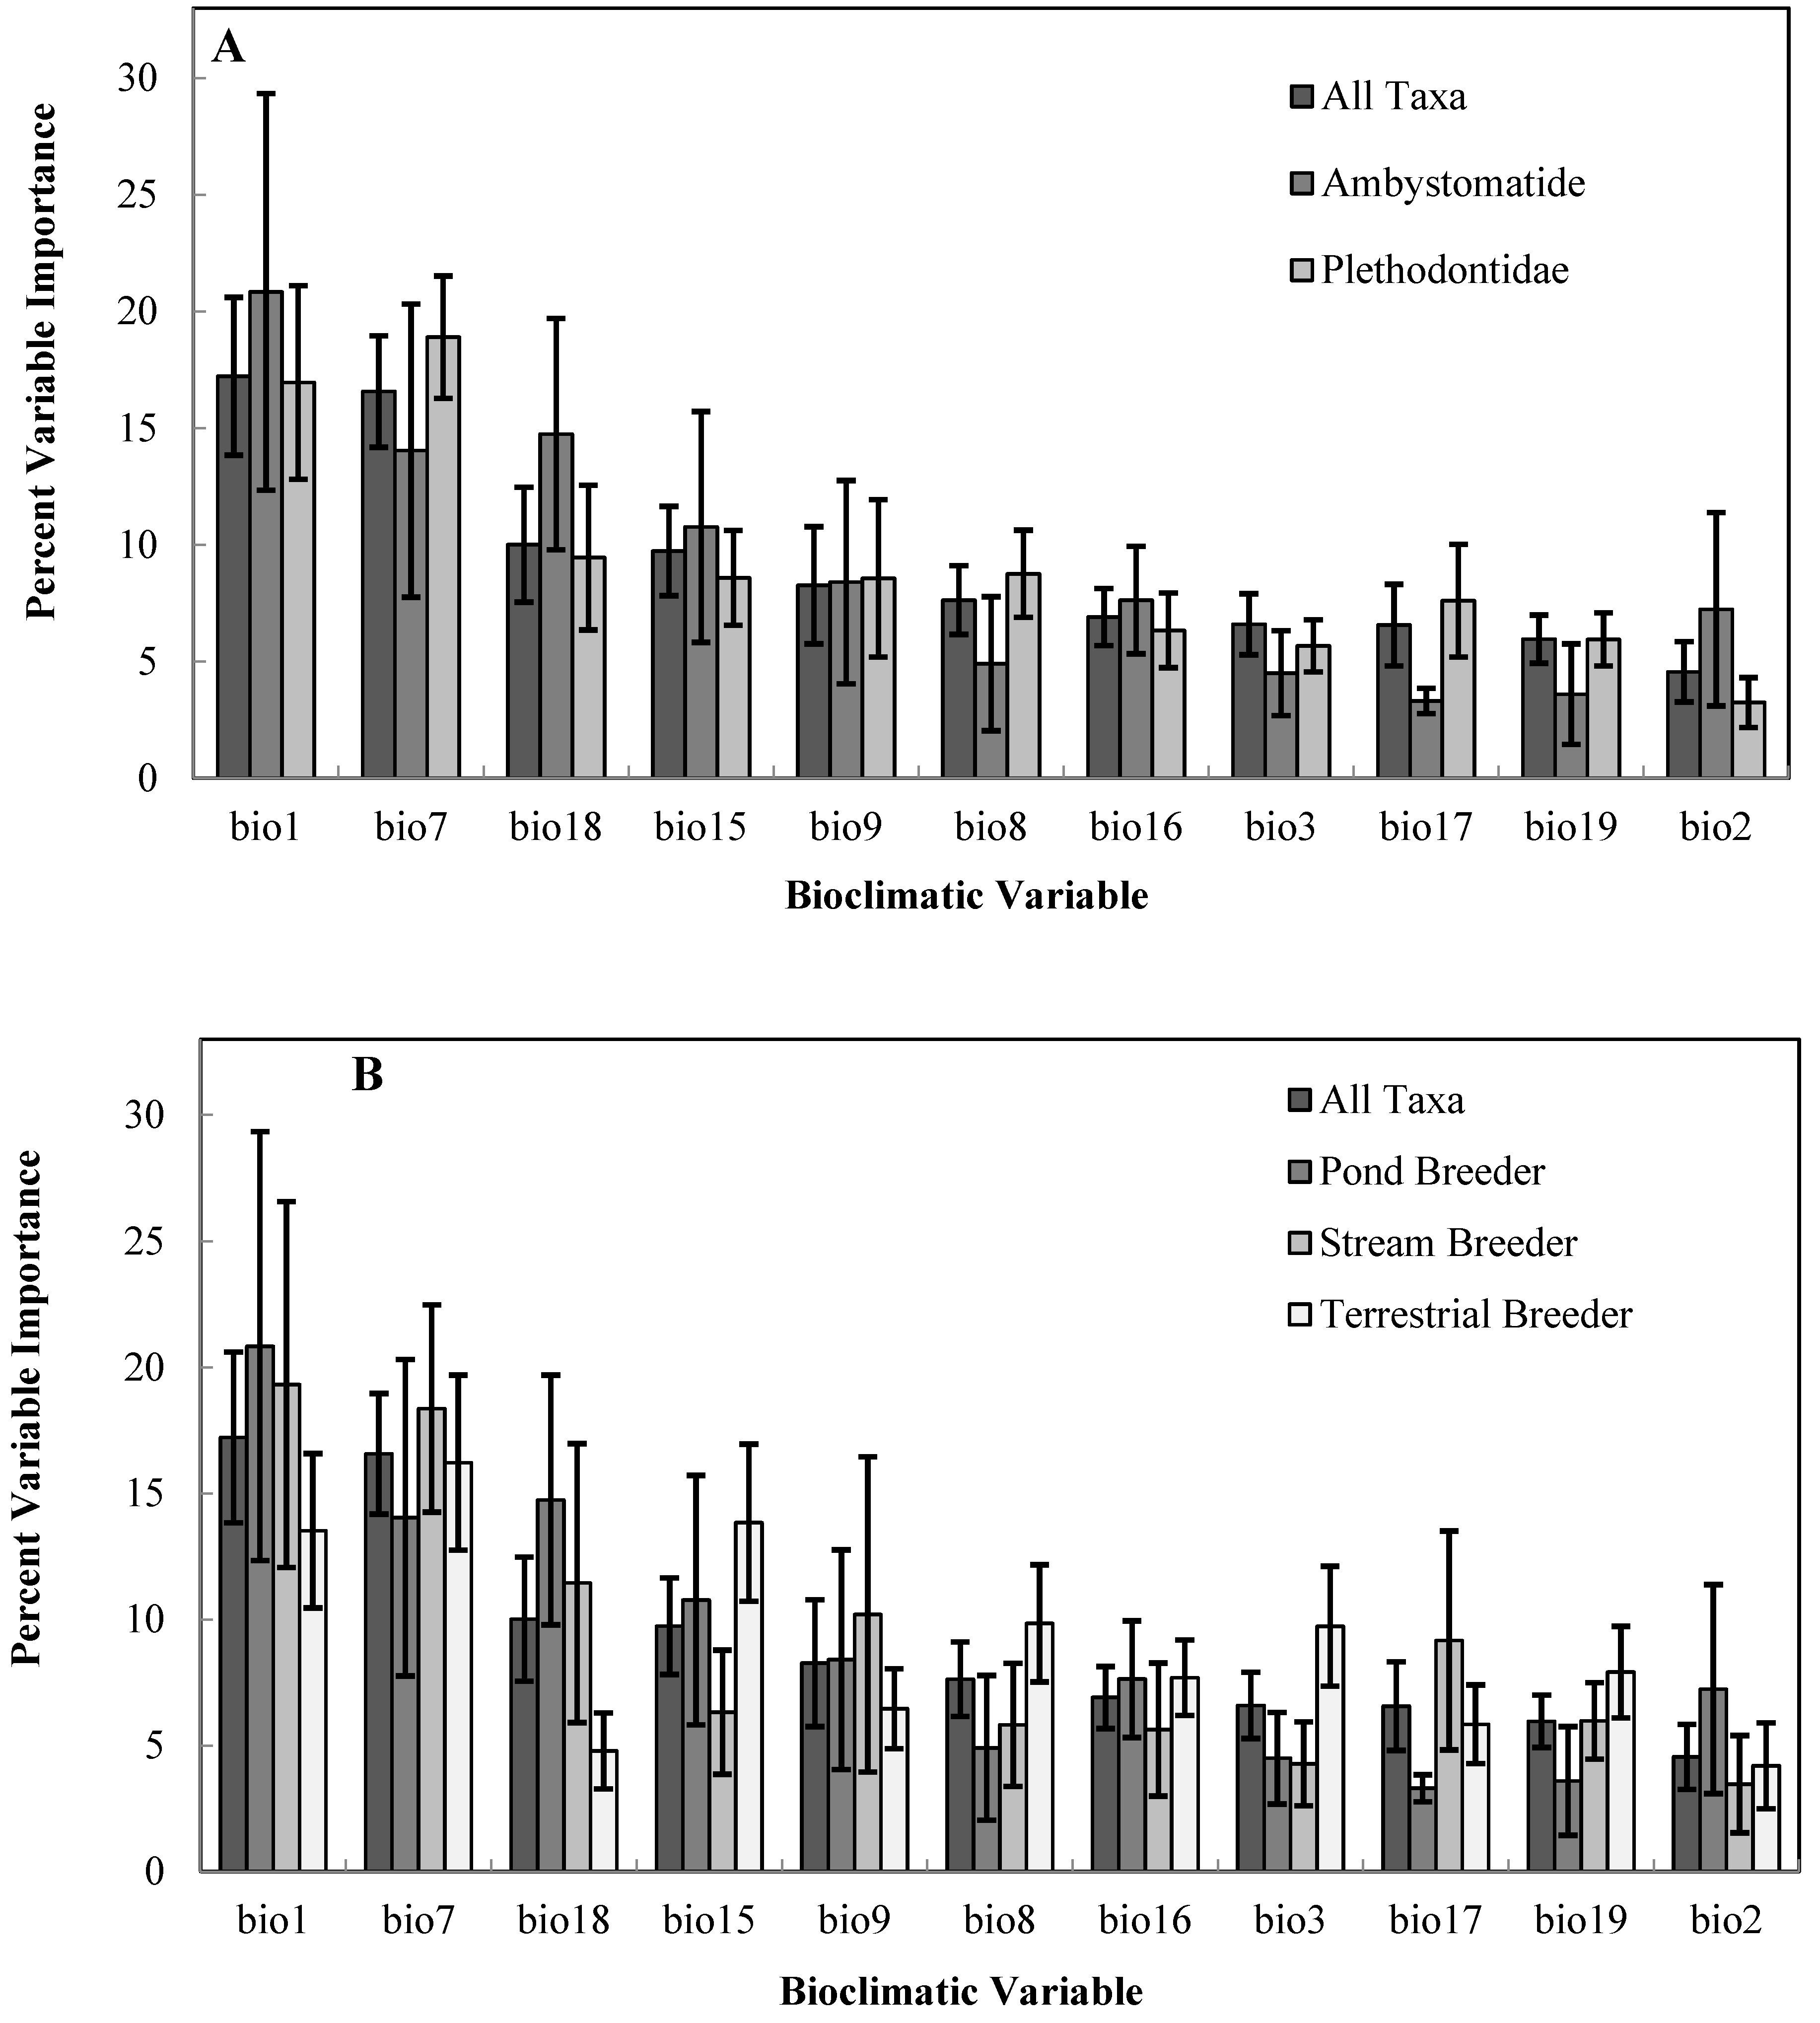
Among salamander families, mean projected refugia loss was greater in the Plethodontidae (62% loss) compared to the Ambystomatidae (46% loss). Within the family Plethodontidae, terrestrial species were projected to lose a greater proportion of their average climatic niche (80% loss) compared to semi-aquatic species (43% loss). We did not make direct comparisons by family for the Cryptobranchidae and Proteidae, because these groups were represented by one conservation priority species. Annual Mean Temperature (bioclimatic variable 1) and Temperature Annual Range (bioclimatic variable 7) were the most important variables for predicting the climatic niche across all salamander taxa (Figure 3). There was a greater contribution of Precipitation Seasonality and Precipitation of Warmest Quarter (Table 4) in the bioclimatic niche for terrestrial breeding and pond-breeding salamanders, respectively compared to stream breeders and across all taxa (Figure 3).
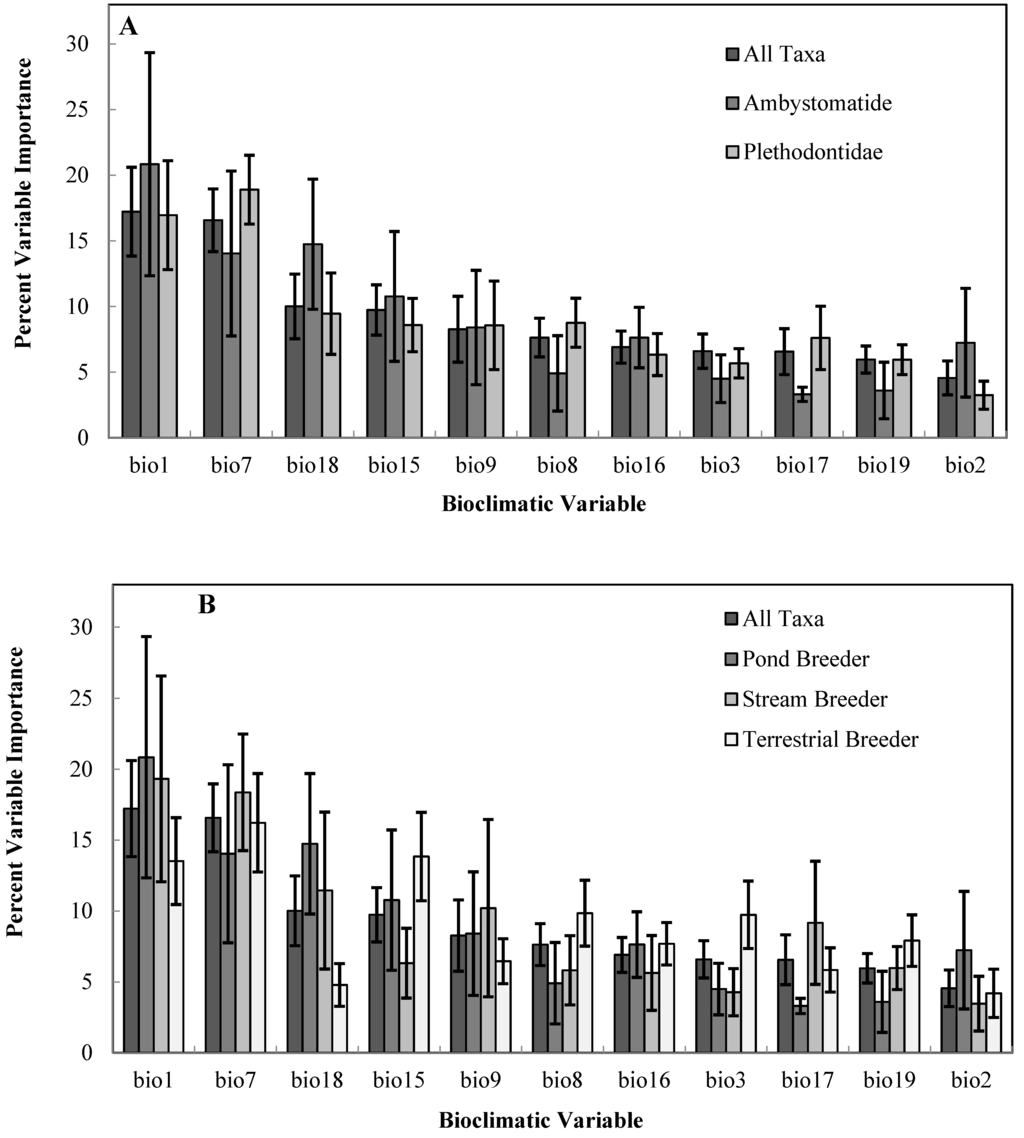
Figure 3.
Average percent contribution of individual bioclimatic variables for predicting the climatic niche of priority salamander species, (A) by family and (B) salamander breeding category. Please see Table 4 for a description of bioclimatic variables.
Figure 3.
Average percent contribution of individual bioclimatic variables for predicting the climatic niche of priority salamander species, (A) by family and (B) salamander breeding category. Please see Table 4 for a description of bioclimatic variables.
Within the current-day climatic scenario, the Central Appalachians, Western Allegheny Plateau, and Ridge and Valley geographic provinces were predicted to provide the greatest relative salamander climate refugia richness, whereas the Acadian Plains and Hills, Middle Atlantic Coastal Plain, Northeastern Coastal Zone, and Atlantic Coastal Plain Barrens were predicted to provide the least salamander climate refugia richness (Table 1, Figure 1 and Figure 4).
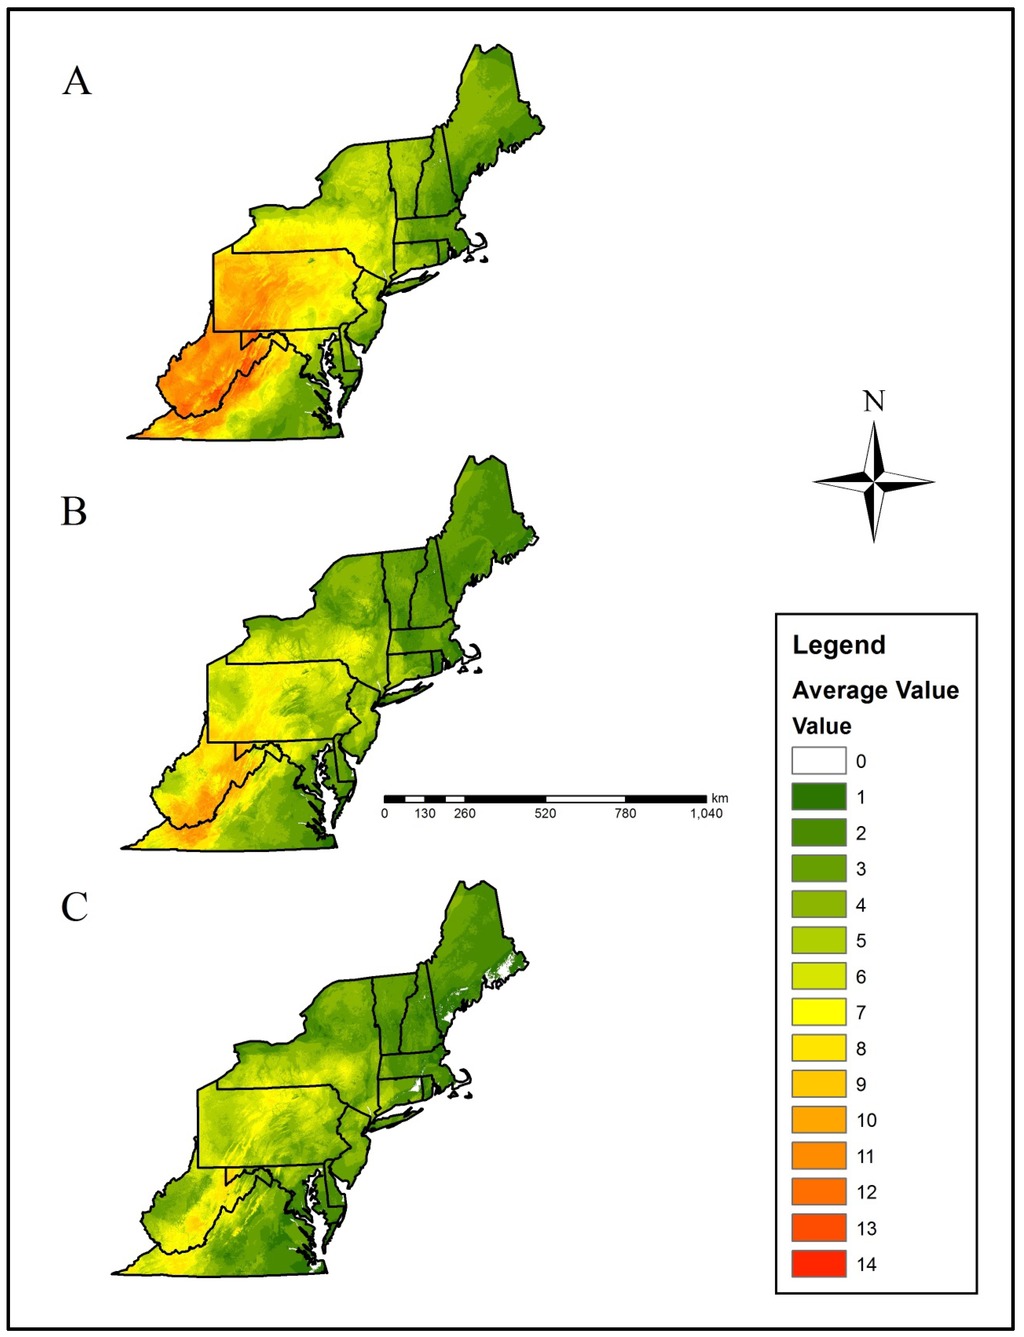
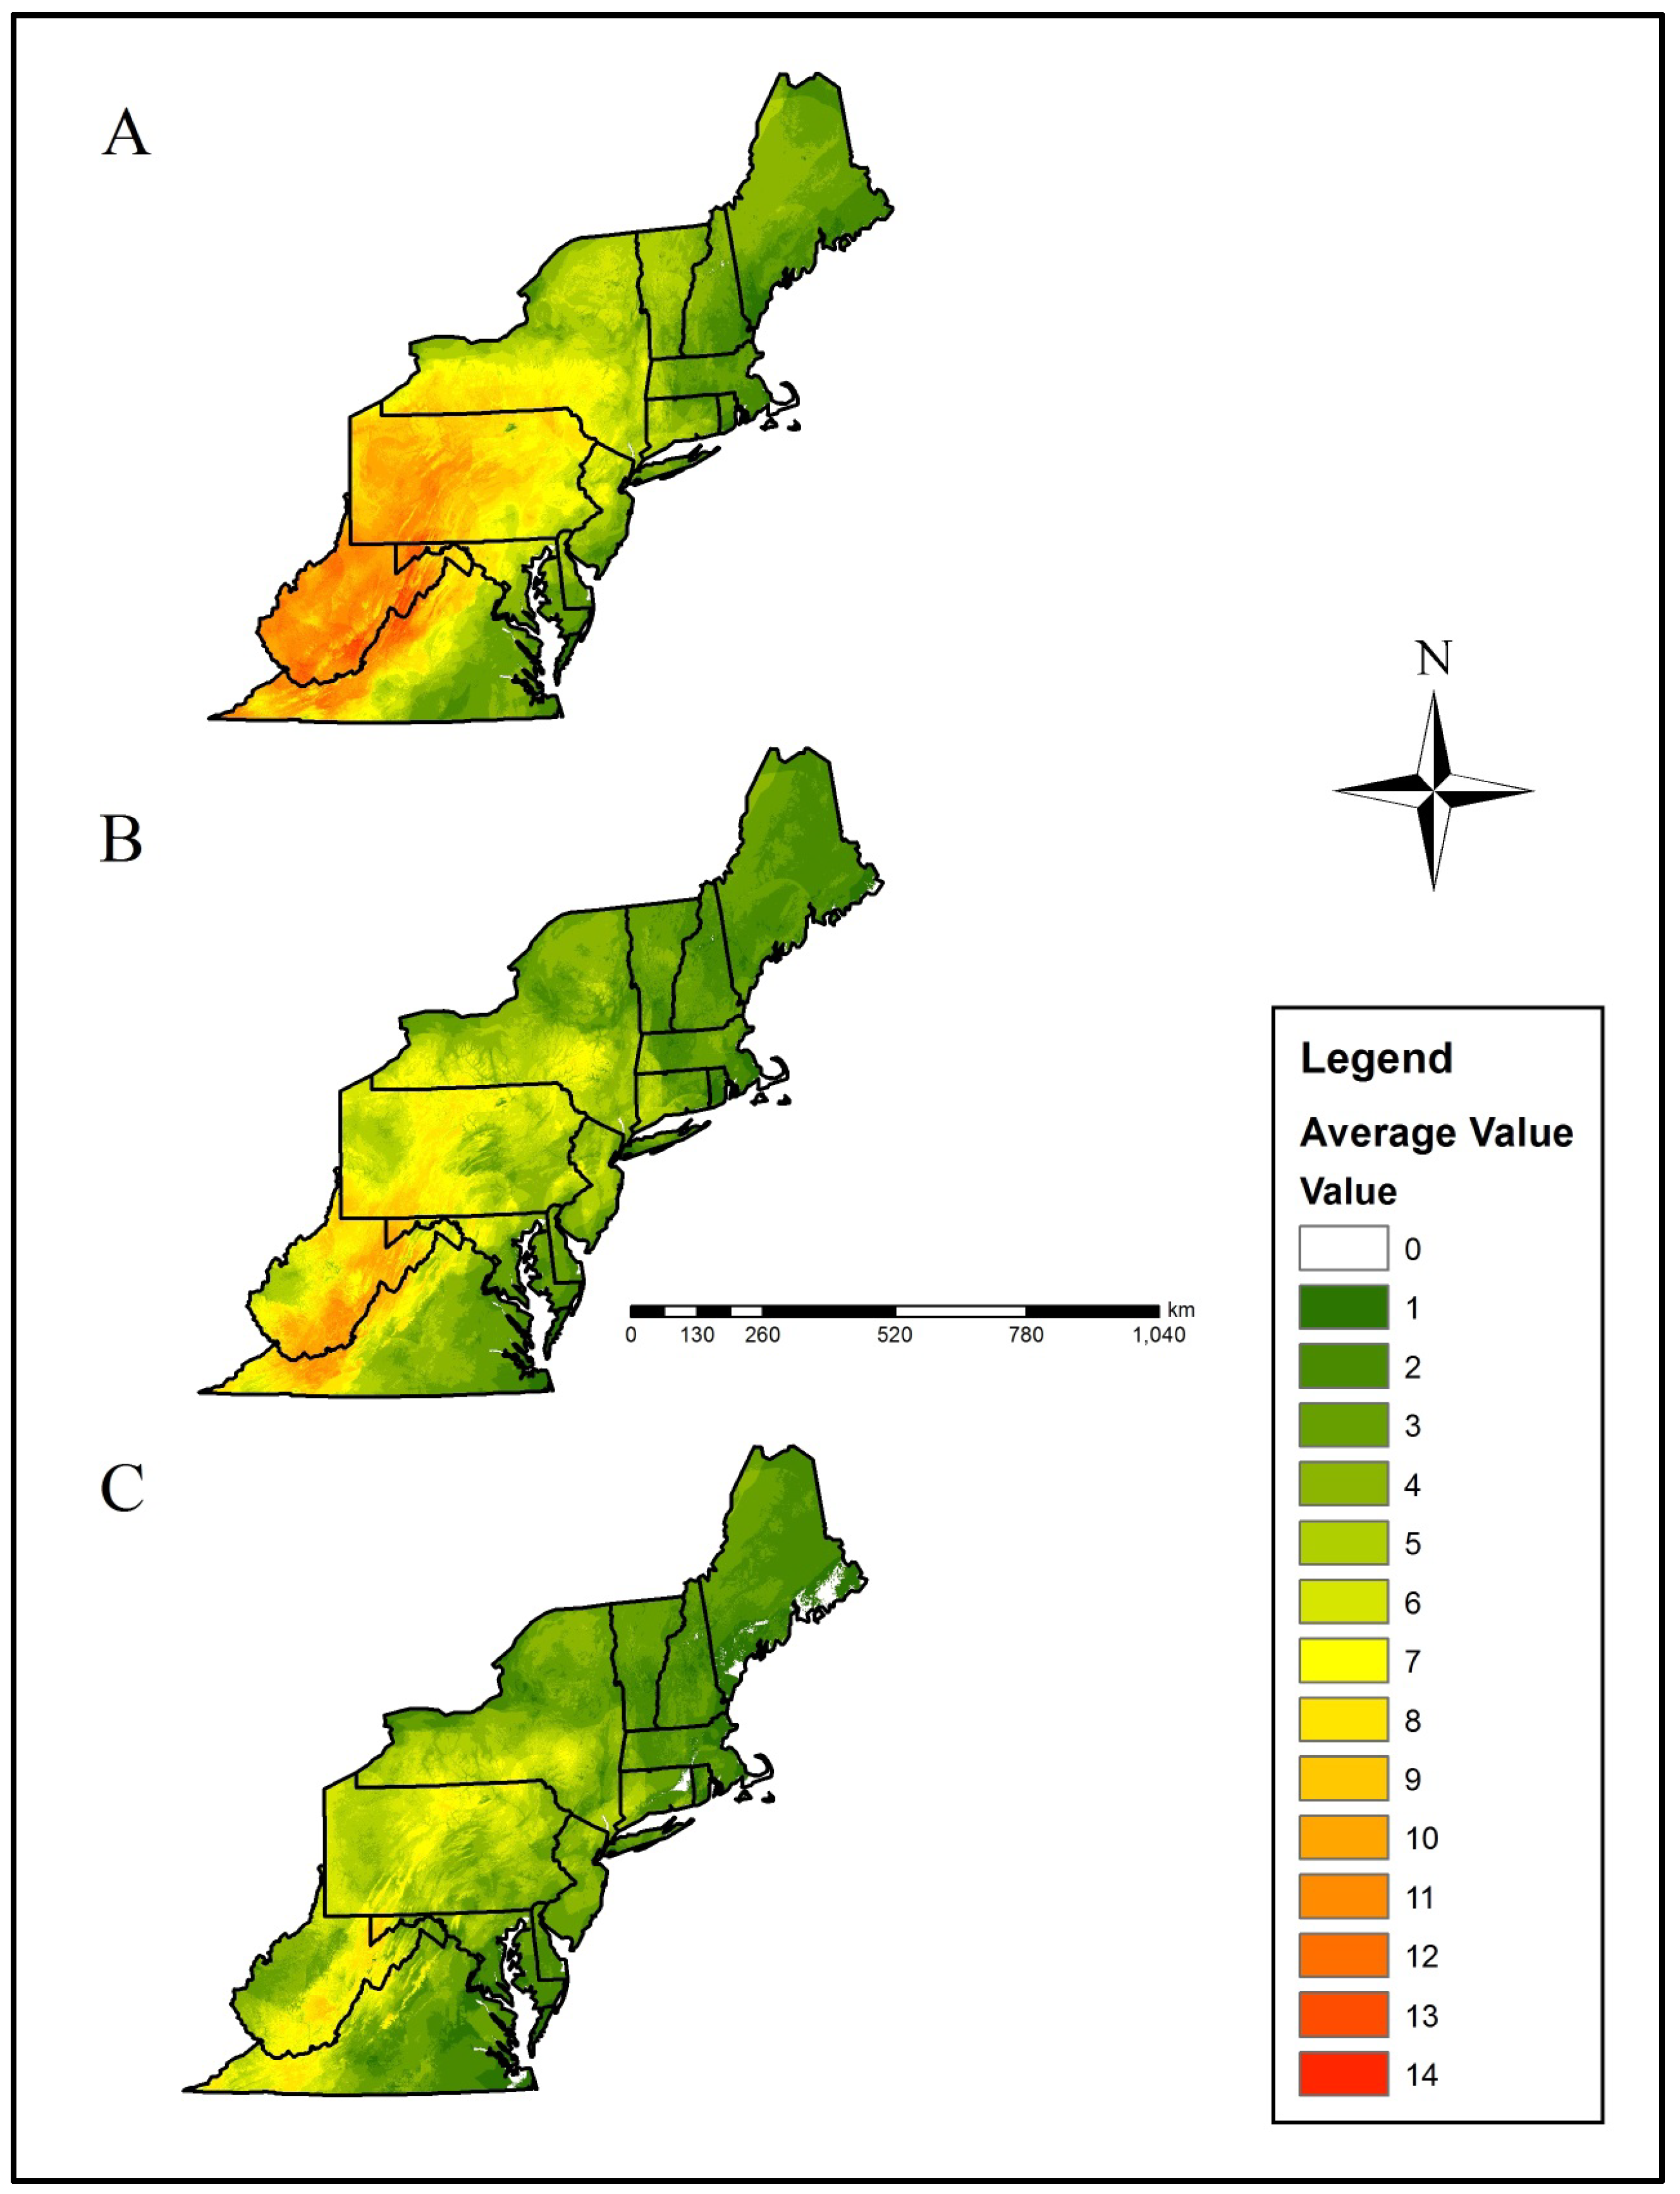
Figure 4.
Mean climate refugia richness (i.e., number of species with a climatically-suitable niche in a landscape patch) for priority salamander species in the northeastern U.S. based on, (A) current climate data, (B) Representative Concentration Pathway (RCP) 4.5, and (C) RCP 8.5 projected data. Projected climatic data were derived from the CCSM4 (CCSM) and HadGEMCC-2 (Hadley) Global Climatic Models. The numerical scale indicates increasing climate refuge species richness. Please see the methods section for a detailed description of how averages were calculated.
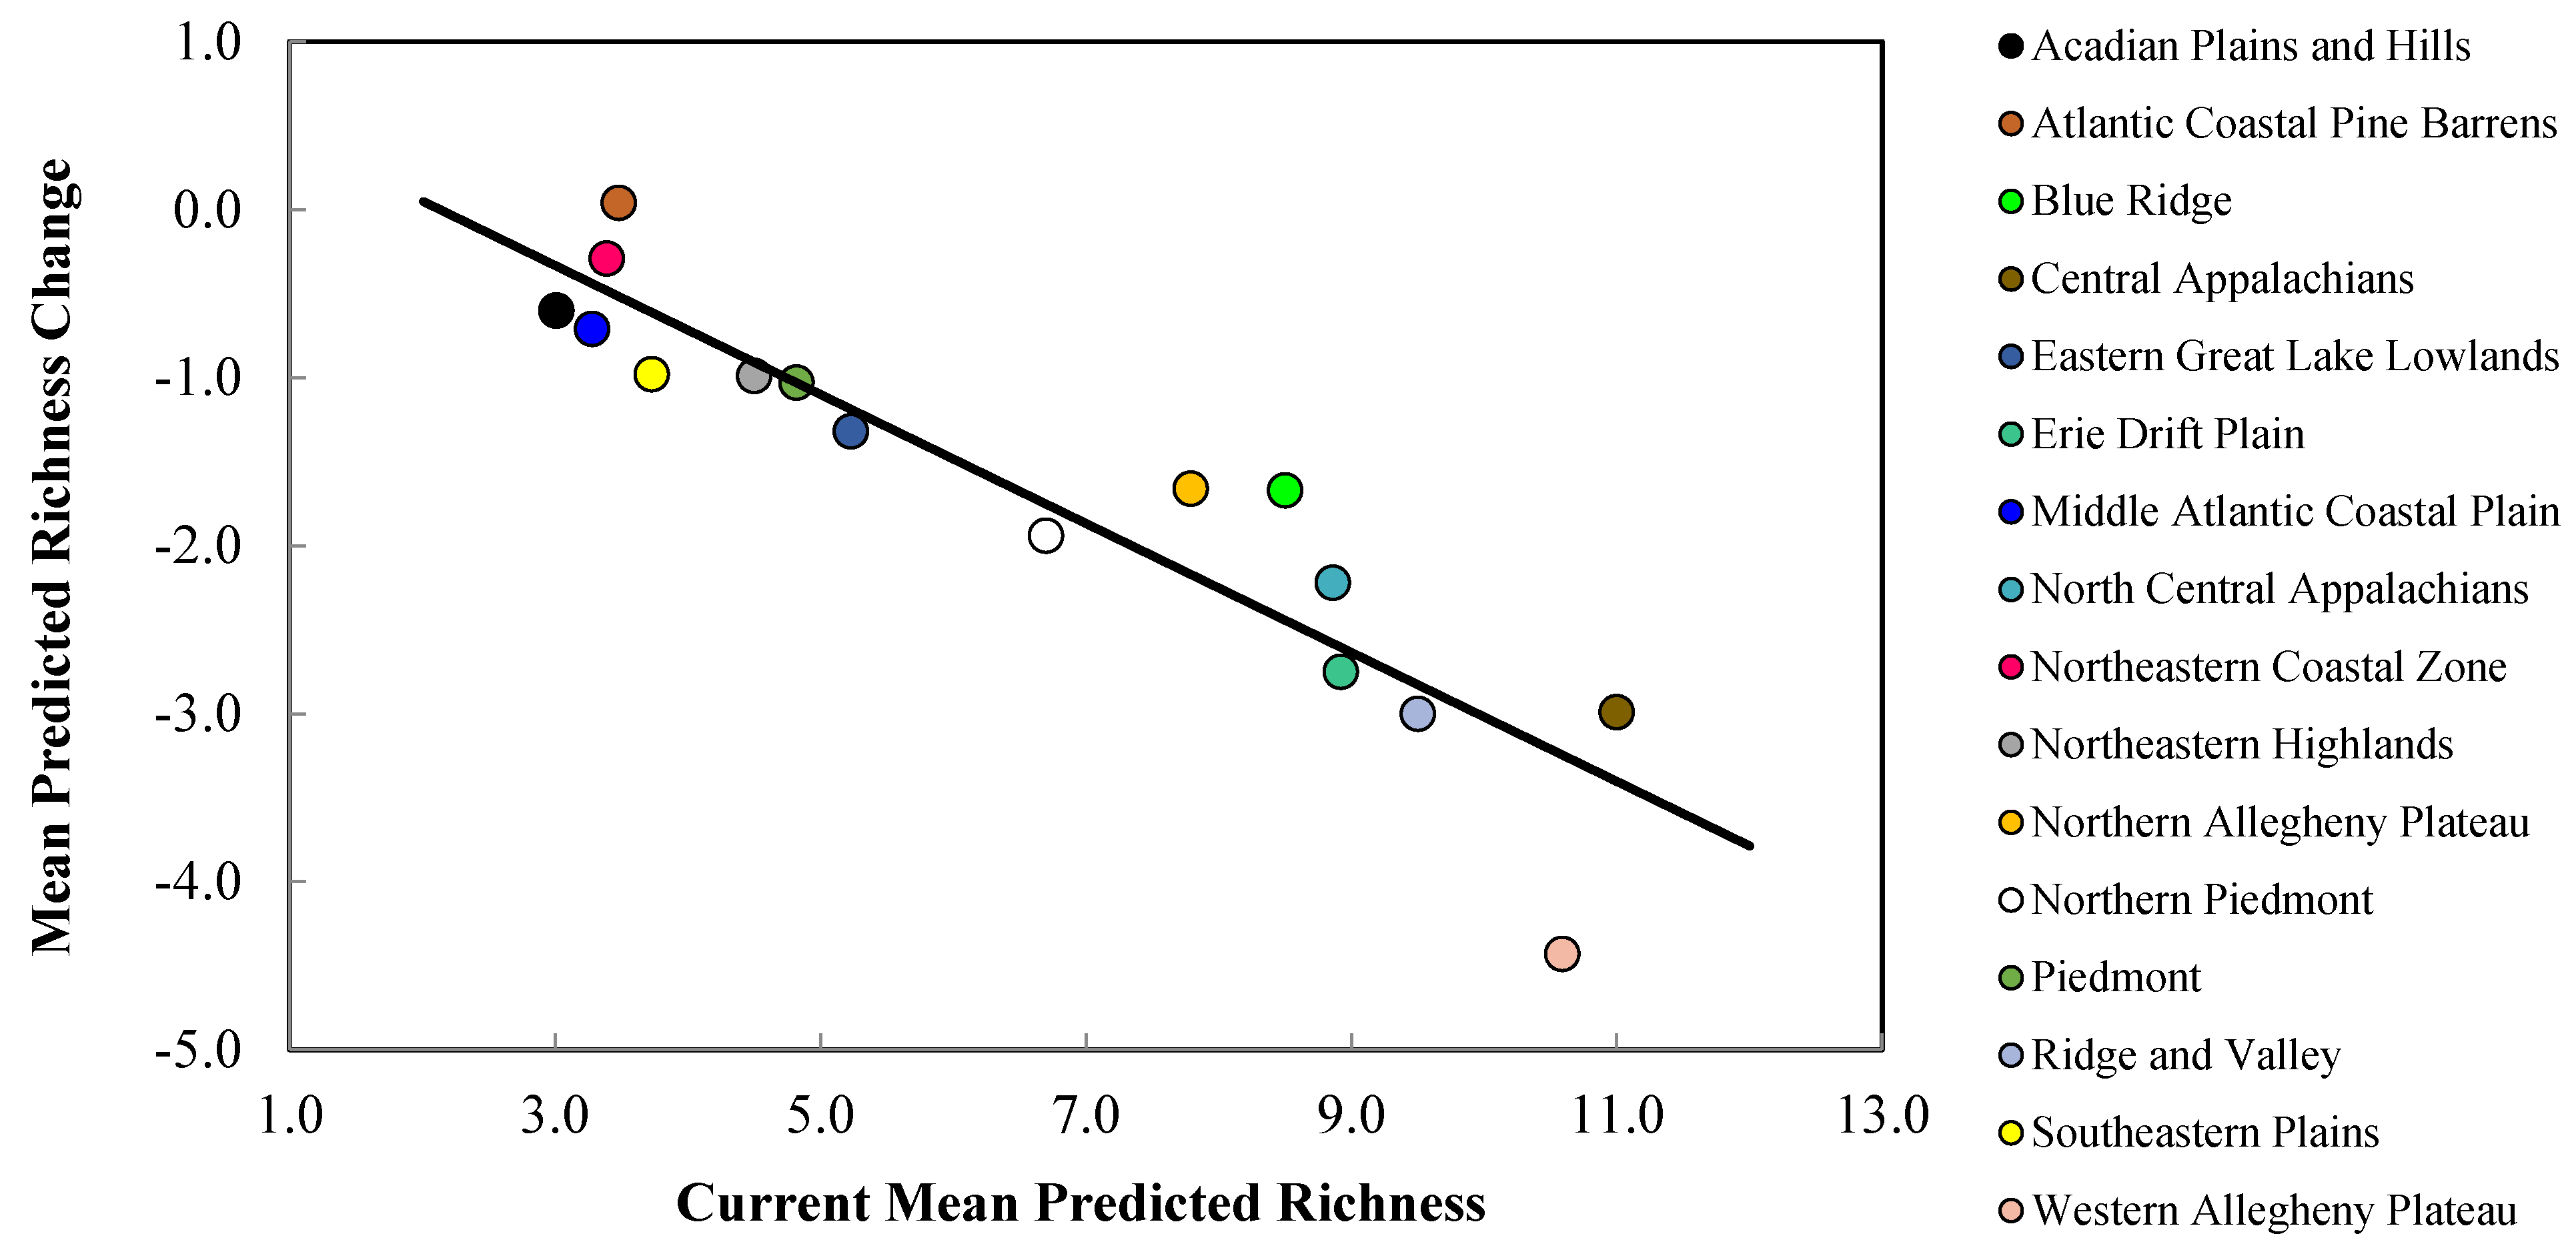
The Central Appalachians, Western Allegheny Plateau, and Ridge and Valley geographic provinces were predicted to lose the greatest mean salamander climate refugia richness (Table 2, Figure 1 and Figure 5). Specifically, mean loss in salamander climate refugia richness ranged 3.0–6.2 species (mean 4.4 species) in the Western Allegheny Plateau, with greatest loss in the two RCP 8.5 trajectories (Table 2, Figure 1 and Figure 5). Although losses also occurred in the Central Appalachians (mean loss = 3.0; Table 2), this province was predicted to provide the greatest climate refugia richness in the RCP 4.5 and 8.5 trajectories with means of 9.1 and 6.9 salamander species, respectively (Table 1, Figure 1 and Figure 4). Losses were predicted across all Environmental Protection Agency (EPA) Level III Ecoregions except for the Atlantic Coastal Pine Barrens, with a marginal increase (+0.04) in climatic suitability (Table 2, Figure 1 and Figure 5). This predicted change translated to an increase from 3.5 to 3.9 in refugia richness and a decrease from 3.5 to 3.2 in refugia richness based on the mean RCP 4.5 and RCP 8.5 trajectories, respectively (Table 1, Figure 1 and Figure 4). Marginal losses in refugia richness were predicted in the Northeastern Coastal Zone geographic province, ranging +0.07 to –0.8 (mean: –0.3 mean loss in refugia richness) depending on the GCM and RCP combination (Table 2, Figure 1 and Figure 5). The Atlantic Coastal Pine Barrens, Northern Allegheny Plateau, and Blue Ridge ecoregions were predicted to experience proportionally lower losses in refugia richness, whereas the Western Allegheny Plateau was predicted to experience the largest proportional loss in refugia richness across all ecoregions (Figure 6).
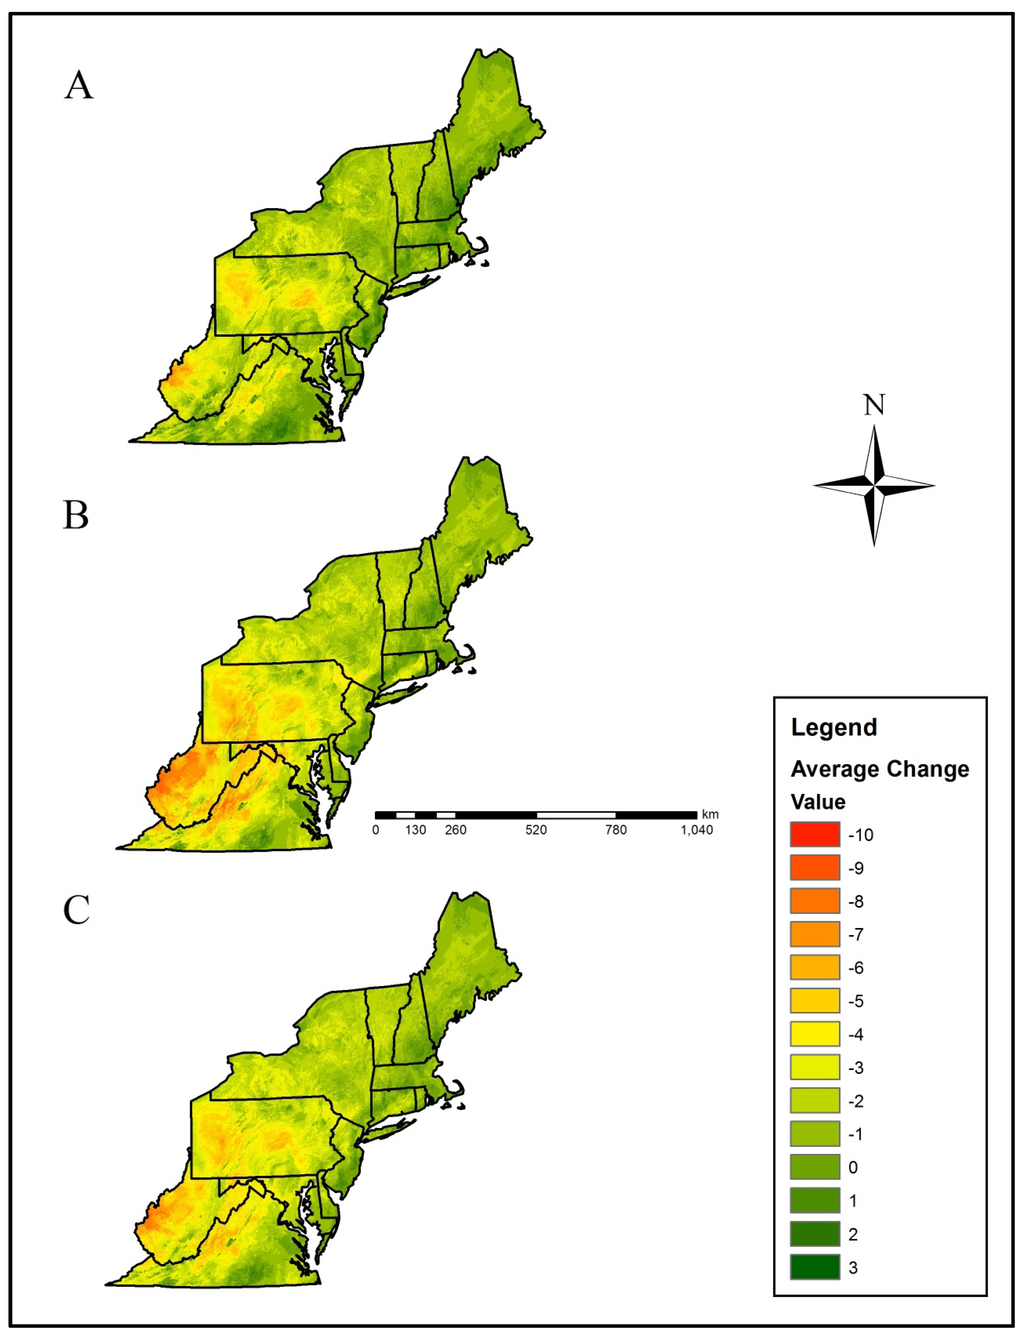
Figure 5.
Mean loss in salamander climatic refugia richness (i.e., number of species with a climatically-suitable niche in a landscape patch) based on two Global Climatic Models (CCSM4 (CCSM) and HadGEMCC-2 (Hadley)). Our results were averaged across Representative Concentration Pathways (RCP), including the (A) RCP 4.5, (B) RCP 8.5, and (C) overall RCP average. Negative values correspond with a loss in climate refugia richness compared to the current climatic distribution.
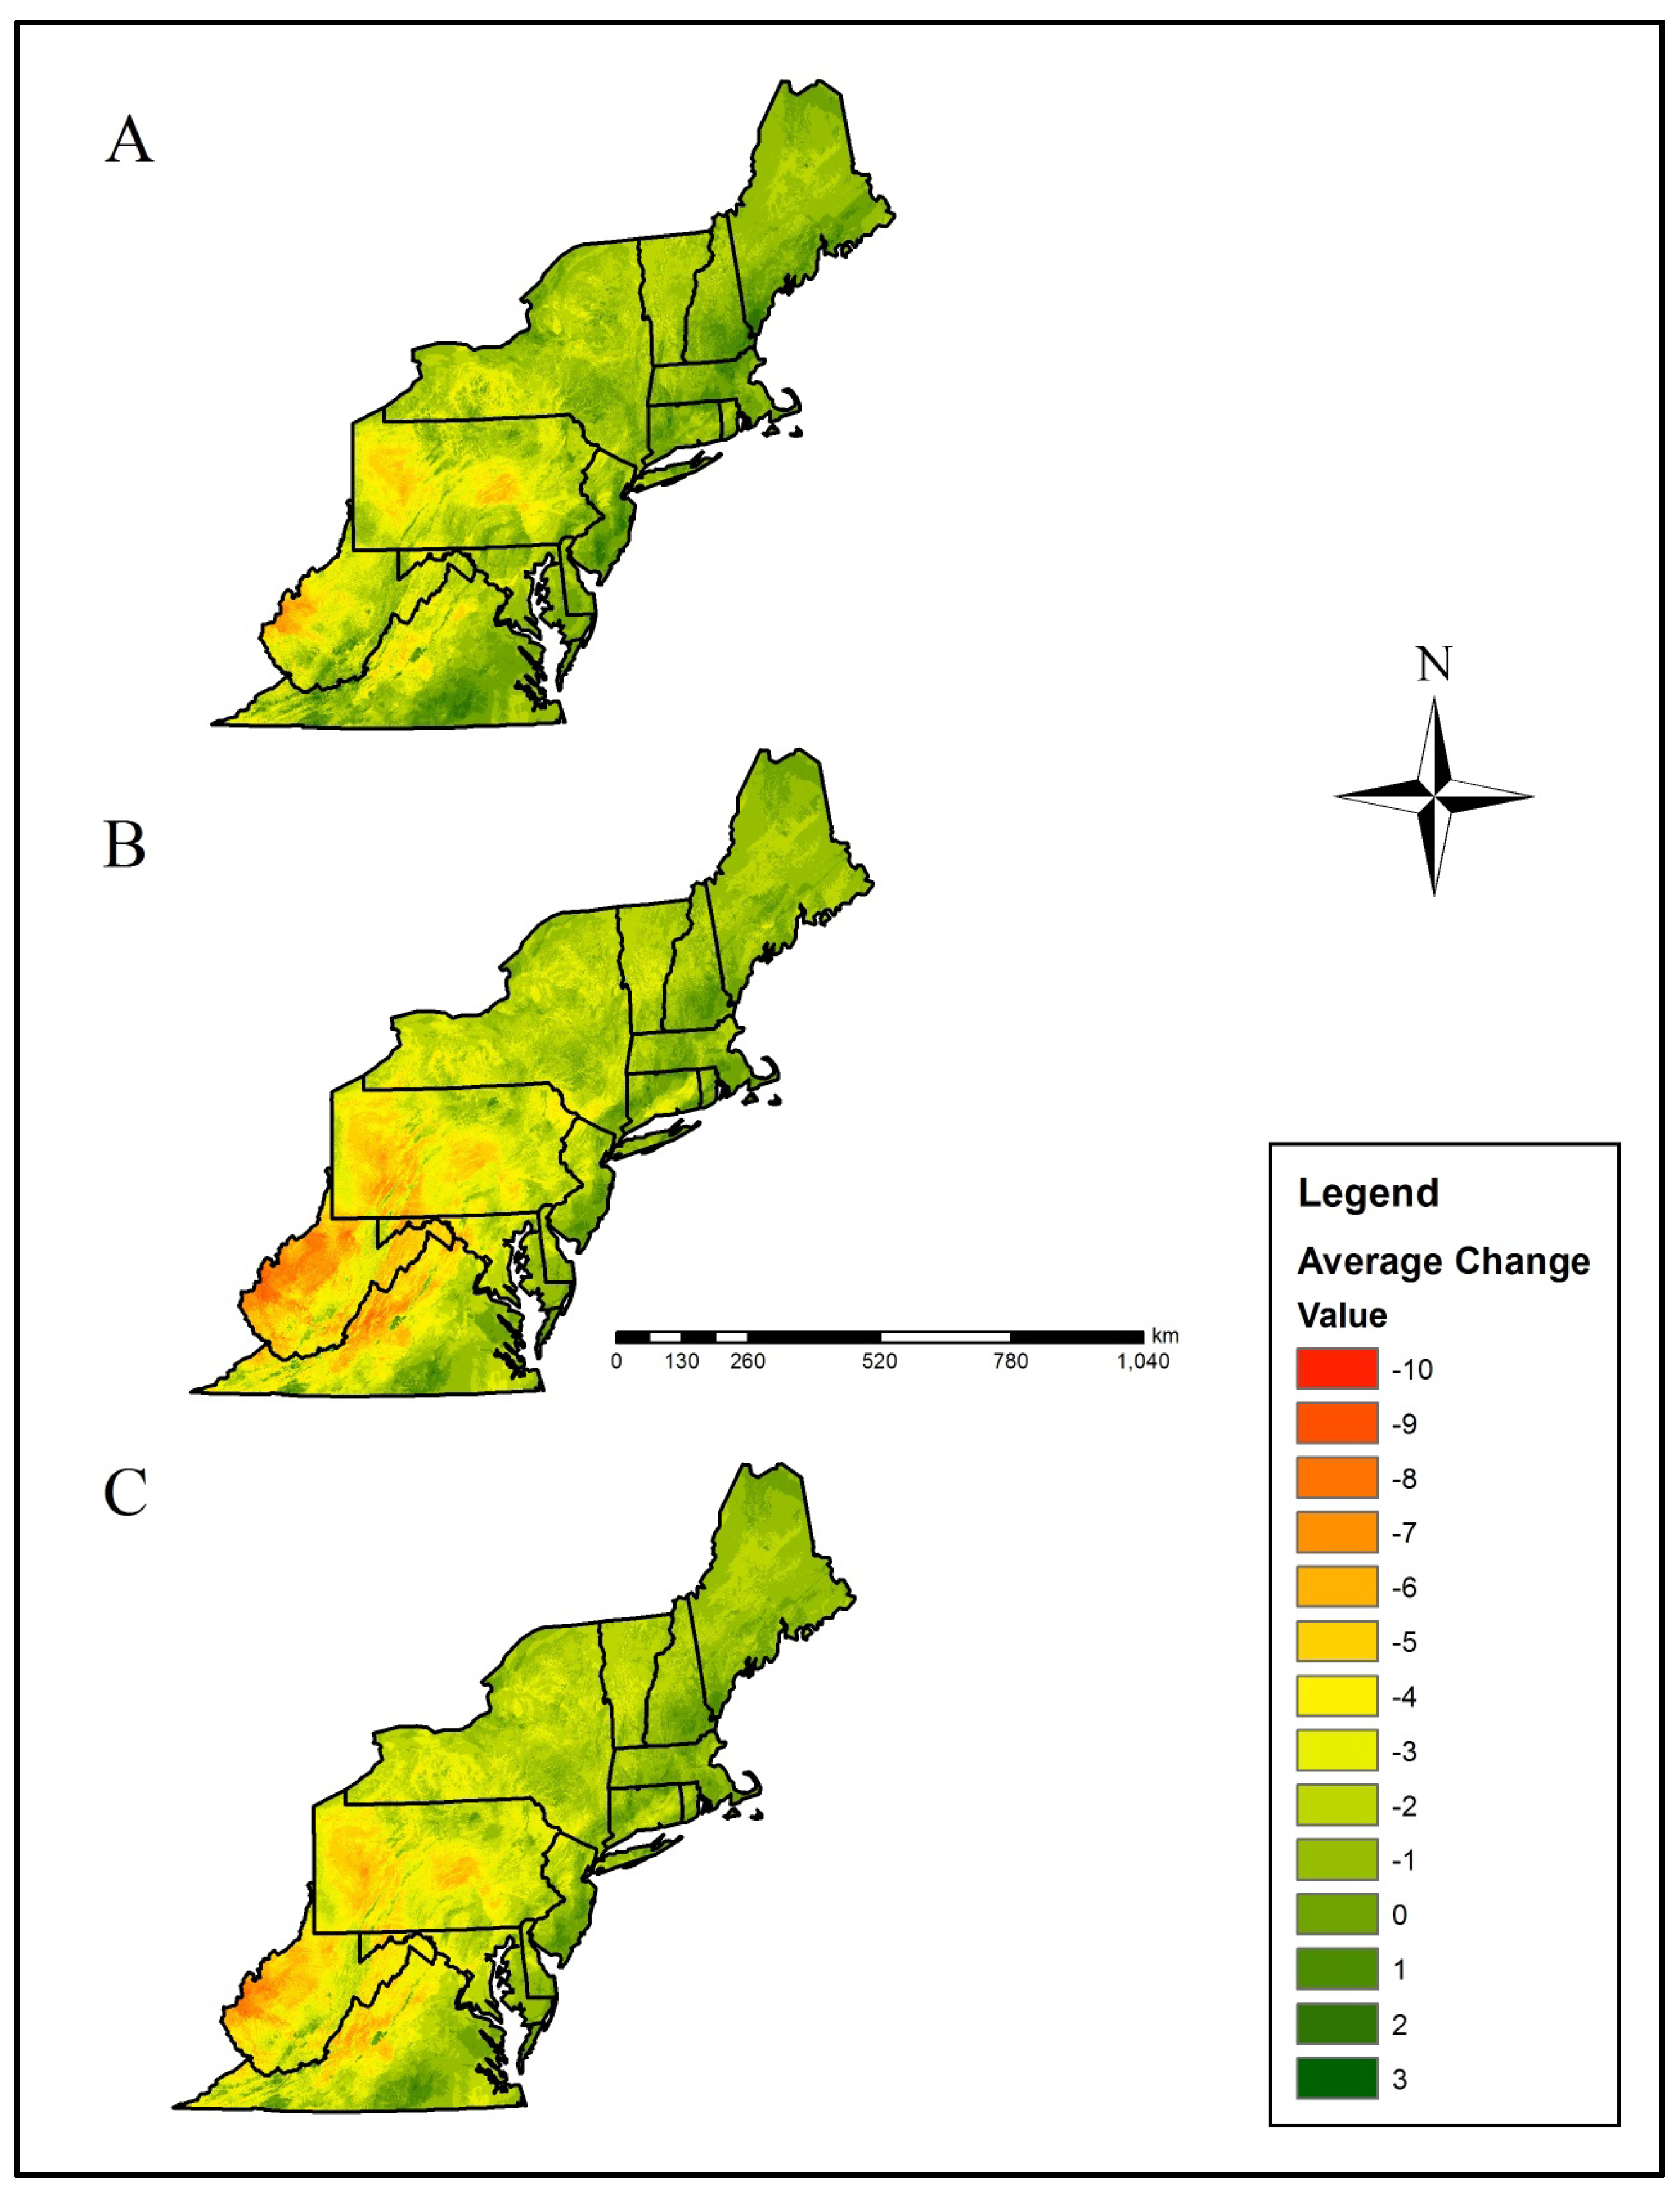
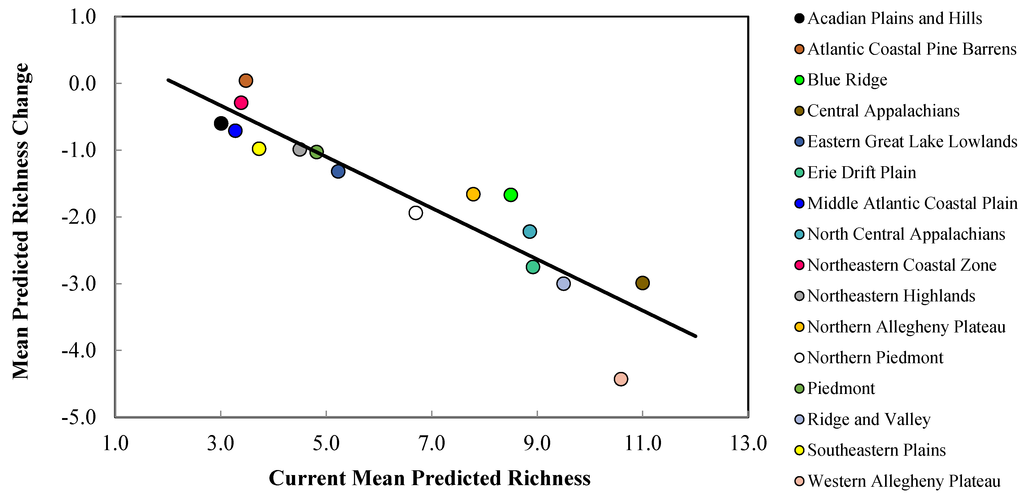
Figure 6.
Mean current predicted refugia richness (i.e., number of species with a climatically-suitable niche in a landscape patch) versus mean predicted change in refugia richness for priority salamander species in northeastern U.S. EPA Level III ecoregions (Figure 1). Current predicted richness and mean predicted richness loss values were obtained from Table 4 and Table 5, respectively. Ecoregion markers at greater distances above and below the best fit line indicate proportionally lesser and greater predicted changes, respectively in refugia richness due to climate change.
4. Discussion
Anticipating effects of climate change on long-term species conservation is a pressing issue in contemporary environmental conservation. Given that most organisms have physiological tolerances that have evolved over millions of years, it is important to understand how these physiological limitations potentially affect species survival in a rapidly changing climate. Recent advancements in species distribution modeling provide tools for assessing relative vulnerability within species assemblages to environmental stressors such as climate change, yet many of these techniques have limitations and unknowns, including the effects of sampling bias on model accuracy, transferability of current distributions onto future environmental scenarios, and the degree to which predicted vulnerability translates to future population change [49,50,51].
Our models predict that 14 out of 24 conservation priority salamander species or species complexes in the northeastern U.S. are projected to lose at least 50% of their climatic niche by the year 2050. We modeled the climatic niche for a wide array of salamander species and natural history strategies and found that five species (Mabee’s Salamander, Streamside Salamander, Cheat Mountain Salamander, Cow Knob Salamander, and Shenandoah Mountain Salamander) are projected to be most vulnerable, while only three species (the Jefferson’s/Blue-spotted Salamander complex, Northern Two-lined Salamander, and Marbled Salamander) are projected to experience minimal effects (<10% loss of climate refugia) due to climate change.
We noted that salamanders in the family Plethodontidae were predicted to lose a greater proportion of the climatic niche compared to other salamander families. Plethodontid salamanders are lungless and occupy a variety of habitats, including forested uplands as well as low-order riparian habitats. Lunglessness has led to rapid diversification of tongue and hyoid apparatus morphology, but at the cost of primary reliance on cutaneous respiration [52]. This adaptation requires relatively high environmental moisture to transfer oxygen across skin surfaces [52,53]. This is likely one of the primary reasons why regions with abundant rainfall (along with topographic complexity) in the northern hemisphere (e.g., eastern and northwestern U.S., Central America) have diverse plethodontid salamander assemblages. Our results also suggest that terrestrial plethodontids possess relatively higher vulnerability to climate change compared to semi-aquatic plethodontids. This is likely due to complexity of streamside habitats that create a diverse climate, which has the potential to buffer impacts to streamside salamander species from changing climatic conditions. In addition, three of the five species (Cheat Mountain Salamander, Cow Knob Salamander, and Shenandoah Mountain Salamander) predicted to lose the greatest proportion of their respective climatic niche are forest-dwelling, endemic species that occupy the highest elevation environments in their respective ranges.
Although montane environments provide species with a large gradient of environmental conditions, species adapted to these environments are limited in their ability to move upslope and access additional suitable environmental conditions in a rapidly changing climate [54]. For example, the ranges of 28 small mammal species in Yosemite National Park have moved upslope an average of 500 m in response to a 3 °C increase in minimum temperatures [55]. Vertical range changes of salamander species in the eastern U.S. have been noted [56], however, these changes have been attributed to a combination of landuse history, forest-stand age, and species competitive interactions. Local climate change (caused by deforestation) is hypothesized as one of the potential causes (in addition to an emerging pathogen) behind rapid declines of a Neotropical, montane plethodontid salamander assemblage [57,58]. Climate-modeled species distributions coupled with long-term field data collected over multiple time periods will establish stronger relationships between population dynamics and climate-driven environmental change [23,55]. In addition, long-term studies that pair historical and current data will be improved by accounting for errors in species detection and differences in survey effort, which can bias predicted range change estimates [59] and complicate conservation planning.
In addition to several plethodontids, the Mabee’s Salamander was also predicted to lose a large proportion of its climatic niche, which was centered along the Middle Atlantic Coastal Plain in Virginia, North Carolina, and South Carolina. Coastal ecoregions generally lack the topographic complexity of montane environments, which likely reduces climate buffering aspects of these environments. An amphibian vulnerability assessment in the southeastern U.S. also has noted that coastal-distributed species were vulnerable to potential effects from climate change [32]. The Mabee’s Salamander was the only coastal-distributed salamander species that we evaluated, which limits our understanding of the vulnerability of other coastal-distributed salamanders in the northeastern U.S. to climate change. The Streamside Salamander was also predicted to experience relatively large climatic niche loss. In our study region, this species is disjunctly distributed within the Western Allegheny Plateau, which was predicted as the most vulnerable geographic province. Although the Streamside Salamander occurs in habitats adjacent to riparian habitats, the potentially high vulnerability of this species to climate change suggests implementation of conservation measures (e.g., maintenance of riparian forest buffers) to mitigate potential climatic impacts.
A reduction in the climatic niche for a given species should not be directly interpreted as a decrease in patch occupancy. As previously mentioned, we modeled the climate niche based on the macrorefugia concept [33]. The bioclimatic data used during this study were downscaled at the geographic resolution of 1 km2, which is too large to account for the contributions of microtopography and other small-scale climate buffering aspects of the landscape (i.e., microrefugia). In addition, our climate models were not parameterized to include physiological thresholds of priority species. Our models operate under the assumption that current distributions represent the geographic and physiological limits for the salamander species evaluated during this study. Given that temperate zone salamanders have the capacity to acclimate physiologically to small increases in temperature [60], models that incorporate physiological parameters (i.e., mechanistic models) are more appropriate for understanding the physiological mechanisms that underpin species distributions and predicate the ability for organisms to adapt to changing environmental conditions [54]. Although congruency has been found between predictions of both correlative and mechanistic models, multiple lines of evidence from both modeling approaches will provide a larger context for projected species distributions [61]. Rather than using our study findings as a direct prediction of species loss due to climate change, our results are better interpreted as a relative index of species sensitivity to complement a comprehensive vulnerability assessment [62] that incorporates additional spatially-explicit landscape and landuse data, and information about physiological sensitivity and potential responses to climate change.
The inability of many salamander species to immigrate to suitable habitats in the face of rapid environmental change emphasizes the importance of identifying climatically-resilient refugia to help buffer impacts of a changing climate. Our results suggest that the Western Allegheny Plateau geographic province is vulnerable to effects from climate change as evidenced by a relatively large projected loss of salamander refugia richness. Although this region is characterized by moderate topographic complexity and extensive coverage of mixed hardwood forests, many of the salamander species predicted to lose suitable climate conditions have geographic distributions located near the edge of this province. Populations located near biome or ecoregion boundaries may be especially susceptible to climate change, because these organisms already may be near their physiological limits, and additional climatic shifts may have further negative effects [63]. Although the Central Appalachians geographic province was projected to lose climatically suitable conditions for some species, this ecoregion was projected to provide refugia for the greatest number of priority salamander species under both current and projected climate scenarios. This ecoregion is well known for possessing salamander diversity, and future conservation efforts that preserve topographically complex habitats will enhance availability of climate refugia.
Although long-term solutions to climate change are complex and seemingly inaccessible to many land managers, strategic conservation planning is a proactive and tangible approach to providing climate refugia. At the local scale, adaptive management by developers, foresters, land trusts, and municipal planners that recognizes the importance of protecting microhabitat diversity and enhancement and restoration of breeding and refuge sites can help mitigate local effects of climate change [64]. At the landscape scale, public conservation lands provide a network of potential conservation priority areas to conserve and manage. Additional land conservation efforts such as fee acquisition and working forest conservation easements can be used to increase the size and connectivity of existing public lands. Recent taxa-focused conservation efforts, such as the Important Bird Areas (IBAs) effort has been successful for furthering conservation of priority avian habitats worldwide [65]. A similar conservation effort for amphibian and reptiles (i.e., Priority Amphibian and Reptile Conservation Areas (PARCAs)) currently is being evaluated as a potential tool for addressing the specialized conservation needs of vulnerable amphibian and reptile populations [66]. Overall, our study provides an additional conservation tool that can be used to identify priority habitats that host potentially critical climate refugia for salamanders and other sensitive forest taxa. Identifying and protecting these refugia may help maintain the exceptionally high diversity and abundances of salamanders in the streams and forests of the northeastern U.S., conserving an important component of the region’s natural heritage and forest ecosystem function.
5. Conclusions
Our results indicate that priority salamanders in the northeastern U.S. are likely to display species-specific sensitivities to climate change. Endemic terrestrial plethodontids (i.e., Cow Knob Salamander, Shenandoah Mountain Salamander, and Cheat Mountain Salamander) along with two ambystomatid salamanders (i.e., Mabee’s Salamander and Streamside Salamander) are predicted as most vulnerable in regards to 2050 projected climatic trends. In addition, northeastern U.S. geographic provinces are predicted to provide a gradient of refugia to climate change. Specifically, the Western Allegheny Plateau was predicted to lose the greatest salamander refugia richness, whereas the Central Appalachians were predicted to provide refugia for the greatest number of salamander species based on 2050 predictions. As our predictions were based on correlative, presence-only modeling efforts, models that incorporate physiological parameters (i.e., mechanistic models) are necessary to further develop more precise estimates of species responses to climate change. Although our results suggest that many northeastern species will lose portions of their respective climatic niche to climate change, these changes should not be interpreted as a direct indication of losses in species occupancy. Rather, these data should be interpreted as a measure of relative species sensitivity and potentially as part of a larger vulnerability analysis that integrates spatially-explicit landscape and landuse data. Collectively, these data can be used to identify landscapes that are likely to be further affected by climate change and potentially climatically-resilient habitats for salamanders and other sensitive forest taxa.
Acknowledgments
The authors wish to thank the U.S. Fish and Wildlife Service North Atlantic Landscape Conservation Cooperative and the Wildlife Management Institute for financial support of this research. Appreciation is also extended to the Maine Department of Inland Fisheries and Wildlife, Vermont Agency of Natural Resources, New Hampshire Fish and Game Department, New York State Department of Environmental Conservation, Massachusetts Department of Fish and Game, Connecticut Bureau of Natural Resources, West Virginia Department of Natural Resources, Maryland Department of Natural Resources, and Virginia Department of Inland Game and Fisheries for providing access to state-level amphibian and reptile locality records. We also thank Lori Williams, Jeff Hall, and Jeff Beane of the North Carolina Wildlife Resources Commission; John Jensen and Thomas Floyd of the Georgia Department of Natural Resources; and Austin Peay State University and the David H. Snyder Museum of Zoology in Tennessee for providing specific locality data requests. The authors would also like to thank the multiple museums and data repositories that have made available their records through the HerpNet and BISON biological record databases. Mention of trade names and commercial products does not constitute endorsement or recommendation for use by the U.S. Government. The authors thank David Steen and three anonymous reviewers for comments on earlier versions of this manuscript.
Author Contributions
All authors involved provided considerable input during the planning and implementation of this research. William B. Sutton completed analyses related to the climate niche modeling. William B. Sutton and Kyle Barrett drafted the manuscript. All authors provided essential comments that greatly improved manuscript quality.
Conflicts of Interest
The authors declare no conflict of interest
References
- Scheu, S.; Setala, H. Multitrophic interactions in decomposer food webs. In Multitrophic Level Interactions; Tschamtke, T., Hawkins, B.A., Eds.; Cambridge University Press: Cambridge, UK, 2002; pp. 223–269. [Google Scholar]
- Walton, B.M.; Tsatiris, D.; Rivera-Sostre, M. Salamanders in forest-floor food webs: Invertebrate species composition influences top-down effects. Pedobiologia 2006, 50, 313–321. [Google Scholar] [CrossRef]
- Beard, K.H.; Vogt, K.A.; Kulmatiski, A. Top-down effects of a terrestrial frog on forest nutrient dynamics. Oecologia 2002, 133, 583–593. [Google Scholar] [CrossRef]
- Kietzer, S.C.; Goforth, R.R. Salamander diversity alters stream microinvertebrate community structure. Freshwater Biol. 2013, 58, 2114–2125. [Google Scholar] [CrossRef]
- Munshaw, R.G.; Palen, W.J.; Courcelles, D.M.; Finlay, J.C. Predator-driven nutrient recycling in California stream ecosystems. PLoS One 2013, 8, e58542. [Google Scholar] [CrossRef] [PubMed]
- Davic, R.D.; Welsh, H.H., Jr. On the ecological roles of salamanders. Ann. Rev. Ecol. Syst. 2004, 35, 405–435. [Google Scholar] [CrossRef]
- Wyman, R.L. Experimental assessment of salamanders as predators of detrital food webs: Effects on invertebrates, decomposition and the carbon cycle. Biodivers. Conserv. 1998, 7, 641–650. [Google Scholar] [CrossRef]
- Best, M.L.; Welsh, H.H., Jr. The trophic role of a forest salamander: Impacts on invertebrates, leaf litter retention, and the humification process. Ecosphere 2013, 5, art16. [Google Scholar] [CrossRef]
- Stuart, S.N.; Chanson, J.S.; Cox, N.A.; Young, B.E.; Rodrigues, A.S.L.; Fischman, D.L.; Waller, R.W. Status and trends of amphibian declines and extinctions worldwide. Science 2004, 306, 1783–1786. [Google Scholar] [CrossRef] [PubMed]
- Houlahan, J.E.; Findlay, C.S.; Schmidt, B.R.; Meyer, A.H.; Kuzmin, S.L. Quantitative evidence for global amphibian population declines. Nature 2000, 404, 752–755. [Google Scholar] [CrossRef] [PubMed]
- Collins, J.P.; Storfer, A. Global amphibian declines: Sorting the hypotheses. Divers. Distrub. 2003, 9, 89–98. [Google Scholar] [CrossRef]
- Hof, C.; Araújo, M.B.; Jetz, W.; Rabhek, C. Additive threats from pathogens, climate and land-use change for global amphibian diversity. Nature 2011, 480, 516–521. [Google Scholar] [PubMed]
- Corn, P.S. Climate change and amphibians. Anim. Biodivers. Conserv. 2005, 28, 59–67. [Google Scholar]
- Southerland, M.T.; Jung, R.E.; Baxter, D.P.; Chellman, I.C.; Mercurio, G.; Volstad, J.H. Stream salamanders as indicators of stream quality in Maryland, USA. Appl. Herpetol. 2004, 2, 23–46. [Google Scholar] [CrossRef]
- Barrett, K.; Guyer, C. Differential responses of amphibians and reptiles in riparian and stream habitats to land use disturbances in western Georgia, USA. Biol. Conserv. 2008, 9, 2290–2300. [Google Scholar] [CrossRef]
- Semlitsch, R.D.; Todd, B.D.; Blomquist, S.M.; Calhoun, A.J.K.; Gibbons, J.W.; Gibbs, J.P.; Graeter, G.J.; Harper, E.B.; Hocking, D.J.; Hunter, M.L., Jr.; et al. Effects of timber harvest on amphibian populations: Understanding the mechanisms from forest experiments. BioScience 2009, 59, 853–862. [Google Scholar] [CrossRef]
- Tilghman, J.M.; Ramee, S.W.; Marsh, D.M. Meta-analysis of the effects of canopy removal on terrestrial salamander populations in North America. Biol. Conserv. 2012, 152, 1–9. [Google Scholar] [CrossRef]
- Weinstein, S.B. An aquatic disease on a terrestrial salamander: Individual and population level effects of the amphibian chytrid fungus, Batrachochytrium dendrobatidis, on Batrachoceps attenuatus (Plethodontidae). Copeia 2009, 2009, 653–660. [Google Scholar] [CrossRef]
- Martel, A.; Blooi, M.; Adriaensen, C.; Rooij, V.P.; Beukema, P.W.; Fisher, M.C.; Farrer, A.R.; Schmidt, B.R.; Tobler, U.; Goka, K.; et al. Recent introduction of a chytrid fungus endangers western Palearctic salamanders. Science 2014, 31, 630–631. [Google Scholar] [CrossRef]
- Welsh, H.H., Jr.; Hodgson, G.R. Woodland salamanders as metrics of forest ecosystem recovery: A case study from California’s redwoods. Ecosphere 2013, 4, art59. [Google Scholar] [CrossRef]
- Walther, G.; Post, E.; Convey, P.; Menzel, A.; Parmesan, C.; Beebee, T.J.C.; Fromentin, J.-M.; Hoegh-Guldberg, O.; Bairlein, F. Ecological responses to recent climate change. Nature 2002, 416, 389–395. [Google Scholar] [CrossRef] [PubMed]
- Parmesan, C.; Yohe, G. A globally coherent fingerprint of climate change impacts across natural systems. Nature 2003, 42, 37–42. [Google Scholar] [CrossRef]
- Tingley, M.W.; Monahan, W.B.; Beissinger, S.R.; Moritz, C. Birds track their Grinnelian niche throughout a century of climate change. Proc. Natl. Acad. Sci. USA 2009, 106, 19637–19643. [Google Scholar] [CrossRef] [PubMed]
- Kroschel, W.A.; Sutton, W.B.; McClure, C.J.W.; Pauley, T.K. Decline of the Cheat Mountain salamander over a 32-year period and the potential influence of competition from a sympatric species. J. Herpetol. 2014, 48, 415–422. [Google Scholar] [CrossRef]
- Walker, B.; Holling, C.S.; Carpenter, S.R.; Kinzig, A. Resilience, adaptability and transformability in social-ecological systems. Ecol. Soc. 2004, 9, 5. [Google Scholar]
- Ackerly, D.D.; Loarie, S.R.; Cornwell, W.K.; Weiss, S.B.; Hamilton, H.; Branciforte, R.; Kraft, N.J.B. The geography of climate change: Implications for conservation biogeography. Divers. Distrib. 2010, 16, 476–487. [Google Scholar] [CrossRef]
- Dobrowski, S.Z. A climatic basis for microrefugia: The influence of terrain on climate. Glob. Chang. Biol. 2010, 17, 1022–1035. [Google Scholar] [CrossRef]
- Foster, D.R.; Motzkin, G.; Slater, B. Land-use history as long-term broad-scale disturbance: Regional forest dynamics in central New England. Ecosystems 1998, 1, 96–119. [Google Scholar] [CrossRef]
- Hayhoe, K.; Wake, C.; Anderson, B.; Liang, X.; Mauer, E.; Zhu, J.; Bradbury, J.; DeGaetano, A.; Stoner, A.M.; Wuebbles, D. Regional climate change projections for the northeast USA. Mitig. Adapt. Strat. Glob. Chang. 2007, 13, 425–436. [Google Scholar] [CrossRef]
- Huntington, T.G.; Richardson, A.D.; McGuire, K.J.; Hayhoe, K. Climate and hydrological changes in the northeastern United States: Recent trends and implications for forested and aquatic ecosystems. Can. J. For. Res. 2009, 39, 199–212. [Google Scholar] [CrossRef]
- Milanovich, J.R.; Peterman, W.E.; Nibblelink, N.P.; Maerz, J.C. Projected loss of a salamander diversity hotspot as a consequence of projected global climate change. PLoS One 2010, 5, e12189. [Google Scholar] [CrossRef] [PubMed]
- Barrett, K.; Nibbelink, N.P.; Maerz, J.C. Identifying priority species and conservation opportunities under future climate scenarios: Amphibians in a biodiversity hotspot. J. Fish Wildl. Manag. 2014, 5, 282–297. [Google Scholar] [CrossRef]
- Ashcroft, M.B. Identifying refugia from climate change. J. Biogeogr. 2010, 37, 1407–1413. [Google Scholar]
- NEPARC. Northeast Amphibian and Reptile Species of Regional Responsibility and Conservation Concern. Available online: http://www.northeastparc.org/products/pdfs/NEPARC_NEspeciesofresponsibility.pdf (accessed on 23 April 2013).
- Overland, J.E.; Wang, M.; Bond, N.A.; Walsh, J.E.; Kattsov, V.M.; Chapman, W.L. Considerations in the selection of global climate models for regional climate projections: The Arctic as a case study. J. Clim. 2011, 24, 1583–1597. [Google Scholar] [CrossRef]
- Van Vuuren, D.P.; Edmonds, J.; Kainuma, M.; Riahi, K.; Thomson, A.; Hibbard, K.; Hurtt, G.C.; Kram, T.; Krey, V.; Lamarque, J.-F.; et al. The representative concentration pathways: An overview. Clim. Chang. 2011, 109, 5–31. [Google Scholar] [CrossRef]
- Hijmans, R.J.; Cameron, S.E.; Parra, J.L.; Jones, P.G.; Jarvis, A. Very high resolution interpolated climate surfaces for global land areas. Int. J. Climatol. 2005, 25, 1965–1978. [Google Scholar] [CrossRef]
- Rissler, L.J.; Apodaca, A.A. Adding more ecology into species delimitation: Ecological niche models and phylogeography help define cryptic species in the black salamander (Aneides flavipunctatus). Syst. Biol. 2007, 56, 924–942. [Google Scholar] [CrossRef] [PubMed]
- Milanovich, J.R.; Peterman, W.E.; Barrett, K.; Hopton, M.E. Do species distribution models predict species richness in urban and natural green spaces? A case study using amphibians. Landsc. Urban Plan. 2012, 107, 409–418. [Google Scholar] [CrossRef]
- Phillips, S.J.; Anderson, R.P.; Schapire, R.E. Maximum entropy modeling of species geographic distributions. Ecol. Model. 2006, 190, 231–259. [Google Scholar] [CrossRef]
- Elith, J.; Graham, C.H. Do they? How do they? Why do they differ? On finding reasons for differing performances of species distribution models. Ecography 2009, 32, 66–77. [Google Scholar] [CrossRef]
- MacKenzie, D.I.; Nichols, J.D.; Royle, J.A.; Pollock, K.H.; Bailey, L.L.; Hines, J.E. Occupancy Estimation and Modeling: Inferring Patterns and Dynamics of Species Occurrence; Elsevier-Academic Press: Amsterdam, The Netherlands, 2006; p. 324. [Google Scholar]
- Kramer-Schadt, S.; Niedballa, J.; Pilgrim, N.J.; Schröder, B.; Lindenborn, J.; Reinfelder, V.; Stillfried, M.; Heckmann, I.; Scharf, A.K.; Augeri, D.M.; et al. The importance of correcting for sampling bias in MaxEnt species distribution models. Divers. Distrib. 2013, 2013, 1366–1379. [Google Scholar] [CrossRef]
- Phillips, S.J.; Dudík, M.; Elith, J.; Graham, C.H.; Lehmann, A.; Leathwick, J.; Ferrier, S. Sample selection bias and presence-only distribution models: Implications for background and pseudo-absence data. Ecol. Appl. 2009, 19, 181–197. [Google Scholar] [CrossRef] [PubMed]
- Lobo, J.M.; Jiménez-Valverde, A.; Real, R. AUC: A misleading measure of the performance of predictive distribution models. Global Ecol. Biogeogr. 2007, 17, 145–151. [Google Scholar] [CrossRef]
- Baldwin, R.A. Use of maximum entropy modeling in wildlife research. Entropy 2009, 11, 854–866. [Google Scholar] [CrossRef]
- Jiménez-Valverde, A. Insights into the area under the receiver operator characteristic curve (AUC) as a discrimination measure in species distribution modelling. Global Ecol. Biogeogr. 2012, 21, 498–507. [Google Scholar] [CrossRef]
- Araújo, M.B.; New, M. Ensemble forecasting of species distributions. Trends Ecol. Evol. 2006, 22, 42–47. [Google Scholar] [CrossRef] [PubMed]
- Schwartz, M.W.; Iverson, L.R.; Prasad, A.M.; Matthews, S.N.; O’Connor, R.J. Predicting extinctions as a result of climate change. Ecology 2006, 87, 1611–1615. [Google Scholar] [CrossRef] [PubMed]
- Austin, M.P.; van Niel, K.P. Improving species distribution models for climate change studies: Variable selection and scale. J. Biogeogr. 2010, 38, 1–8. [Google Scholar] [CrossRef]
- Araújo, M.B.; Peterson, A.T. Uses and misuses of bioclimatic envelope modeling. Ecology 2012, 93, 1527–1539. [Google Scholar] [CrossRef] [PubMed]
- Wells, K.D. The Ecology and Behavior of Amphibians; The University of Chicago Press: Chicago, IL, USA, 2007. [Google Scholar]
- Feder, M.E. Integrating the ecology and physiology of plethodontid salamanders. Herpetologica 1983, 39, 291–310. [Google Scholar]
- Gifford, M.E.; Kozak, K.H. Islands in the sky or squeezed at the top? Ecological causes of elevational range limits in montane salamanders. Ecography 2012, 35, 193–203. [Google Scholar] [CrossRef]
- Moritz, C.; Patton, J.L.; Conroy, C.J.; Parra, J.L.; White, G.C.; Beissinger, S.R. Impact of a century of climate change on small-mammal communities in Yosemite National Park, USA. Nature 2008, 322, 261–264. [Google Scholar]
- Moskwik, M. Recent elevational range expanses in plethodontid salamanders (Amphibia: Plethodontidae) in the southern Appalachian Mountains. J. Biogeogr. 2014, 41, 1957–1966. [Google Scholar] [CrossRef]
- Rovito, S.M.; Parra-Olea, G.; Vásquez-Alamazán, C.R.; Papenfuss, T.J.; Wake, D.B. Dramatic declines in Neotropical salamander populations are an important part of the global amphibian crisis. Proc. Natl. Acad. Sci. USA 2009, 106, 3231–3236. [Google Scholar] [CrossRef] [PubMed]
- Cheng, T.L.; Rovitok, S.M.; Wake, D.B.; Vredenburg, V.T. Coincident mass extirpation of Neotropical amphibians with the emergence of the infectious fungal pathogen Batrachochytrium dendrobatidis. Proc. Natl. Acad. Sci. USA 2011, 108, 9502–9507. [Google Scholar] [CrossRef] [PubMed]
- Tingley, M.W.; Beissinger, S.R. Detecting range shifts from historical species occurrences: New perspectives on old data. Trends Ecol. Evol. 2009, 24, 625–633. [Google Scholar] [CrossRef] [PubMed]
- Feder, M.E. Environmental variability and thermal acclimation in Neotropical and temperate zone salamanders. Physiol. Zool. 1978, 51, 7–16. [Google Scholar]
- Kearney, M.R.; Wintle, B.A.; Porter, W.P. Correlative and mechanistic models of species distribution provide congruent forecasts under climate change. Conserv. Lett. 2010, 3, 203–213. [Google Scholar] [CrossRef]
- Magness, D.R.; Morton, J.M.; Huettman, F.; Chapin, F.S., III; McGuire, A.D. A climate-change adaptation framework to reduce continental-scale vulnerability across conservation reserves. Ecosphere 2011, 2, art112. [Google Scholar] [CrossRef]
- Hampe, A.; Petit, R. Conserving biodiversity under climate change: The rear edge matters. Ecol. Lett. 2005, 8, 461–467. [Google Scholar] [CrossRef] [PubMed]
- Shoo, L.P.; Olson, D.H.; McMenamin, S.K.; Murray, K.A.; Sluys, M.V.; Donnelly, M.A.; Stratford, D.; Terhivuo, J.; Merino-Viteri1, A.; Herbert, S.M.; et al. Engineering a future for amphibians under climate change. J. Appl. Ecol. 2011, 48, 487–492. [Google Scholar] [CrossRef]
- Bennun, L.A.; Fishpool, L.D.C. Important Bird Areas in Africa. Ostrich 2000, 71, 150–153. [Google Scholar] [CrossRef]
- Sutherland, R.; deMaynadier, P. Model Criteria and Implementation Guidance for a Priority Amphibian and Reptile Conservation Area (PARCA) System in the USA. Available online: http://www.parcplace.org/images/stories/documents/PARCA_System_Criteria_and_Implementation_Guidance_FINAL.pdf (accessed on 18 February 2013).
© 2014 by the authors; licensee MDPI, Basel, Switzerland. This article is an open access article distributed under the terms and conditions of the Creative Commons Attribution license (http://creativecommons.org/licenses/by/4.0/).
