
Modeling Wood Fibre Length in Black Spruce (Picea mariana (Mill.) BSP) Based on Ecological Land Classification

Abstract
:1. Introduction
2. Experimental Section
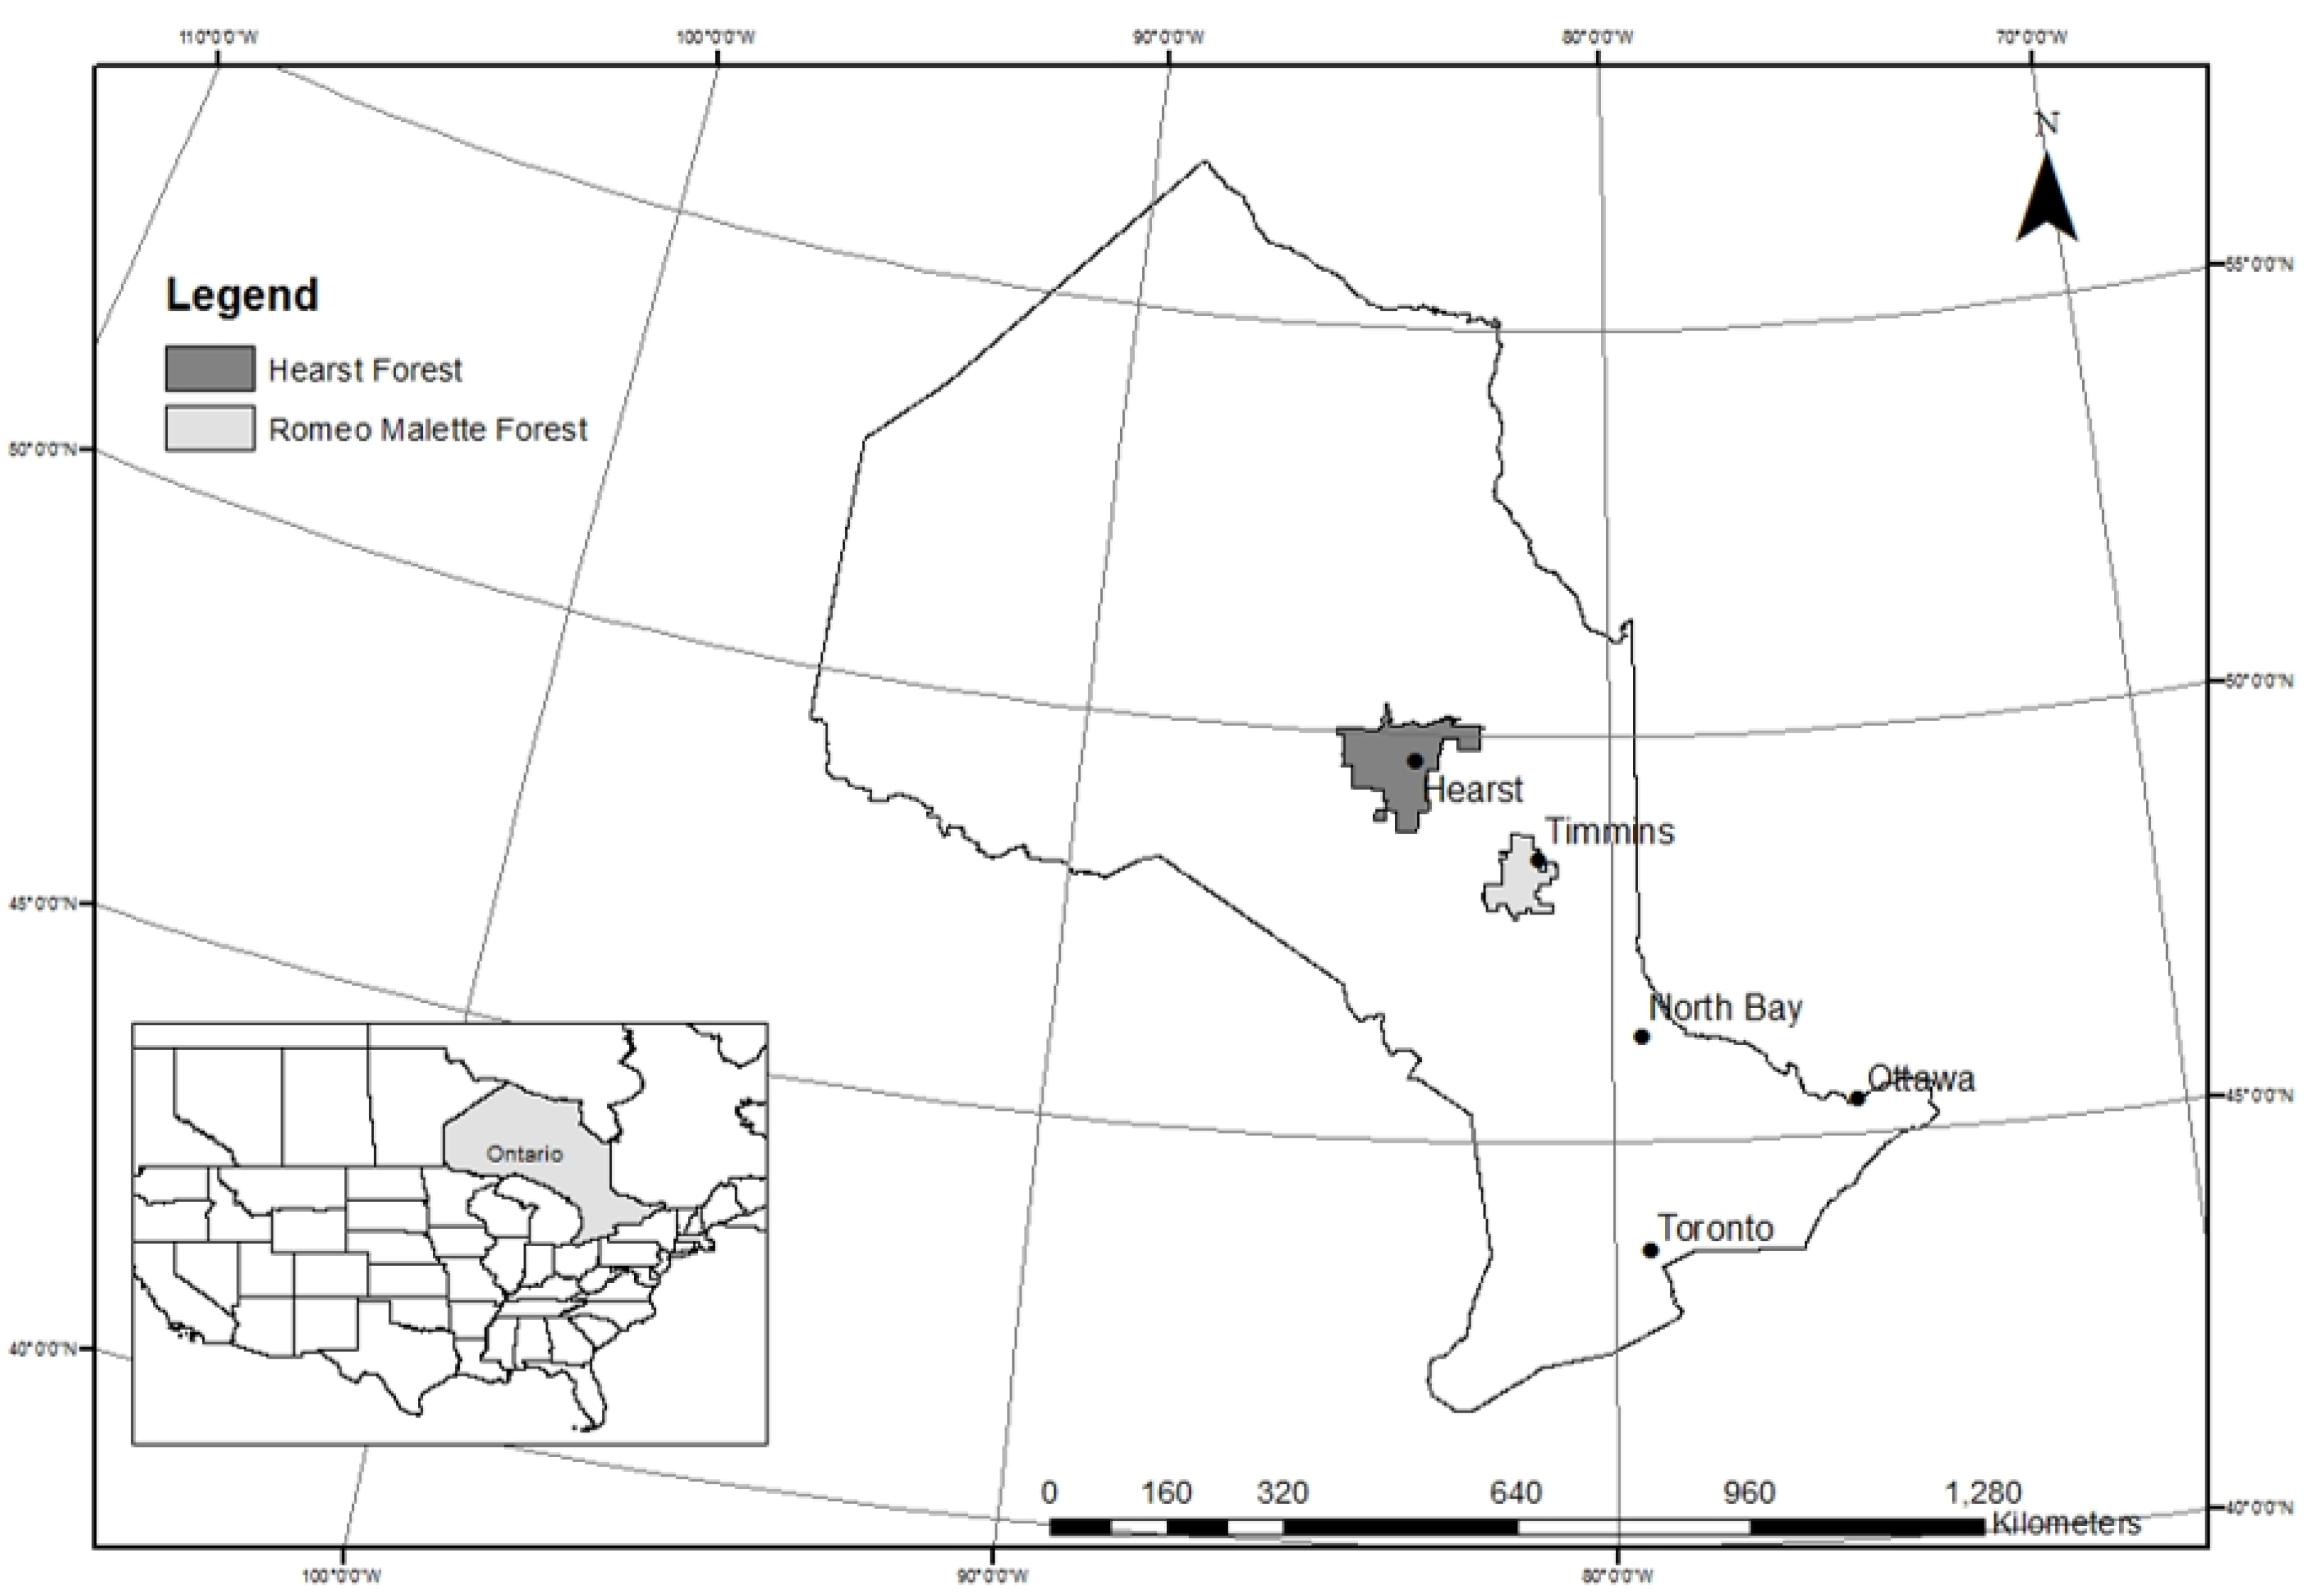
2.1. Study Area Description

2.2. Field Plot Selection
2.3. Increment Core Sample Collection
2.4. Sample Processing
2.5. Data Management and Statistical Analysis
2.5.1. Response Variables
2.5.2. Predictor Variables
2.5.3. Hierarchical Classification Models
3. Results
3.1. Sample Population Description

| Stand-Level Variables | Tree-Level Variables | Fibre Length Variables | |||||||||||
|---|---|---|---|---|---|---|---|---|---|---|---|---|---|
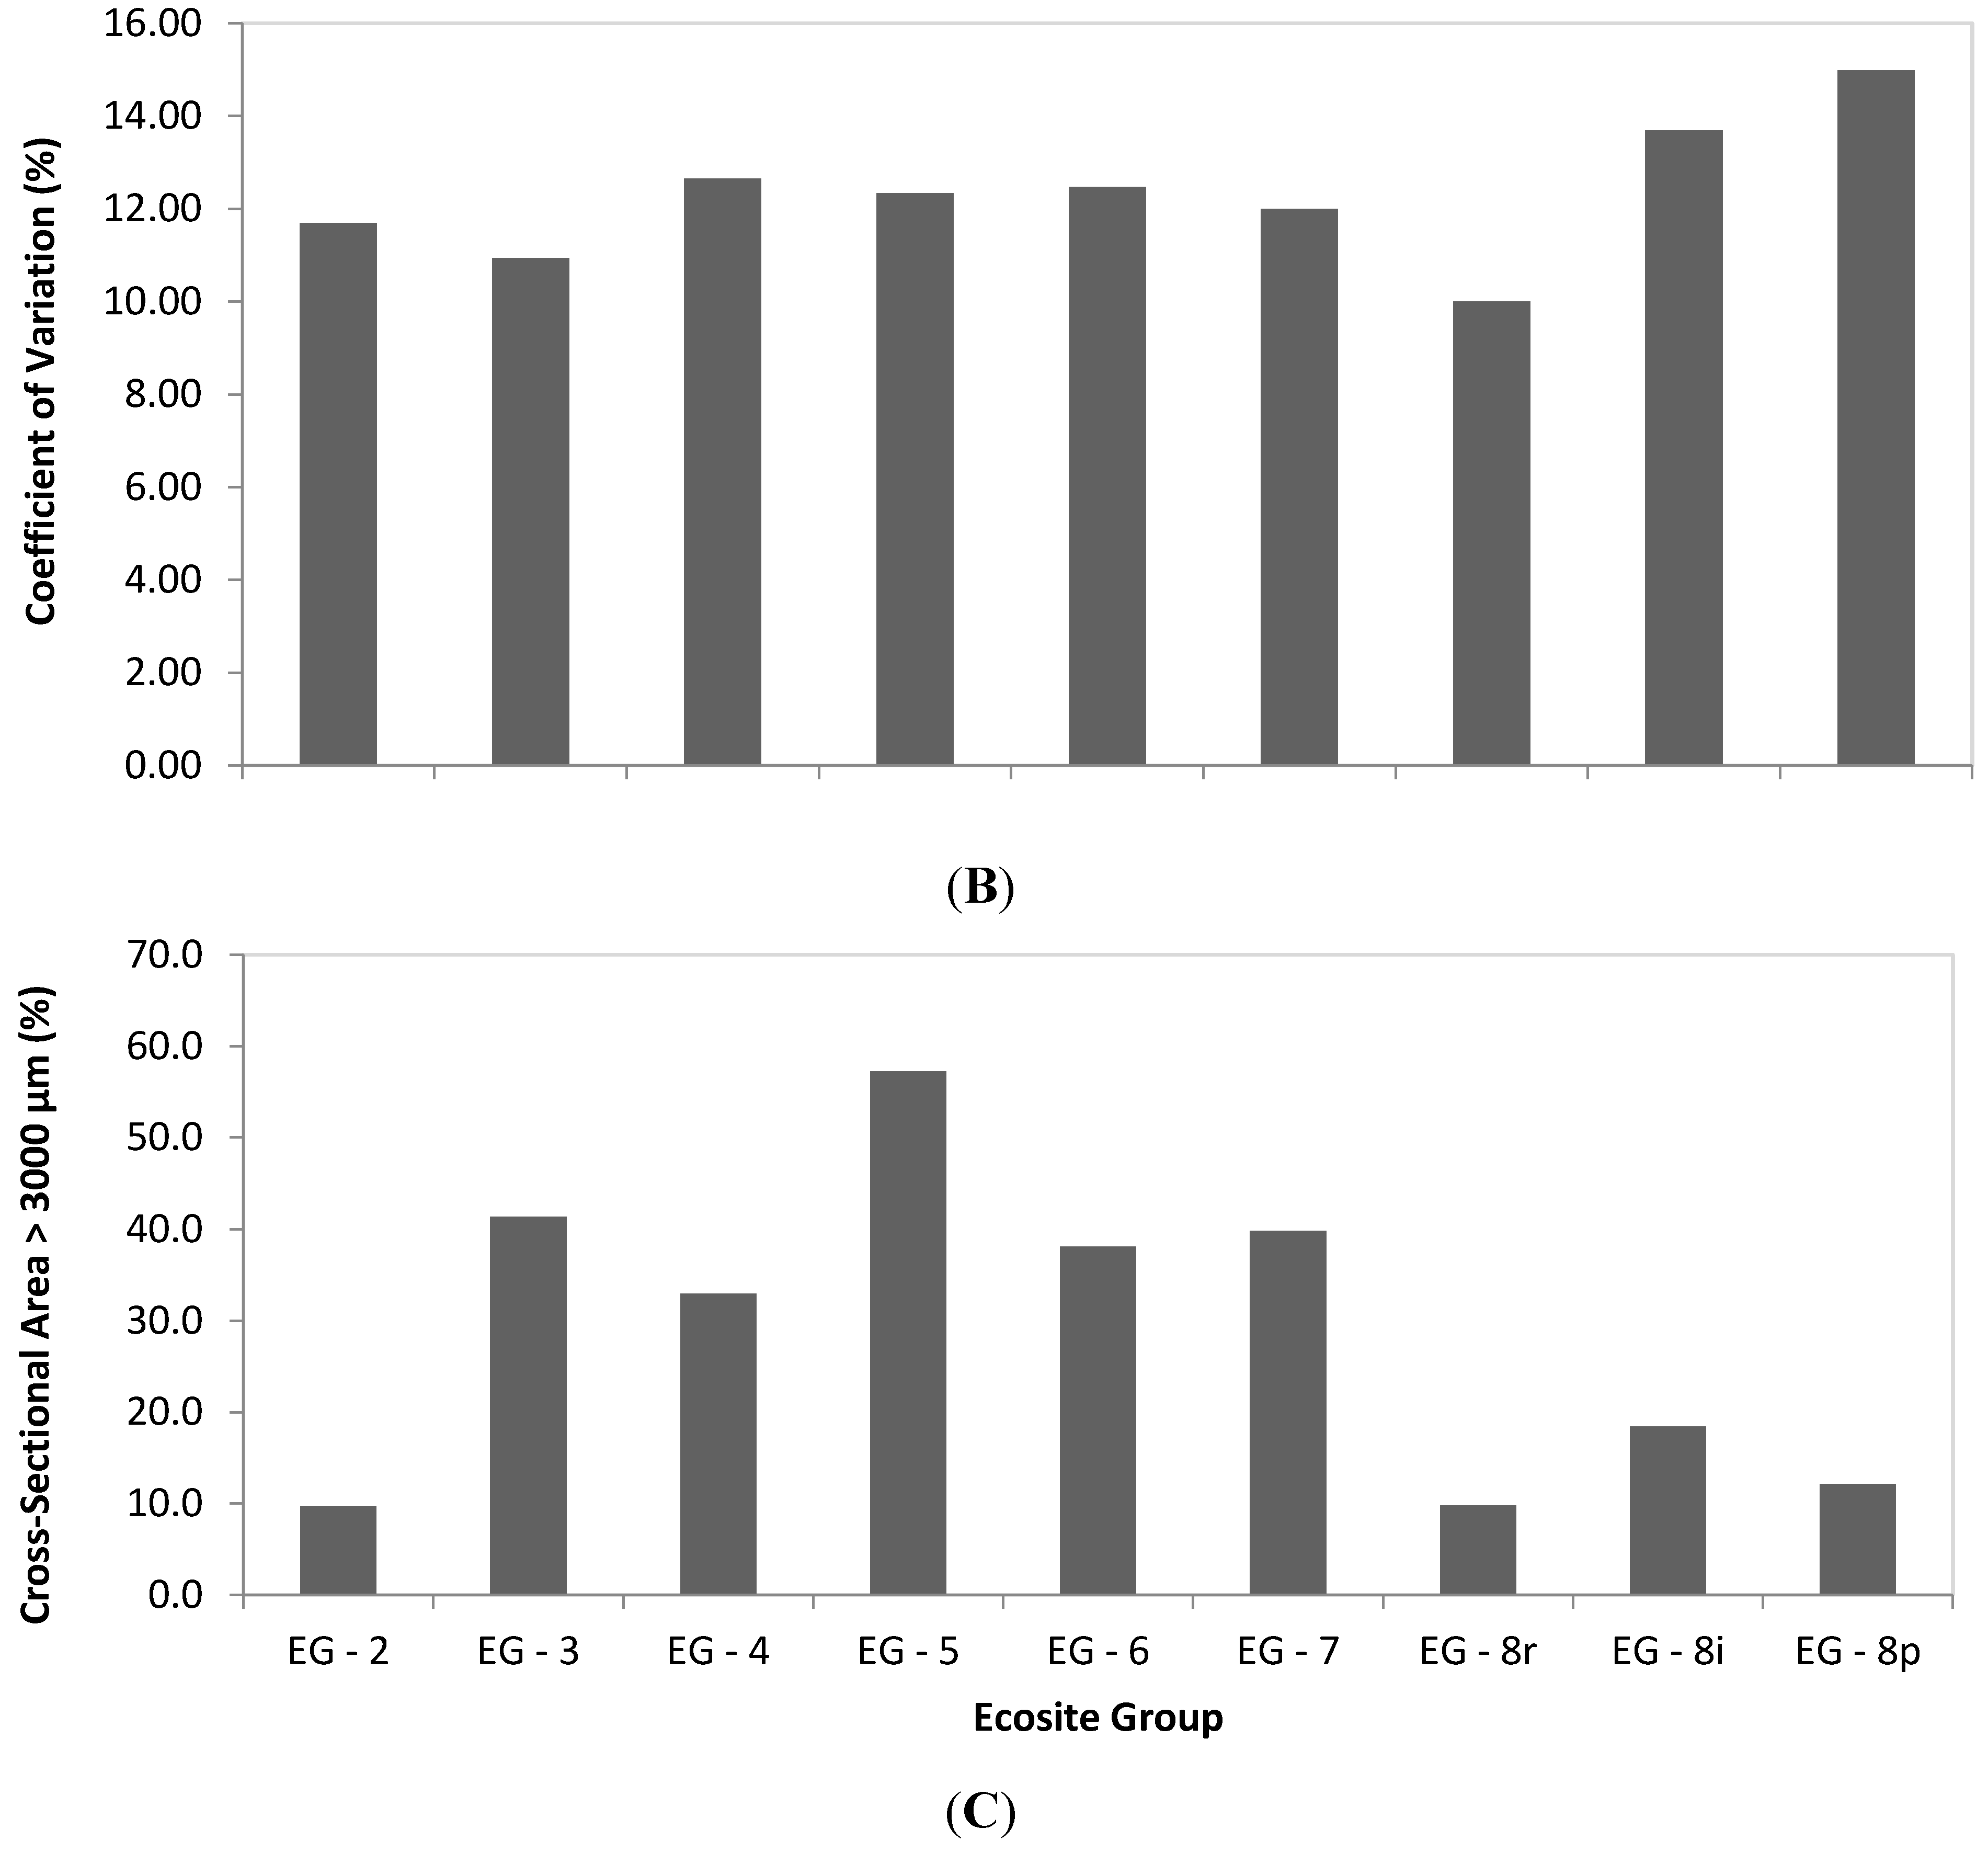
| Ecosites | Basal Area | Stand Density | QMD | Height | DBH | ABH | 1 Crown Diameter | 2 Mean | 3 Std. Dev. | 4 CV | 5 Ideal Fibre | n1 | n2 |
| (m2·ha−1) | (stems·ha−1) | (cm) | (m) | (cm) | (years) | (m) | (μm) | (μm) | % | % | |||
| EG-2 | 36.0 | 1,514 | 18.5 | 15.1 | 17.3 | 81 | 3.21 | 2,678 | 312 | 11.7 | 9.7 | 6 | 2 |
| EG-3 | 32.0 | 1,055 | 20.9 | 14.7 | 18.7 | 82 | 2.99 | 2,604 | 283 | 10.9 | 41.4 | 6 | 3 |
| EG-4 | 48.8 | 2,126 | 17.4 | 19.1 | 21.8 | 76 | 3.6 | 2,836 | 357 | 12.7 | 33.0 | 6 | 2 |
| EG-5 | 28.1 | 1,472 | 15.7 | 14.8 | 18.4 | 66 | 2.97 | 2,815 | 345 | 12.3 | 57.2 | 6 | 3 |
| EG-6 | 38.4 | 1,270 | 22.1 | 16.2 | 20.4 | 83 | 3.61 | 2,849 | 354 | 12.5 | 38.1 | 4 | 3 |
| EG-7 | 34.9 | 1,525 | 17.8 | 17.7 | 20.7 | 65 | 3.14 | 2,842 | 337 | 12.0 | 39.8 | 8 | 7 |
| EG-8r | 35.8 | 1,514 | 17.6 | 16.0 | 22.1 | 118 | 2.59 | 2,384 | 237 | 10.0 | 9.8 | 6 | 5 |
| EG-8i | 24.5 | 1,576 | 14.4 | 14.5 | 16.7 | 82 | 2.54 | 2,644 | 363 | 13.7 | 18.5 | 6 | 5 |
| EG-8p | 30.3 | 1,819 | 14.5 | 13.9 | 15.8 | 99 | 2.39 | 2,431 | 356 | 15.0 | 12.2 | 7 | 6 |
3.2. Comparison of Earlywood and Latewood Fibre Length
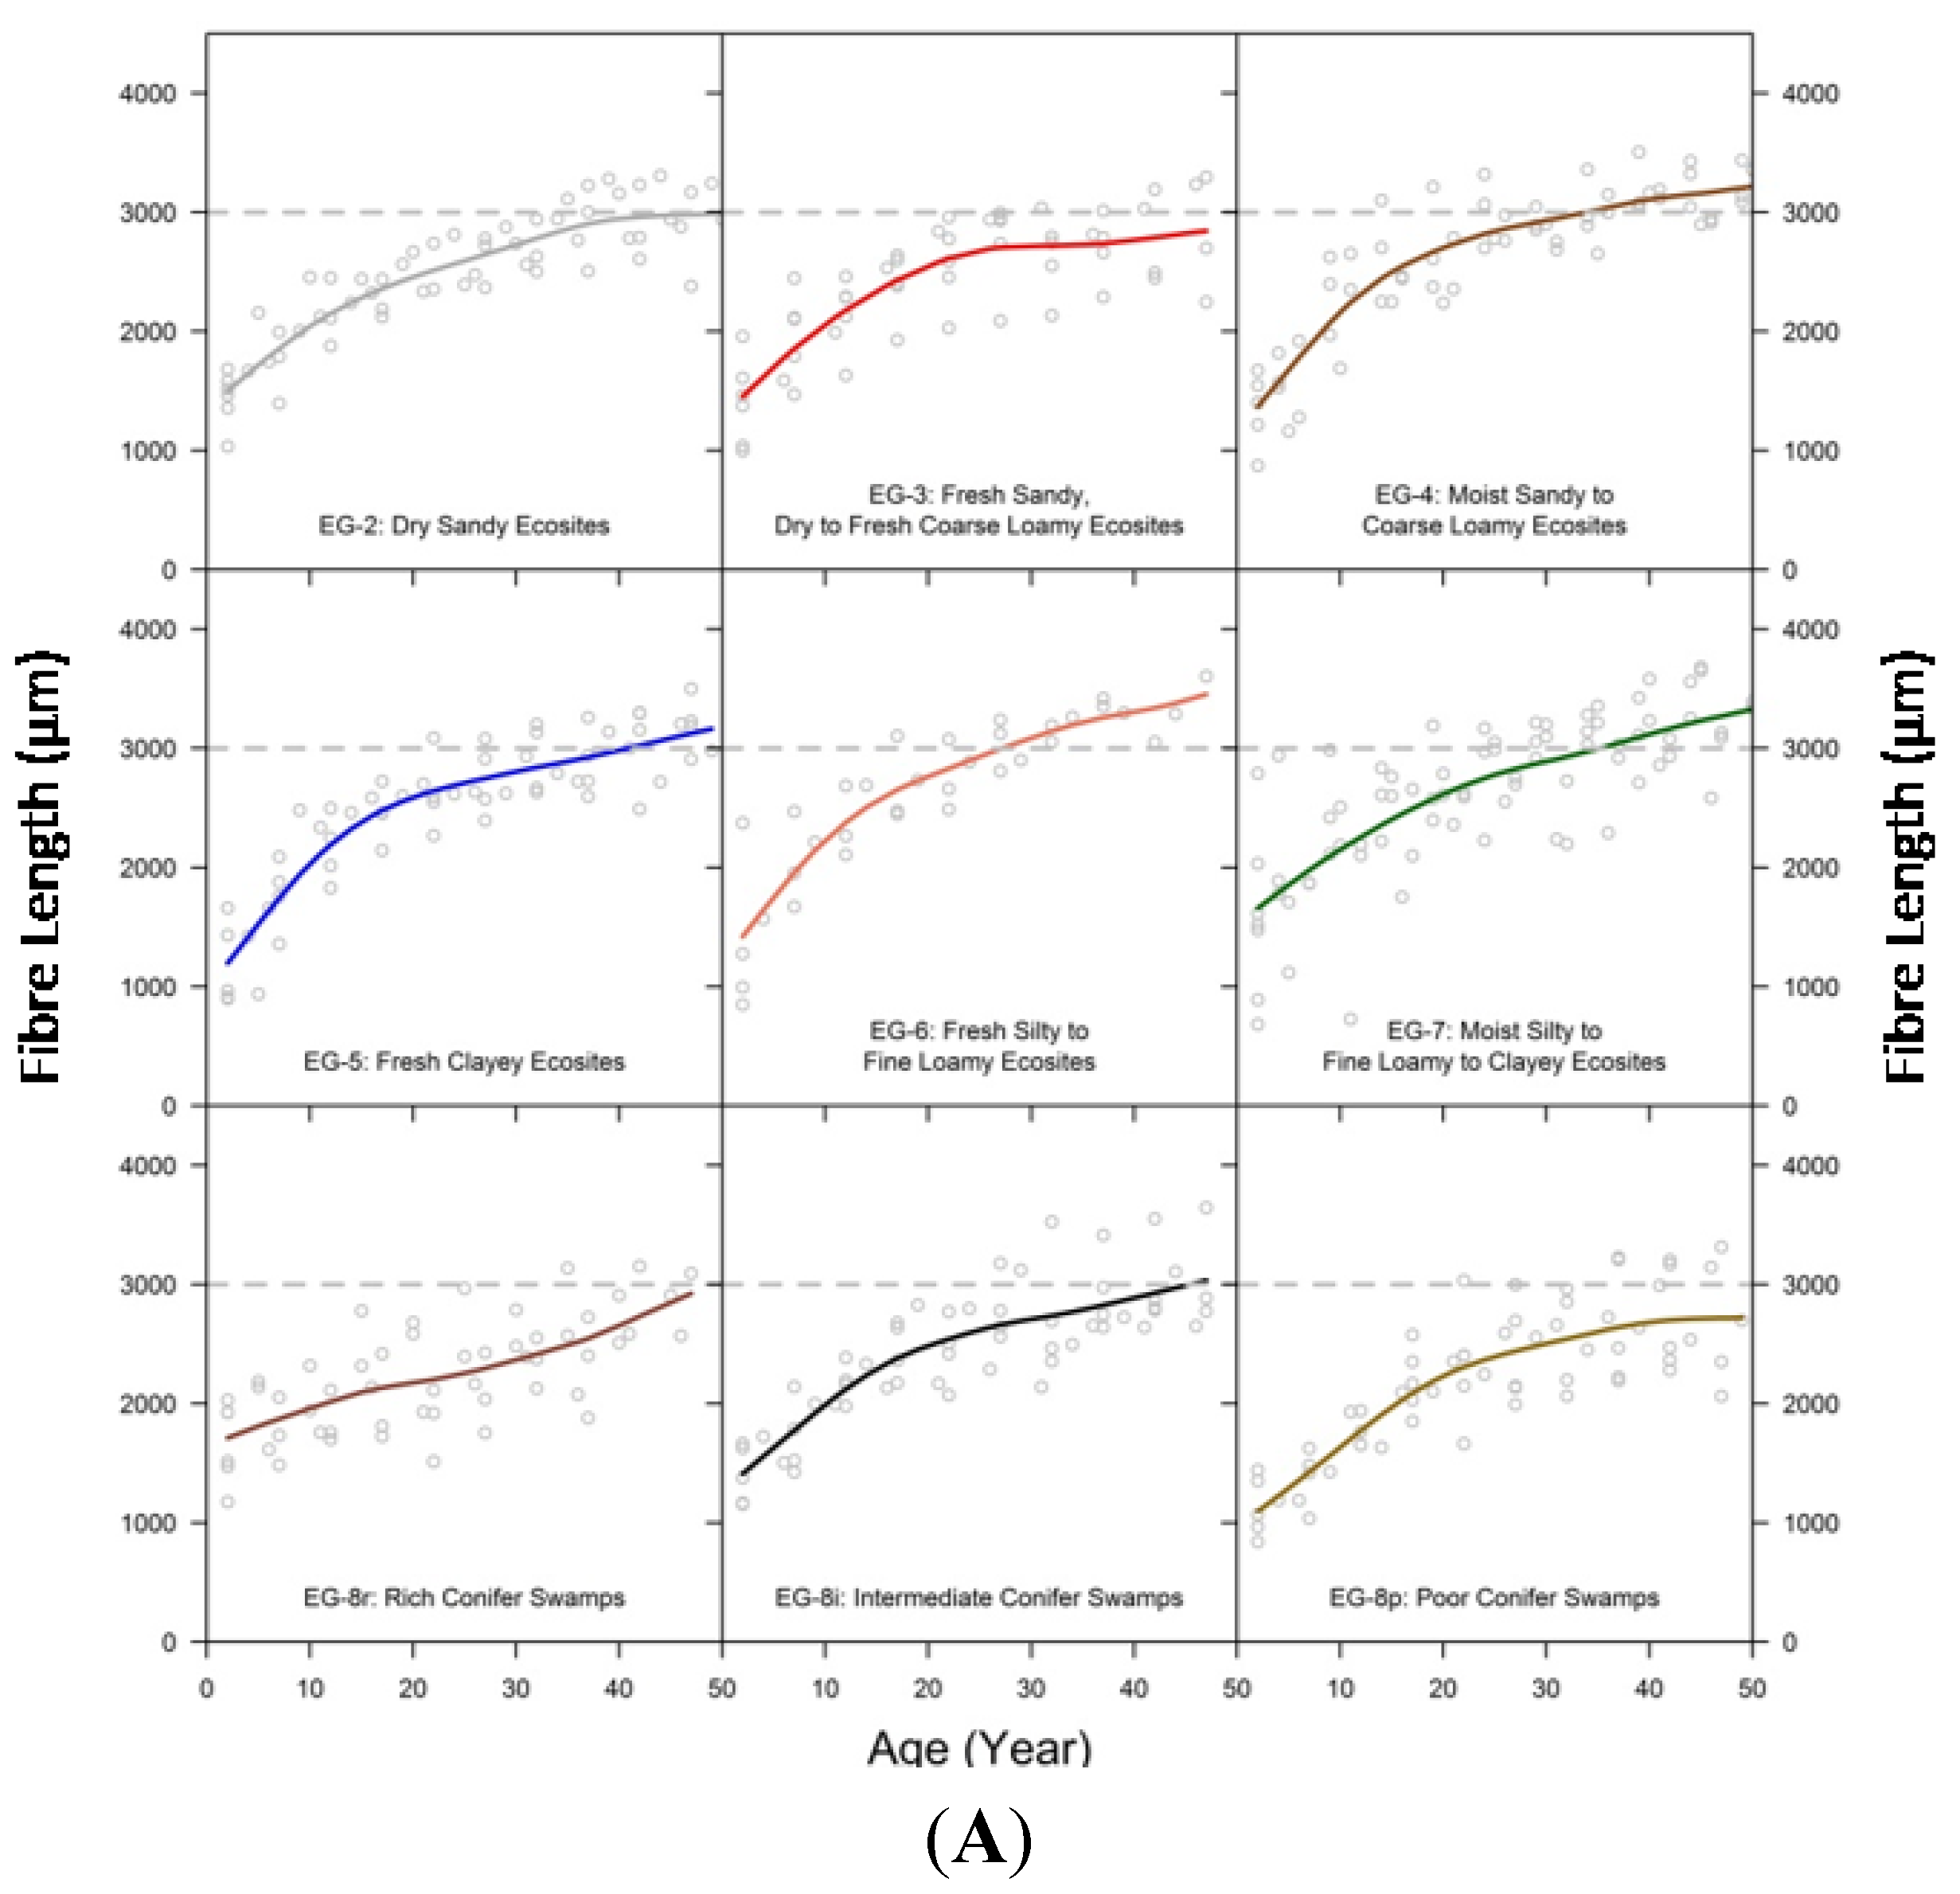
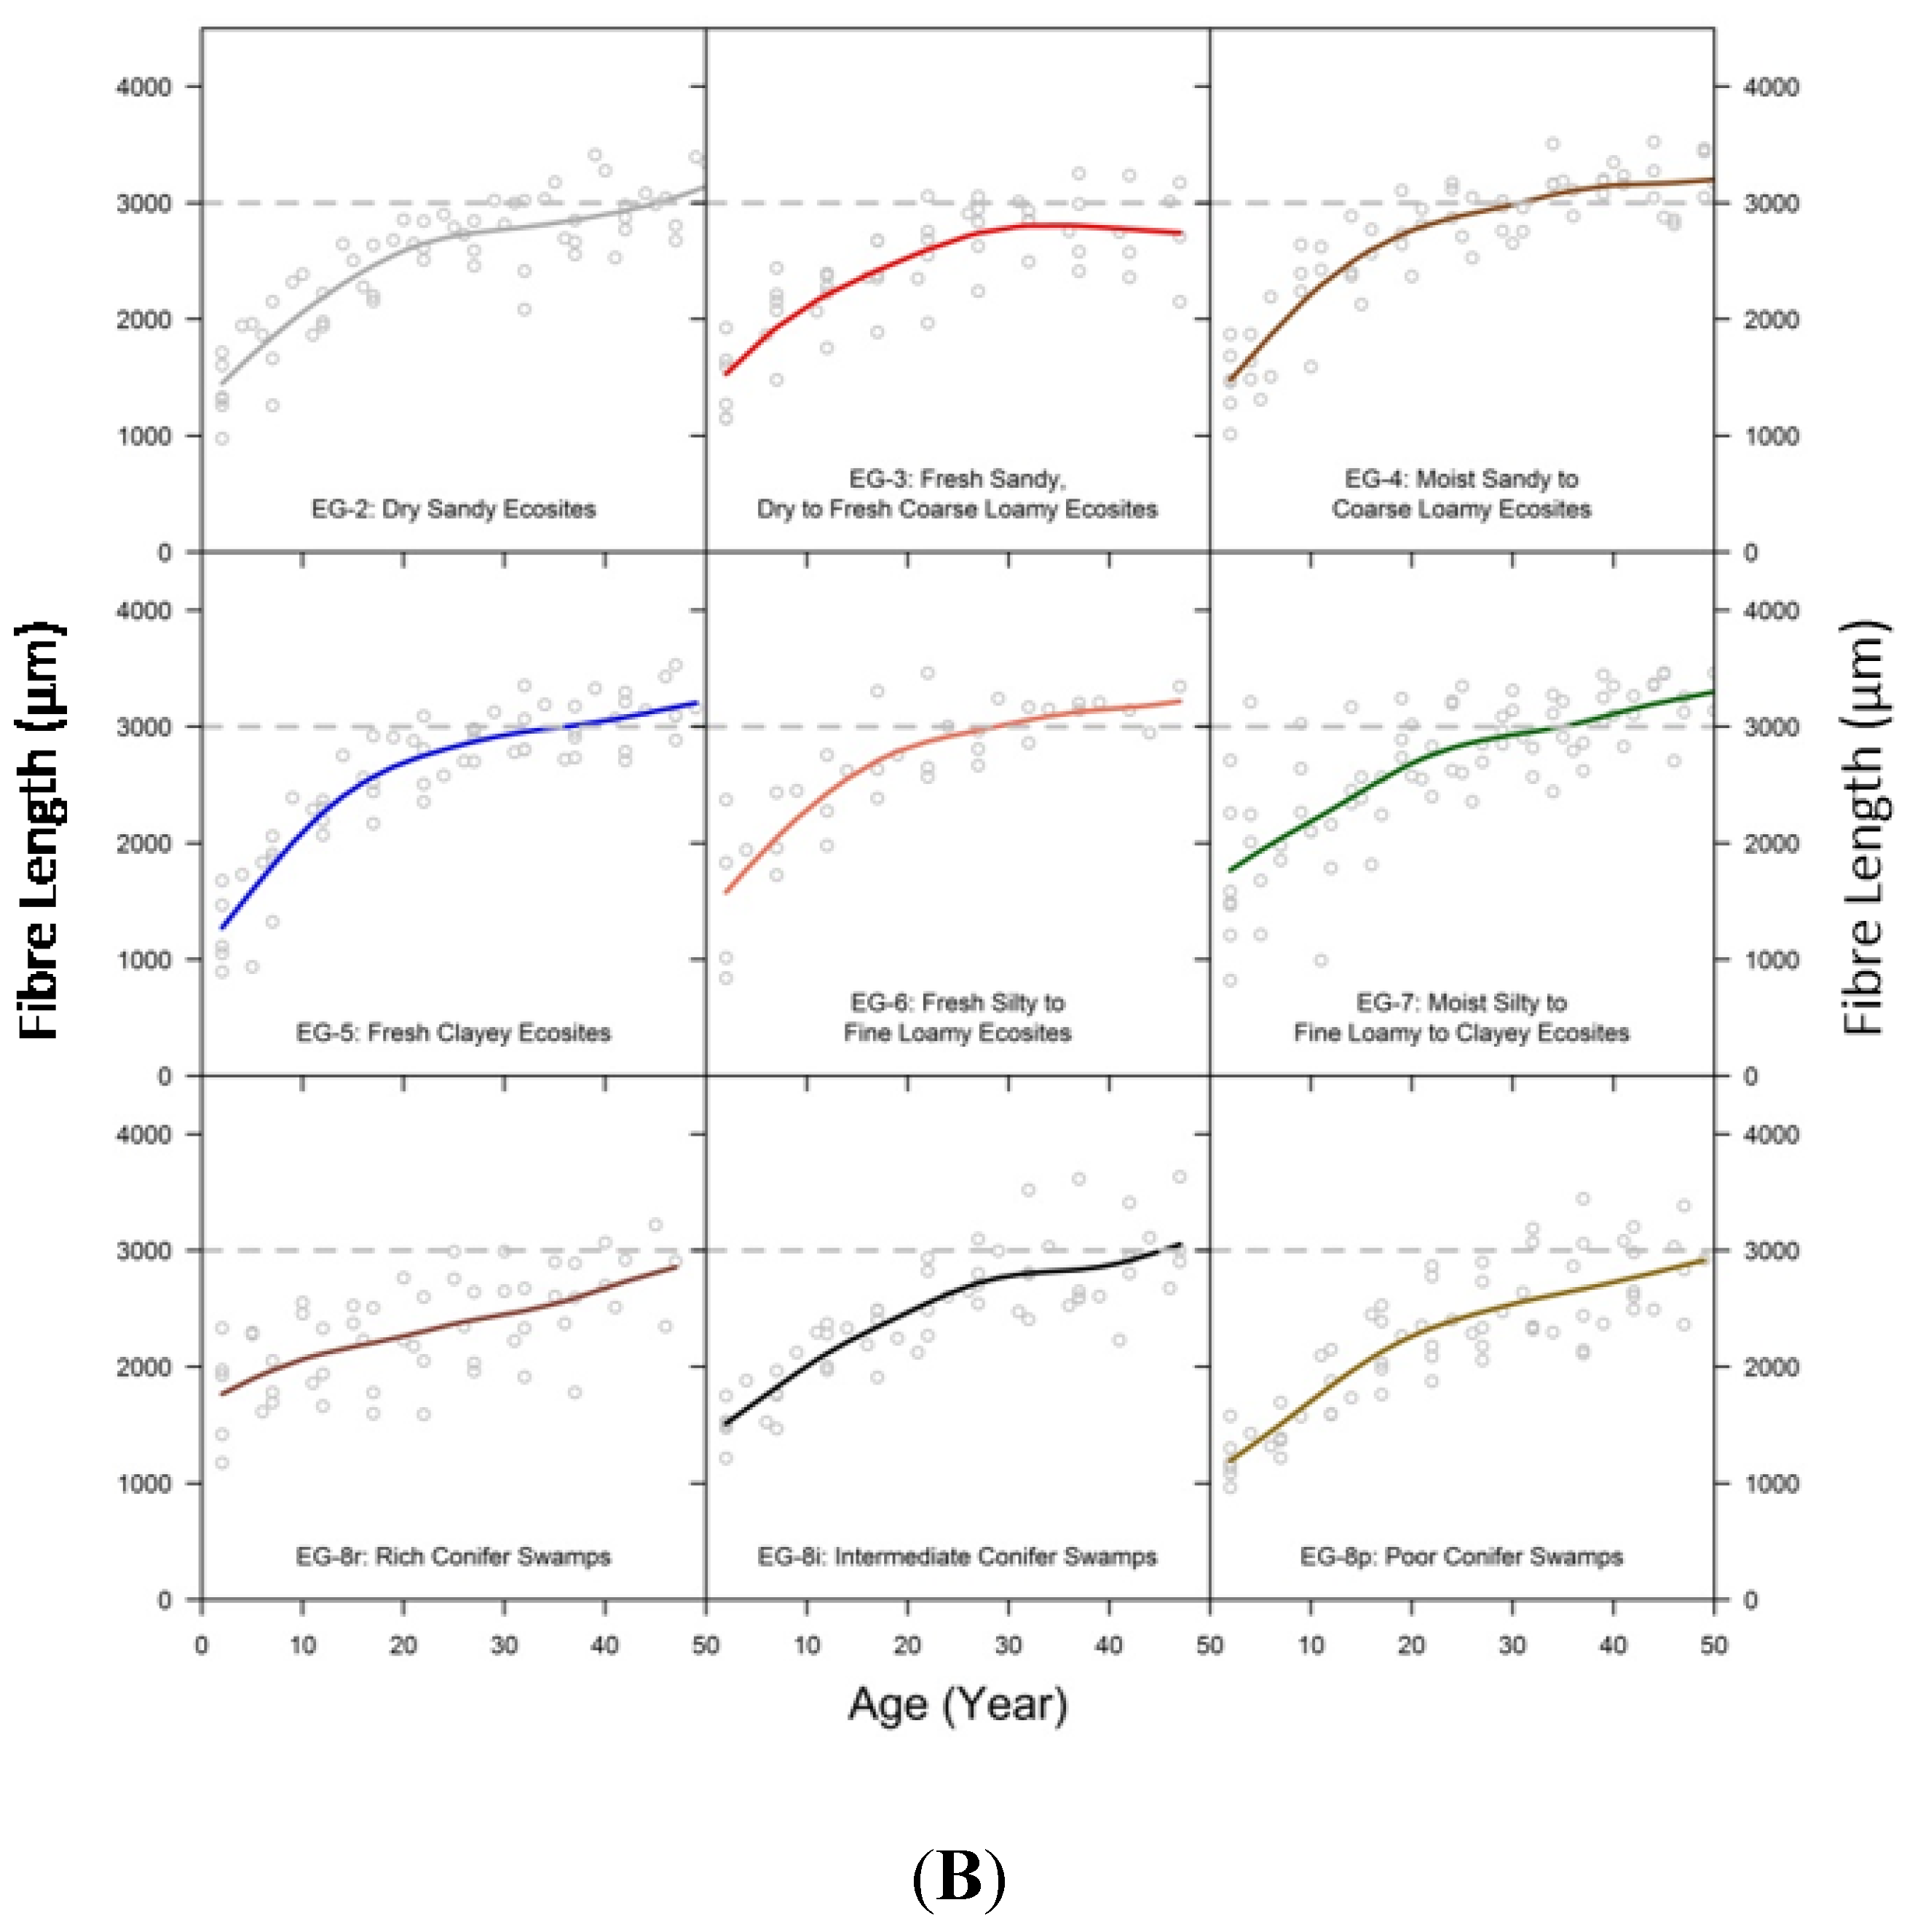
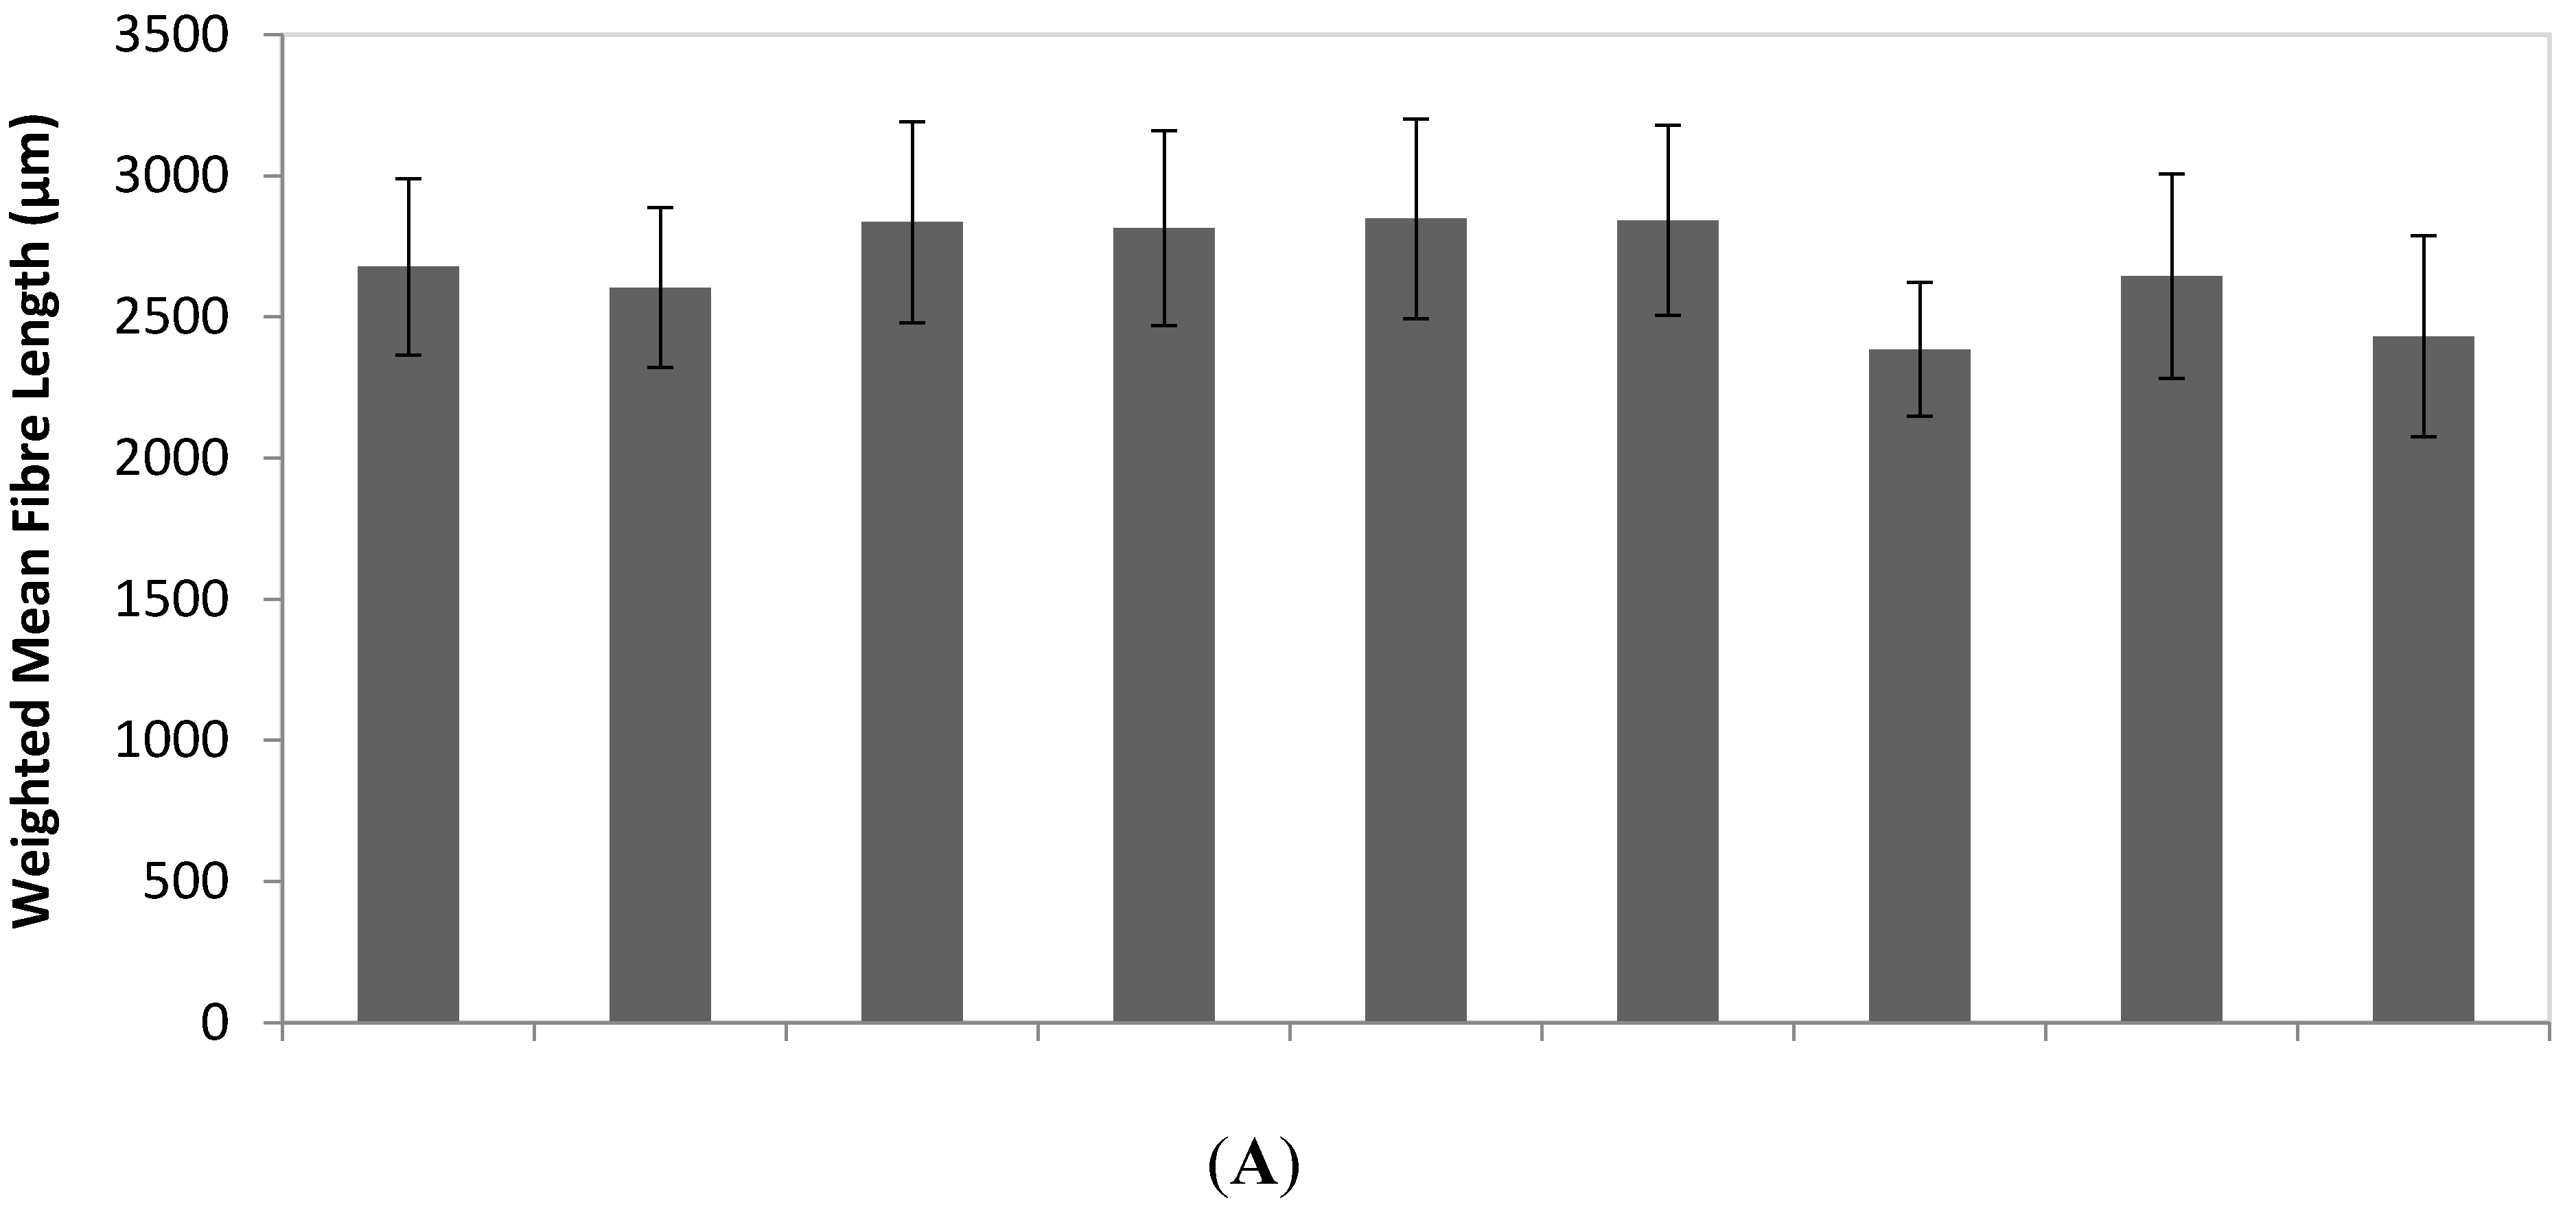
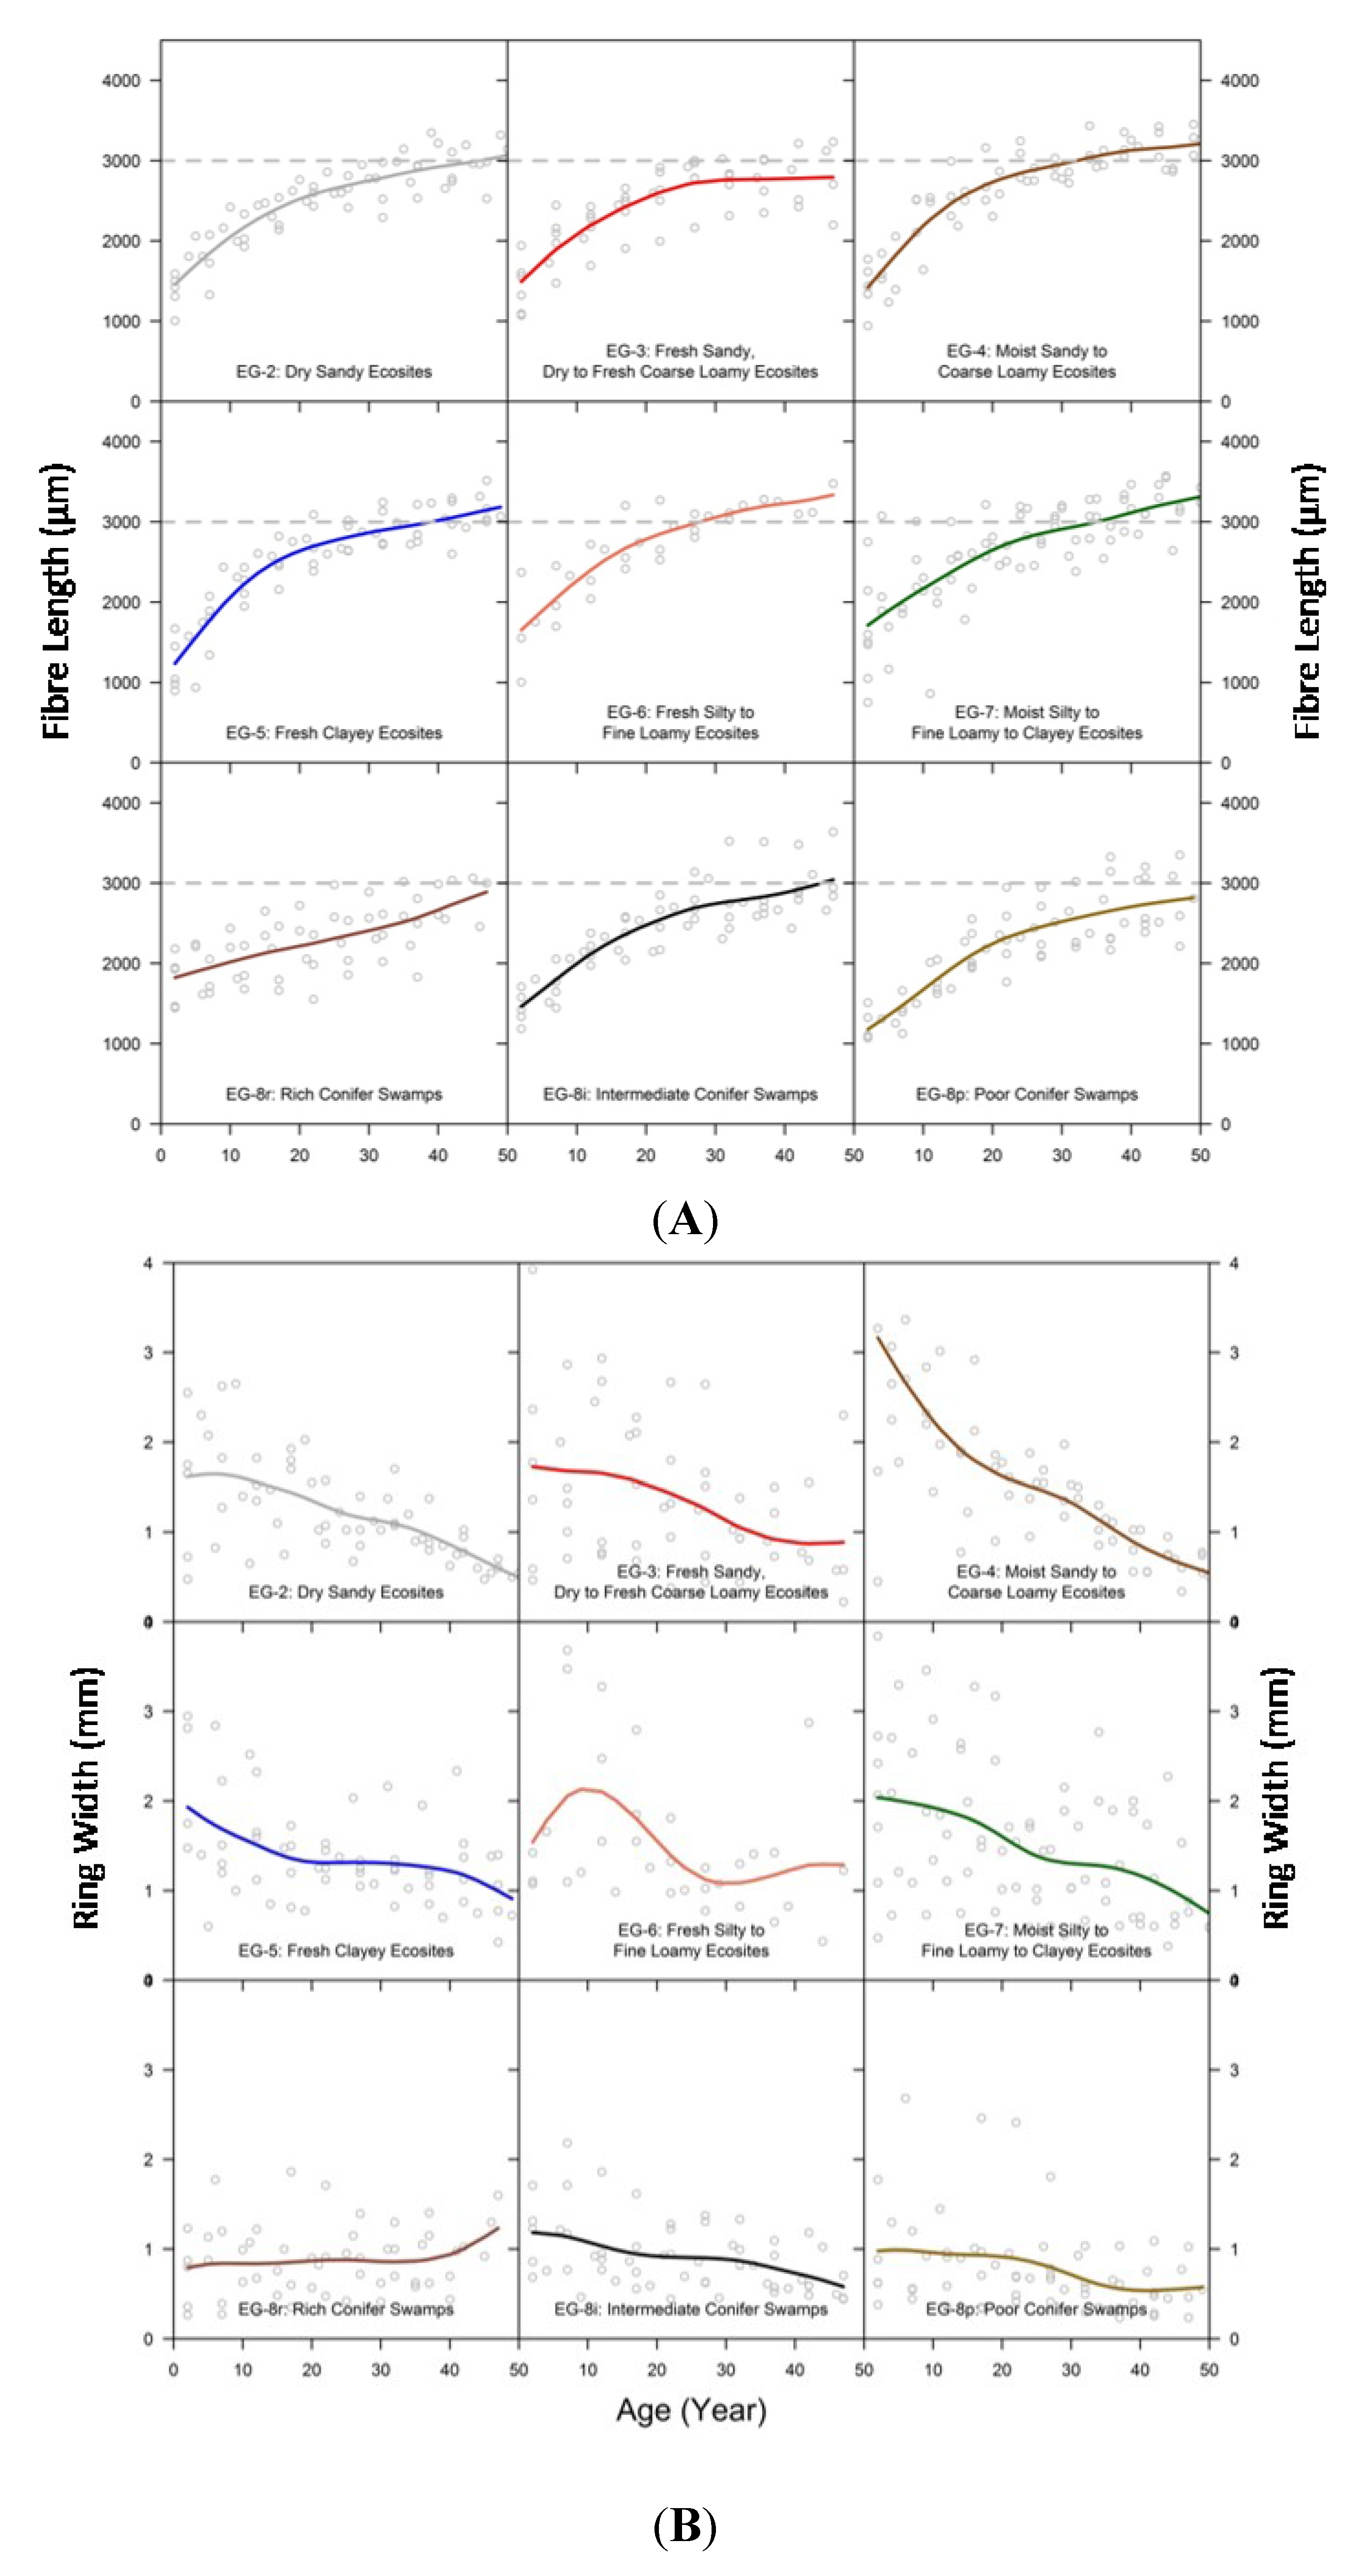
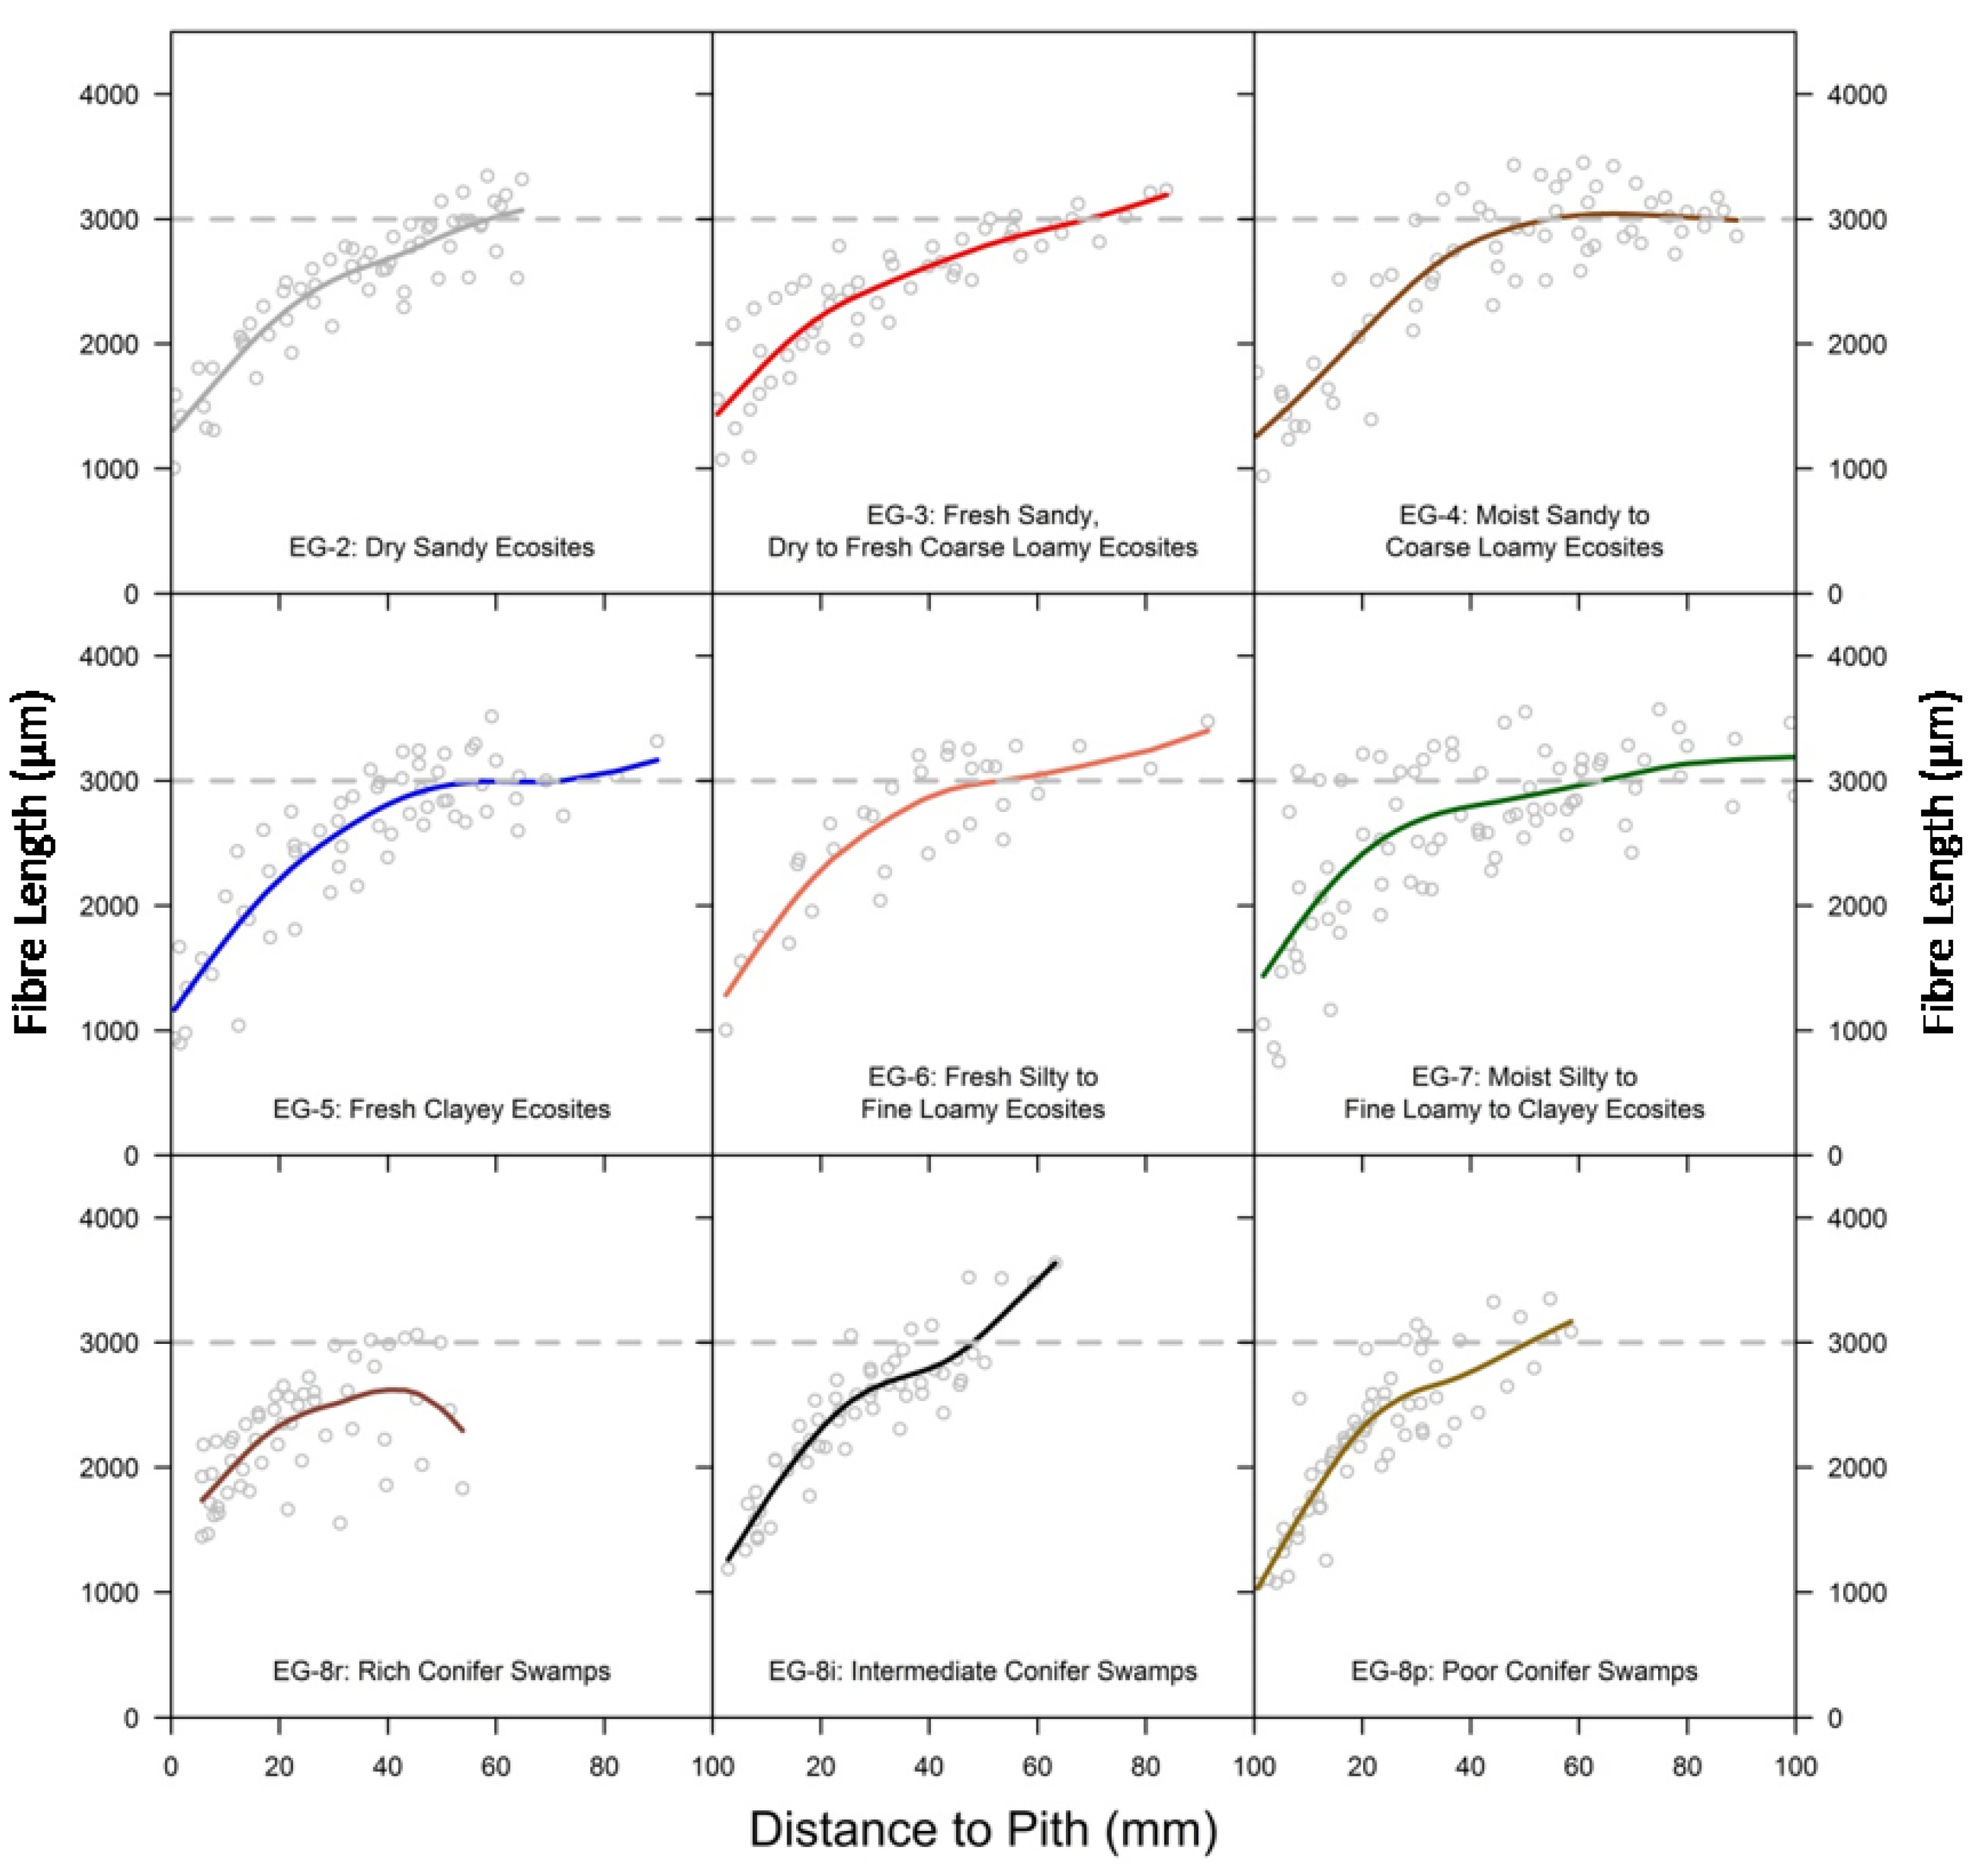
3.3. Comparison of Fibre Length among Ecosite Groups


3.4. Fibre Length in Relation to Crown Width
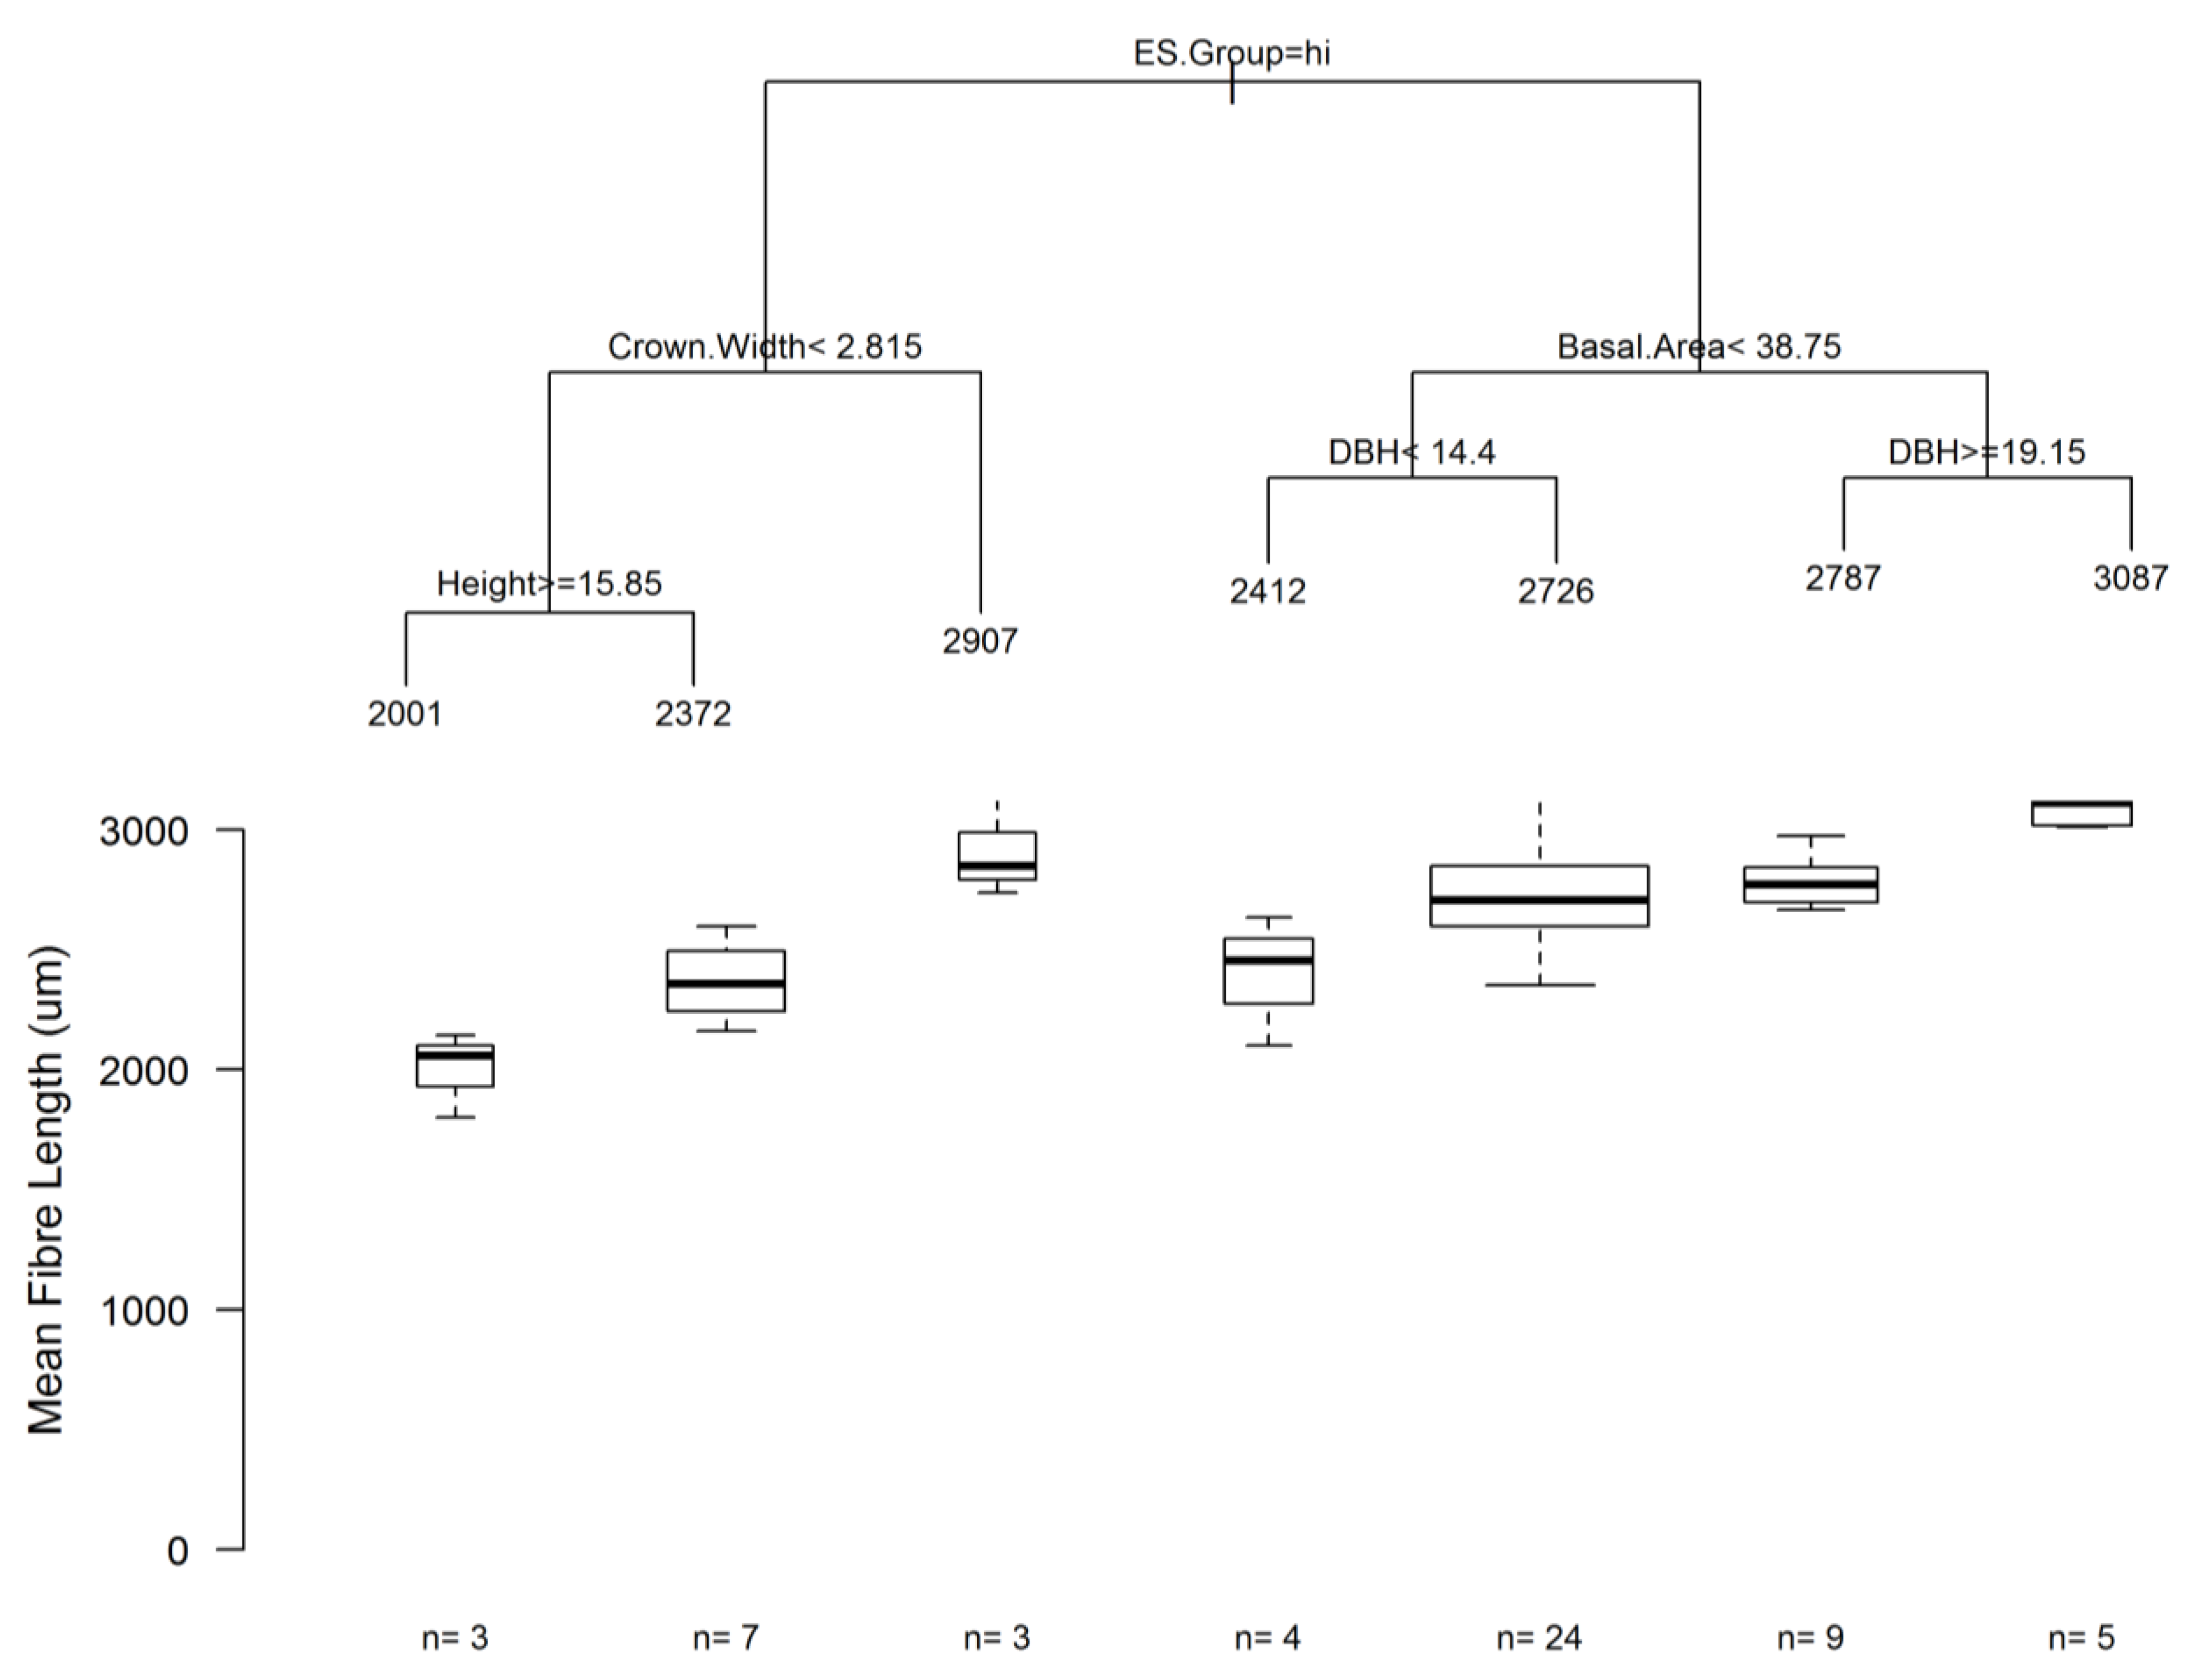
3.5. Classification Using Regression Trees and Random Forests

| Variable | r |
|---|---|
| Height (m) | 0.292 * |
| Diameter at Breast Height (cm) | 0.242 |
| Crown Width (m) | 0.419 ** |
| Stand Density (stems·ha−1) | 0.138 |
| Quadratic Mean Diameter (cm) | 0.083 |
| Basal Area (m2·ha−1) | 0.275 * |
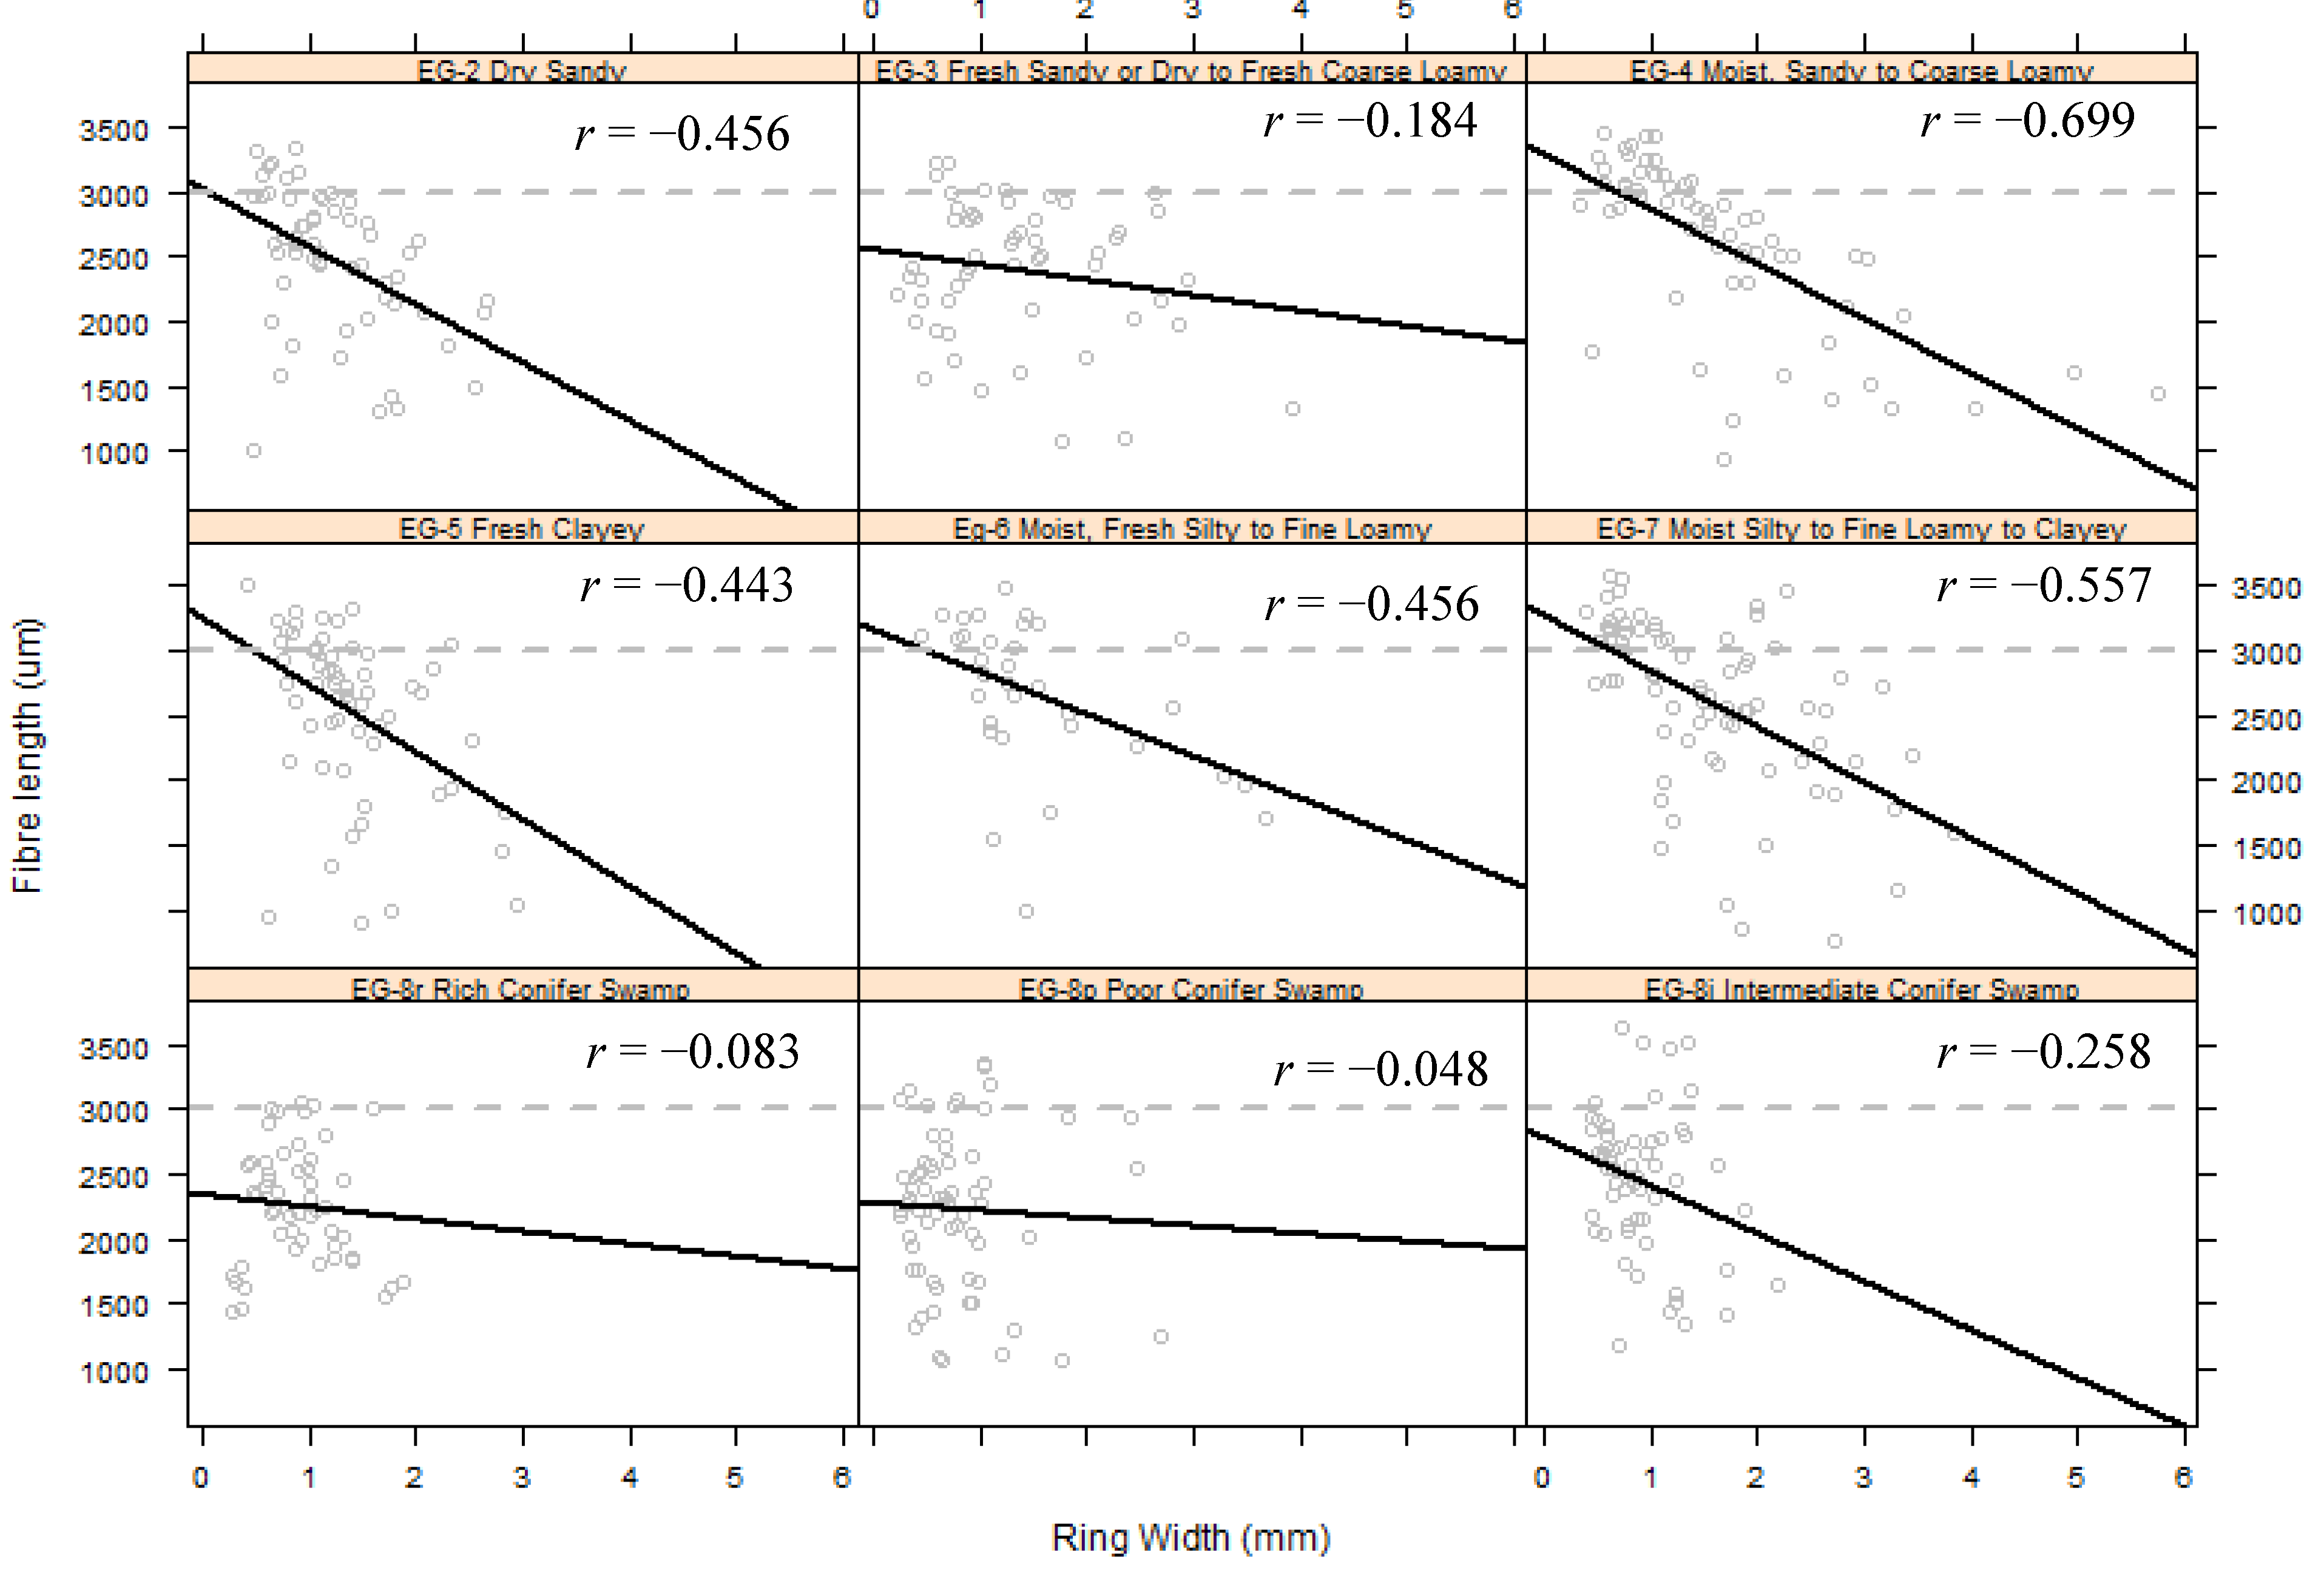
3.6. Relating Fibre Length to Ring Width


4. Discussion

5. Conclusions
Acknowledgments
Author Contributions
Conflicts of Interest
References
- Natural Resources Canada. The State of Canada’s Forests: Annual Report 2014. Available online: http://cfs.nrcan.gc.ca/pubwarehouse/pdfs/35713.pdf (accessed on 17 July 2014).
- Viereck, L.A.; Johnston, W.F. Picea mariana (Mill.) B.S.P. Black Spruce. In Silvics of North America. Volume 1. Conifers; Burns, R.M., Honkala, B.H., Eds.; U.S. Department of Agriculture Forest Service: Washington, DC, USA, 1990; pp. 222–237. [Google Scholar]
- Watson, P.; Bradley, M. Canadian pulp fibre morphology: Superiority and considerations for end use potential. For. Chron. 2009, 85, 401–408. [Google Scholar] [CrossRef]
- Benthien, J.T.; Bahnisch, C.; Heldner, S.; Ohlmeyer, M. Effect of fiber size distribution on medium-density fibreboard properties caused by varied streaming time and temperature of defibration process. Wood Fiber Sci. 2014, 46, 175–185. [Google Scholar]
- Migneault, S.; Koubaa, A.; Erchqui, A.; Englund, K.; Wolcott, M.P. Application of micromechanical models to tensile properties of wood-plastic composites. Wood Sci. Technol. 2011, 45, 521–532. [Google Scholar] [CrossRef]
- Hilker, T.; Frazer, G.; Coops, N.; Wulder, M.; Newnham, G.; Stewart, J.; van Leeuwen, M.; Culvenor, D. Prediction of Wood Fibre Attributes from LiDAR-Derived Forest Canopy Indicators. For. Sci. 2012, 59, 231–242. [Google Scholar]
- Vincent, M.; Krause, C.; Koubaa, A. Variation in black spruce (Picea mariana (Mill.) BSP) wood quality after thinning. Ann. For. Sci. 2011, 68, 1115–1125. [Google Scholar] [CrossRef]
- Li, C. Toward full, multiple, and optimal wood fibre utilization: A modeling perspective. For. Chron. 2009, 85, 377–381. [Google Scholar] [CrossRef]
- MacKenzie, J.; Bruemmer, G. Enhancing Canada’s forest fibre. For. Chron. 2009, 85, 353–354. [Google Scholar] [CrossRef]
- Couto, L.; Dube, F. The status and practice of Forestry in Brazil at the beginning of the 21st century: A review. For. Chron. 2001, 77, 817–830. [Google Scholar] [CrossRef]
- Archibald, D.J.; Arnup, R.W. The Management of Black Spruce Advance Growth in Northeastern Ontario; NEST Technical Report; Northeast Science and Technology: Ontario, Canada, 1993; p. 31. [Google Scholar]
- Mäkinen, H.; Saranpää, P.; Linder, S. Effect of Growth Rate on Fibre Characteristics in Norway Spruce (Picea abies (L.) Karst.). Holzforschung 2002, 56, 449–460. [Google Scholar] [CrossRef]
- Lenz, P.; Bernier-Cardou, M.; MacKay, J.; Beaulieu, J. Can wood properties be predicted from the morphological traits of a tree? A canonical correlation study of plantation-grown white spruce. Can. J. For. Res. 2012, 42, 1518–1529. [Google Scholar] [CrossRef]
- Larson, P.R. A biological approach to wood quality. TAPPI J. 1962, 45, 443–448. [Google Scholar]
- Pokharel, B.; Dech, J.P. Mixed-effects basal area increment models for tree species in the boreal forest of Ontario, Canada using an ecological land classification approach to incorporate site effects. Forestry 2012, 85, 256–270. [Google Scholar] [CrossRef]
- Van Leeuwen, M.; Hilker, T.; Coops, N.; Frazer, G.; Wulder, M.; Newham, G.; Culvenor, D. Assessment of standing wood and fibre quality using ground and airborne laser scanning: A review. For. Ecol. Manag. 2011, 261, 1467–1478. [Google Scholar] [CrossRef]
- Billings, W.D. The environmental complex in relation to plant growth and distribution. Quart. Rev. Biol. 1952, 27, 251–265. [Google Scholar] [CrossRef] [PubMed]
- Pokharel, B.; Dech, J.P. An ecological land classification approach to modeling the production of forest biomass. For. Chron. 2011, 87, 23–32. [Google Scholar] [CrossRef]
- Law, A.; Wiener, M. Classification and Regression by Random Forest. R. News 2002, 2, 18–22. [Google Scholar]
- Ontario Ministry of Natural Resources. Ecological Land Classification Field Manual—Operational Draft, April 20th; Ecological Land Classification Working Group: Toronto, ON, Canada, 2009; Unpublished Manual. [Google Scholar]
- Jozsa, L.; Middleton, G. A Discussion of Wood Quality Attributes and Their Practical Implications; Special Publication No. SP-34; Forintek Canada Corp: Vancouver, BC, Canada, 1994. [Google Scholar]
- Rowe, J.S. Forest Regions of Canada; Canadian Forestry Service Publication 1300; Canadian Forest Service: Ottawa, ON, Canada, 1972. [Google Scholar]
- Pitt, D.G.; Woods, M.; Penner, M. A comparison of point clouds derived from stereo imagery and airborne laser scanning for the area-based estimation of forest inventory attributes in Boreal Ontario. Can. J. Remote Sens. 2014, 40, 214–232. [Google Scholar] [CrossRef]
- National Climate Data and Information Archive. Available online: http://climate.weatheroffice.gc.ca/Welcome_e.html (accessed on 21 July 2015).
- Romeo Malette Forest: Forest Management Plan 2009–2019. 2009. Available online: http://www.efmp.lrc.gov.on.ca/eFMP/home.do (accessed on 21 July 2015).
- Woods, M.; Pitt, D.G.; Penner, M.; Lim, K.; Nesbitt, D.; Etheridge, D.; Treitz, P. Operational implementation of a LiDAR inventory in Boreal Ontario. For. Chron. 2011, 87, 512–528. [Google Scholar] [CrossRef]
- Pokharel, B.; Dech, J.P.; Groot, A.; Pitt, D. Ecologically-based predictive modeling of wood quality characteristics of black spruce (Picea mariana (Mill.) B.S.P.) in boreal landscapes of Northern Ontario. Can. For. J. Res. 2014, 44, 465–475. [Google Scholar] [CrossRef]
- Ontario Ministry of Natural Resources. PSP and PGP Reference Manual; Growth and Yield Program: Toronto, ON, Canada, 2008. [Google Scholar]
- Yang, K.C.; Hazenburg, G. Impact of spacing on tracheid length, relative density, and growth rate of juvenile wood and mature wood in Picea mariana. Can. J. For. Res. 1994, 24, 996–1007. [Google Scholar] [CrossRef]
- Bergqvist, G.; Bergsten, U.; Alqvist, B. Effect of radial increment core diameter on tracheid length measurement in Norway spruce. Wood Sci. Technol. 1997, 31, 241–250. [Google Scholar] [CrossRef]
- Speer, J.H. Fundamentals of Tree-Ring Research; University of Arizona Press: Tucson, AZ, USA, 2010. [Google Scholar]
- Cook, E.R.; Kairiukstis, L.A. Methods of Dendrochronology; Kluwer Academic Publishers: Dordrecht, The Netherlands, 1990. [Google Scholar]
- Franklin, G.L. Preparation of thin sections of synthetic resins and wood-resin composites, and a new macerating method for wood. Nature 1945, 155, 51. [Google Scholar] [CrossRef]
- MacDonald, E.; Hubert, J. A review of the effects of silviculture on timber quality of Sitka spruce. Forestry 2002, 75, 107–138. [Google Scholar] [CrossRef]
- Townshend, E. Ecologically-Based Modelling of Wood Fibre Length in Black Spruce (Picea mariana). Master Thesis, Major Research Paper, School of Graduate Studies, Nipissing University, Nipissing, ON, Canada, 2013; p. 45. [Google Scholar]
- Therneau, T.M.; Atkinson, B.; Ripley, B. Rpart: Recursive Partitioning. R Package Version 4.1-1. Available online: http://cran.r-project.org/web/packages/rpart/index.html (accessed on 3 June 2013).
- Breiman, L.; Cutler, A.; Liaw, A.; Wiener, M. RandomForest: Breiman and Cutler’s Random Forests for Classification and Regression. R Package Version 4.6-7. Available online: http://cran.r-project.org/web/packages/randomForest/index.html (accessed on 5 March 2013).
- R Development Core Team. R: A Language and Environment for Statistical Computing. R Foundation for Statistical Computing: Vienna, Austria, 2013. Available online: http://www.r-project.org (accessed on 15 September 2015).
- De’ath, G.; Fabricus, K.E. Classification and Regression Trees: A powerful yet simple technique for ecological data analysis. Ecology 2000, 8, 3178–3192. [Google Scholar] [CrossRef]
- Dech, J.; Mayhew-Hammond, S.; James, A.; Pokharel, B. Modeling Canada yew (Taxus Canadensis Marsh.) distribution and abundance in the boreal forest of northeastern Ontario, Canada. Ecol. Indic. 2014, 36, 48–58. [Google Scholar] [CrossRef]
- Cutler, R.D.; Edwards, T.C.; Beard, K.H.; Cutler, A.; Hess, K.T.; Gibson, J.; Lawler, J.J. Random Forests for Classification in Ecology. Ecology 2007, 88, 2783–2792. [Google Scholar] [CrossRef] [PubMed]
- Lessard, E.; Fournier, R.A.; Luther, J.E.; Mazerolle, M.J.; van Lier, O.R. Modeling wood fiber attributes using forest inventory and environmental data for Newfoundland’s boreal forest. For. Ecol. Manag. 2014, 313, 307–318. [Google Scholar] [CrossRef]
- Rossi, S.; Cairo, E.; Krause, C.; Deslauriers, A. Growth and basic wood properties of black spruce along an alti-latitudinal gradient in Quebec, Canada. Ann. For. Sci. 2015, 72, 77–87. [Google Scholar] [CrossRef]
- Fromm, J. Xylem development in trees: From cambial divisions to mature wood cells. In Cellular Aspects of Wood Formation; Fromm, J., Ed.; Springer: Berlin Heidelberg, Germany, 2013; pp. 3–39. [Google Scholar]
- Panshin, A.J.; de Zeeuw, C. Structure, identification, uses, and properties of the commercial woods of the United States and Canada. In Textbook of Wood Technology, 3rd ed.; McGraw-Hill: New York, NY, USA, 1970. [Google Scholar]
- Downes, G.; Beadle, C.; Worledge, D. Daily stem growth patterns in irrigated Eucalyptus globulus and E. nitens in relation to climate. Trees 1999, 14, 102–111. [Google Scholar] [CrossRef]
- Drew, D.M.; Downes, G. A model of stem growth and wood formation in Pinus radiata. Trees 2015, 29, 1395–1413. [Google Scholar] [CrossRef]
- Denne, M.P. Definition of Latewood According to Mork (1928). IAWA Bull. 1989, 10, 59–62. [Google Scholar] [CrossRef]
- Belien, E.; Rossi, S.; Morin, H.; Deslauriers, A. Xylogenesis in black spruce subjected to rain exclusion in the field. Can. J. For. Res. 2012, 42, 1306–1315. [Google Scholar] [CrossRef]
- Deslauriers, A.; Morin, H.; Begin, Y. Cellular phenology of annual ring formation of Abies balsamea in the Quebec boreal forest. Can. J. For. Res. 2003, 33, 190–200. [Google Scholar] [CrossRef]
- Mansfield, S.D.; Parish, R.; di Lucca, C.M.; Goudie, J.; Kang, K.Y.; Ott, P. Revisiting the transition between juvenile and mature wood: A comparison of fibre length, microfibril angle and relative wood density in lodgepole pine. Holzforschung 2009, 63, 449–456. [Google Scholar] [CrossRef]
- Mäkinen, H.; Hynynen, J. Predicting wood and tracheid properties of Scots pine. For. Ecol. Manag. 2012, 279, 11–20. [Google Scholar] [CrossRef]
- Bannan, M.W. Sequential changes in rate of anticlinal division, cambial cell length, and ring width in the growth of coniferous trees. Can. J. Bot. 1967, 45, 1359–1369. [Google Scholar] [CrossRef]
- Zobel, B.J.; van Buijtenen, J.P. Wood Variation: Its Causes and Control; Springer-Verlag: New York, NY, USA, 1989; p. 363. [Google Scholar]
- St-Germain, J.L.; Krause, C. Latitudinal variation in tree-ring and wood cell characteristics of Picea mariana across the continuous boreal forest in Quebec. Can. J. For. Res. 2008, 38, 1397–1405. [Google Scholar] [CrossRef]
- Amarasekara, H.; Denne, M.P. Effects of crown size on wood characteristics of Corsican pine in relation to definitions of juvenile wood, crown formed wood and core wood. Forestry 2002, 75, 51–61. [Google Scholar] [CrossRef]
- Lachenbruch, B.; Moore, J.R.; Evans, R. Radial variation in wood structure and function in woody plants, and hypotheses for its occurrence. In Size-and Age-Related Changes in Tree Structure and Function; Meinzer, F.C., Lachenbruch, B., Eds.; Springer: New York, NY, USA, 2011; pp. 121–164. [Google Scholar]
- Gartner, B.L. Prediction of wood structural patterns in trees by using ecological models of plant water relations. In Characterization of the Cellulosic Cell Wall; Stokke, D.D., Groom, L.H., Eds.; Blackwell Publishing: Ames, ID, USA, 2006; pp. 38–52. [Google Scholar]
- Joffre, T.; Miettinen, A.; Berthold, F.; Gamstedt, E.K. X-ray micro-computed tomography investigation of fibre length degradation during the processing steps of short-fibre composites. Compos. Sci. Technol. 2014, 105, 127–133. [Google Scholar] [CrossRef]
- Duschene, I.; Wilhelmsson, L.; Spangberg, K. Effects of in-forest sorting of Norway spruce (Picea abies) and Scots pine (Pinus sylvestris) on wood and fibre properties. Can. J. For. Res. 1997, 27, 790–795. [Google Scholar]
- Cajander, A.K. The theory of forest types. Acta For. Fenn. 1929, 29, 1–108. [Google Scholar]
- Burger, T.L.; Kotar, J.A. Guide to Forest Communities and Habitat Types of Michigan; The Department of Forest Ecology and Management, University of Wisconsin-Madison: Madison, WI, USA, 2003. [Google Scholar]
- Cooper, S.V.; Neiman, K.E.; Roberts, D.W. Forest Habitat Types of Northern Idaho: A Second Approximation; General Technical Report INT-236; USDA, Forest Service, Intermountain Research Station: Ogden, UT, USA, 1991; p. 143. [Google Scholar]
- Leathwick, J.; Morgan, F.; Wilson, G.; Rutledge, D.; McLeod, M.; Johnston, K. Land Environments of New Zealand: A Technical Guide; Ministry for the Environment: Hamilton, New Zealand, 2003; p. 237. [Google Scholar]
- Pyatt, D.G.; Ray, D.; Fletcher, J. An Ecological Site Classification for Forestry in Great Britain; Forestry Commission: Edinburgh, UK, 2001. [Google Scholar]
- Barnes, B.V.; Pregitzer, K.S.; Spies, T.A.; Spooner, V.H. Ecological forest site classification. J. For. 1982, 80, 493–498. [Google Scholar]
- Abella, S.R.; Covington, W.W. Vegetation-environment relationships and ecological species groups of an Arizona Pinus ponderosa landscape, USA. Plant Ecol. 2006, 185, 255–268. [Google Scholar] [CrossRef]
- Hollingsworth, I.D.; Boardman, R.; Fitzpatrick, R.W. A soil-site evaluation index of productivity in intensively managed Pinus radiata (D. Don) plantations in South Australia. Environ. Monit. Assess. 1996, 39, 531–541. [Google Scholar] [CrossRef] [PubMed]
- Mohamed, A.; Reich, R.M.; Khosla, R.; Aguirre-Bravo, C.; Briseno, M.M. Influence of climatic conditions, topography and soil attributes on the spatial distribution of site productivity index of the species rich forests of Jalisco, Mexico. J. For. Res. 2014, 25, 87–95. [Google Scholar] [CrossRef]
© 2015 by the authors; licensee MDPI, Basel, Switzerland. This article is an open access article distributed under the terms and conditions of the Creative Commons Attribution license (http://creativecommons.org/licenses/by/4.0/).
Share and Cite
Townshend, E.; Pokharel, B.; Groot, A.; Pitt, D.; Dech, J.P. Modeling Wood Fibre Length in Black Spruce (Picea mariana (Mill.) BSP) Based on Ecological Land Classification. Forests 2015, 6, 3369-3394. https://doi.org/10.3390/f6103369
Townshend E, Pokharel B, Groot A, Pitt D, Dech JP. Modeling Wood Fibre Length in Black Spruce (Picea mariana (Mill.) BSP) Based on Ecological Land Classification. Forests. 2015; 6(10):3369-3394. https://doi.org/10.3390/f6103369
Chicago/Turabian StyleTownshend, Elisha, Bharat Pokharel, Art Groot, Doug Pitt, and Jeffery P. Dech. 2015. "Modeling Wood Fibre Length in Black Spruce (Picea mariana (Mill.) BSP) Based on Ecological Land Classification" Forests 6, no. 10: 3369-3394. https://doi.org/10.3390/f6103369