
Using Plant Temperature to Evaluate the Response of Stomatal Conductance to Soil Moisture Deficit

Abstract
:1. Introduction
2. Experimental Section
2.1. Plant Material and Treatment
2.2. Measurement of Related Characteristics
2.3. Data Analyses and Statistics
3. Results
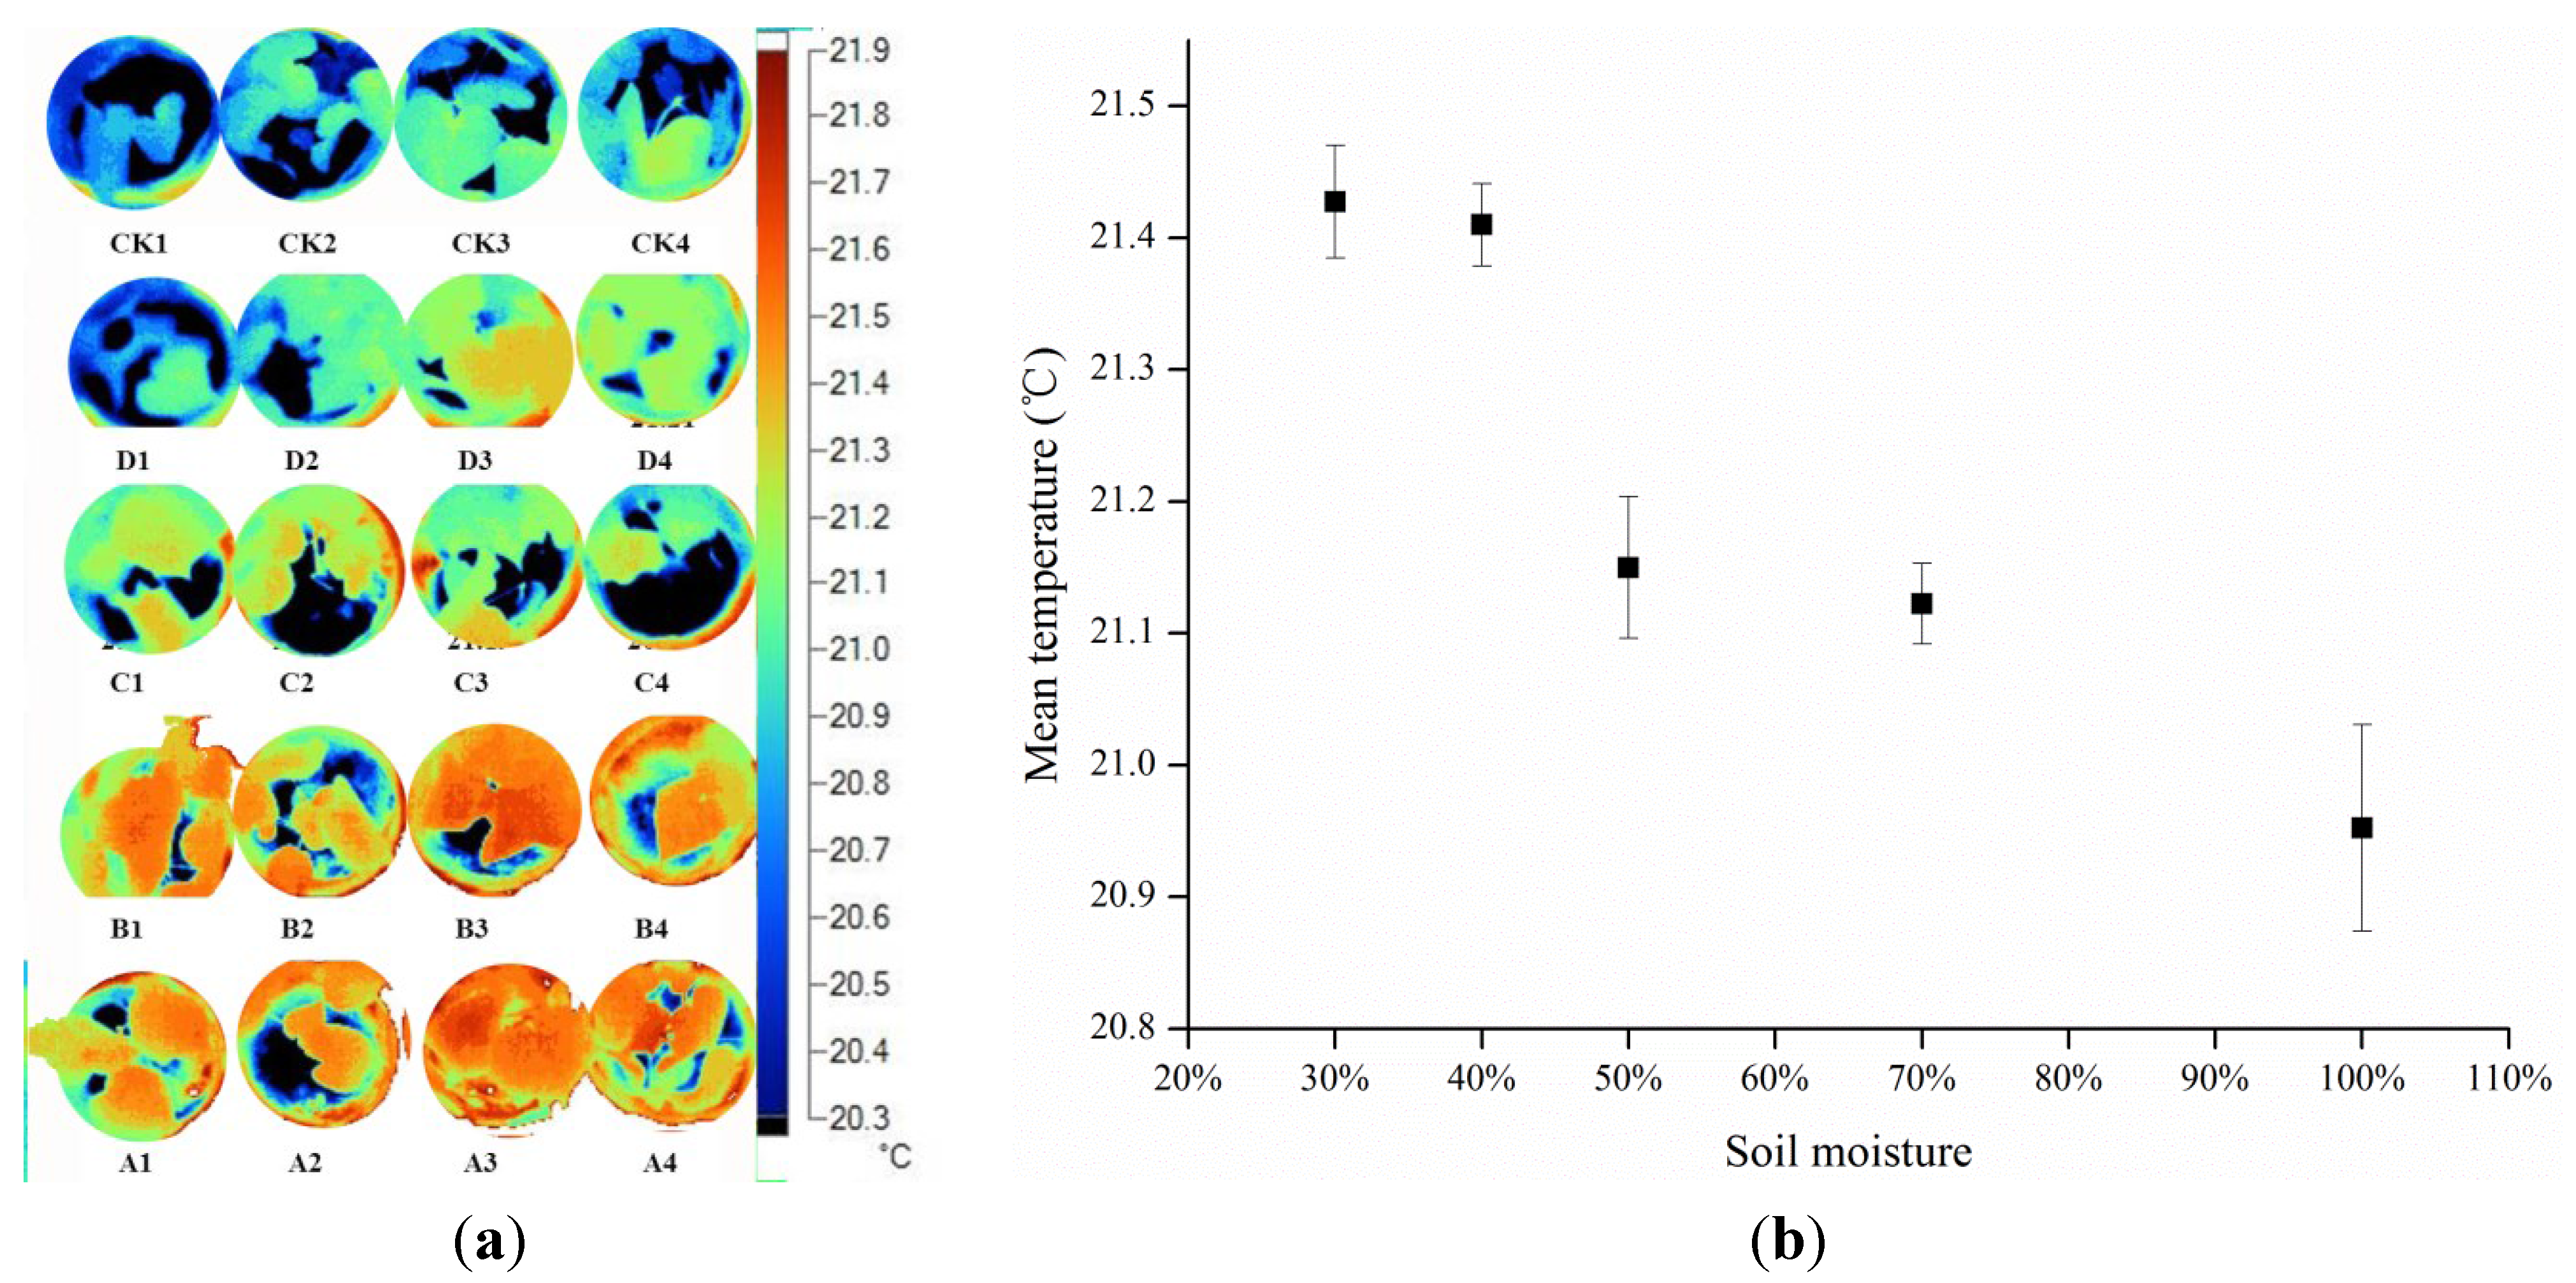
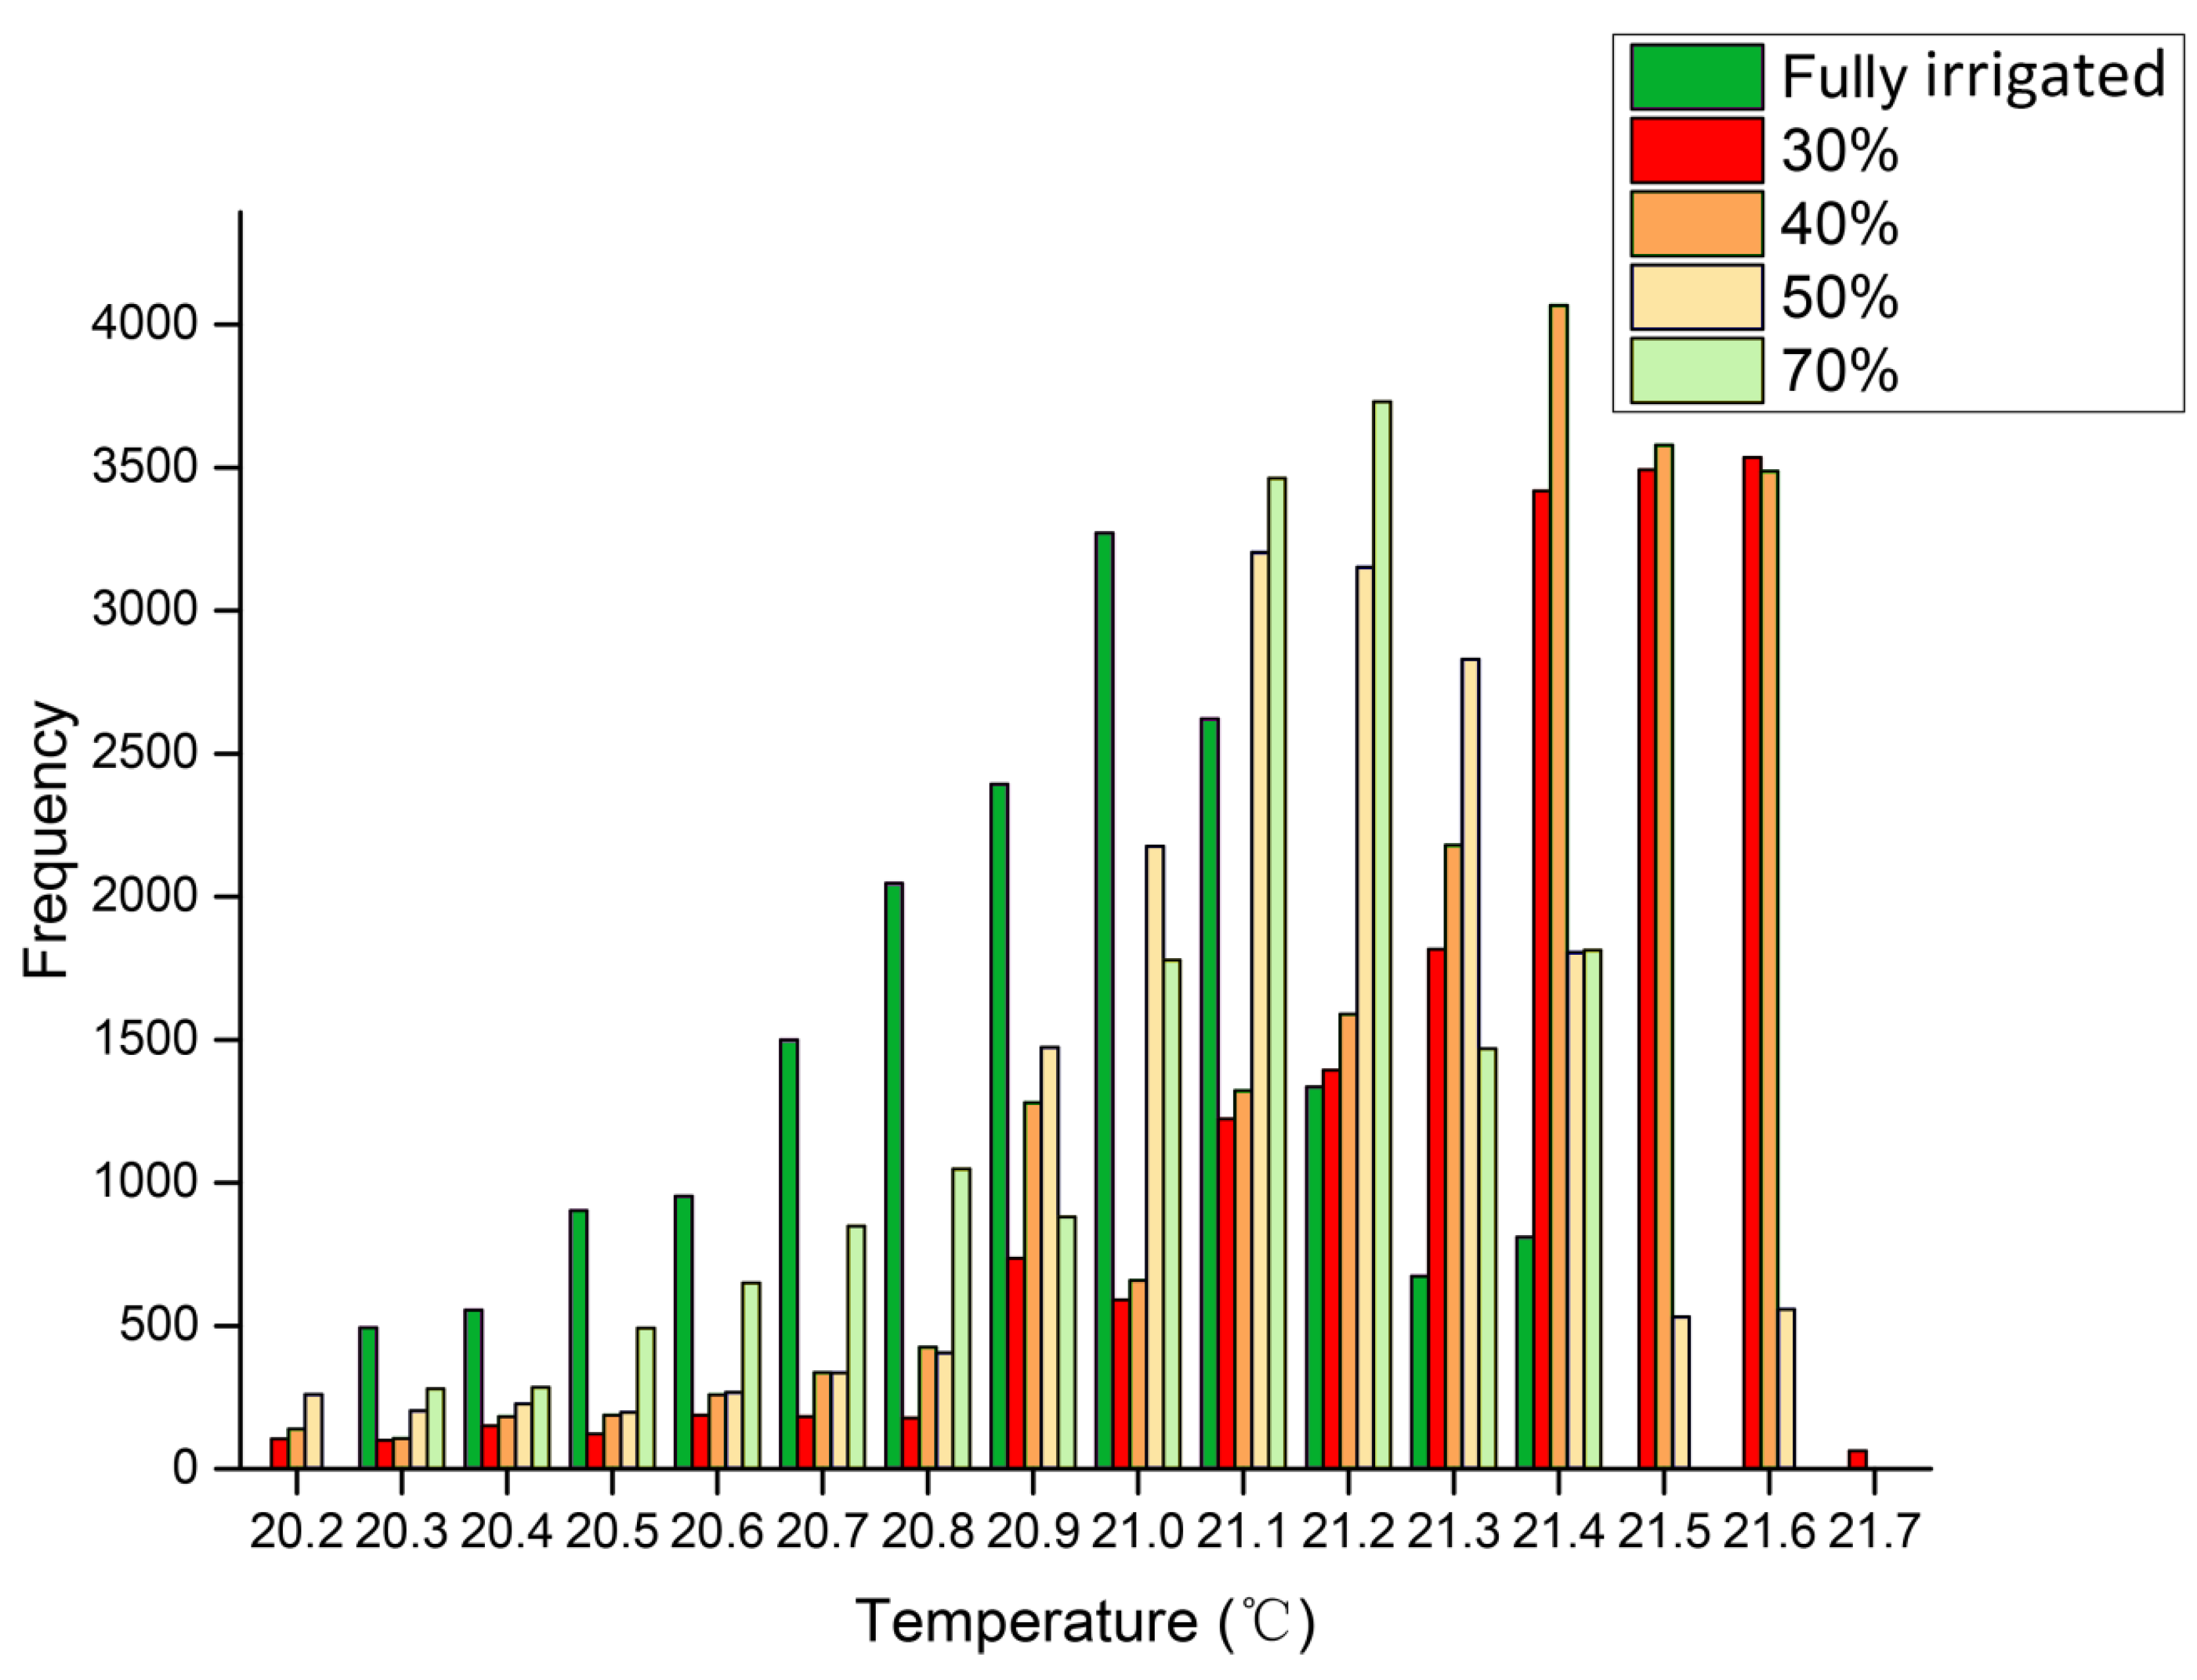
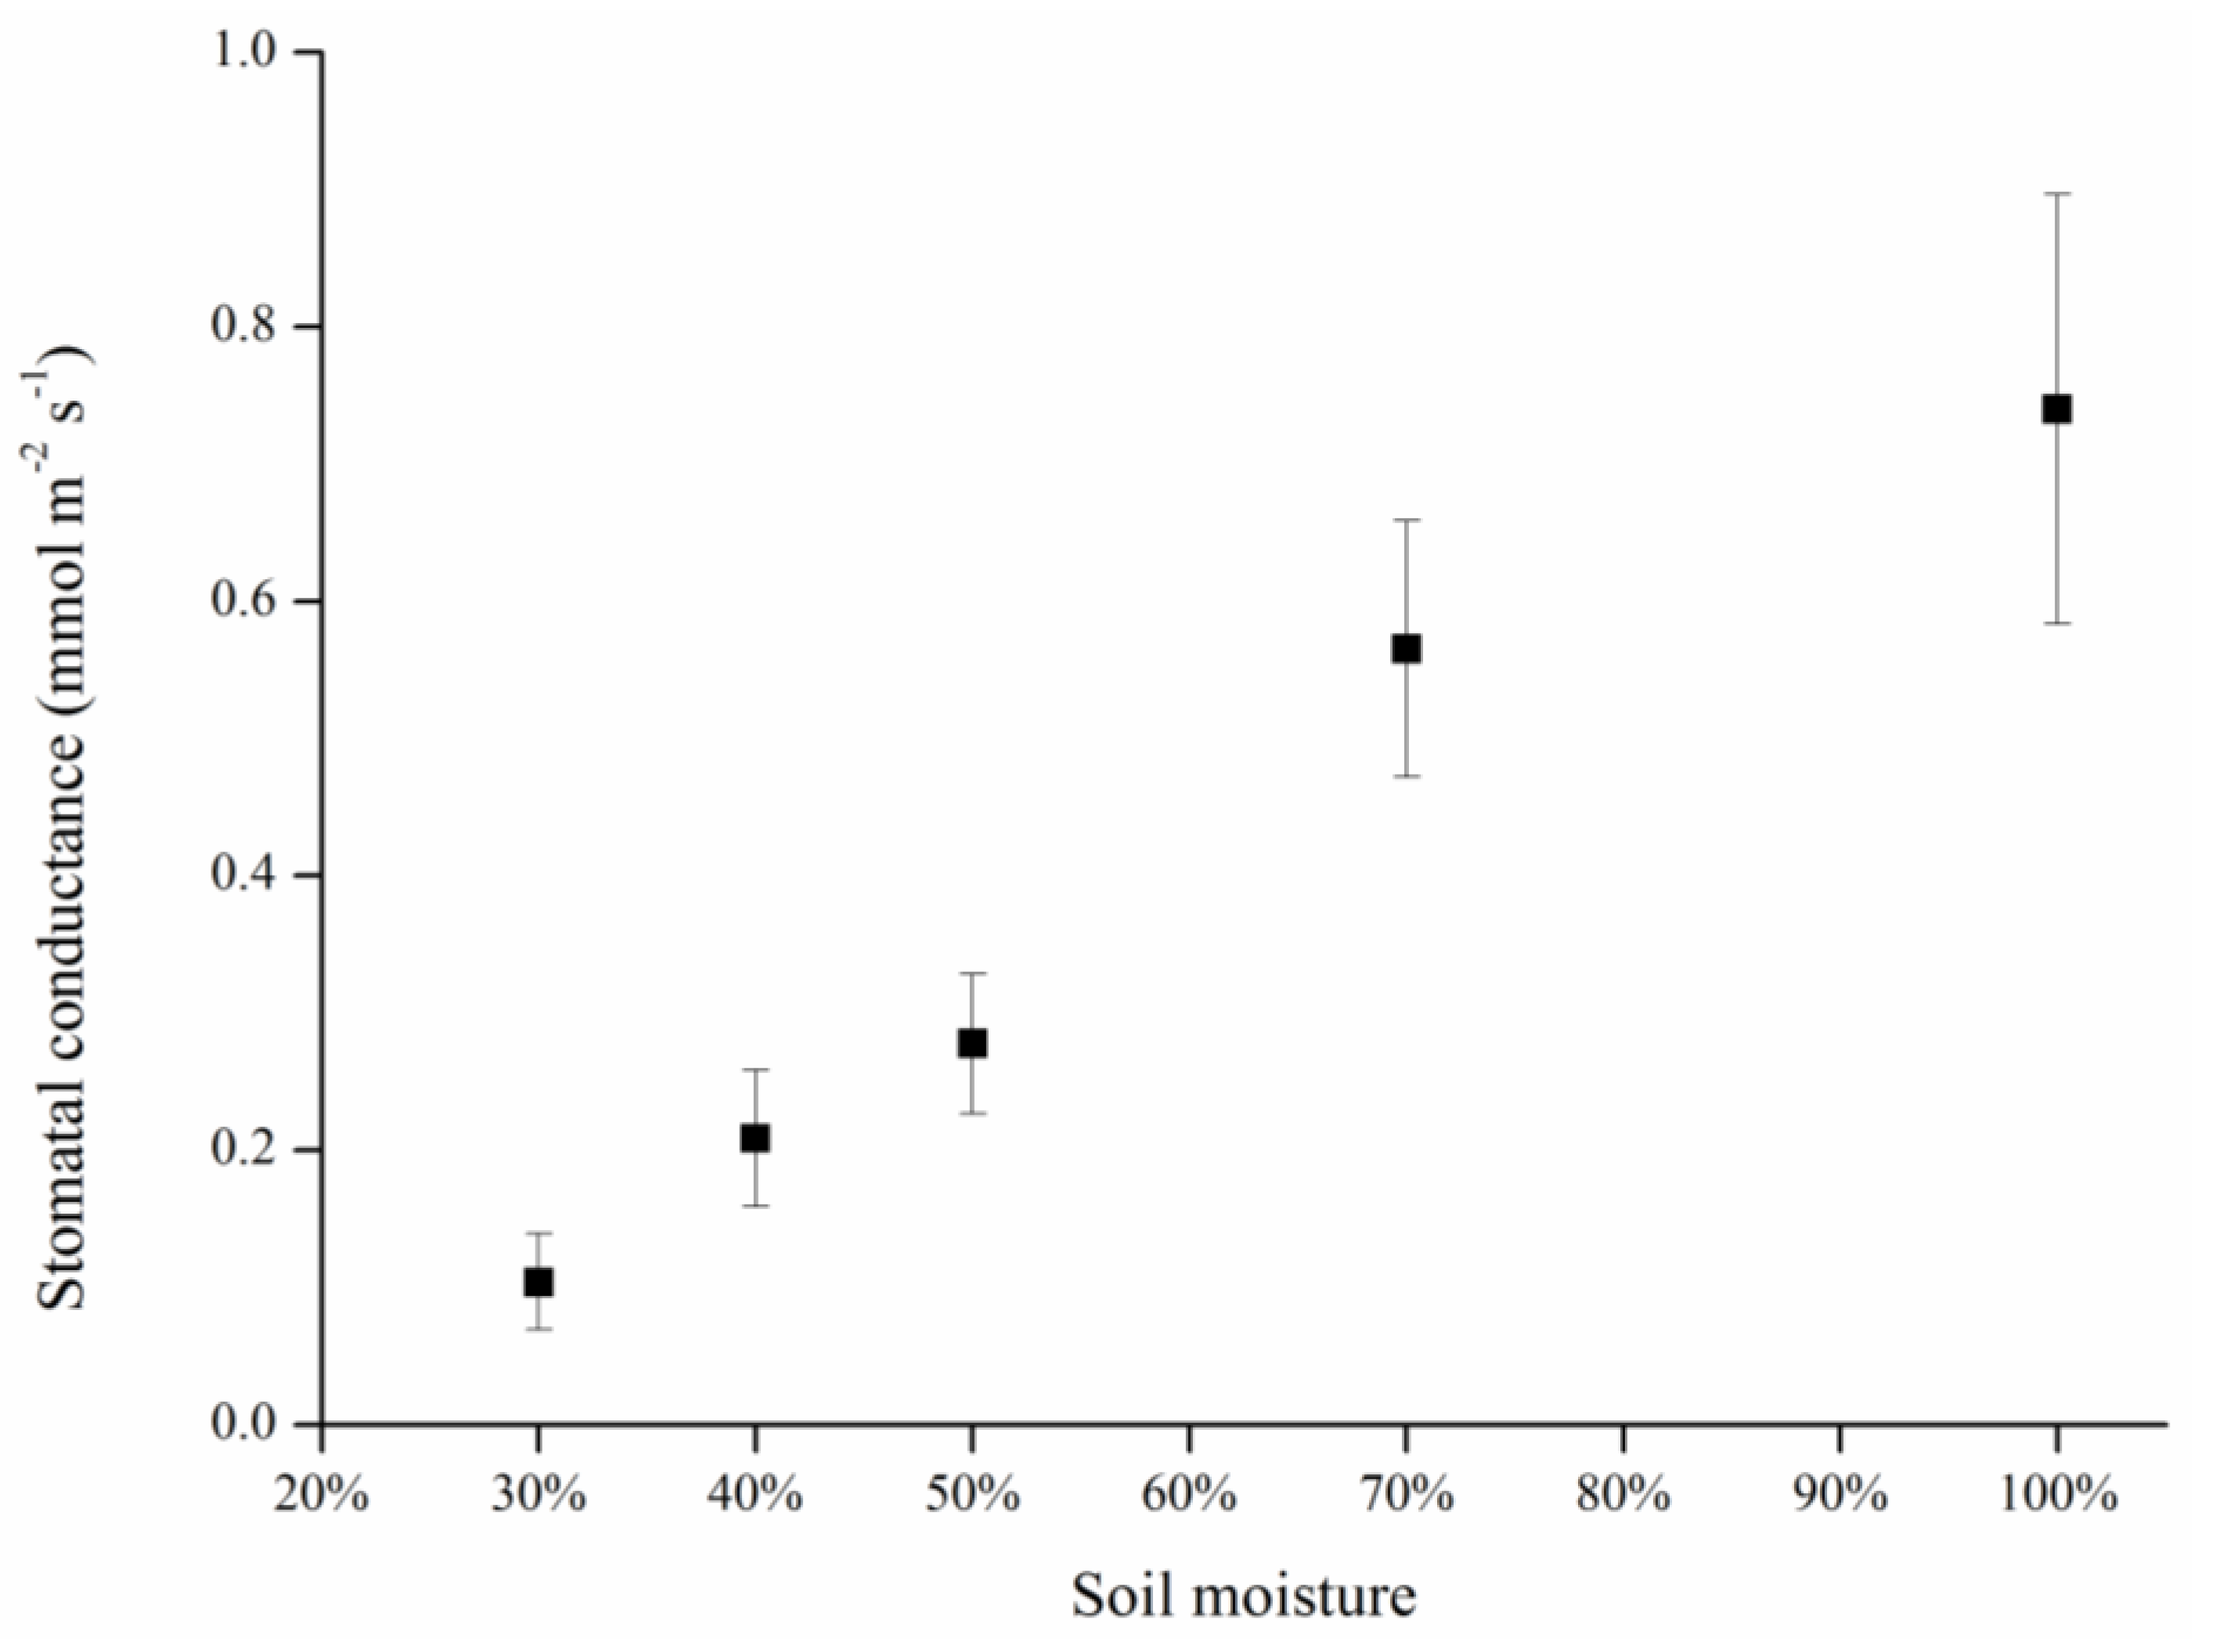
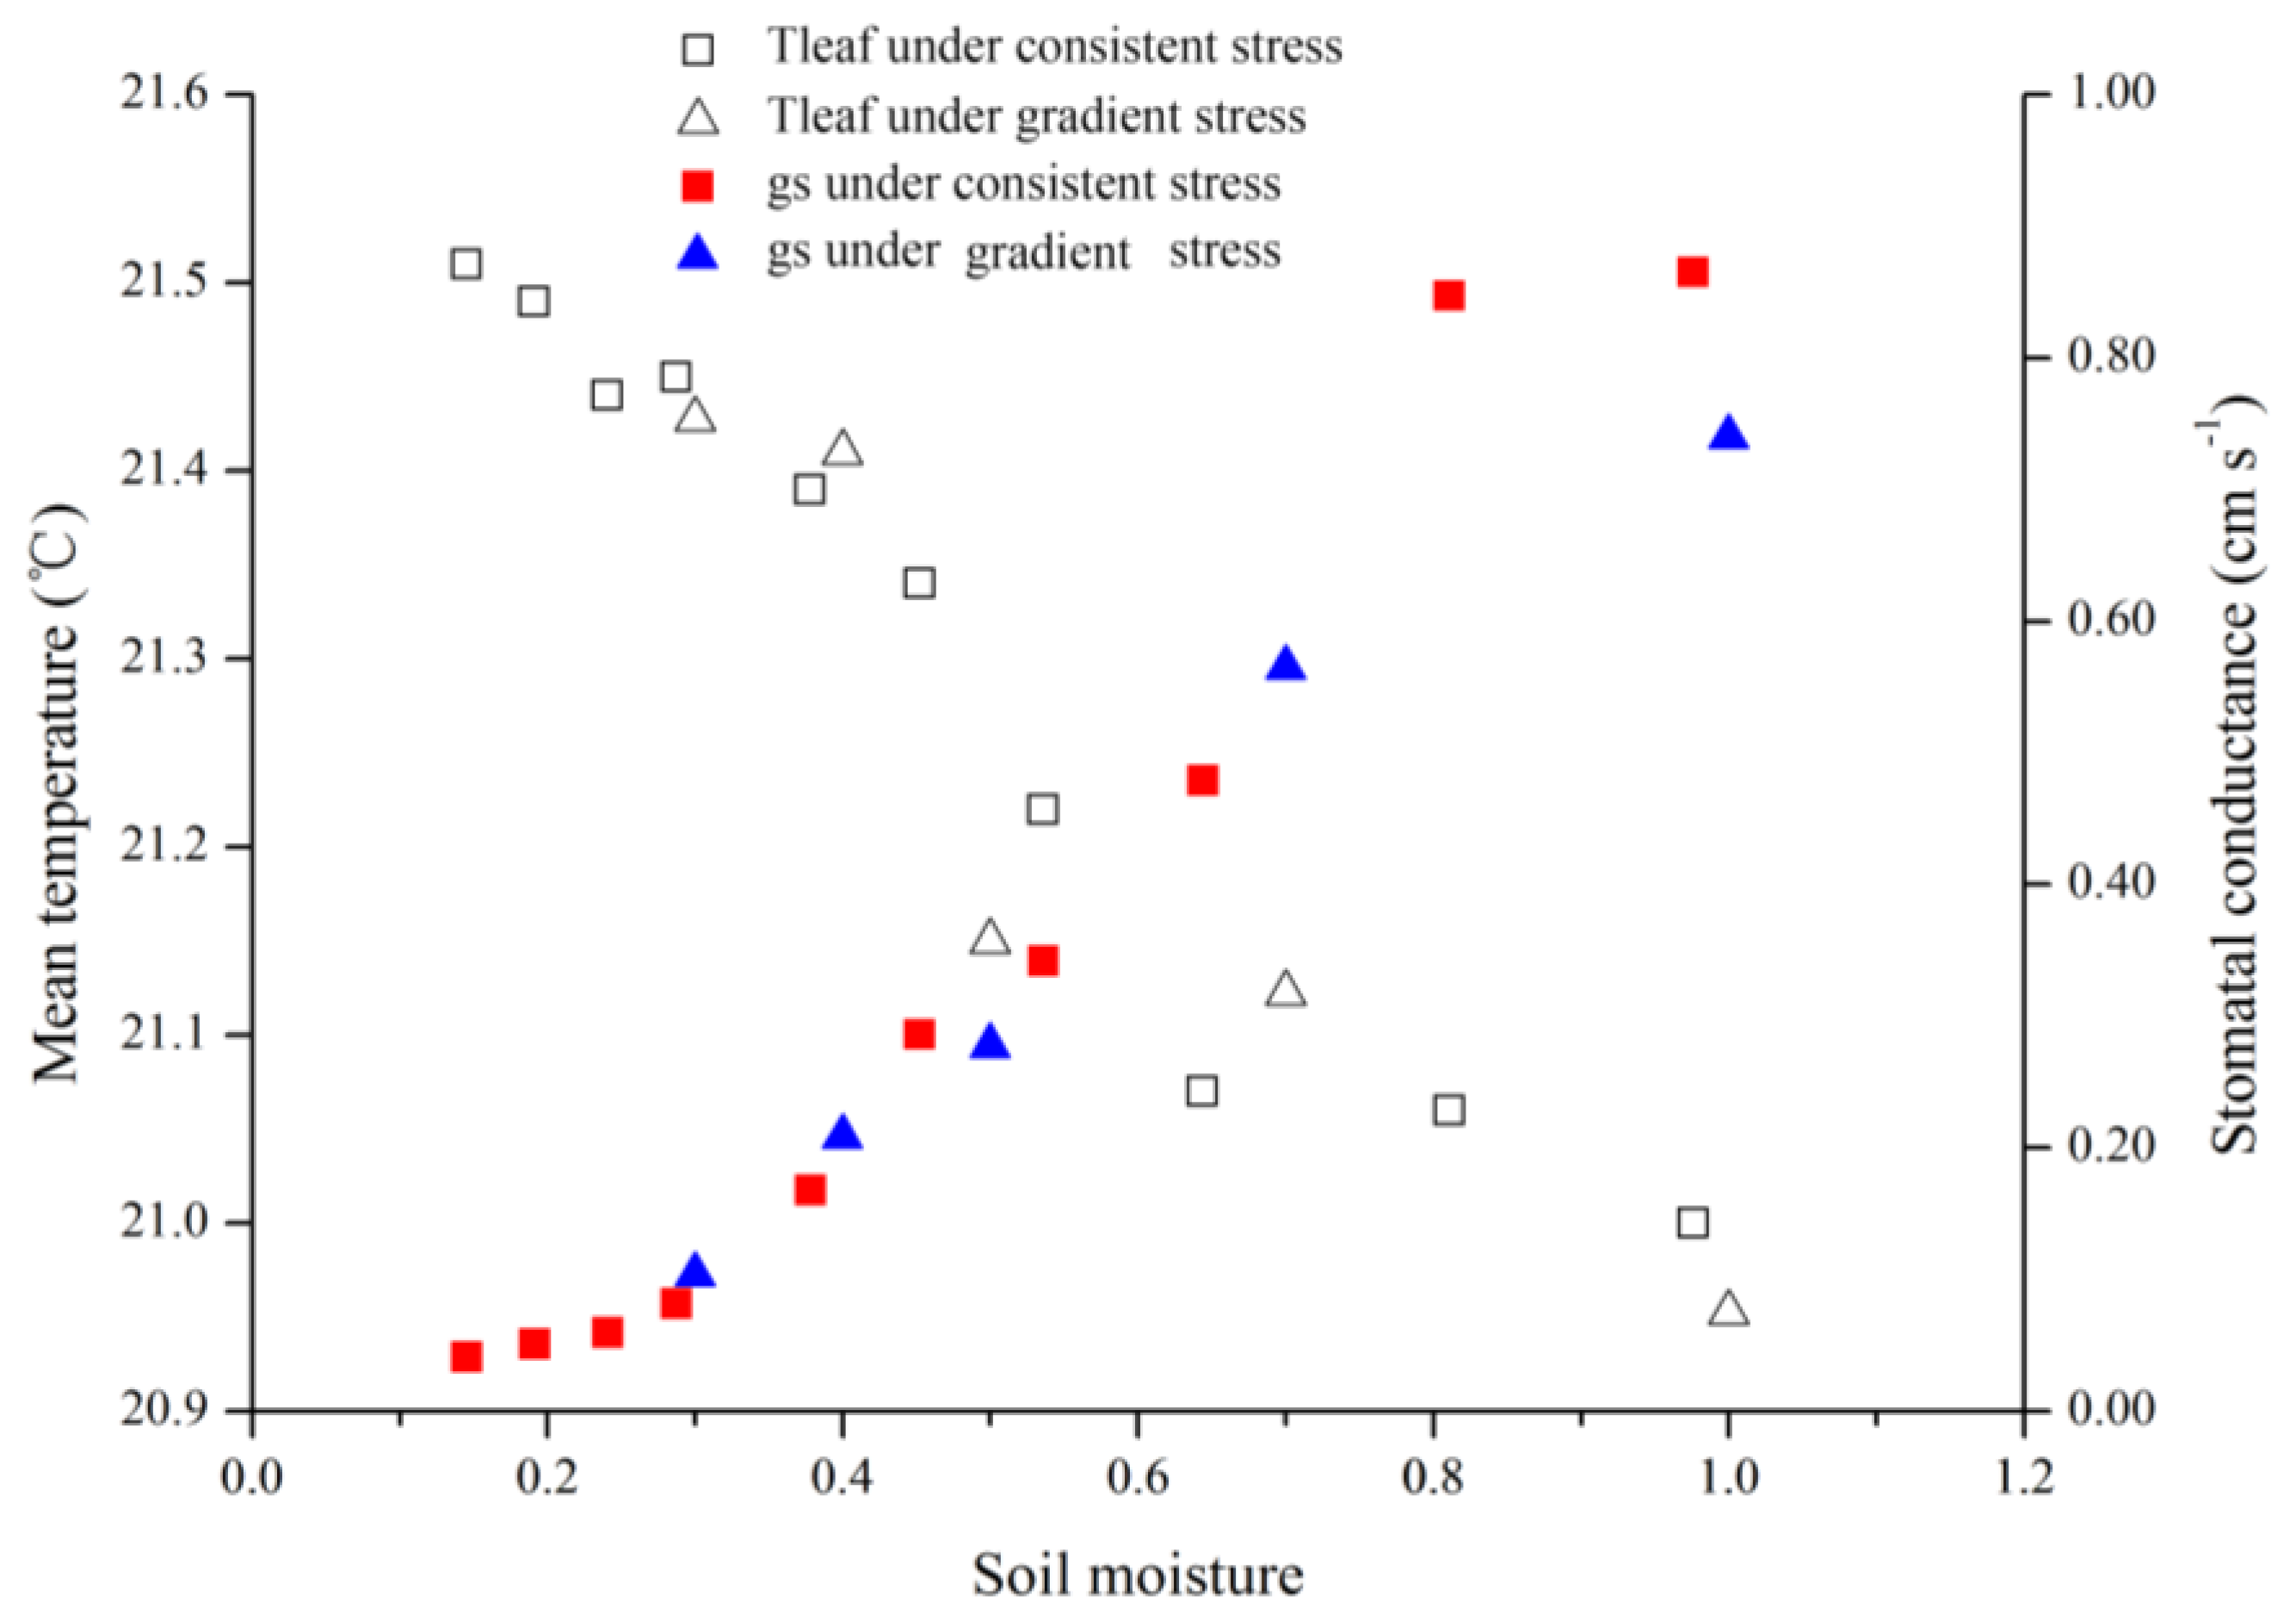
3.1. Effects of Gradient Water Stress on Leaf Temperature and Stomatal Conductance


| Mean Temperature | ANOVA | ||||
|---|---|---|---|---|---|
| Sum of Squares | df (degree of freedom) | Mean Square | F | Sig. (Significance) | |
| Between Groups | 0.659 | 4 | 0.165 | 16.137 | 0.000 |
| Within Groups | 0.153 | 15 | 0.010 | ||
| Total | 0.813 | 19 | |||

| Canopy | Mean Temperature (°C) | Standard Deviation (sd) (°C) |
|---|---|---|
| A | 21.4 | 0.085 |
| B | 21.4 | 0.083 |
| C | 21.2 | 0.074 |
| D | 21.1 | 0.061 |
| CK | 21.0 | 0.016 |
| Leaf Conductance | ANOVA | ||||
|---|---|---|---|---|---|
| Sum of Squares | df | Mean Square | F | Sig. | |
| Between Groups | 1.121 | 4 | 0.280 | 26.586 | 0.000 |
| Within Groups | 0.158 | 15 | 0.011 | ||
| Total | 1.279 | 19 | |||

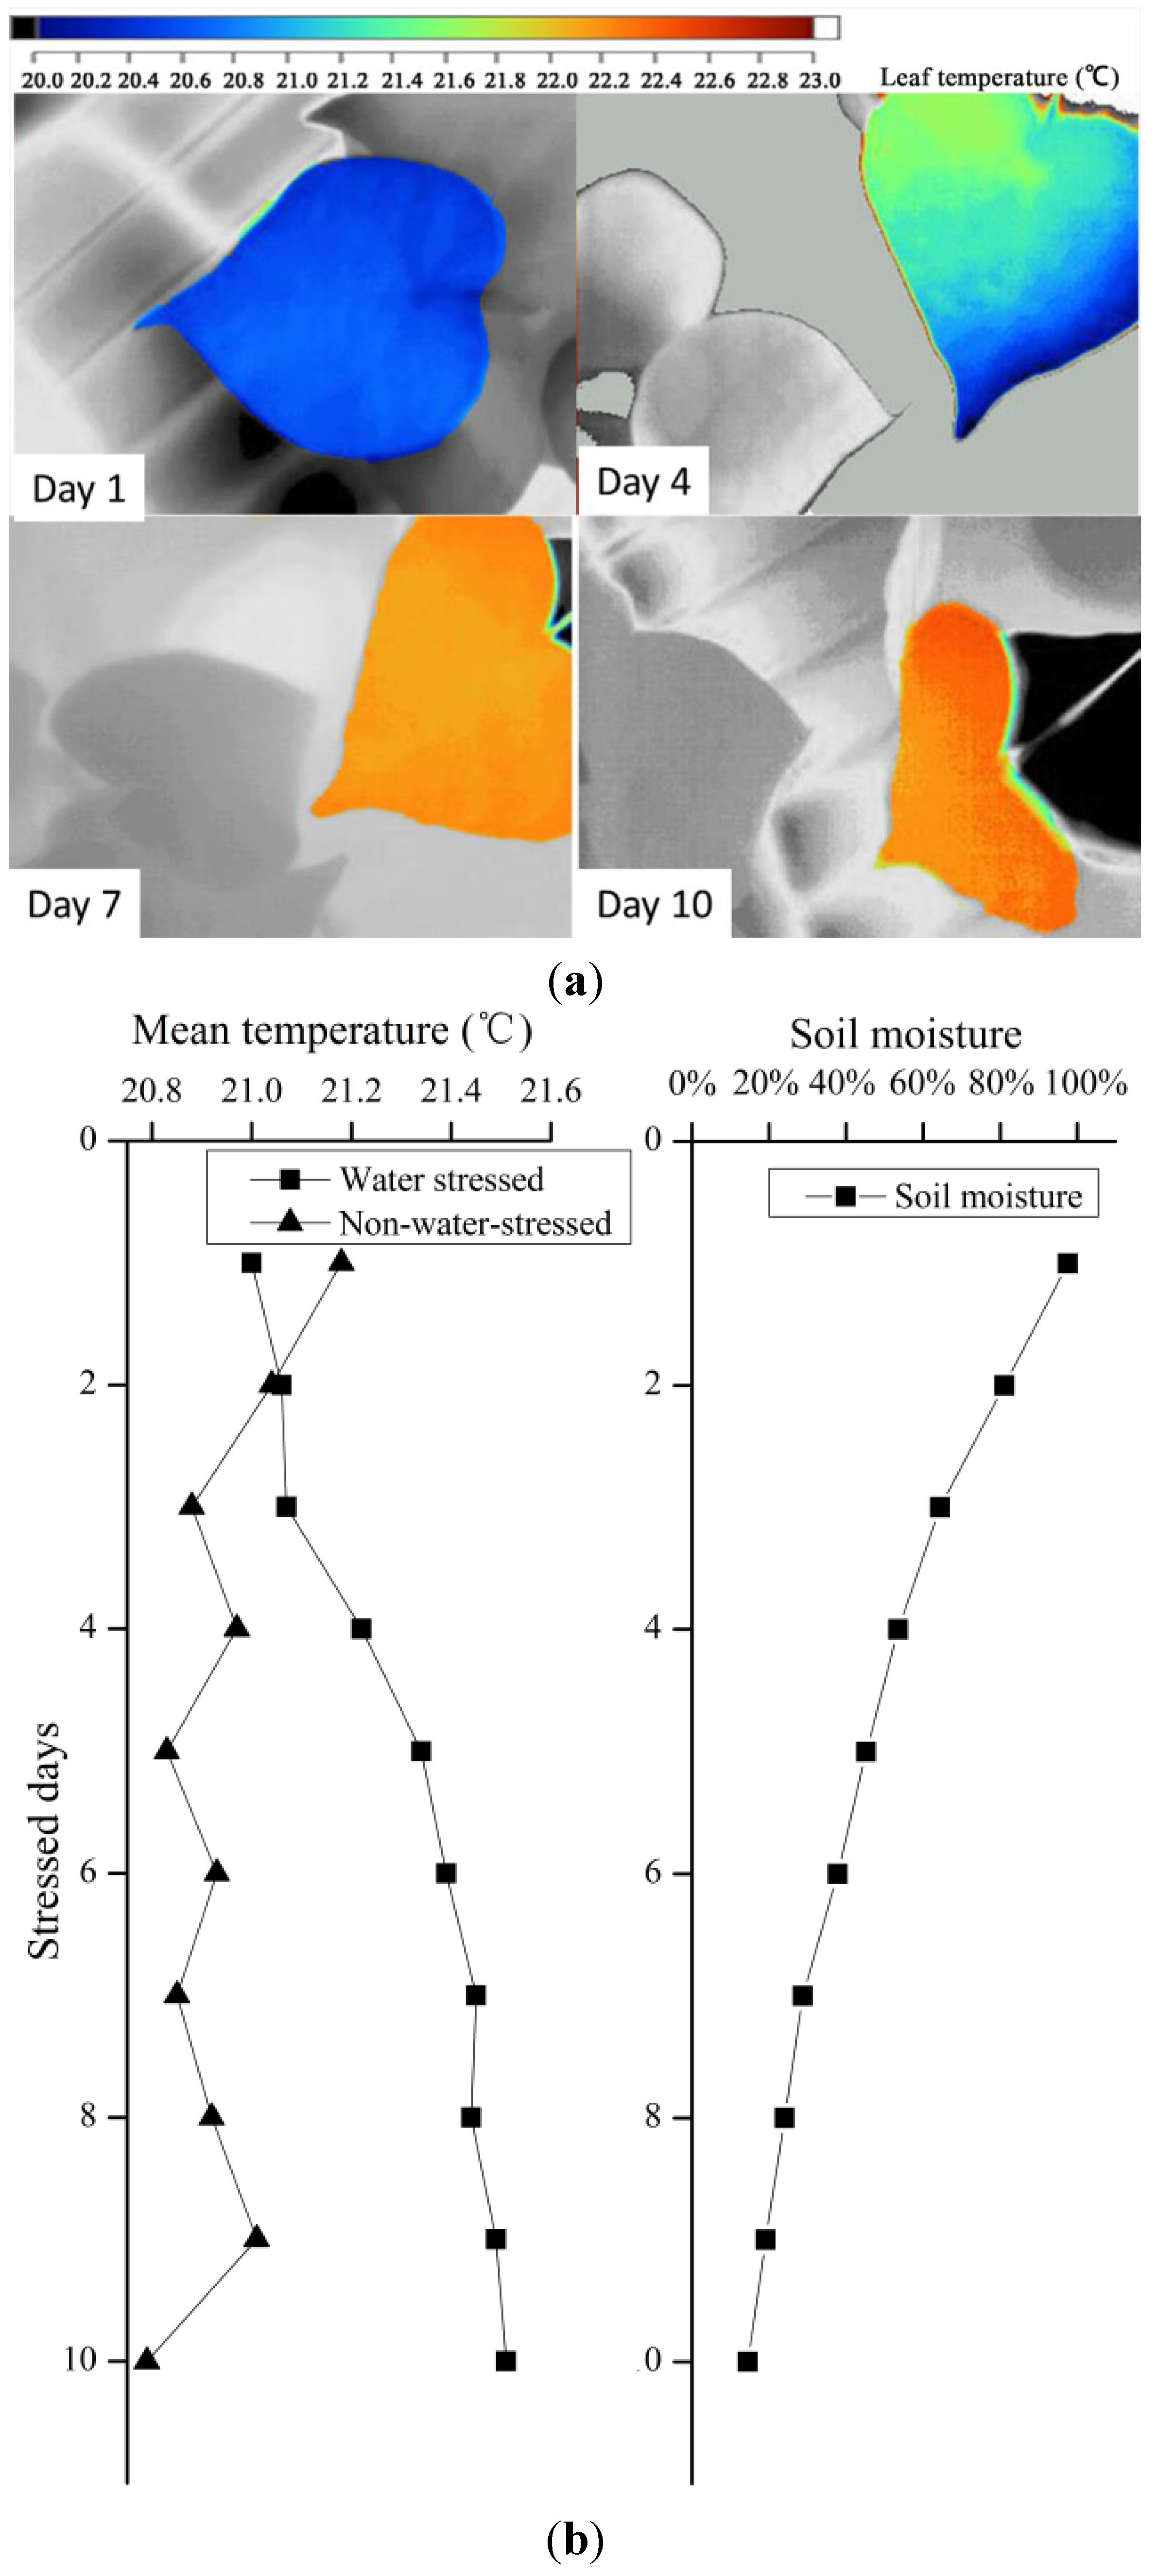
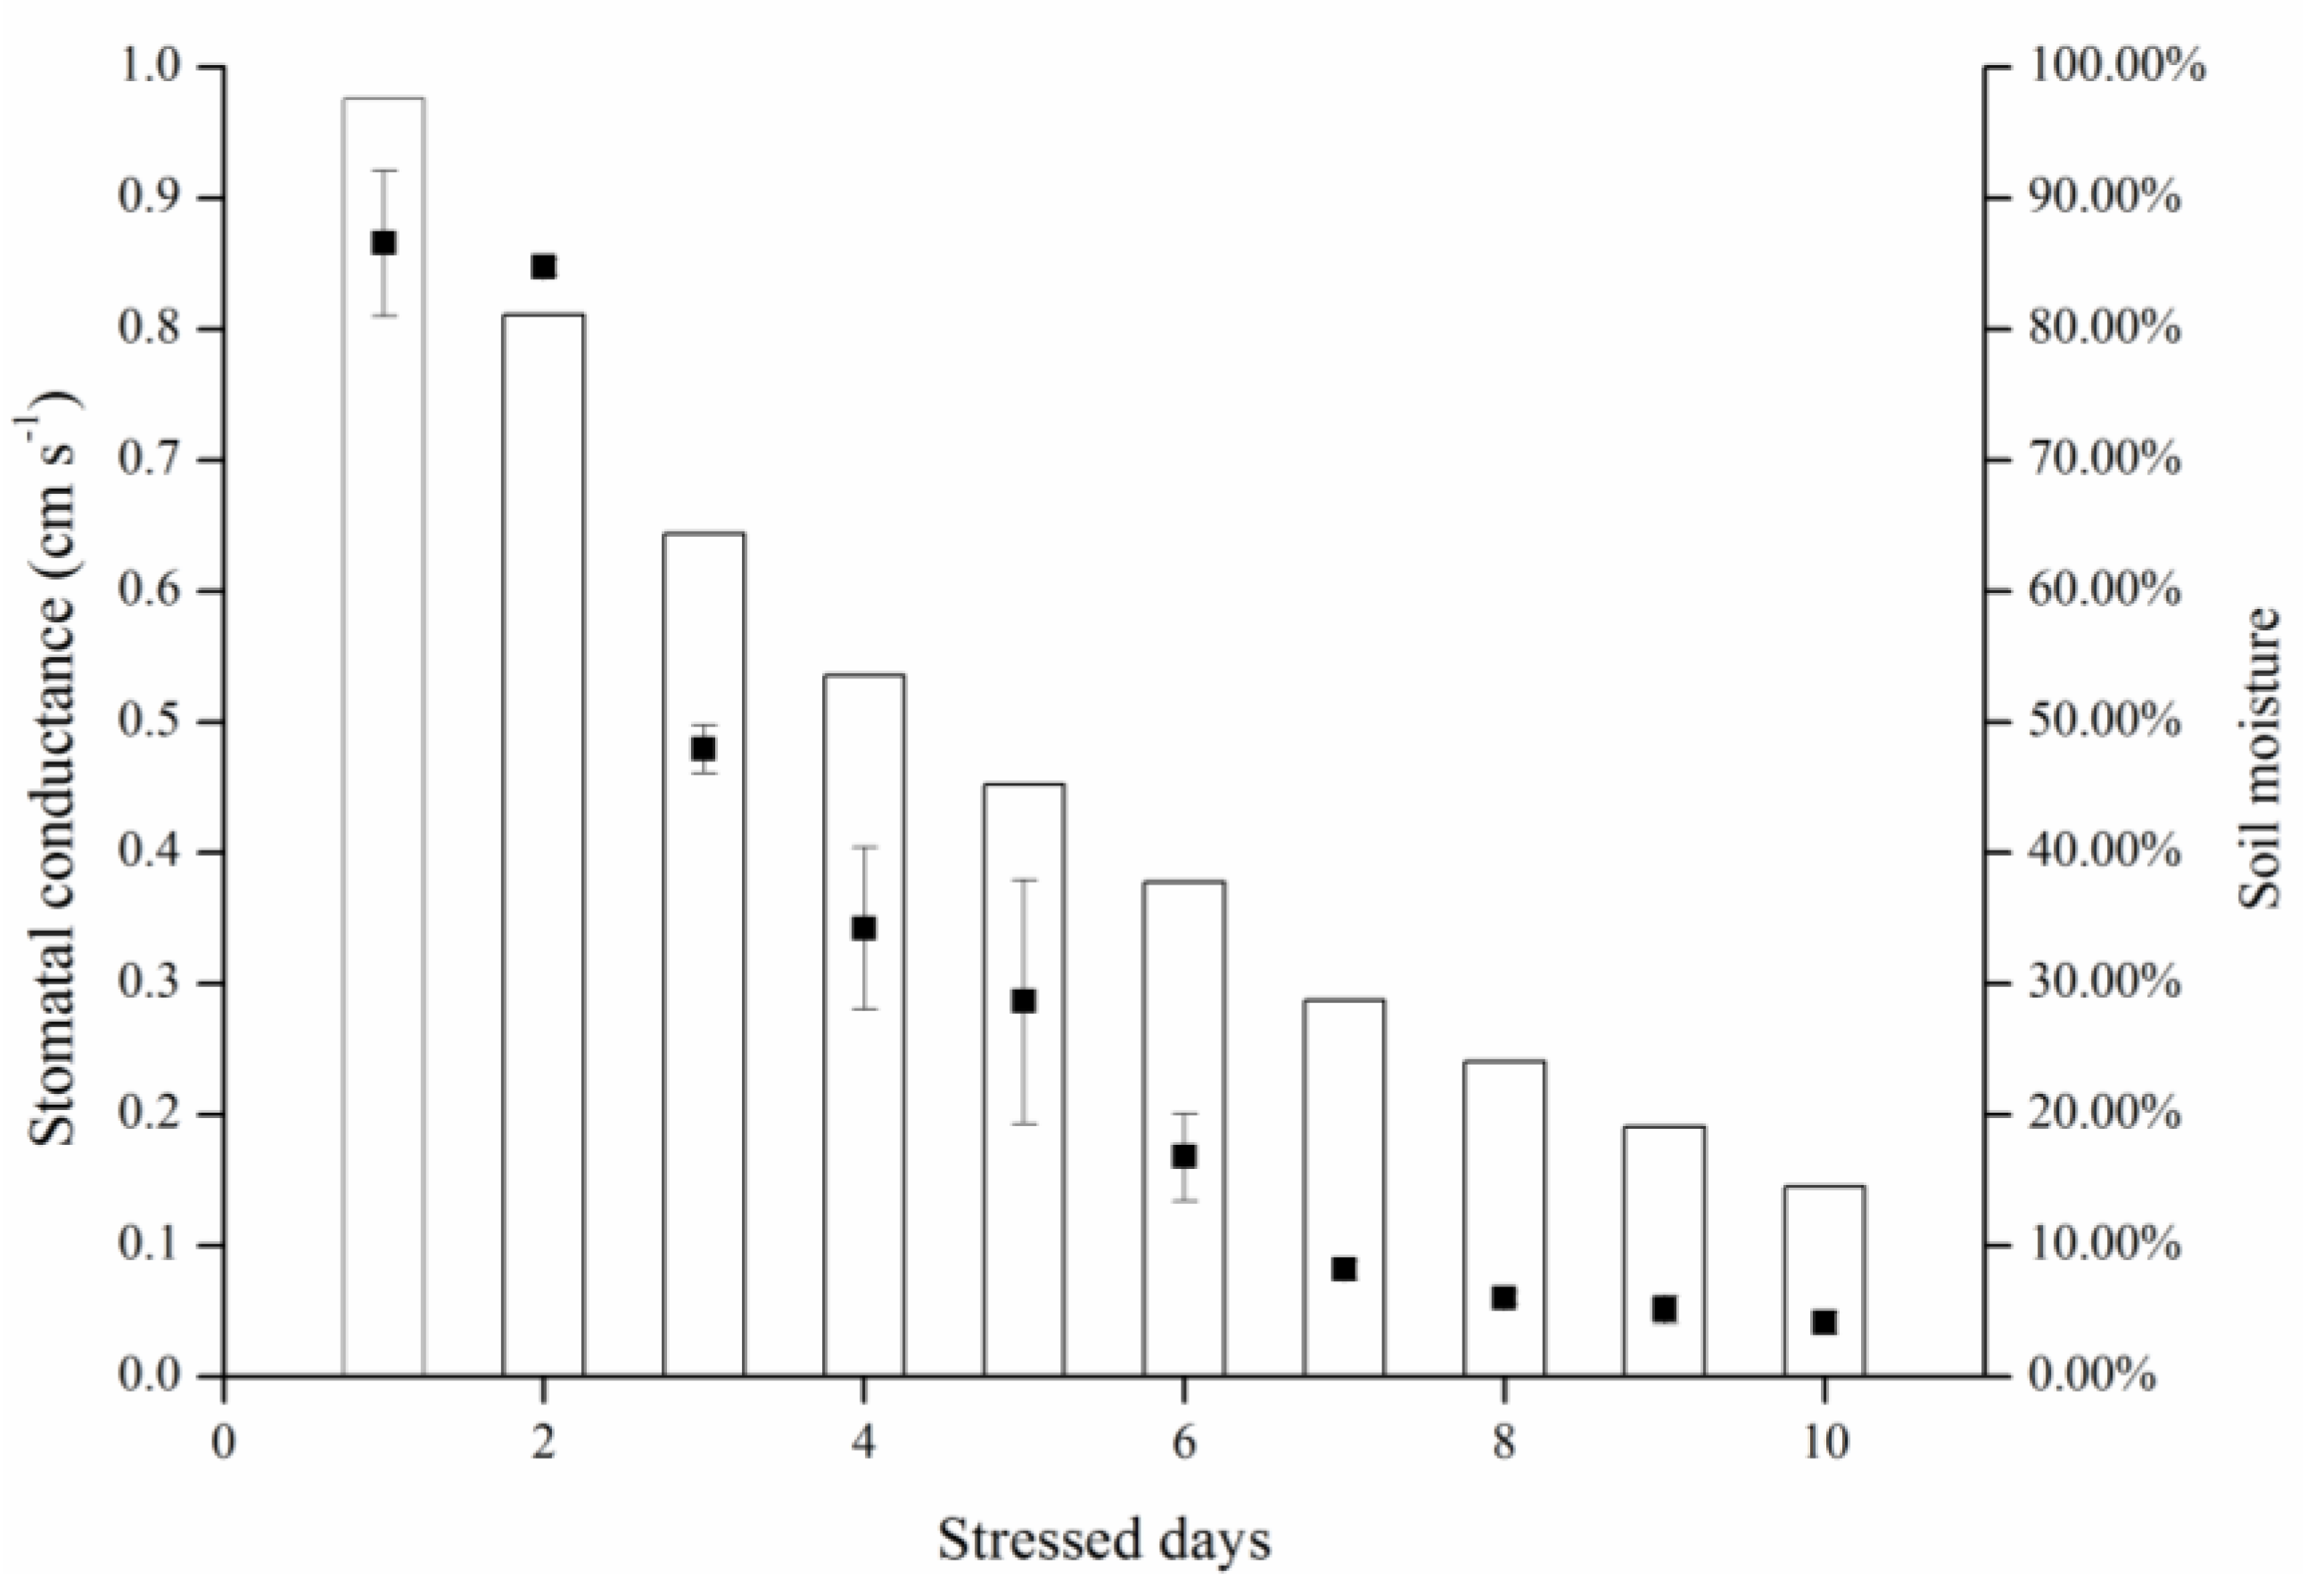
3.2. Canopy Characteristics under Consistent Water Stress

| Canopy | Mean Temperature (°C) | Standard Deviation, sw (°C) |
|---|---|---|
| Initial | 21.0 | 0.013 |
| Stressed | 21.5 | 0.086 |


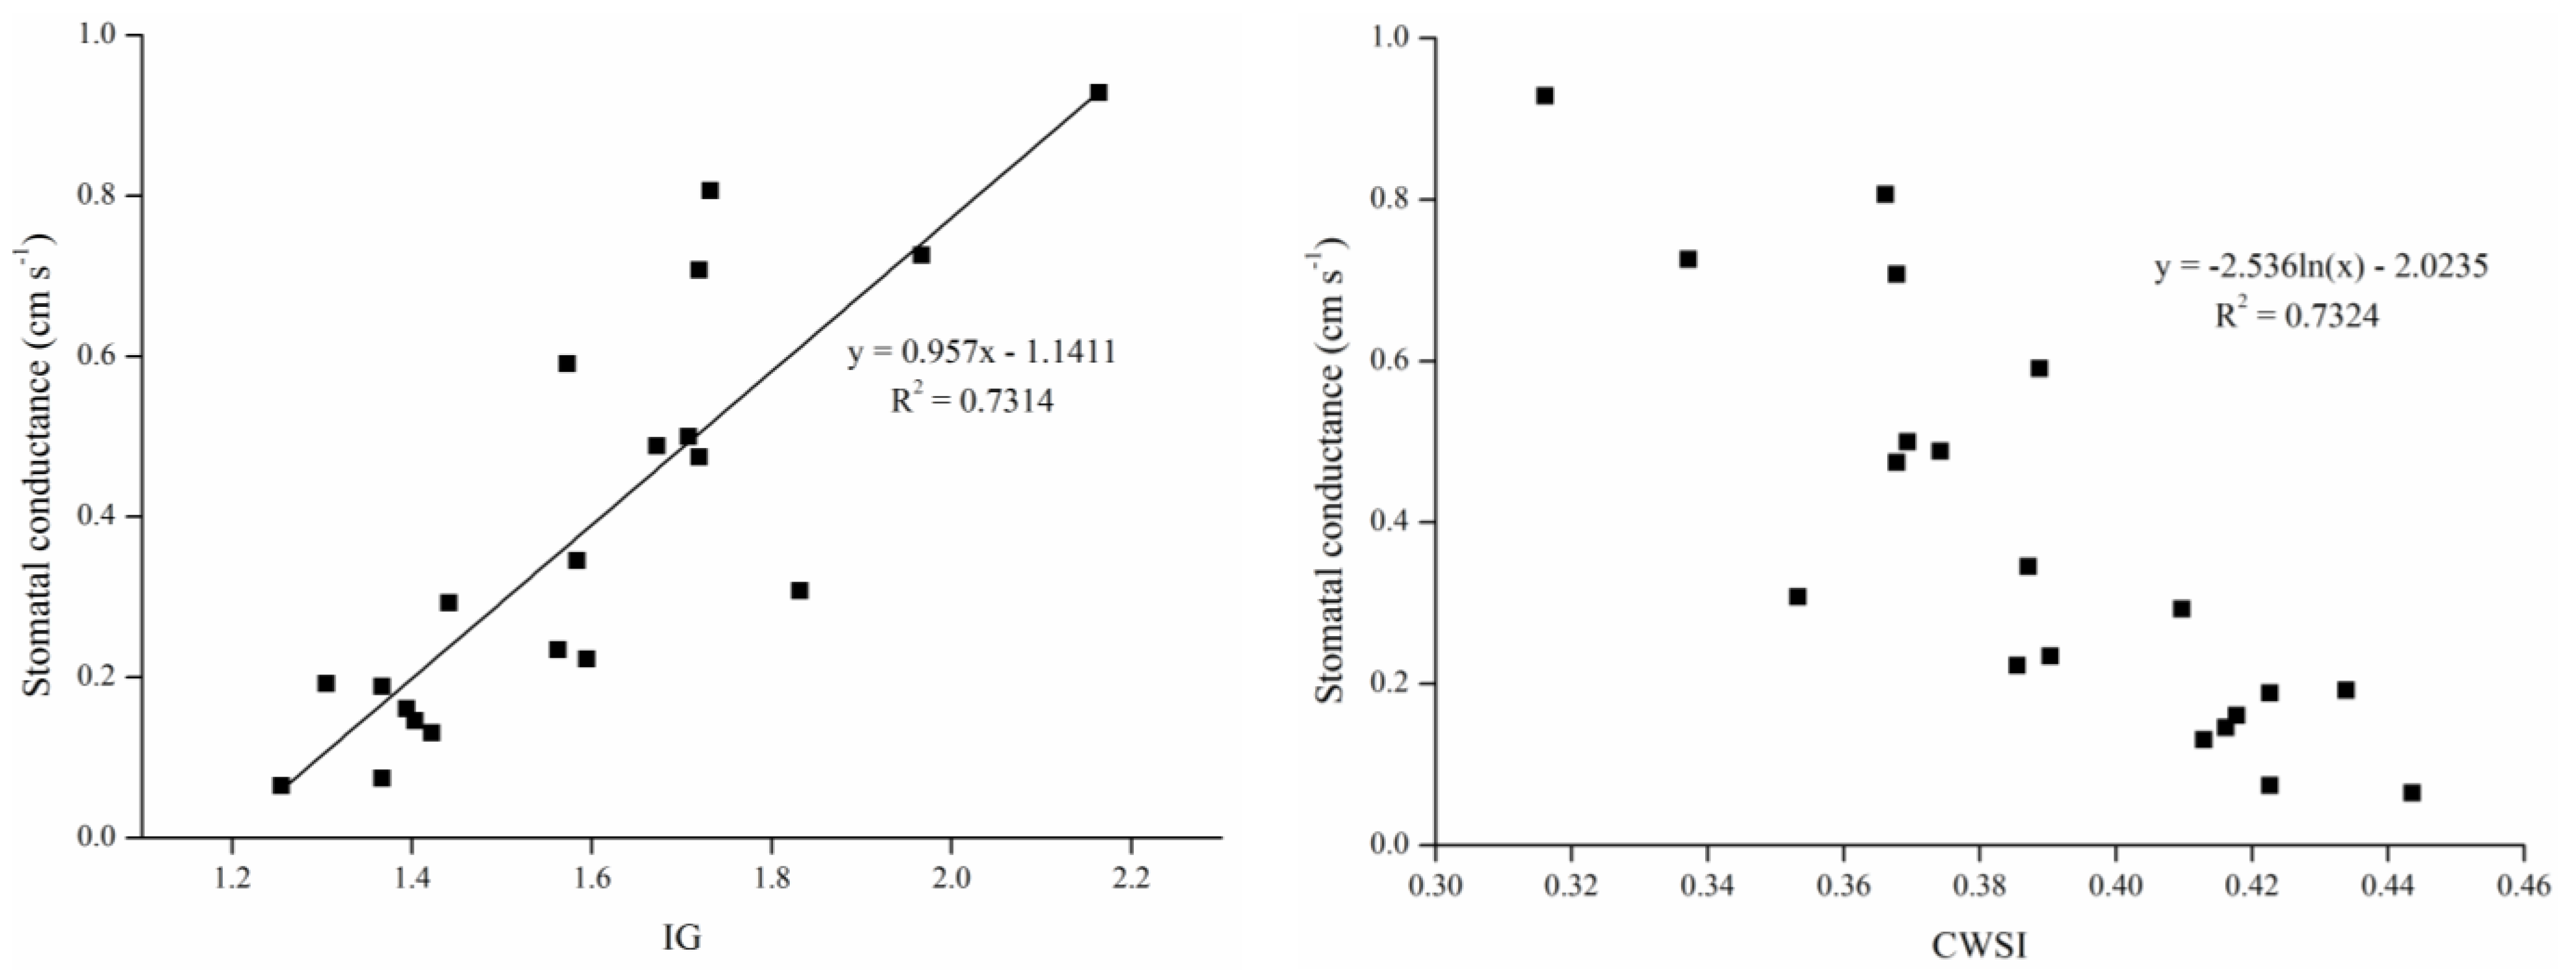
3.3. Relationships among Temperature, Water Status, Stress Indices, and Stomatal Conductances
| Groups | Tleaf | gs | Ig | CWSI | ||||
|---|---|---|---|---|---|---|---|---|
| Mean (°C) | Error | Mean (cm·s−1) | Error | Mean | Error | Mean | Error | |
| A | 21.43 | 0.085 | 0.10 | 0.04 | 1.36 | 0.06 | 0.42 | 0.013 |
| B | 21.41 | 0.083 | 0.21 | 0.06 | 1.38 | 0.05 | 0.42 | 0.009 |
| C | 21.15 | 0.074 | 0.28 | 0.06 | 1.64 | 0.11 | 0.38 | 0.015 |
| D | 21.12 | 0.061 | 0.57 | 0.11 | 1.67 | 0.06 | 0.37 | 0.010 |
| CK | 20.95 | 0.016 | 0.74 | 0.18 | 1.89 | 0.19 | 0.35 | 0.022 |

4. Discussion
4.1. Temperature Variation within Images
4.2. Relationships among Temperature, Water Status, Stress Indices, and Stomatal Conductance
4.3. Gradient and Consistent Drought Stress

5. Conclusions
Acknowledgments
Author Contributions
Conflicts of Interest
References
- Allen, C.D.; Macalady, A.K.; Chenchouni, H.; Bachelet, D.; McDowell, N.; Vennetier, M.; Kizberger, T.; Rigling, A.; Breshears, D.D.; Hogg, E.H.; et al. A global overview of drought and heat-induced tree mortality reveals emerging climate change risks for forests. For. Ecol. Manag. 2000, 259, 660–684. [Google Scholar] [CrossRef]
- Houghton, J.T.; Ding, Y.; Griggs, D.J.; Noguer, M.; van der Linden, P.J.; Xiaosu, D.; Maskell, K.; Johnson, C.A. Climate Change 2001: The Scientific Basis; Cambridge University Press: Cambridge, UK, 2001. [Google Scholar]
- Zimmermann, D.; Reuss, R.; Westhoff, M.; Gessner, P.; Bauer, W.; Bamberg, E.; Bentrup, F.; Zimmermann, U. A novel, non-invasive, online-monitoring, versatile and easy plant-based probe for measuring leaf water status. J. Exp. Bot. 2008, 59, 3157–3167. [Google Scholar] [CrossRef] [PubMed]
- Fernandez, J.E.; Rodriguez-Dominguez, C.M.; Perez-Martin, A.; Zimmermann, U.; Ruger, S.; Martin-Palomo, M.J.; Torres-Ruiza, J.M.; Cuevasa, M.V.; Sannb, C.D.; Ehrenberger, W.; et al. Online-monitoring of tree water stress in a hedgerow olive orchard using the leaf patch clamp pressure probe. Agric. Water Manag. 2011, 100, 25–35. [Google Scholar] [CrossRef]
- Hopmans, J.W.; Bristow, K.L. Soil and Environmental Analysis, Physical Methods, 2nd ed.; Smith, K.A., Mullins, C.E., Eds.; Marcel Dekker: New York, NY, USA, 2001; Volume 103, pp. 355–357. [Google Scholar]
- Collins, M.J.; Fuentes, S.; Barlow, E.W.R. Partial rootzone drying and deficit irrigation increase stomatal sensitivity to vapour pressure deficit in anisohydric grapevines. Funct. Plant Biol. 2010, 37, 128–138. [Google Scholar] [CrossRef]
- Kirkham, M.B. Principles of Soil and Plant Water Relations; Elsevier Academic Press: Amsterdam, Holand, 2005. [Google Scholar]
- Tari, I. Abaxial and adaxial stomatal density, stomatal conductances and water status of bean primary leaves as affected by paclobutrazol. Biol. Plant. 2003, 47, 215–220. [Google Scholar] [CrossRef]
- Jiang, Q.; Roche, D.; Monaco, T.A.; Hole, D. Stomatal conductance is a key parameter to assess limitations to photosynthesis and growth potential in barley genotypes. Plant Biol. 2006, 8, 515–521. [Google Scholar] [CrossRef] [PubMed]
- Jones, H.G.; Serraj, R.; Loveys, B.R.; Xiong, L.Z.; Wheaton, A.; Price, A.H. Thermal infrared imaging of crop canopies for the remote diagnosis and quantification of plant responses to water stress in the field. Funct. Plant Biol. 2009, 36, 978–989. [Google Scholar] [CrossRef]
- Jones, H.G.; Stoll, M.; Santos, T.; de Sousa, C.; Chaves, M.M.; Grant, O.M. Use of infrared thermography for monitoring stomatal closure in the field: Application to grapevine. J. Exp. Bot. 2002, 53, 2249–2260. [Google Scholar] [CrossRef] [PubMed]
- Merlot, S.; Mustilli, A.C.; Genty, B.; North, H.; Lefebvre, V.; Sotta, B.; Vavasseur, A.; Giraudat, J. Use of infrared thermal imaging to isolate Arabidopsis mutants defective in stomatal regulation. Plant J. 2002, 30, 601–609. [Google Scholar] [CrossRef] [PubMed]
- Jarvis, P.G.; Mansfield, T.A. Stomatal Physiology; Cambridge University Press: Cambridge, UK, 1981. [Google Scholar]
- Leinonen, I.; Jones, H.G. Combining thermal and visible imagery for estimating canopy temperature and identifying plant stress. J. Exp. Bot. 2004, 55, 1423–1431. [Google Scholar] [CrossRef] [PubMed]
- Jones, H.G. Plants and Microclimate: A Quantitative Approach to Environmental Plant Physiology; Cambridge University Press: Cambridge, UK, 1983. [Google Scholar]
- Grant, O.M.; Tronina, L.; Jones, H.G.; Chaves, M.M. Exploring thermal imaging variables for the detection of stress responses in grapevine under different irrigation regimes. J. Exp. Bot. 2007, 58, 815–825. [Google Scholar] [CrossRef] [PubMed]
- Giuliani, R.; Flore, J.A.; Ferreira, M.I.; Jones, H.G. Potential use of infra-red thermometry for the detection of water stress in apple trees. In Proceedings of the Third International Symposium on Irrigation of Horticultural Crops, Estoril (Lisbon), Portugal, 28 June–2 July 1999.
- Jones, H.G. Use of infrared thermometry for estimation of stomatal conductance as a possible aid to irrigation scheduling. Agric. For. Meteorol. 1999, 95, 139–149. [Google Scholar] [CrossRef]
- Sherwood, B. A set of equations for full spectrum and 8- to 14-μm and 10.5- to 12.5-μm thermal radiation from cloudless skies. Water Resour. Res. 1981, 17, 295–304. [Google Scholar]
- Jackson, R.D. Canopy temperature and crop water stress. Adv. Irrig. 1982, 1, 43–85. [Google Scholar]
- Richards, J.A. Computer processing of remotely-sensed images: An introduction. Earth-Sci. Rev. 2004, 27, 392–394. [Google Scholar] [CrossRef]
- Campbell, J.B. Introduction to Remote Sensing; Taylor and Francis: London, UK, 1996. [Google Scholar]
- Corp, L.A.; Mcmurtrey, J.E.; Middleton, E.M.; Mulchi, C.L.; Chappelle, E.W.; Daughtry, C.S.T. Fluorescence sensing systems: In vivo detection of biophysical variations in field corn due to nitrogen supply. Remote Sens. Environ. 2003, 86, 470–479. [Google Scholar] [CrossRef]
- Schuerger, A.C.; Capelle, G.A.; di Benedetto, J.A.; Mao, C.Y.; Thai, C.N.; Evans, M.D.; Richards, J.T.; Blank, T.A.; Stryjewski, E.C. Comparison of two hyperspectral imaging and two laser-induced fluorescence instruments for the detection of zinc stress and chlorophyll concentration in bahia grass (Paspalum notatum Flugge.). Remote Sens. Environ. 2003, 84, 572–588. [Google Scholar] [CrossRef]
- Fuchs, M. Infrared measurement of canopy temperature and detection of plant water stress. Theor. Appl. Climatol. 1990, 42, 253–261. [Google Scholar] [CrossRef]
- Guilioni, L.; Jones, H.G.; Leinonen, I.; Lhomme, J.P. On the relationships between stomatal resistance and leaf temperatures in thermography. Agric. For. Meteorol. 2008, 148, 1908–1912. [Google Scholar] [CrossRef]
© 2015 by the authors; licensee MDPI, Basel, Switzerland. This article is an open access article distributed under the terms and conditions of the Creative Commons Attribution license (http://creativecommons.org/licenses/by/4.0/).
Share and Cite
Yu, M.-H.; Ding, G.-D.; Gao, G.-L.; Zhao, Y.-Y.; Yan, L.; Sai, K. Using Plant Temperature to Evaluate the Response of Stomatal Conductance to Soil Moisture Deficit. Forests 2015, 6, 3748-3762. https://doi.org/10.3390/f6103748
Yu M-H, Ding G-D, Gao G-L, Zhao Y-Y, Yan L, Sai K. Using Plant Temperature to Evaluate the Response of Stomatal Conductance to Soil Moisture Deficit. Forests. 2015; 6(10):3748-3762. https://doi.org/10.3390/f6103748
Chicago/Turabian StyleYu, Ming-Han, Guo-Dong Ding, Guang-Lei Gao, Yuan-Yuan Zhao, Lei Yan, and Ke Sai. 2015. "Using Plant Temperature to Evaluate the Response of Stomatal Conductance to Soil Moisture Deficit" Forests 6, no. 10: 3748-3762. https://doi.org/10.3390/f6103748
APA StyleYu, M.-H., Ding, G.-D., Gao, G.-L., Zhao, Y.-Y., Yan, L., & Sai, K. (2015). Using Plant Temperature to Evaluate the Response of Stomatal Conductance to Soil Moisture Deficit. Forests, 6(10), 3748-3762. https://doi.org/10.3390/f6103748