
Deciphering Corporate Governance and Environmental Commitments among Southeast Asian Transnationals: Uptake of Sustainability Certification

Abstract
:1. Introduction
2. Material and Methods
2.1. Selection of Transnationals and Analysis of Their Audited Accounts

| Transnational | Number of Companies | Market Capital (Million US $) | Repartition of Ownership | Diversification Investment Strategy | Ethnicity of Ultimate Controllers | ||
|---|---|---|---|---|---|---|---|
| Family | Government | Others | |||||
| WTK | 78 | 70 | 47.86% | 1.69% | 49.55% | Related | Chinese |
| Ta Ann | 101 | 90 | 50.25% | 9.36% | 40.39% | Related | Chinese |
| Olam | 172 | 1680 | 22% | 14.40% | 63.60% | Related | Indian |
| Sime Darby | 580 | 1820 | 0% | 67.86% | 32.14% | Unrelated | - |
| Total | 931 | 3660 | |||||
2.2. Network Analysis

| Network Metrics | Equation | Economic Meaning | Comment | |
|---|---|---|---|---|
| Network clustering coefficient | (1) | Average Cross-shareholding coefficient | (1) is an average of the clustering indices of all the companies of the ownership structure. This coefficient expresses the average degree of cross-shareholding within the shareholder structure. | |
| Average shortest path length | (2) | Average ownership tier | (2) is the average shortest distance between two companies within the ownership structure. It is similar to the average tier rank of subsidiaries, but it applies both vertically and horizontally. | |
| % of shortest paths | (3) | Co-management index | Expressed as a % or as a fraction, (3) is the number of shortest ownership lines over the maximum theoretical possible number of direct shareholdings. | |
| Clustering coefficient | (4) | Cross-shareholding coefficient | (4) is a ratio of the number of actual ownership links of one company with its direct shareholders and subsidiaries, over the theoretical possible number of cross-shareholdings of all these direct shareholders and companies. This coefficient expresses the degree of cross-shareholding around one company. | |
| Reciprocal of % of shortest paths | (5) | Hierarchy index | Expressed as a % or as a fraction, (5) is the reciprocal of the number of shortest ownership lines over the maximum theoretical possible number of direct shareholdings. The higher it is, the more hierarchical the ownership structure is. The structure forms pyramids of tiered subsidiaries. The structure tends to look like a pyramid or a star. | |
| Geodesic distance | (6) | Tier | (6) is the number of successive ownership links between two companies | |
| Number of nodes | (7) | Number of companies | (7) is the size of the group, in number of companies. | |
| Number of shortest paths | (8) | Number of shortest ownership lines | (8) is the shortest ownership lines are the smallest ownership distance (horizontally or vertically) between two given companies within the ownership structure. There are a limited number of these shortest ownership lines, which is always a fraction of the maximum theoretical possible number of direct ownership pairs. The smaller the number of ownership lines, the more hierarchical is the ownership structure. | |
| Network diameter | (9) | Ownership structure diameter | (9) is the largest distance between two companies within the ownership structure. It is similar to the largest tier rank of subsidiaries, but it applies both vertically and horizontally. | |
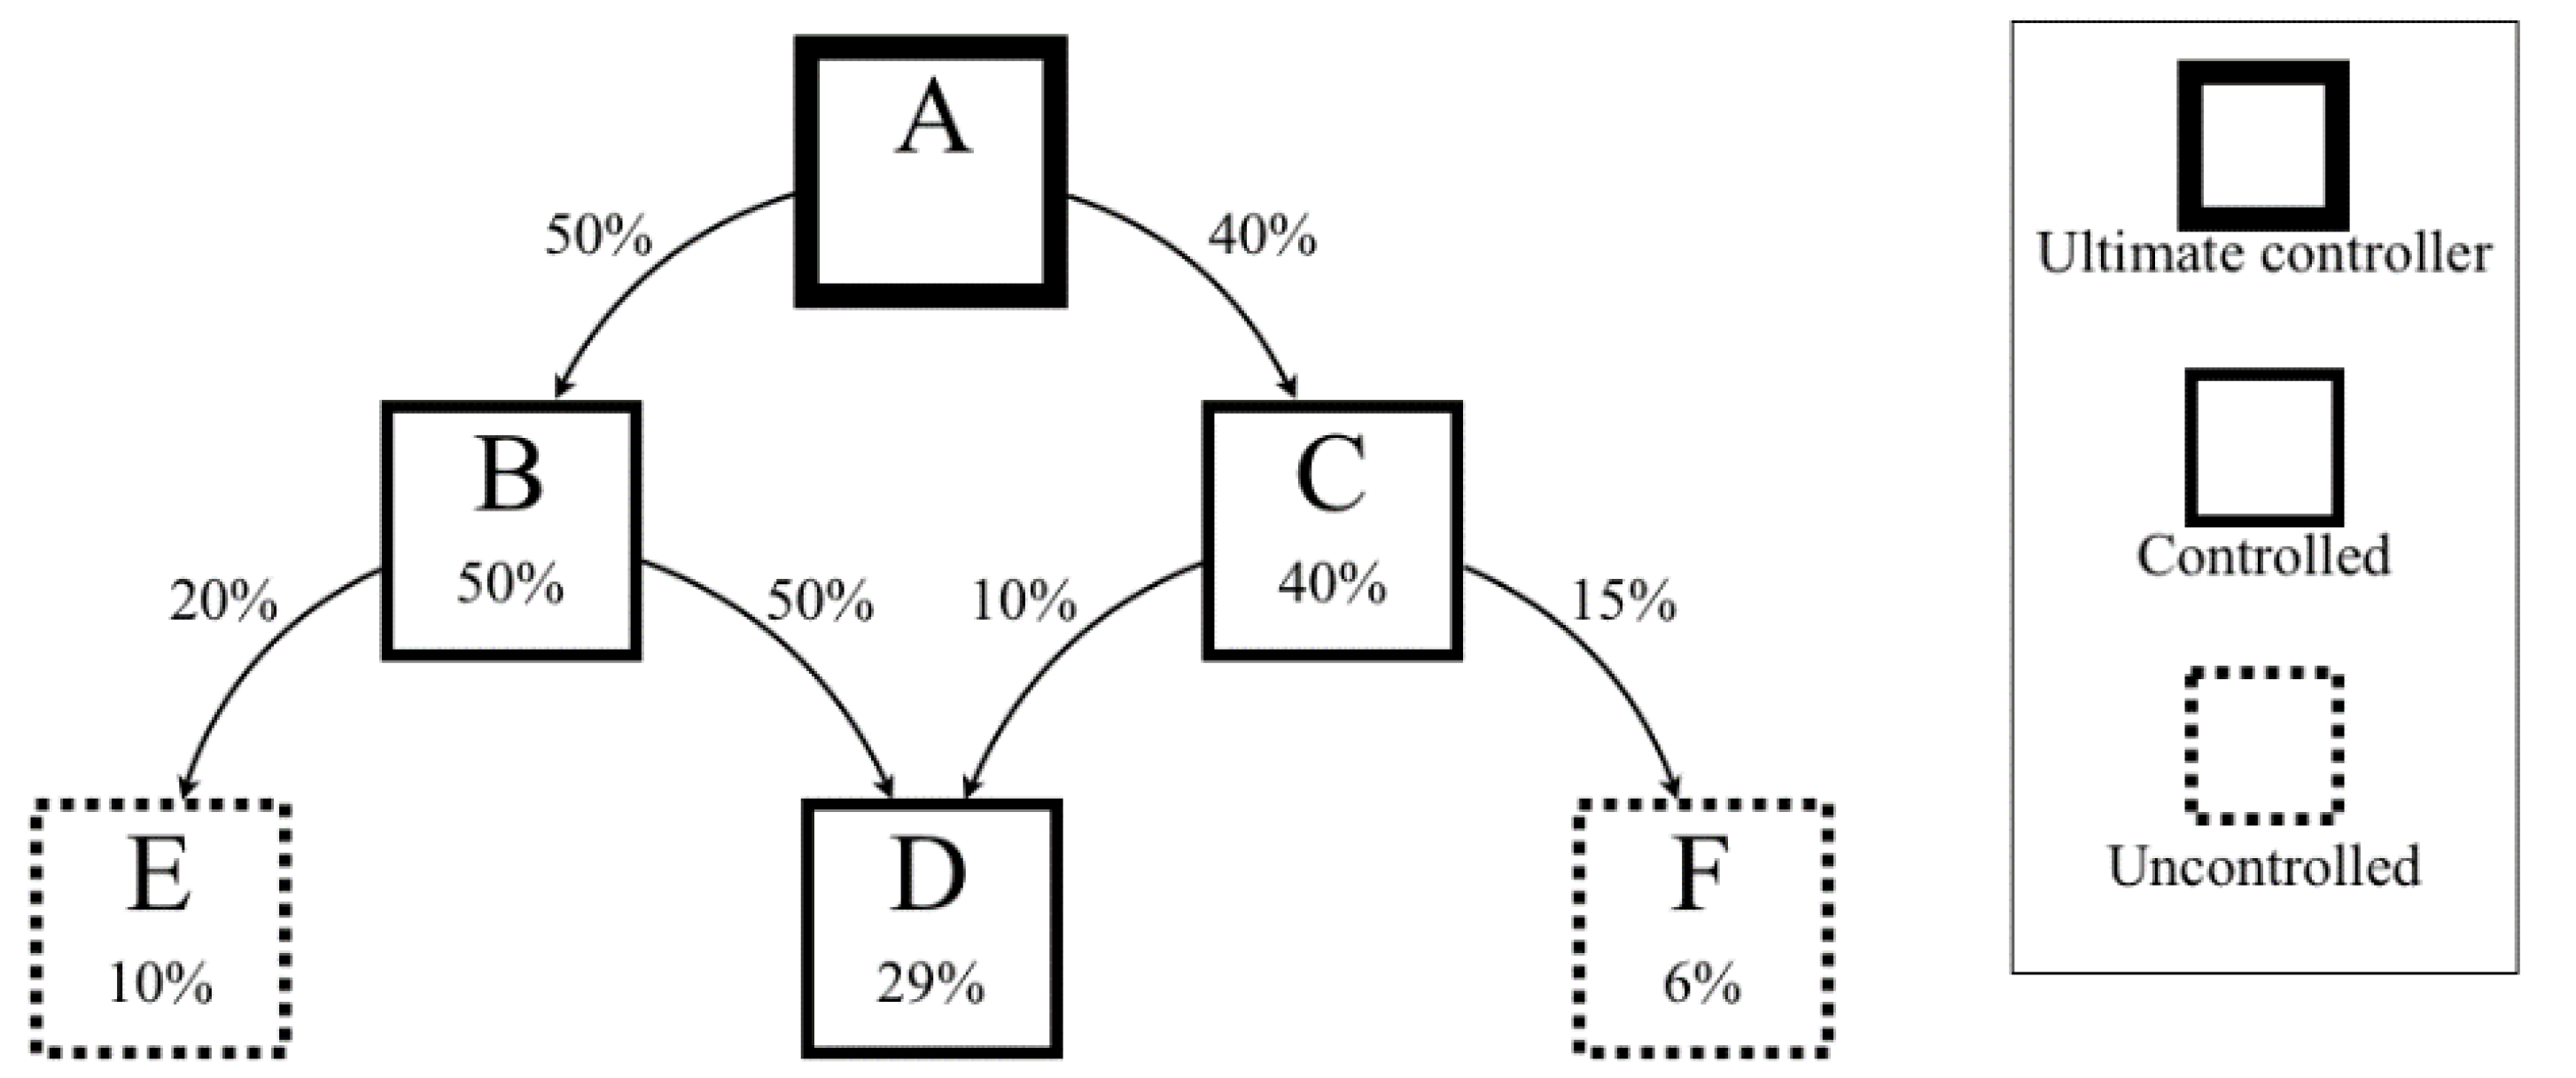
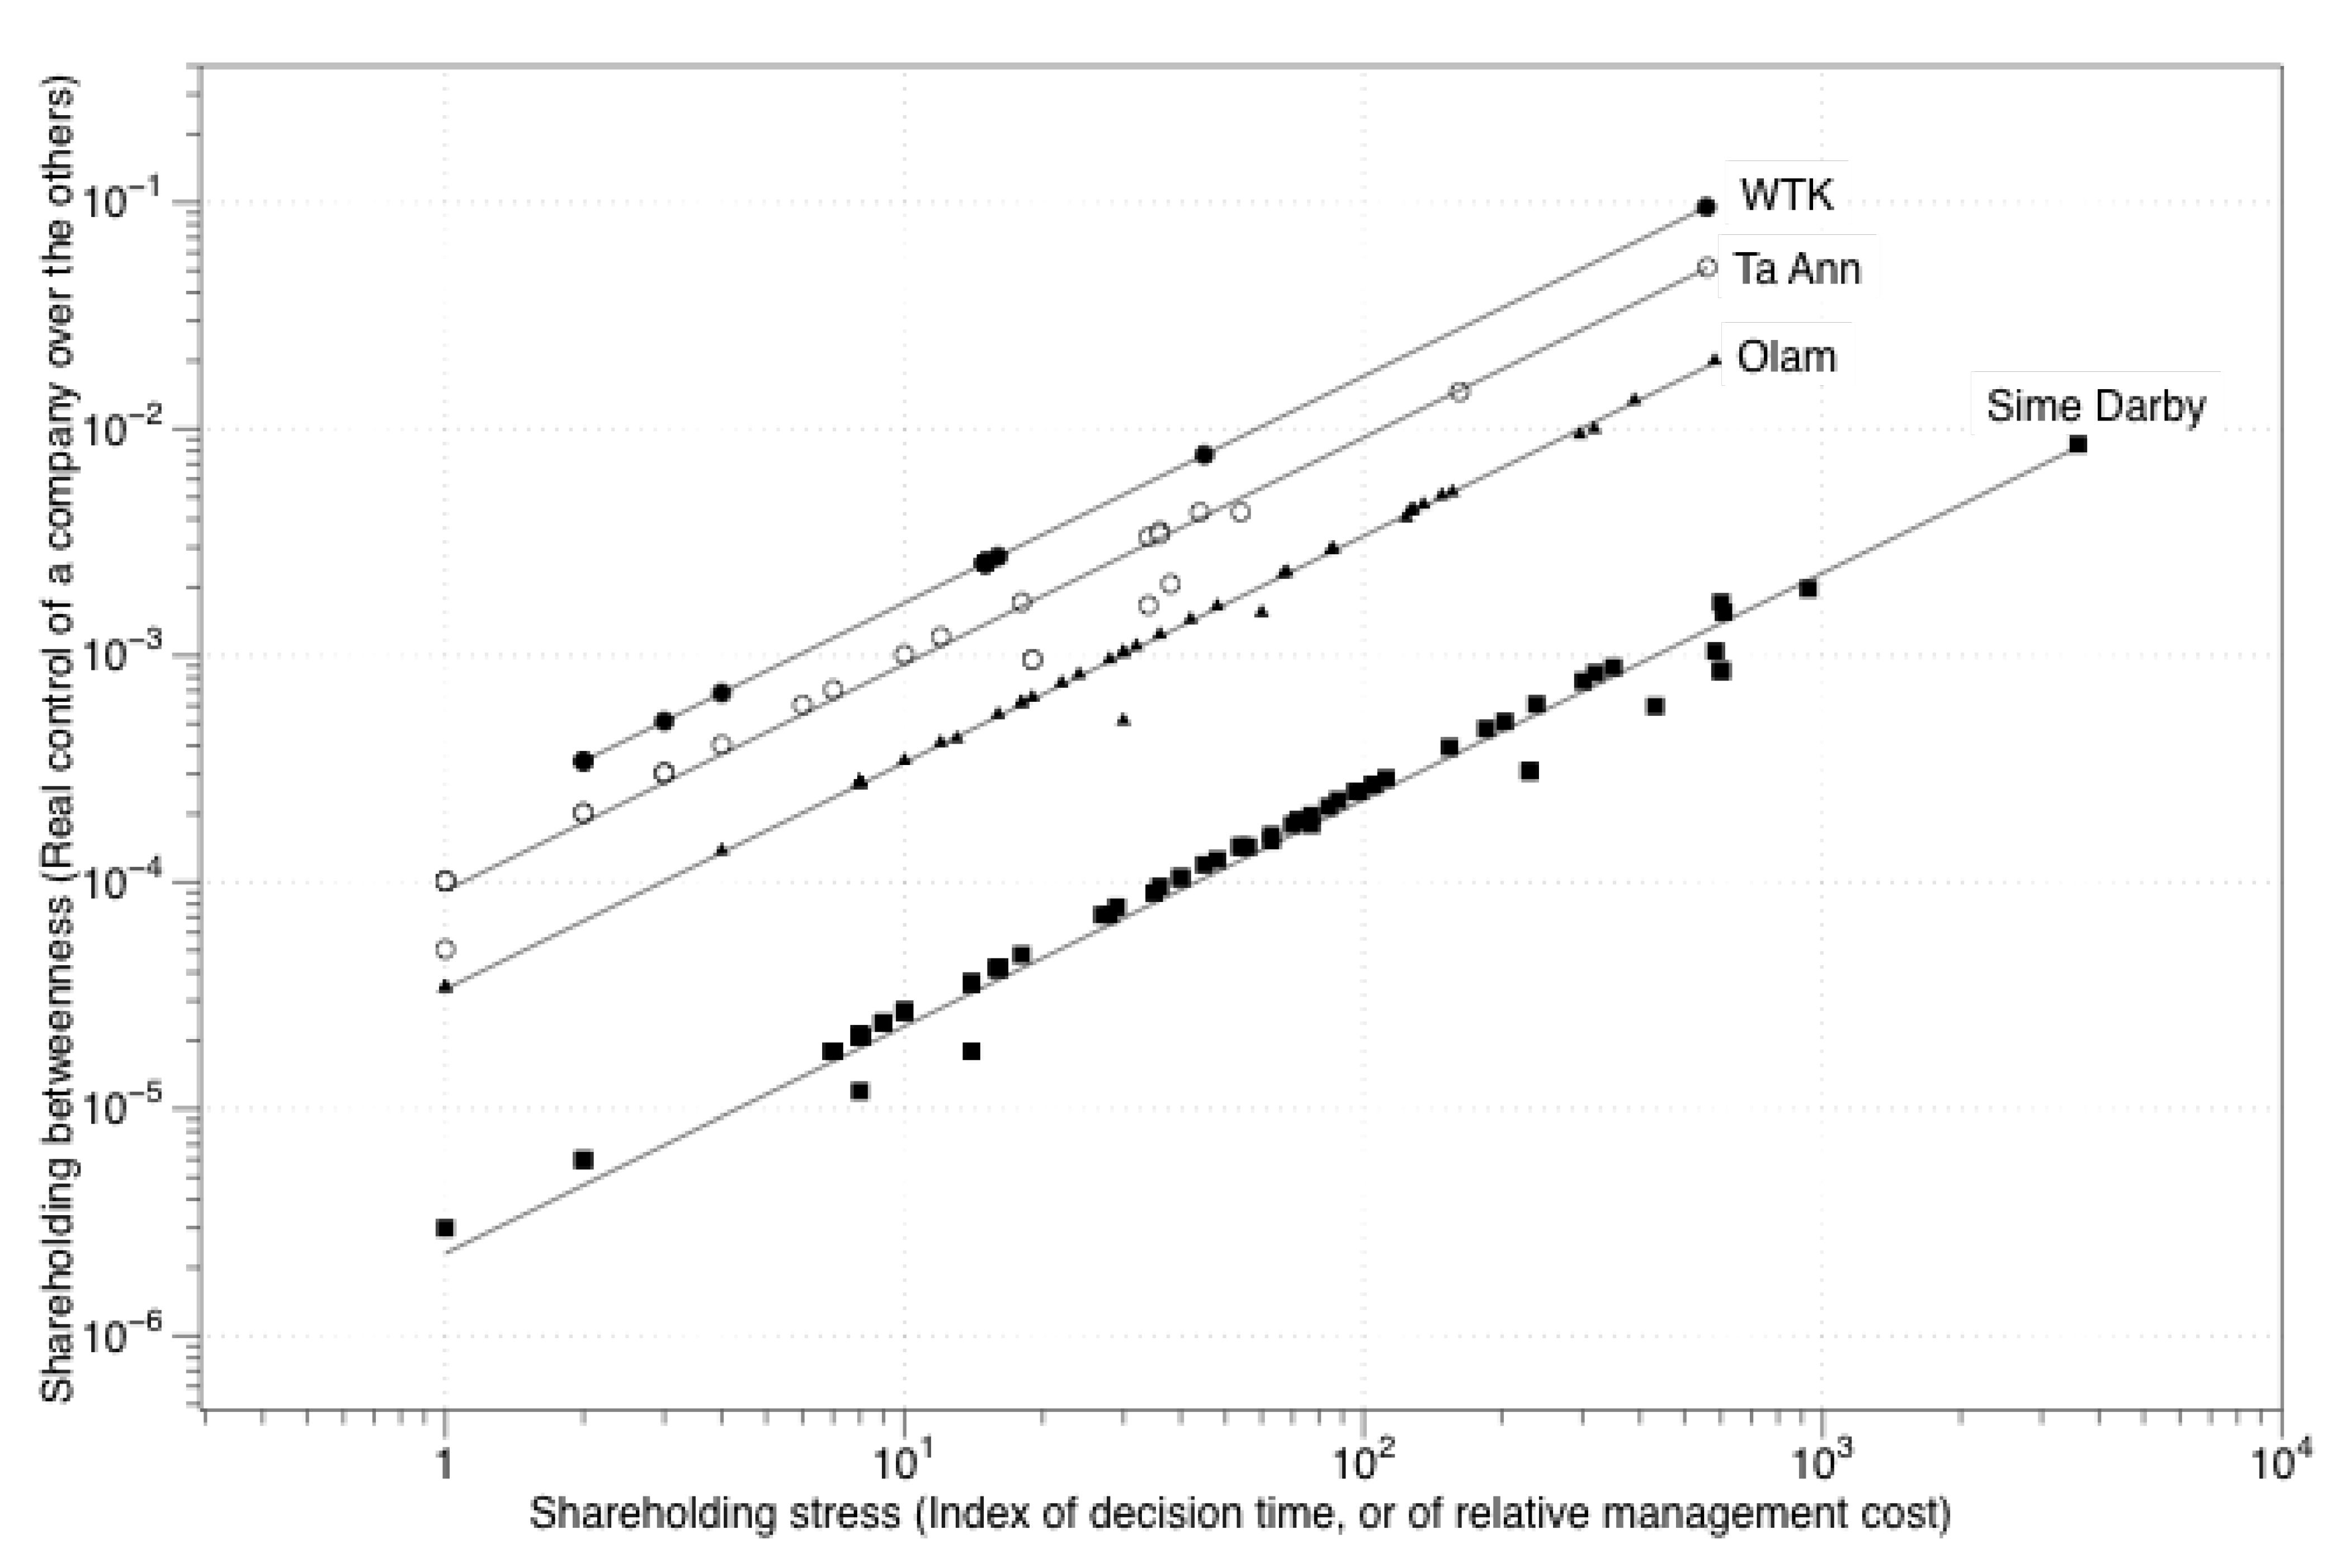
| Betweenness centrality | (10) | Shareholding betweenness | (10) is the number of shortest ownership lines passing through one company, compared to all the shortest ownership lines. It is an index of the real control exerted by one company over the ownership structure. | |
| Closeness centrality | (11) | Shareholding closeness | (11) is the reciprocal of the average shortest distance between two companies within the ownership structure (reciprocal of B = Average ownership tier). This index expresses how fast board decisions or strategic adaptations can be transmitted or propagated within the ownership structures. | |
| Stress centrality | (13) | Shareholding stress | (12) is the absolute number of shortest ownership lines passing through one company. It is a index of the time taken to apply a decision to the group, or of the internal transaction cost. |
2.3. Eco-Certification as a Proxy of Environmental Commitment
| Transnational | Forest Stewardship Council (FSC) | Pan European Forest Certificate (PEFC) | Any Forest Certificate | Round Table on Sustainable Palm Oil (RSPO) | Any Forest or Palm Oil Certificate |
|---|---|---|---|---|---|
| WTK | - | - | - | - | - |
| Ta Ann | - | Yes | Yes | - | Yes |
| Olam | Yes | - | Yes | Yes | Yes |
| Sime Darby | - | - | - | Yes | Yes |
3. Results and Discussion
3.1. Ownership Structures


| Metrics | WTK | Ta Ann | Olam | Sime Darby | TSS | F value | Pr (>F) | ||
|---|---|---|---|---|---|---|---|---|---|
| Group | Res. | ||||||||
| N | 78 | 101 | 172 | 580 | |||||
| Cross-shareholding | Mean | 0.019 | 0.023 | 0.078 | 0.001 | 0.808 | 5.838 | 42.77 | <2 × 10⁻¹⁶ |
| Coefficient | SD | 0.066 | 0.079 | 0.167 | 0.010 | *** | |||
| Average ownership | Mean | 0.545 | 0.782 | 0.616 | 0.206 | 45.4 | 542.7 | 25.82 | <4.82 × 10⁻¹⁶ |
| Tier | SD | 0.841 | 0.938 | 1.126 | 0.563 | *** | |||
| Shareholding | Mean | 1.435 | 1.515 | 1.424 | 1.056 | 34.9 | 681.5 | 15.8 | 4.99 × 10⁻¹⁰ |
| Degree | SD | 1.717 | 1.741 | 0.802 | 0.267 | *** | |||
| Shareholding | Mean | −6.134 | −7.188 | −6.815 | −9.407 | 287.8 | 393.0 | 40.3 | <2 × 10⁻¹⁶ |
| Betweenness | SD | 1.483 | 1.681 | 1.458 | 1.555 | *** | |||
| Hierarchy index | % | 89% | 93% | 96% | 99% | - | - | - | - |
| Ethnicity of Management | N | Estimate | SE | t value | Pr (>|t|) |
|---|---|---|---|---|---|
| Indian-Chinese | 172–179 | −0.06295 | 0.08188 | −0.769 | 0.719 |
| None-Chinese | 579–179 | −0.47227 | 0.06558 | −7.201 | <1 × 10⁻⁵ *** |
| None-Indian | 579–172 | −0.40932 | 0.06659 | −6.147 | <1 × 10⁻⁵ *** |
3.2. Capital and Its Control

| Dim.1 | Dim.2 | Dim.3 | |
|---|---|---|---|
| Eigenvalue | 5.527 | 3.709 | 2.312 |
| Percentage of variance | 29.09 | 19.52 | 12.16 |
| Cumulative percentage of variance | 29.09 | 48.61 | 60.78 |
| Contributions | Dim.1 | Dim.2 | Dim.3 |
| Environmental commitment factors | (−) 14.26 | (+) 04.88 | |
| Proportion of shareholders to subsidiaries | (+) 13.92 | (−) 03.69 | |
| Hierarchy index | (−) 12.98 | ||
| Average ownership tier | (−) 08.37 | (+) 14.98 | |
| Average cross-shareholding | (+) 05.27 | (+) 27.52 | |
| Average ownership tier | (+) 05.19 | ||
| Number of subsidiaries | (+) 15.52 | ||
| Cross-shareholding coefficient | (+) 09.31 | ||
| Shareholding stress (decision delay, transact. cost) | (+) 12.64 | ||
| Ownership structure diameter | (+) 38.90 | ||
| Dim.1 | Dim.2 | Dim.1 + Dim.2 | |
| % of eigenvalues of env. commitment factors | 78.83% | 18.11% | 96.94% |
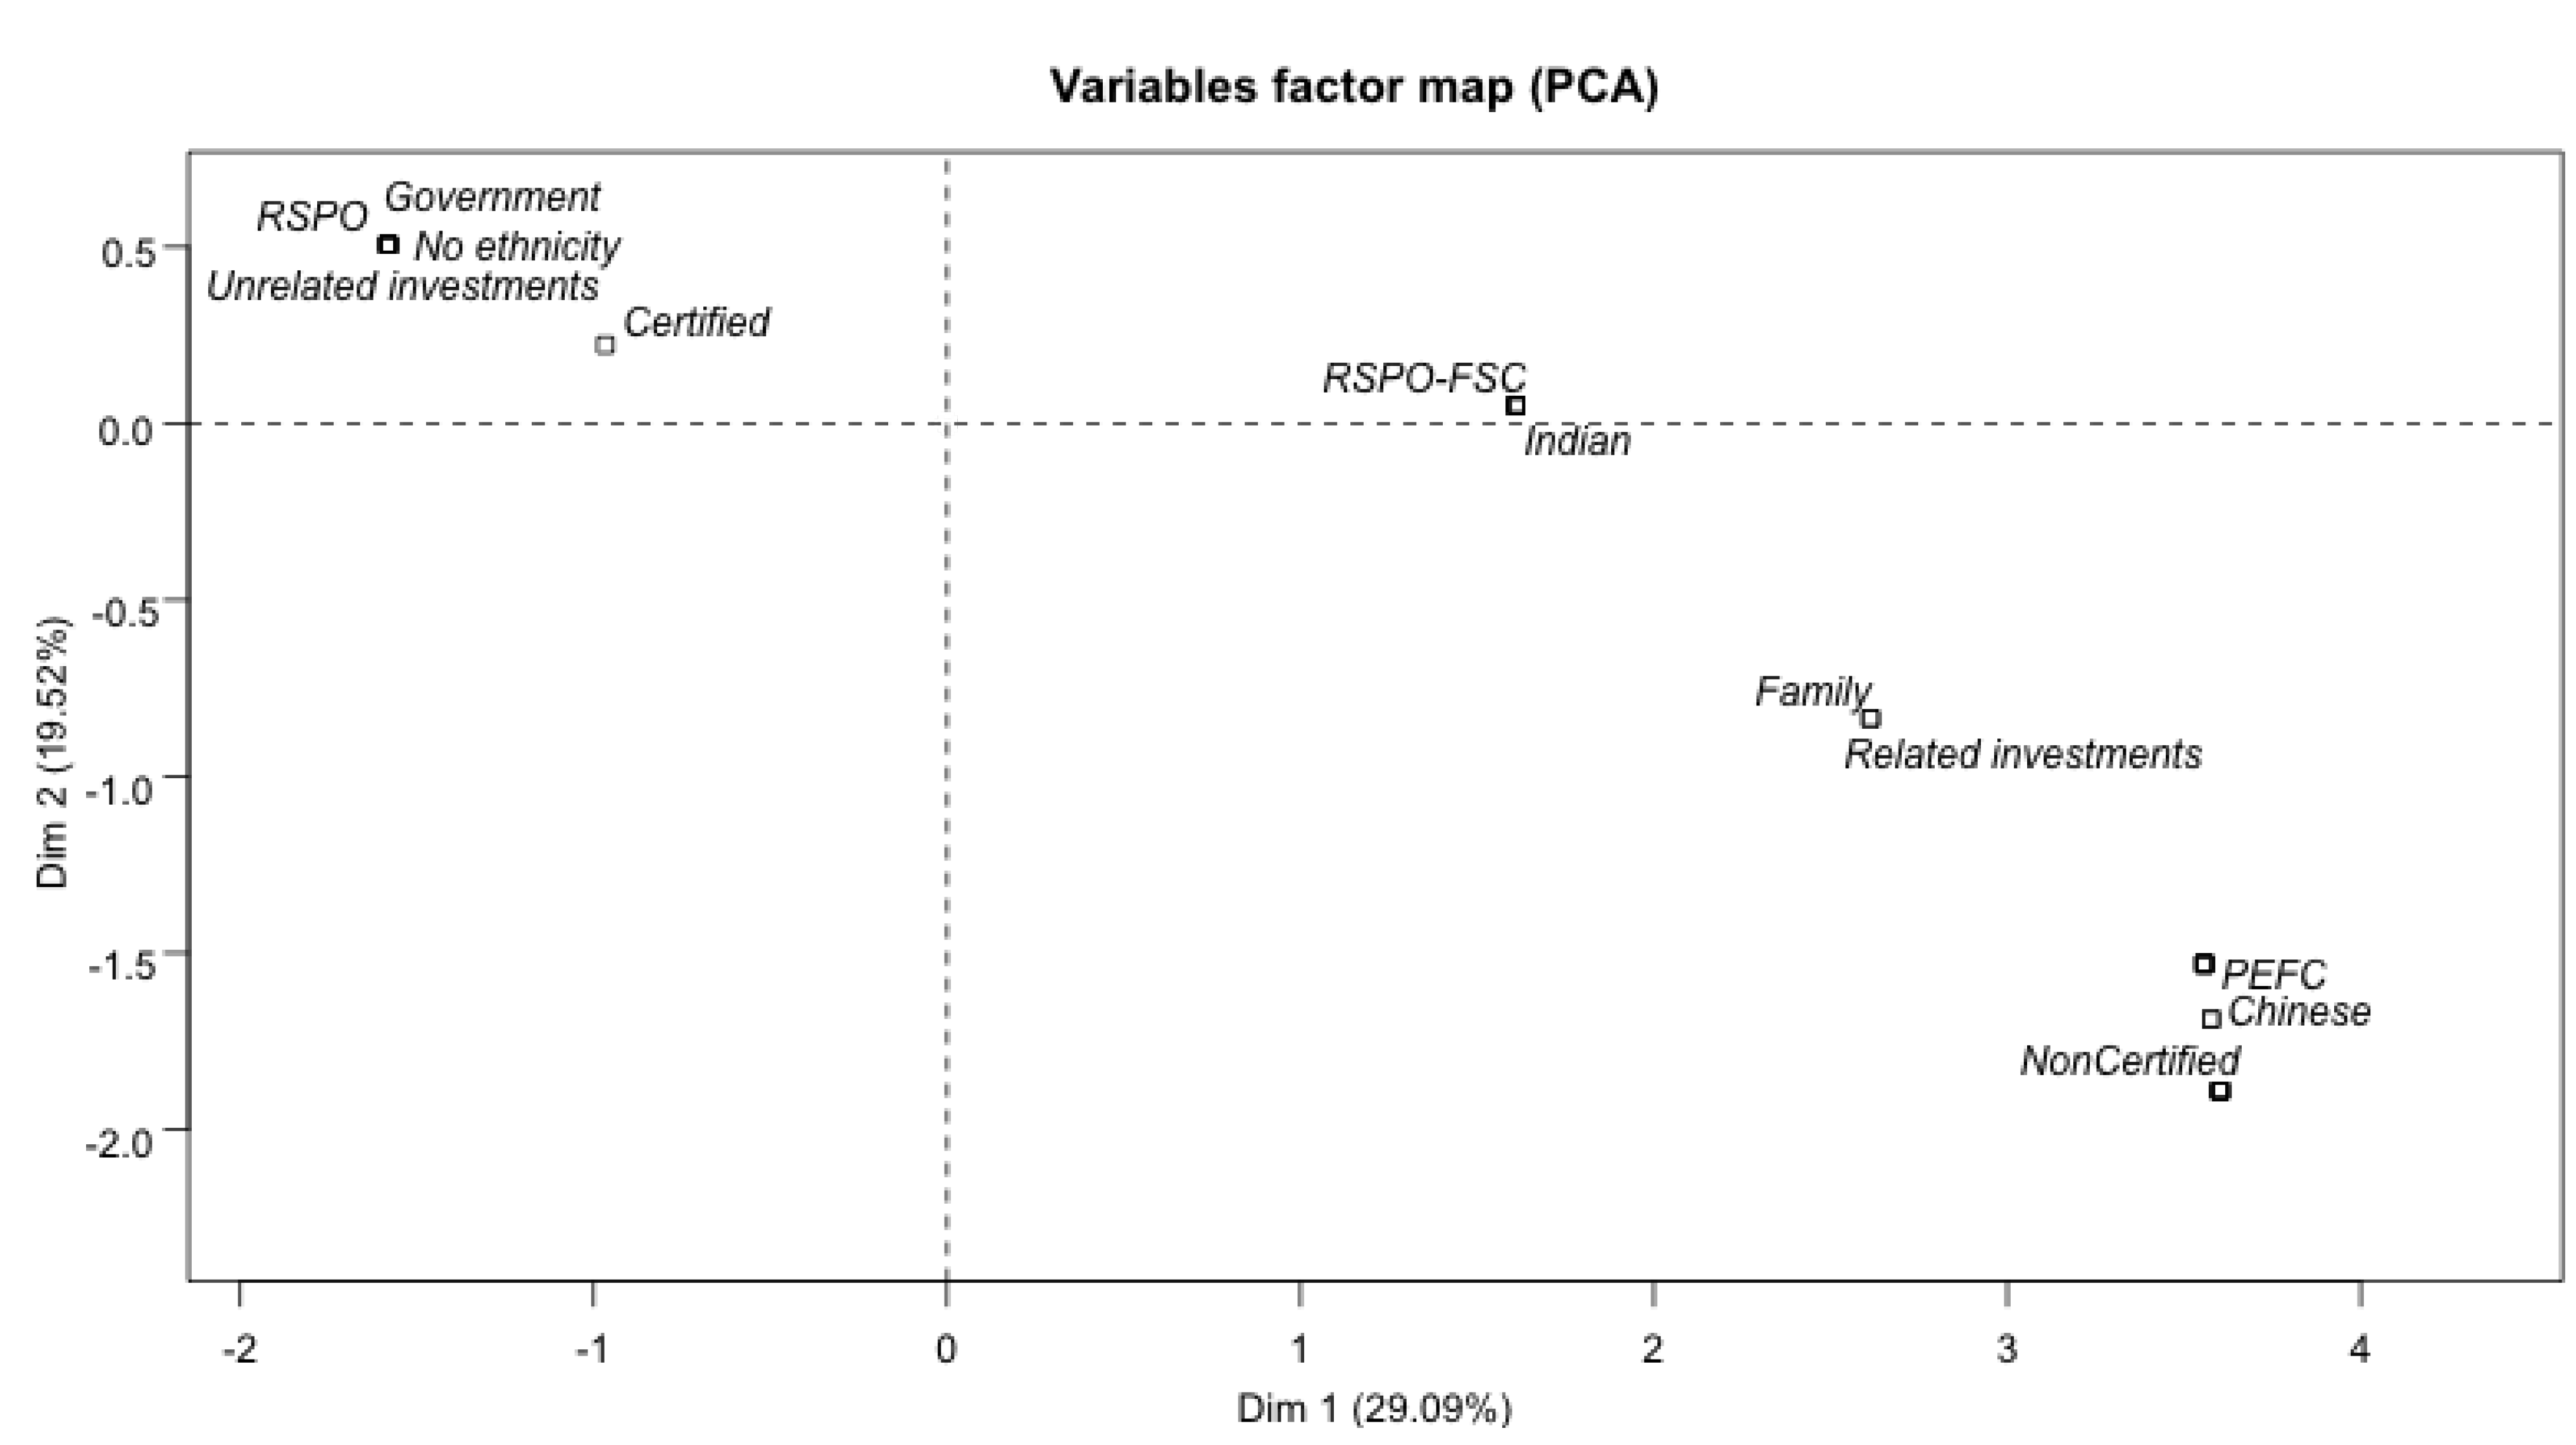
| High correlations with qualitative factors | Dim.1 (R2) | Dim.2 (R2) | |
| Certification | 0.81 | 0.19 | |
| Listed capital | 0.81 | 0.19 | |
| Government vs. Family control | 0.81 | 0.19 | |
| No ethnicity vs. Ethnicity | 0.81 | 0.19 | |
| Investment strategy | 0.75 | 0.11 | |
| RSPO or not | 0.55 | 0.18 |
4. Discussion
5. Conclusions
Acknowledgments
Author Contributions
Conflicts of Interest
References
- Rametsteiner, E.; Simula, M. Forest certification—An instrument to promote sustainable forest management? J. Environ. Manag. 2003, 67, 87–98. [Google Scholar] [CrossRef]
- Auld, G.; Gulbrandsen, L.H.; McDermott, C.L. Certification schemes and the impacts on forests and forestry. Annu. Rev. Environ. Resourc. 2008, 33, 187–212. [Google Scholar] [CrossRef]
- Dauvergne, P. Corporate power in the forests of the Solomon Islands. Pac. Aff. 1999, 71, 524–546. [Google Scholar] [CrossRef]
- Durst, P.B.; McKenzie, P.J.; Brown, C.L.; Appanah, S. Challenges facing certification and eco-labelling of forest products in developing countries. Int. For. Rev. 2006, 8, 193–200. [Google Scholar]
- Dauvergne, P. Globalisation and deforestation in the Asia-Pacific. Environ. Polit. 1998, 7, 114–135. [Google Scholar] [CrossRef]
- Douglas, I. The local drivers of land degradation in South-East Asia. Geogr. Res. 2006, 44, 123–134. [Google Scholar] [CrossRef]
- McCarthy, J.; Gillespie, P.; Zen, Z. Swimming upstream: Local Indonesian production networks in “globalized” palm oil production. World Dev. 2012, 40, 555–569. [Google Scholar] [CrossRef]
- Murphy, S.; Burch, D.; Clapp, J. Cereal Secrets: The World’s Largest Grain Traders and Global Agriculture; Hobbs, J., Ed.; Oxfam International: Oxford, UK, 2012. [Google Scholar]
- Anonymous. Government Pension Fund Global—Annual Report 2012; Norges Bank Investment Management (NBIM): Oslo, Norway, 2013. [Google Scholar]
- Gnych, S. Norway’s Government Pension Fund Divests from Palm Oil Producers; Center for International Forestry Research: Bogor, Indonesia, 2013. [Google Scholar]
- Amanor, K.S. Global landgrabs, agribusiness and the commercial smallholder: A West African perspective. In Proceedings of the International Conference on Global Land Grabbing, Brighton, UK, 6–8 April 2011; pp. 1–35.
- Mol, A.P.J. China’s ascent and Africa’s environment. Global Environ. Change 2011, 21, 785–794. [Google Scholar] [CrossRef]
- Dauvergne, P.; Neville, K.J. Forests, food, and fuel in the tropics: The uneven social and ecological consequences of the emerging political economy of biofuels. J. Peasant Stud. 2010, 37, 631–660. [Google Scholar] [CrossRef] [PubMed]
- Butler, R.; Laurance, W. New strategies for conserving tropical forests. Trends Ecol. Evol. 2008, 23, 469–472. [Google Scholar] [CrossRef] [PubMed]
- Coase, R.H. The nature of the firm. Economica 1937, 4, 386–405. [Google Scholar] [CrossRef]
- Jensen, M.C.; Meckling, W.H. Theory of the firm: Managerial behavior, agency costs, and ownership structure. J. Financ. Econ. 1976, 3, 305–360. [Google Scholar] [CrossRef]
- Porter, M.E. Competitive Strategy: Techniques for Analyzing Industries and Competitors; Free Press: Cambridge, UK, 1980. [Google Scholar]
- Porter, M.E. From competitive advantage to corporate strategy. Harvard Bus. Rev. 1987, 65, 117–151. [Google Scholar]
- Chandler, A.D., Jr. The M-form: Industrial groups, American style. Eur. Econ. Rev. 1982, 19, 3–23. [Google Scholar] [CrossRef]
- Almeida, H.V.; Wolfenzon, D. A theory of pyramidal ownership and family business groups. J. Financ. 2006, 61, 2637–2680. [Google Scholar] [CrossRef]
- Todeva, E. Business Networks: Strategy and Structure; Routledge Studies in Business Organization and Networks, Routledge: London, UK, 2006. [Google Scholar]
- De Masi, G.; Gallegati, M. Bank-firms topology in Italy. Empir. Econ. 2012, 43, 851–866. [Google Scholar] [CrossRef]
- La Porta, R.; Lopez de Silanes, F.; Shleifer, A. Corporate ownership around the world. J. Financ. 1999, 54, 471–517. [Google Scholar] [CrossRef]
- Masulis, R.W.; Pham, P.K.; Zein, J. Family business groups around the world: financing advantages, control motivations, and organizational choices. Rev. Financ. Stud. 2011, 24, 3556–3600. [Google Scholar] [CrossRef]
- Weidenbaum, M.L.; Hughes, S. The Bamboo Network: How Expatriate Chinese Entrepreneurs Are Creating a New Economic Superpower in Asia; Free Press: New York, NY, 1996. [Google Scholar]
- Crawford, D. Chinese capitalism: Cultures, the Southeast Asian region and economic globalisation. Third World Q. 2000, 21, 69–86. [Google Scholar] [CrossRef]
- Rauch, J.E.; Trindade, V. Ethnic Chinese Networks in International trade. Rev. Econ. Stat. 2002, 84, 116–130. [Google Scholar] [CrossRef]
- Yan, J.; Sorenson, R. The effect of confucian values on succession in family business. Fam. Bus. Rev. 2006, 19, 235–250. [Google Scholar] [CrossRef]
- Leblang, D. Familiarity breeds investment: Diaspora networks and international investment. Am. Polit. Sci. Rev. 2010, 104, 584–600. [Google Scholar] [CrossRef]
- Tsai, L.-C.; Chiou, S.-L.; Wu, S.-J.; Young, C.-S. Corporate ownership structure and the value relevance of family executives’ external directorships. Asia Pac. Manag. Rev. 2010, 15, 223–249. [Google Scholar]
- Cadene, P.; Vidal, D. Webs of Trade: Dynamics of Business Communities in Western India; Cadene, P., Vidal, D., Eds.; Manohar Publishers and Distributors: New Delhi, India, 1997. [Google Scholar]
- Bhattacharya, J. Beyond the myth: Indian business communities in Singapore; Institute of Southeast Asian Studies: Singapore, 2011. [Google Scholar]
- Ferris, S.P.; Kim, K.A.; Kitsabunnarat, P. The costs (and benefits?) of diversified business groups: The case of Korean chaebols. J. Bank. Financ. 2003, 27, 251–273. [Google Scholar] [CrossRef]
- Almeida, H.; Park, S.Y.; Subrahmanyam, M.G.; Wolfenzon, D. The structure and formation of business groups: Evidence from Korean chaebols. J. Financ. Econ. 2011, 99, 447–475. [Google Scholar] [CrossRef]
- Ito, T.; Niki, E.; Takida, R.; Mehta, R.; Passerini, K.; Sakamoto, M. Transactions and cross shareholdings in Mazda’s Keiretsu: A centrality analysis. Artif. Life Robot. 2011, 16, 297–300. [Google Scholar] [CrossRef]
- Weimer, J.; Pape, J. A taxonomy of systems of corporate governance. Corp. Gov. 1999, 7, 152–166. [Google Scholar] [CrossRef]
- Morck, R.; Wolfenzon, D.; Yeung, B. Corporate governance, economic entrenchment, and growth. J. Econ. Lit. 2005, 43, 655–720. [Google Scholar] [CrossRef]
- Gilson, R.J. Controlling shareholders and corporate governance: Complicating the comparative taxonomy. Harvard Law Rev. 2006, 119, 1641–1679. [Google Scholar]
- Chung, H.-M.; Chan, S.-T. Ownership structure, family leadership, and performance of affiliate firms in large family business groups. Asia Pac. J. Manag. 2012, 29, 303–329. [Google Scholar] [CrossRef]
- Chung, H.-M. The role of family management and ownership on semi-globalization pattern of globalization: The case of family business groups. Int. Bus. Rev. 2014, 23, 260–271. [Google Scholar] [CrossRef]
- Cashore, B.; van Kooten, G.C.; Vertinsky, I.B.; Auld, G.; Affolderbach, J. Private or self-regulation? A comparative study of forest certification choices in Canada, the United States and Germany. For. Policy Econ. 2003, 7, 53–69. [Google Scholar] [CrossRef]
- Araujo, M.; Kant, S.; Couto, L. Why Brazilian companies are certifying their forests? For. Policy Econ. 2009, 11, 579–585. [Google Scholar] [CrossRef]
- Rugman, A.M.; Verbeke, A. Corporate strategy and international environmental policy. J. Int. Bus. Stud. 1998, 29, 819–833. [Google Scholar] [CrossRef]
- Krebs, V. Visualizing human networks. Release 1996, 2, 1–25. [Google Scholar]
- De Nooy, W.; Mrvar, A.; Batagelj, V. Exploratory Network Analysis with Pajek; Cambridge University Press: Cambridge, UK, 2007; Volume 27. [Google Scholar]
- Glattfelder, J.B. Ownership Networks and Corporate Control: Mapping Economic Power in a Globalised World. Ph.D. Thesis, Technische Hochschule ETH Zürich, Zurich, Switzerland, 2010. [Google Scholar]
- Vitali, S.; Glattfelder, J.B.; Battiston, S. The network of global corporate control. PLoS ONE. 2011, 6, e25995. [Google Scholar] [CrossRef] [PubMed]
- Dietzenbacher, E.; Temurshoev, U. Ownership relations in the presence of cross-shareholding. J. Econ. 2008, 95, 189–212. [Google Scholar] [CrossRef]
- D’Errico, M.; Grassi, R.; Stefani, S.; Torriero, A. Shareholding networks and centrality: An application to the Italian financial marke. In Networks, Topology and Dynamics; Springer: Berlin, Germany, 2009; Volume 613, pp. 215–228. [Google Scholar]
- Grassi, R. Vertex centrality as a measure of information flow in Italian Corporate Board Networks. Phys. A 2010, 389, 2455–2464. [Google Scholar] [CrossRef]
- Greenpeace. How the Palm Oil Industry is Cooking the Climate; Greenpeace International: Amsterdam, the Netherlands, 2007. [Google Scholar]
- Greenpeace. Palm Oil’s New Frontier: How Industrial Expansion Threatens Africa’s Rainforests; Greenpeace International: Amsterdam, the Netherlands, 2012. [Google Scholar]
- CDP. The Commodity Crunch: Value at Risk from Deforestation; Carbon Disclosure Project: London, UK, 2013. [Google Scholar]
- Lawson, S.; Blundell, A.; Cabarle, B.; Basik, N.; Jenkins, M.; Canby, K. Consumer Goods and Deforestation: An Analysis of the Extent and Nature of Illegality in Forest Conversion for Agriculture and Timber Plantations; Forest Trend Report Series; Forest Trends: Washington, DC, USA, 2014. [Google Scholar]
- Bastian, M.; Heymann, S.; Jacomy, M. Gephi: An open source software for exploring and manipulating networks. In Proceedings of the Third International ICWSM Conference, San Jose, CA, USA, 17–20 May 2009.
- Smoot, M.E.; Ono, K.; Ruscheinski, J.; Wang, P.-L.; Ideker, T. Cytoscape 2.8: New features for data integration and network visualization. Bioinformatics 2011, 27, 431–432. [Google Scholar] [CrossRef] [PubMed]
- Tekušová, T.; Kohlhammer, J. Visual analysis and exploration of complex corporate shareholder networks. In Proceedings of the Electronic Imaging, Science and Technolgy, San Jose, CA, USA, 28–29 January 2008; Volume 6809, p. 68090F.
- Hanneman, R.A.; Riddle, M. Introduction to Social Network Methods; University of California: Riverside, CA, USA, 2005. [Google Scholar]
- Borner, K.; Sanyal, S.; Vespignani, A. Network science. Annu. Rev. Inf. Sci. Technol. 2007, 41, 537–607. [Google Scholar] [CrossRef]
- Scardoni, G.; Petterlini, M.; Laudanna, C. Analyzing biological network parameters with CentiScaPe. Bioinformatics 2009, 25, 2857–2859. [Google Scholar] [CrossRef] [PubMed]
- Greer, J.; Kenny, B. Greenwash: The Reality Behind Corporate Environmentalism; Third World Network: Penang, Malaysia, 1998. [Google Scholar]
- Lippert, I. Greenwash. In Green Culture: An A-to-Z Guide; Wehr, K., Ed.; Sage Publications, Inc.: Thousand Oaks, CA, USA, 2011. [Google Scholar]
- Papargyropoulou, E.; Padfield, R.; Harrison, O.; Preece, C. The rise of sustainability services for the built environment in Malaysia. Sustain. Cities Soc. 2012, 5, 44–51. [Google Scholar] [CrossRef]
- Chen, K.-C. The ethnic Chinese style of corporate innovation. In Proceedings of PICMET 2008. Portland International Conference on Management of Engineering and Technology, Cape Town, South Africa, 27–31 July 2008; pp. 486–496.
- Li, J.; Young, M.N.; Tang, G. The development of entrepreneurship in Chinese communities: An organizational symbiosis perspective. Asia Pac. J. Manag. 2010, 29, 367–385. [Google Scholar] [CrossRef]
- Dahles, H. On (mis-)conceptions of culture as a vehicle of business success: Singapore Chinese investment strategies after failing in China. East Asia 2007, 24, 173–193. [Google Scholar] [CrossRef]
- Jacobsen, M. Doing business the Chinese way? On Manadonese Chinese, entrepreneurship in North Sulawesi. Copen. J. Asian Stud. 2007, 24, 105–136. [Google Scholar]
- Roda, J.-M. On the nature of intergenerational and social networks in the African forest sector: The case of Chinese, Lebanese, Indian & Italian business networks. In Governing Africa’s Forests in a Globalized World; German, L.A., Karsenty, A., Tiani, A.-M., Eds.; Earthscan: London, UK, 2009; pp. 1–23. [Google Scholar]
- Drori, I.; Honig, B.; Wright, M. Transnational entrepreneurship: An emergent field of study. Entrep. Theory Pract. 2009, 33, 1001–1022. [Google Scholar] [CrossRef]
- Giansoldati, M.; Pauluzzo, R. The international evolution of Italian and Chinese districts: What role for lead firms? Transit. Stud. Rev. 2011, 18, 471–486. [Google Scholar] [CrossRef]
© 2015 by the authors; licensee MDPI, Basel, Switzerland. This article is an open access article distributed under the terms and conditions of the Creative Commons Attribution license (http://creativecommons.org/licenses/by/4.0/).
Share and Cite
Roda, J.-M.; Kamaruddin, N.; Tobias, R.P. Deciphering Corporate Governance and Environmental Commitments among Southeast Asian Transnationals: Uptake of Sustainability Certification. Forests 2015, 6, 1454-1475. https://doi.org/10.3390/f6051454
Roda J-M, Kamaruddin N, Tobias RP. Deciphering Corporate Governance and Environmental Commitments among Southeast Asian Transnationals: Uptake of Sustainability Certification. Forests. 2015; 6(5):1454-1475. https://doi.org/10.3390/f6051454
Chicago/Turabian StyleRoda, Jean-Marc, Norfaryanti Kamaruddin, and Rafael Palhiarim Tobias. 2015. "Deciphering Corporate Governance and Environmental Commitments among Southeast Asian Transnationals: Uptake of Sustainability Certification" Forests 6, no. 5: 1454-1475. https://doi.org/10.3390/f6051454
APA StyleRoda, J. -M., Kamaruddin, N., & Tobias, R. P. (2015). Deciphering Corporate Governance and Environmental Commitments among Southeast Asian Transnationals: Uptake of Sustainability Certification. Forests, 6(5), 1454-1475. https://doi.org/10.3390/f6051454