Article

Response of Boreal Jack Pine (Pinus banksiana Lamb.) Stands to a Gradient of Commercial Thinning Intensities, with and without N Fertilization

1
Institut de Recherche sur les Forêts, Université du Québec en Abitibi-Témiscamingue, 445 boul. de l'Université, Rouyn-Noranda, QC J9X 5E4, Canada
2
Chaire de recherche du Canada sur la valorisation, la caractérisation et la transformation du bois, Université du Québec en Abitibi-Témiscamingue, 445 boul. de l'Université, Rouyn-Noranda, QC J9X 5E4, Canada
*
Author to whom correspondence should be addressed.
Forests 2015, 6(8), 2678-2702; https://doi.org/10.3390/f6082678
Submission received: 9 June 2015 / Revised: 21 July 2015 / Accepted: 27 July 2015 / Published: 31 July 2015

Abstract

:
This study examines tree and stand response to a gradient of commercial thinning intensities and nitrogen fertilization (200 kg N ha−1) in nine jack pine (Pinus banksiana) stands of Eastern Canada over a period of 14 years. Thinning intensity ranged from 0% basal area removal in control plots to 64% in thinned plots. Tree diameter increment, absolute and relative volume increment and mean volume increased with thinning intensity and were higher in fertilized plots. Individual tree response depended on tree diameter, with smallest trees exhibiting highest relative volume increment to thinning intensity. Stand basal area increment was positively associated to initial stand basal area and negatively to stand age. In thinned and fertilized plots, stand volume increment was higher and natural mortality lower than in fertilized only and unfertilized control plots over the 5–14 year period after thinning. However, the positive effect of fertilization on tree volume increment decreased with thinning intensity. Despite positive individual tree growth responses to thinning and fertilization, residual stand volume increment decreased with increased thinning intensity in both fertilized and unfertilized plots. While total cumulative stand volume (harvested + residual) also decreased with thinning intensity in unfertilized plots, comparable total volumes were observed in fertilized + thinned and unthinned control plots. Nitrogen fertilization in the years following commercial thinning enhanced the benefit of thinning on these relatively poor sites by increasing tree diameter growth, lowering mortality, and increasing total stand merchantable volume compared to unfertilized thinned stands.

1. Introduction

Commercial thinning is an increasingly common silvicultural treatment applied to pre-mature or mature even-aged stands in the Canadian boreal forest. Timber volume is extracted in the short-term, often by selecting stems approaching imminent natural mortality. Long-term merchantable yield and profitability are generally expected to increase as the result of higher residual tree volume increment and improved future operating conditions [1,2,3,4]. Despite its general use in Eastern Canada and elsewhere, different thinning experiments often yield conflicting results regarding stand response [5] and the treatment has been questioned by some foresters [6]. For example, Mäkinen and Isomäki [7,8] reported a decrease in merchantable stand volume 25 years after thinning while Schneider [6], Allen [9] and Curtis and Marshall [10] reported enhanced stand productivity and stem size, and reduced tree mortality and insect susceptibility from 15 to 30 years after thinning. Inferring results is further hampered by differences in experimental design (e.g., target species, site fertility, thinning intensity, stand age) and statistical approaches [5].
Jack pine (Pinus banksiana Lamb.) is a fire-adapted and shade-intolerant species that forms even-aged stands following stand-replacing fires; it is also the second most important commercial tree species in Eastern Canada [11,12]. Jack pine stands are typically managed under an even-aged clear-cut system. Commercial thinning from below is sometimes applied to improve mean tree diameter and volume growth and enhance product value [13]. It may also serve to extend time to final cut and therefore increase rotation age where maintaining cover of older stands or large-sized trees is important. Thinning of mature jack pine stands increases individual tree diameter and stem volume growth [6,14,15,16,17] and has been reported in at least two studies to positively affect tree height growth [17,18]. These findings suggest that commercial thinning is an effective silvicultural treatment to improve individual stem growth in these stands [9]. However, growth increases of residual stems following thinning do not generally compensate for the loss of cumulative tree growth at the stand-level that would occur had trees not been thinned, and therefore, the treatment tends to result in a reduction in total merchantable stand volume yield [19].
Forest fertilization is applied to increase nutrient availability, improve tree growth, and maximize stand yields [20]. In the 1960s, a growing interest in Canada for forest fertilization led to the establishment of an interprovincial research program on forest fertilization in stands dominated by different species including jack pine [21]. Results of this program of fertilization trials and of previous studies [22,23,24] revealed a positive and significant effect of fertilization on jack pine diameter growth and total and merchantable jack pine stand volumes [25].
Few studies have examined the combination of fertilization and thinning on the response of jack pine. Groot et al. [26] suggested that the combination of these treatments had a greater (synergistic) effect on individual tree growth and stand volume than either treatment alone. Other experiments have confirmed such results for Scots pine (Pinus sylvestris L.) [27,28,29], Douglas fir (Pseudotsuga menziesii Mirb.) [30,31,32], Monterey pine (Pinus radiate D. Don) [33], white spruce (Picea glauca (Moench) Voss) [34] and black spruce (Picea mariana (Mill.) B.S.P.) [35].
Commercial thinning reduces competition for light [36], nutrients, and water [37], increases growing space and redistributes site resources among fewer residual crop trees [15,32]. Tree response to thinning is principally conditioned by the increase in resource availability and the mode of competition between residual trees. However, the ability to respond to increased light availability also depends on the shade tolerance of species [38]. There is evidence that, in forest stands, competition for light is size asymmetric while competition for soil resources is size symmetric; that is, larger individuals capture a disproportionate share of light resources considering their absolute size while uptake of soil resources is proportional to individual’s size [39,40,41]. Thinning from below should therefore have little effect on growth of residual dominant jack pine stems unless soil resources are increased by thinning. Increases in soil resources following thinning and fertilization should induce a response proportional to tree size.
The main objective of this study was to investigate, from a silvicultural standpoint, patterns of tree and stand volume increment over a 14 year period in response to commercial thinning and nitrogen fertilization of mature jack pine stands. The fully replicated experiment includes nine stands (experimental blocks) distributed over a large region and representing a range of stand age and thinning intensities, thus allowing for a broad assessment of stand and tree responses to treatments. We expected that tree volume would increase proportionally to basal area removed and that small suppressed trees would benefit most from thinning. Trees in all social classes should benefit from fertilization. While it was expected that thinning from below would reduce stand mortality over the study period, we anticipated that, by increasing tree growth, fertilization would increase competition and tree mortality in controls and low-intensity thinned stands [42]. Volume increment over the 14 year period of residual trees in thinned stands was not expected to compensate for the volume harvested.

2. Experimental Section
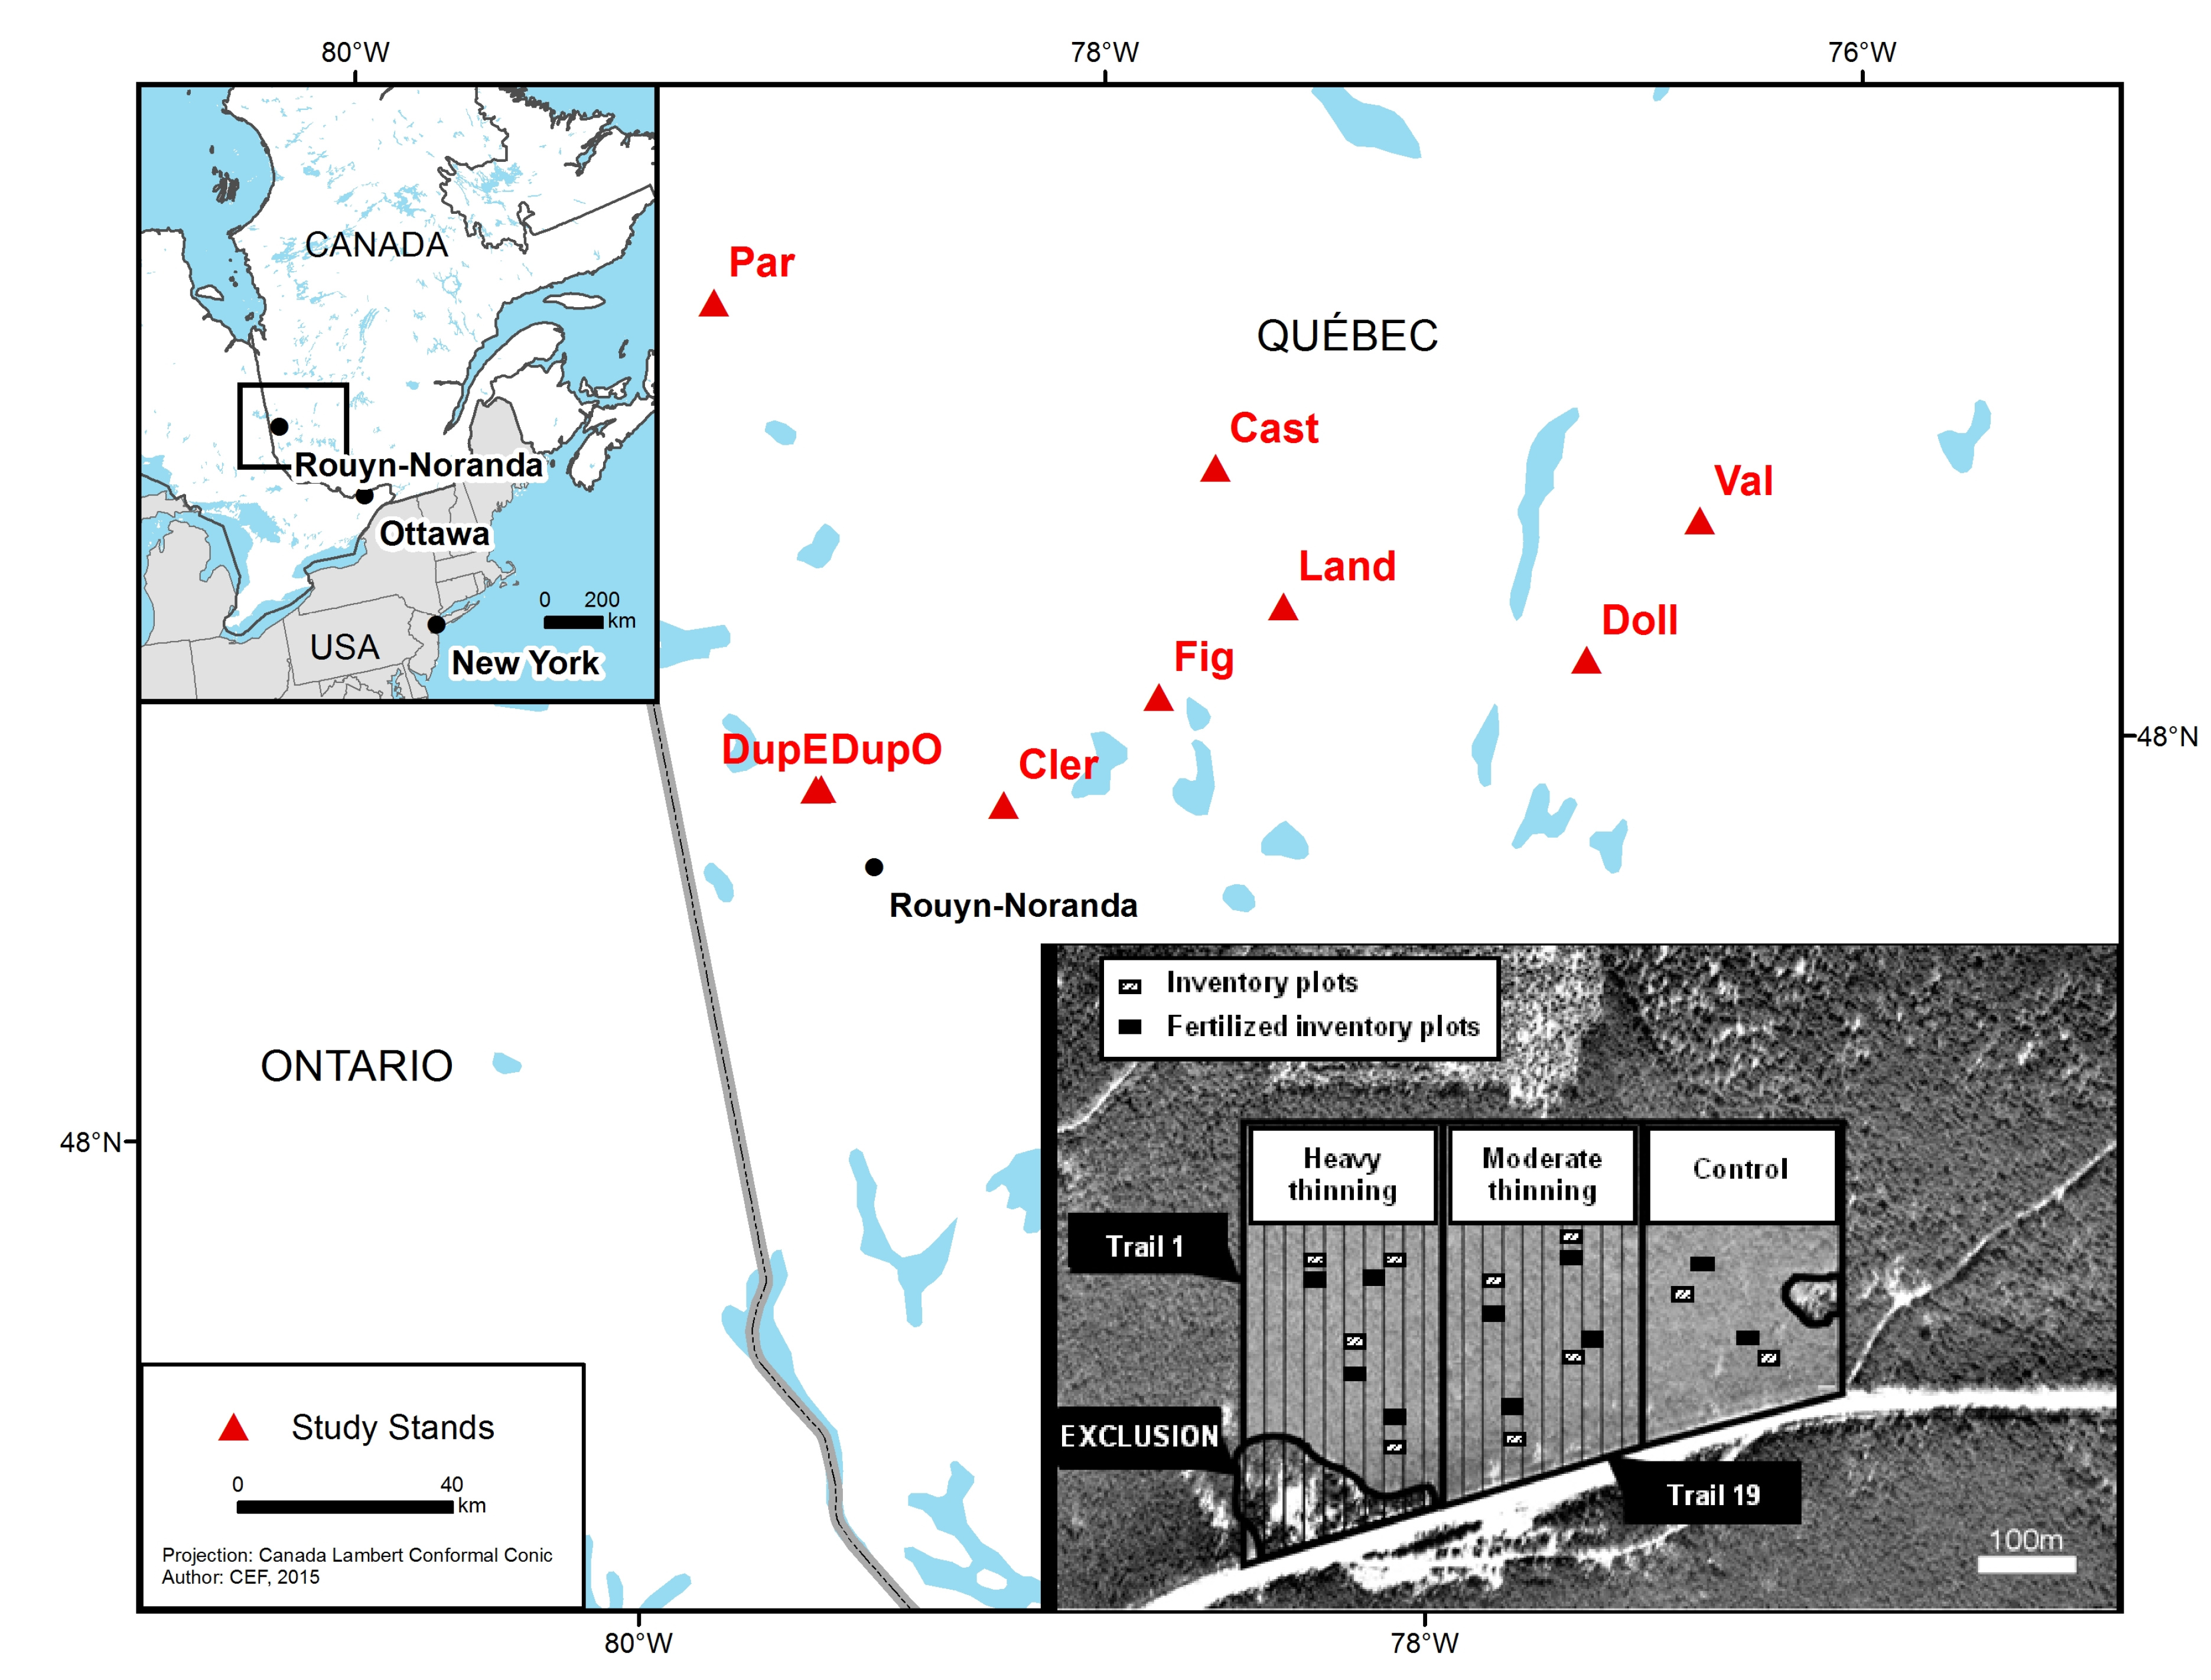
2.1. Study Area

The study was conducted in the Abitibi-Témiscamingue region of Northwestern Québec, Canada (48°18′16′′ to 49°16′34′′ N, and 76°41′05′′ to 79°09′09′′ W, Figure 1). The region is included in the Superior geologic province of the Canadian Precambrian Shield. The topography is relatively flat and elevation ranges from 300 to 350 m. Most of the bedrock is covered by quaternary deposits such as till, glaciofluvial gravelly sands and glaciolacustrine clay, silt and sands [43]. The climate is cold and continental with average daily temperatures between 0.7 and 1.2 °C. Annual mean precipitation ranges from 690 to 929 mm of which 60% to 66% falls between May and October inclusively [44]. The region is part of the Canadian boreal forest [45]. Eight of the nine selected stands are located within the balsam fir (Abies balsamea L. Miller)—white-birch (Betula papyrifera Marshall) bioclimatic domain while one stand further north is located in the black spruce-feathermoss bioclimatic domain [46].
Figure 1. Location of the study stands in Northwestern Quebec (Canada) and experimental design (inset) in one stand (experimental block).
Forests 06 02678 g001

2.2. Experimental Design

Between 1998 and 2003, nine jack pine stands (>80% jack pine) aged between 48 and 81 years and growing on fluvioglacial surface deposits were selected among stands targeted for operational commercial thinning (Table 1). All stands were even-aged, originated from forest fires, and had not been subjected to any silvicultural treatments prior to those applied in the experiment. Soils consisted of well-drained sands or loamy sands with a 10–20 cm organic matter layer of feathermoss origin. Site index at 50 years on these stands ranged from 16.2 to 17.2 m [47].
A complete randomized block design was used for the experiment in which each stand was considered an experimental block (replication). In each block, a control (no trails or thinning) and two levels of thinning from below (heavy and moderate thinning) were applied to 4 ha experimental units (EU). Small merchantable (≥9.1 cm diameter at breast height (1.3 m), DBH), poor quality, and low vigour trees were primarily removed. The intensity of thinning applied to experimental units was highly variable among blocks creating, across the experiment, a gradient of removal ranging from 2% of the initial basal area to 64% (Table 1). One, three or five years after thinning, depending on experimental block, urea (CO(NH2)2) fertilization (200 kg N ha−1) was manually applied in the fall in ten 10 m × 20 m sub-plots within EUs adjacent (10 m downslope) to permanent sampling plots (see below).
Table 1. Initial characteristics of nine jack pine stands subjected to a range of commercial thinning intensities. Average values and standard errors of two 200 m2 in permanent sampling plots in control experimental units and eight plots in thinned experimental units.
StandAge 1Stand Basal Area (m2 ha−1)Stand Density (Stems ha−1)Thinning Intensity (%)
Control PlotsThinned PlotsControl PlotsThinned PlotsMinMeanMax
Cast *4824 ± 125 ± 32025 ± 1772275 ± 74062145
Cler *6929 ± 823 ± 42125 ± 10962137 ± 226374964
Doll *5327 ± 423 ± 33125 ± 10253050 ± 436172837
DupE *5336 ± 129 ± 44125 ± 1773487 ± 1122264152
DupO4831 ± 131 ± 41725 ± 2472106 ± 607162940
Fig *8128 ± 128 ± 41575 ± 1772106 ± 729263853
Land4226 ± 321 ± 41900 ± 2121868 ± 356212735
Par6833 ± 824 ± 42750 ± 5661668 ± 41321221
ValNA24 ± 329 ± 41550 ± 712081 ± 48831429
1: Mean tree age of 8 to 10 dominant trees; NA: not available; *: Stands surveyed 14 years after thinning.

2.3. Permanent Sampling Plot Measurements

Immediately after thinning and in each experimental block, ten 200 m2 permanent rectangular sampling plots (PSPs) were positioned between two adjacent skidding trails at a rate of four PSPs in each thinned EU and two PSPs in control EU. Buffered zones of 5 m were maintained between the plots and the skidding trails. Within each PSP, all stems ≥ 9 cm were identified to species, tagged, and their DBH measured. Trees <9 cm DBH were identified, counted and tallied in three regeneration size classes (DBH: <3 cm, 3–4.9 cm, 5–9 cm). All stumps originating from harvesting were also measured for height and diameter. At time of fertilization, ten additional permanent sampling plots (200 m2) were established in fertilized areas, and residual trees were tagged and measured as described above. Permanent sampling plots (fertilized and unfertilized) from all experimental blocks were surveyed at time of fertilization and again 5 years after thinning. Fourteen years after thinning (2012), PSPs from the five stands that were established in 1998 were surveyed again (Table 1).

2.4. Calculations

All calculations were conducted at the PSP level. Residual basal area was calculated based on live tree DBH. The DBH of harvested trees were estimated based on the Alemdag and Honer [48] allometric equation (Equation (1)) using their stump height and diameter.
(DBH = SD (a ln (SH) + b))
where:
  • DBH = diameter at breast height (cm),
  • SD = stump diameter (cm),
  • SH = stump height (cm),
  • a and b = species specific coefficients locally calibrated.
Basal area removed was estimated based on harvested tree diameter. Initial basal area was calculated as the sum of the residual and removed basal areas, and the intensity of thinning was expressed as the proportion of the initial basal area removed, obtained from the difference between initial basal area and residual basal area. The estimation of initial basal area and basal area removed did not include harvesting trails.
Merchantable tree volume was estimated from tree height and DBH. First, the height of each tree was calculated using specific allometric equations (Equation (2)) locally calibrated [49].
(H = β0 + β1 D + β2 D2)
where:
  • H = height (m),
  • D = diameter at breast height (cm),
  • β0, β1 and β2 = specific species coefficients locally calibrated.
Merchantable tree volume was then estimated using the general tariff table [49] for the province (Equation (3)):
(V = β0 + β1 H + β2 HD + β3 HD2)
where:
  • V = volume (dm3),
  • H = height (m),
  • D = diameter at breast height (cm),
  • β0, β1, β2 and β3 = species specific coefficients locally calibrated.
Tree height and merchantable volume estimated with the previous equations were compared with measurements made on 30 trees collected on five of the nine investigated stands. Stem analyses for these 30 trees were undertaken and reported by Goudiaby et al. [47]. Pearson’s correlation (r) coefficients between predicted and observed values were 0.846 for tree height and 0.974 for tree volume. Equations used in this study were considered suitable for tree height and volume estimation from DBH measurements as no bias was created toward any of the thinning treatments (see supplementary material). Moreover, these equations may be considered conservative as 27 of the 30 predicted values were lower than observed values.
Tree response to treatments was characterized by measuring tree and stand changes in attributes between 0 and 5 years and between 5 and 14 years after thinning. Response measurements included (1) diameter increment; (2) absolute and relative tree volume increment and (3) mean tree volume 14 years after thinning (PSP total merchantable volume divided by tree density).
Stand level mortality was characterized as (1) the proportion of trees within a PSP that died 0–5 years and 5–14 years after thinning and (2) the volume lost to mortality 0–5 years and 5–14 years after thinning. Changes in stand basal area and merchantable stand volume were characterized at the PSP level as (1) absolute stand volume increment 0–5 years and 5–14 years after thinning and the relative stand volume increment 0–5 years after thinning (net 5 years stand volume increment divided by initial stand volume immediately after thinning) and 5–14 years after thinning (net 5–14 years stand volume increment divided by stand volume 5 years after thinning); (2) residual live stand volume; and (3) cumulative merchantable volume (residual live + harvested volume).

2.5. Statistical Analyses

To test effects of thinning and fertilization on tree and stand response variables, a mixed linear regression model that allowed for random and nested effects was applied using the lme function of the nlme package [50] with R software version 3.0.2 [51]. In doing so, we benefited from each observation (tree level or PSP level) while taking into account the non-independence of nested random factors (trees nested within PSP, and PSPs nested within EU and EU nested within blocks). For each analysis, residuals were examined to ensure that statistical assumptions of normality and homoscedasticity were met. A log transformation was applied to response variables when assumptions were not met. A significance level of 0.05 was retained.
For regression analyses, thinning intensity was included as a continuous variable using relative basal area removed, computed at the PSP level. The square of relative basal area removed was also included in the linear regression models to test for non-linear relationships between thinning intensity and response variables but was removed due to its systematic non-significant effect. Because of the wide range of initial stand conditions (Table 1), initial stand basal area was included as a covariate in all analyses. Other fixed factors included stand age, tree size (DBH ≤ 17.9 cm or DBH ≥ 18 cm) and time since thinning. The effect of fertilization was assessed only for changes in tree or stand properties that took place between 5 and 14 years after thinning in stands (n = 5) that were fertilized 3 or 5 years after thinning. The analyses did not include the timing of fertilization as a fixed factor. Selected interactions between fixed factors were also tested and interactions were removed from analyses when found to be not statistically significant.

3. Results

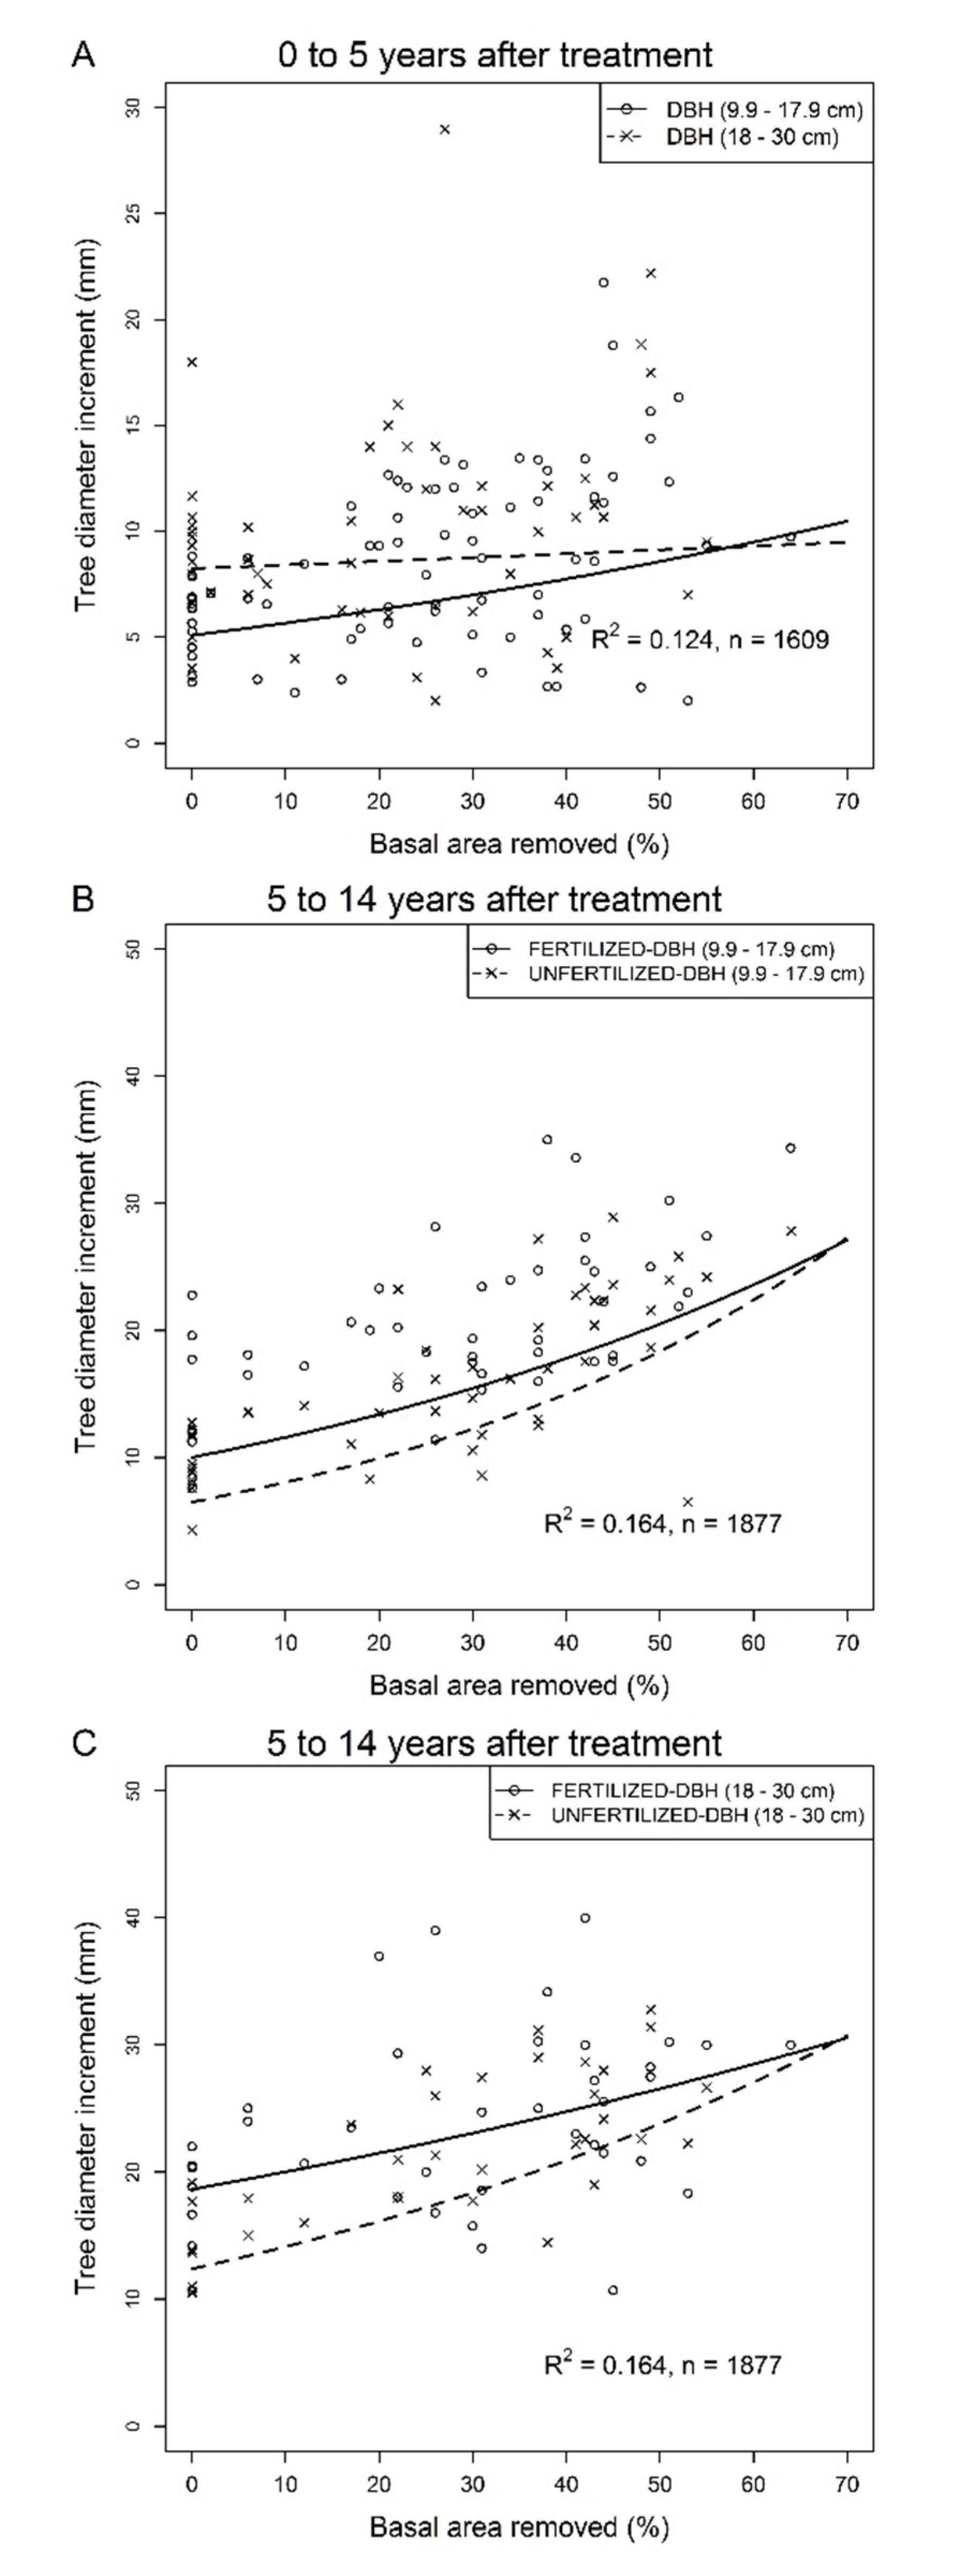
3.1. Tree Response 0 to 5 Years Following Thinning

In the first five years following thinning, the absolute diameter increment of small trees (DBH = 9.9–17.9 cm, mean height = 13.2 ± 1.6 m) increased with relative basal area removed (Figure 2A, Table 2) while that of large trees (DBH ≥ 18 cm, mean height = 17.1 ± 0.8 m) remained constant. The absolute diameter increment of both tree sizes decreased with initial stand basal area (Table 2) while the diameter increment of small trees decreased with stand age (Table 2). During the five years following thinning, the relative tree volume increment of small trees increased across the gradient of basal area removed while that of large trees was not affected by the proportion of basal area removed (Table 2, Figure 3A). The relative tree volume increment of both tree size classes also decreased with initial stand basal area, (Table 2).
Table 2. Residual tree response to commercial thinning and fertilization of jack pine stands over periods of 5 years and 5 to 14 years following thinning. Fertilization was conducted within sub-plots in each experimental unit 3 to 5 years after thinning. Effects of initial stand basal area and age, basal area removed by thinning, tree size, fertilization and selected interactions assessed by means of mixed linear models.
Response VariablesAbsolute Tree Diameter Increment *Absolute Tree Diameter Increment *Relative Tree Volume Increment *Mean Tree VolumeAbsolute Tree Volume Increment *Relative Tree Volume Increment *
Period After Thinning5 Years5 to 14 Years5 Years14 Years5 to 14 Years5 to 14 Years
Fixed factorsEpEpEpEpEpEp
Intercept2.72<0.0013.64<0.0012.56<0.001112.40.0434.41<0.0013.68<0.001
BA initial−0.020.014−0.010.181−0.020.0071.370.442−0.020.108−0.020.131
BA removed0.010.5050.010.0340.010.4021.250.0030.010.0740.010.260
Size (DBH ≤ 17.9 cm)0.290.184−0.430.0890.130.083-−0.93<0.0010.080.559
Age−0.010.8320.010.270---
BA removed × Size0.010.0090.010.0210.010.027-0.010.0180.010.012
Size × Age−0.01<0.001−0.010.542---
Fertilization (UnF)-−0.38<0.001-−11.80.074−0.280.030−0.290.024
BA removed × Fertilization-0.010.007-−0.330.3500.010.0160.010.013
Fertilization × Size----−0.180.032−0.240.046
*: the variable was log-transformed; BA = basal area; DBH = diameter at breast height; UnF = unfertilized; Estimates of fixed factors and interactions effects (E) are presented with p-values (p); p-values in bold type are significant (p ≤ 0.05); Reference levels of categorical variables are shown in brackets; -: not applicable.
Figure 2. Residual tree response to commercial thinning and fertilization of jack pine stands over periods of 5 and 5 to 14 years following thinning. Fertilization was conducted within sub-plots in each experimental units 3 to 5 years after thinning; (A) Tree diameter increment (mm) over the first 5 years after commercial thinning in unfertilized plots as a function of basal area removed and tree size; (B) Diameter increment (mm) of small diameter trees over the 5- to 14-years period following commercial thinning as a function of basal area removed and fertilization; (C) Diameter increment (mm) of large diameter trees over the 5- to 14-years period following commercial thinning as a function of basal area removed and fertilization. Untransformed observed (dots) and predicted (lines) values. Predicted values for tree volume increment were back-transformed from a log transformation. For all figures, individual tree values were averaged over sampling plots for illustration purposes.
Forests 06 02678 g002

3.2. Tree Response 5 to 14 Years Following Thinning in Unfertilized and Fertilized Plots

During the 5–14 year period following thinning, the absolute diameter increment of residual trees increased with basal area removed (Table 2, Figure 2B,C). The increase was more pronounced for small trees as indicated by the significant interaction between tree size and basal area removed. For small and large trees, fertilization had the strongest positive effect on absolute diameter increment in the controls and the differences in diameter increment between fertilized and unfertilized plots decreased with increased basal area removed. Additionally, the difference between fertilized and unfertilized trees was stronger for large trees as indicated by significant interaction between tree size and fertilization (Table 2).
The relationship between the 5–14 year absolute (Figure 3C,D) and relative (Figure 3E,F) tree volume increment and basal area removed was affected by tree size and fertilization while the interactions between fixed factors were all significant (Table 2). Results indicated that (1) volume of small trees increased more in response to basal area removed and fertilization than that of large trees and (2) the effect of fertilization on tree volume increment decreased with basal area removed with a steeper decrease for large trees. Hence, for proportions of basal area removed greater than 45%, the volume increment of large unfertilized trees tended to be larger than that of fertilized ones (Figure 3D,F).
Fourteen years after thinning, mean tree volume (Table 2) increased by 1.25 dm3 for each additional percent of basal area removed; from 148 dm3 in controls to 236 dm3 at the upper end of the thinning gradient (Figure 3B). Mean tree volume in fertilized plots did not differ statistically from the mean tree volume in unfertilized plots (Table 2).
Figure 3. Response of residual trees in jack pine stands after commercial thinning and fertilization over periods of 5 to 14 following thinning. (A) Relative tree volume increment over the first 5 years after commercial thinning in unfertilized plots; (B) Mean tree volume in fertilized and unfertilized plots 14 years after commercial thinning; (C) Fertilized and unfertilized small diameter tree volume increment over the 5- to 14-year period following commercial thinning; (D) Fertilized and unfertilized large diameter tree volume increment over the 5- to 14-year period following commercial thinning; (E) Relative tree volume increment of fertilized and unfertilized small diameter trees over the 5- to 14-year period following commercial thinning; (F) Relative tree volume increment of fertilized and unfertilized large diameter trees over the 5- to 14-year period following commercial thinning. Untransformed observed (dots) and predicted (lines) values. Predicted values for tree volume increment were back-transformed from a log transformation and corrected according to Sprugel [52]. For all figures, individual tree values were averaged over sampling plots for illustration purposes.
Forests 06 02678 g003aForests 06 02678 g003b

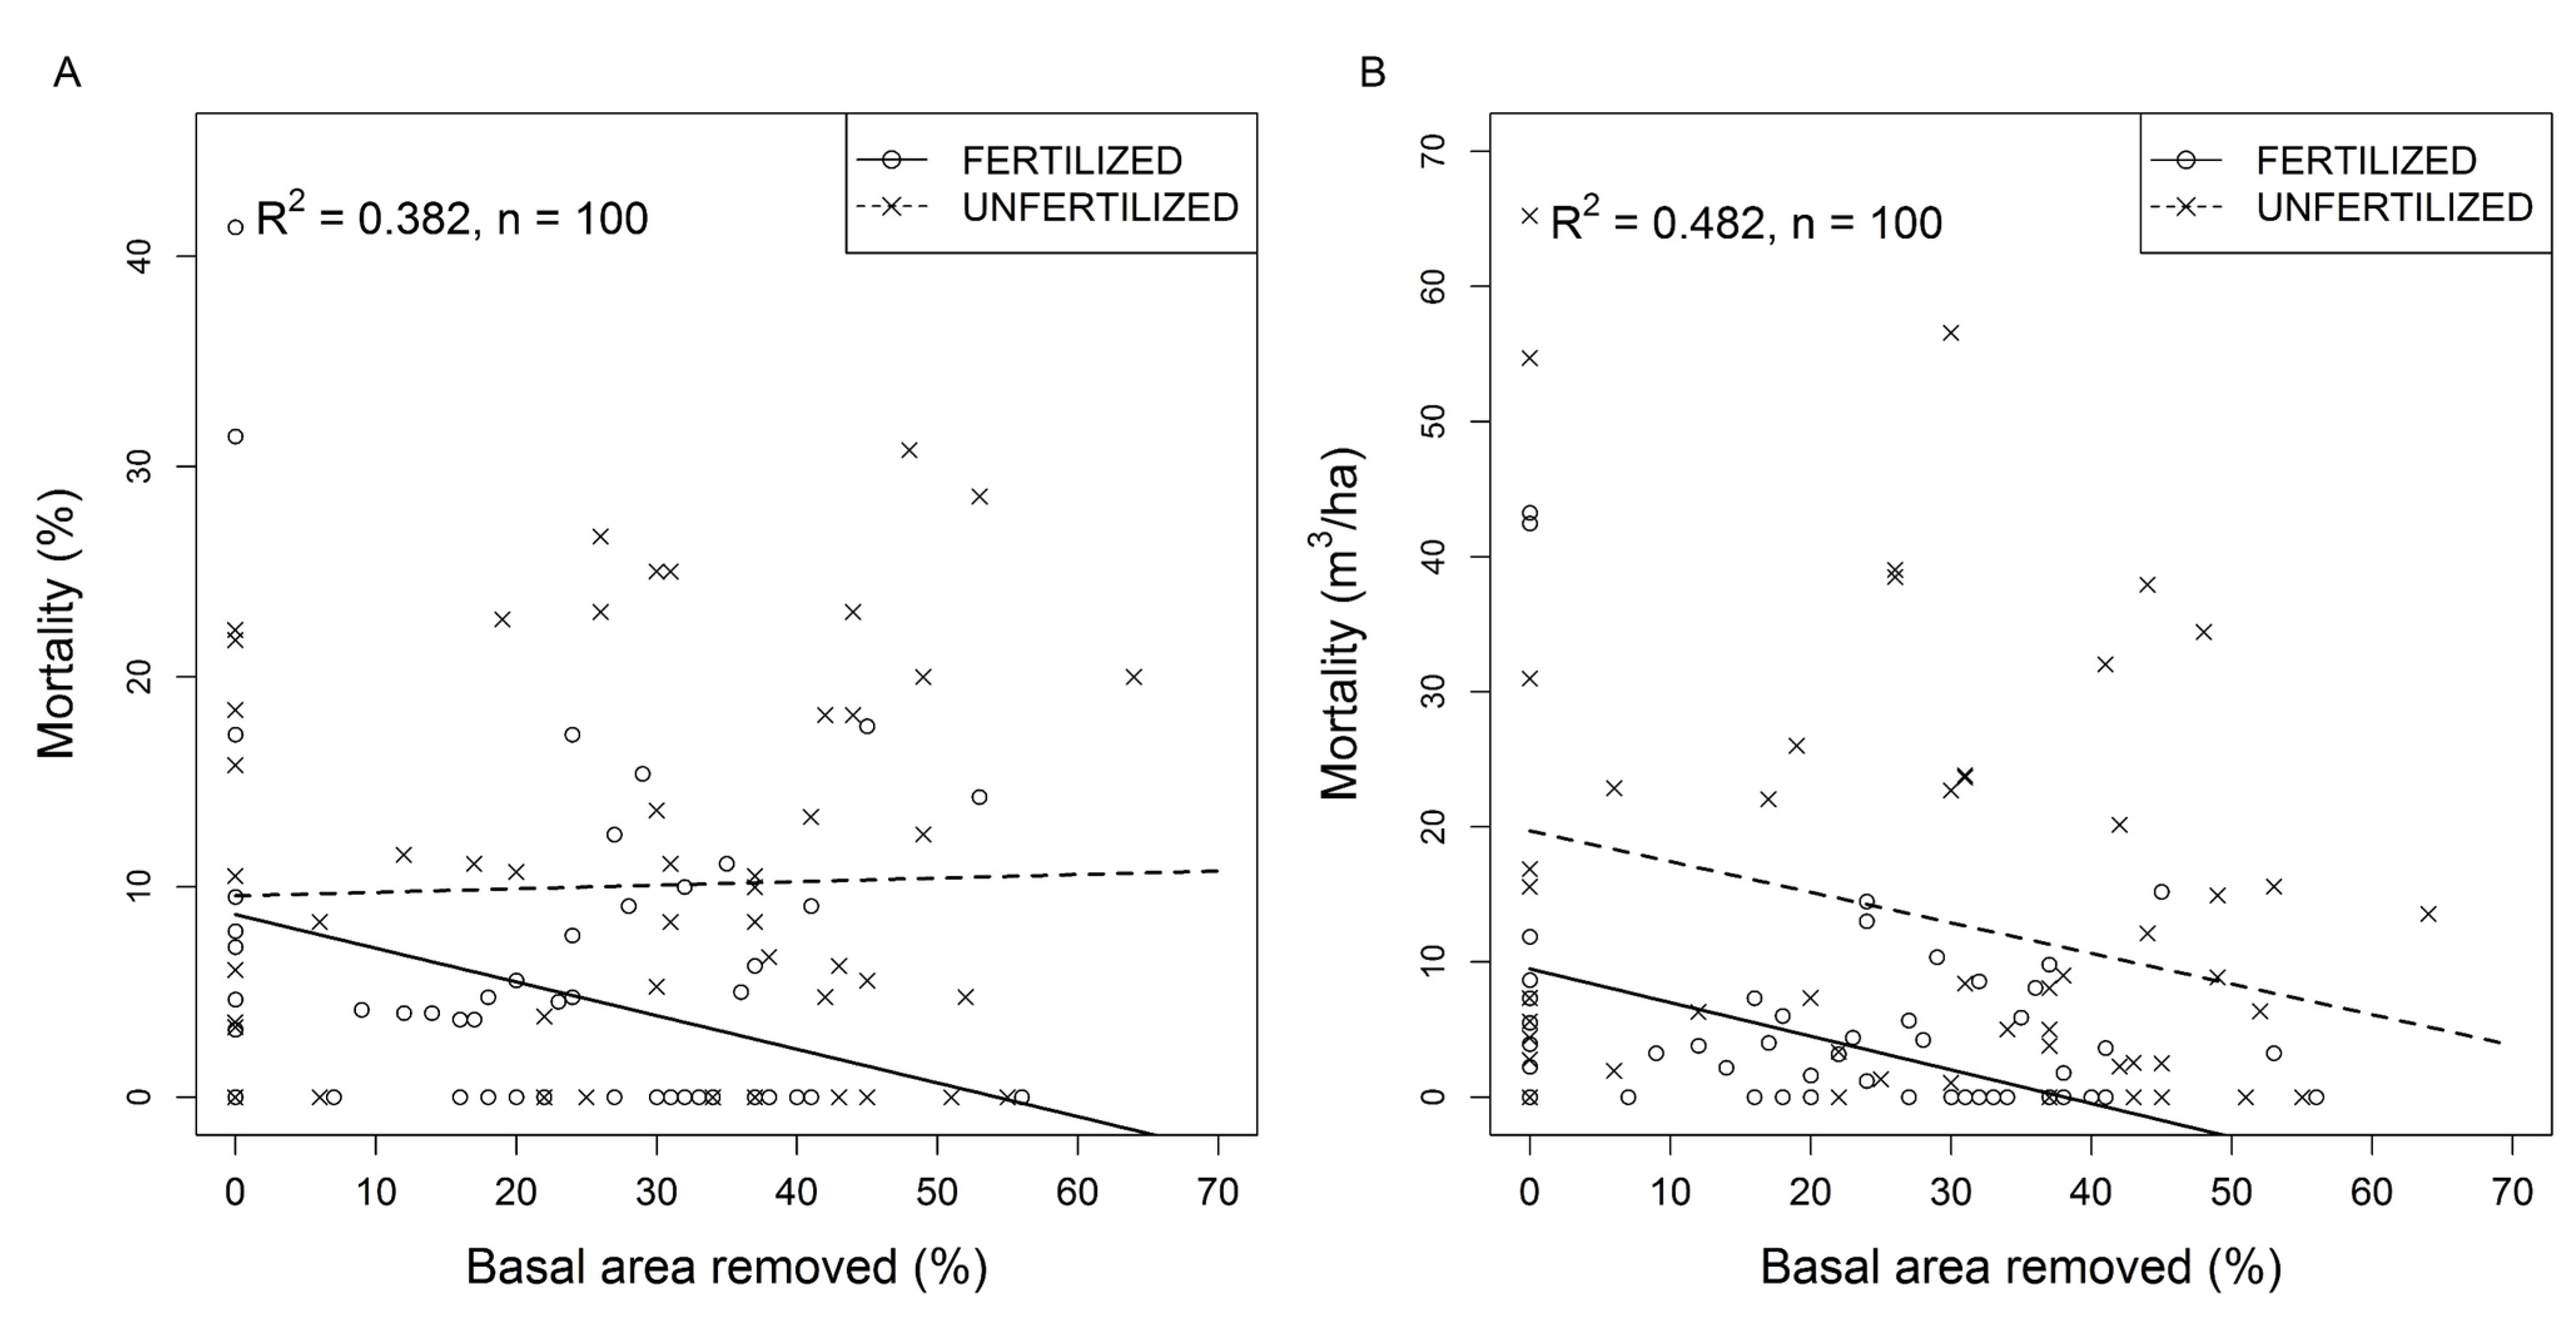
3.3. Tree Mortality in Response to Thinning and Fertilization

Tree mortality over the first five years following thinning, expressed as the proportion of residual trees, increased with basal area removed (Table 3) from 1.2% in control PSPs to 6.9% in the most intensively thinned PSPs. Mortality estimates based on volume were not affected by thinning intensity. Both measures of mortality increased with stand age (Table 3).
The proportion of residual trees that died between 5 and 14 years following thinning ranged from 0% to 41.4% (Figure 4A). Mortality was independent of thinning intensity in unfertilized PSPs while a significant interaction between relative basal area removed and fertilization (Table 3) indicated that tree mortality decreased with basal area removed in fertilized plots (Figure 4A). Volume lost to mortality during the same period increased with initial stand basal area and stand age (Table 3) and decreased similarly with thinning intensity in unfertilized and fertilized PSPs (Figure 4B). However, mean volume lost to mortality remained significantly higher (10.8 m3 ha−1) in unfertilized than in fertilized PSPs (Table 3, Figure 4B).
Table 3. Stand level tree mortality in commercially thinned jack pine stands with or without fertilization over periods of 5 and 5 to 14 years following thinning. Fertilization was conducted within experimental sub-plots 3 to 5 years after thinning. Effects of initial stand basal area and age, basal area removed by commercial thinning, fertilization and selected interactions on mortality assessed by means of mixed linear models.
Response VariableTree Mortality (% of Residual Stems)Tree Mortality (% of Residual Stems)Volume Lost to MortalityVolume Lost to Mortality
Period After Thinning5 Years5 to 14 Years5 Years5 to 14 Years
Fixed factorsEpEpEpEp
Intercept−10.80.008−19.9<0.001−9.90.136−35.9<0.001
BA initial0.0010.9930.350.0220.310.1300.490.022
BA removed0.080.016−0.160.027−0.010.879−0.240.001
Age0.210.0040.330.0152.30.0290.560.010
Fertilization (UnF)-0.890.722-10.8<0.001
BA removed × Fertilization (UnF)-0.170.037-0.020.838
BA = basal area; UnF = unfertilized; Estimates of fixed factors and interactions effects (E) are presented with p-values (p); p-values in bold type correspond to factors with significant effect (p ≤ 0.05); Reference levels are shown in brackets for categorical variables; -: not applicable.
Figure 4. Jack pine stand response to commercial thinning and fertilization over periods of 5 to 14 years following thinning. Fertilization was conducted within sub-plots in each experimental unit 3 to 5 years after thinning. (A) Tree mortality (% of residual stems) as a function of basal area removed and fertilization over a period of 5 to 14 years after commercial thinning; (B) Volume lost to mortality as a function of basal area removed and fertilization over a period of 5 to 14 years after commercial thinning.
Forests 06 02678 g004

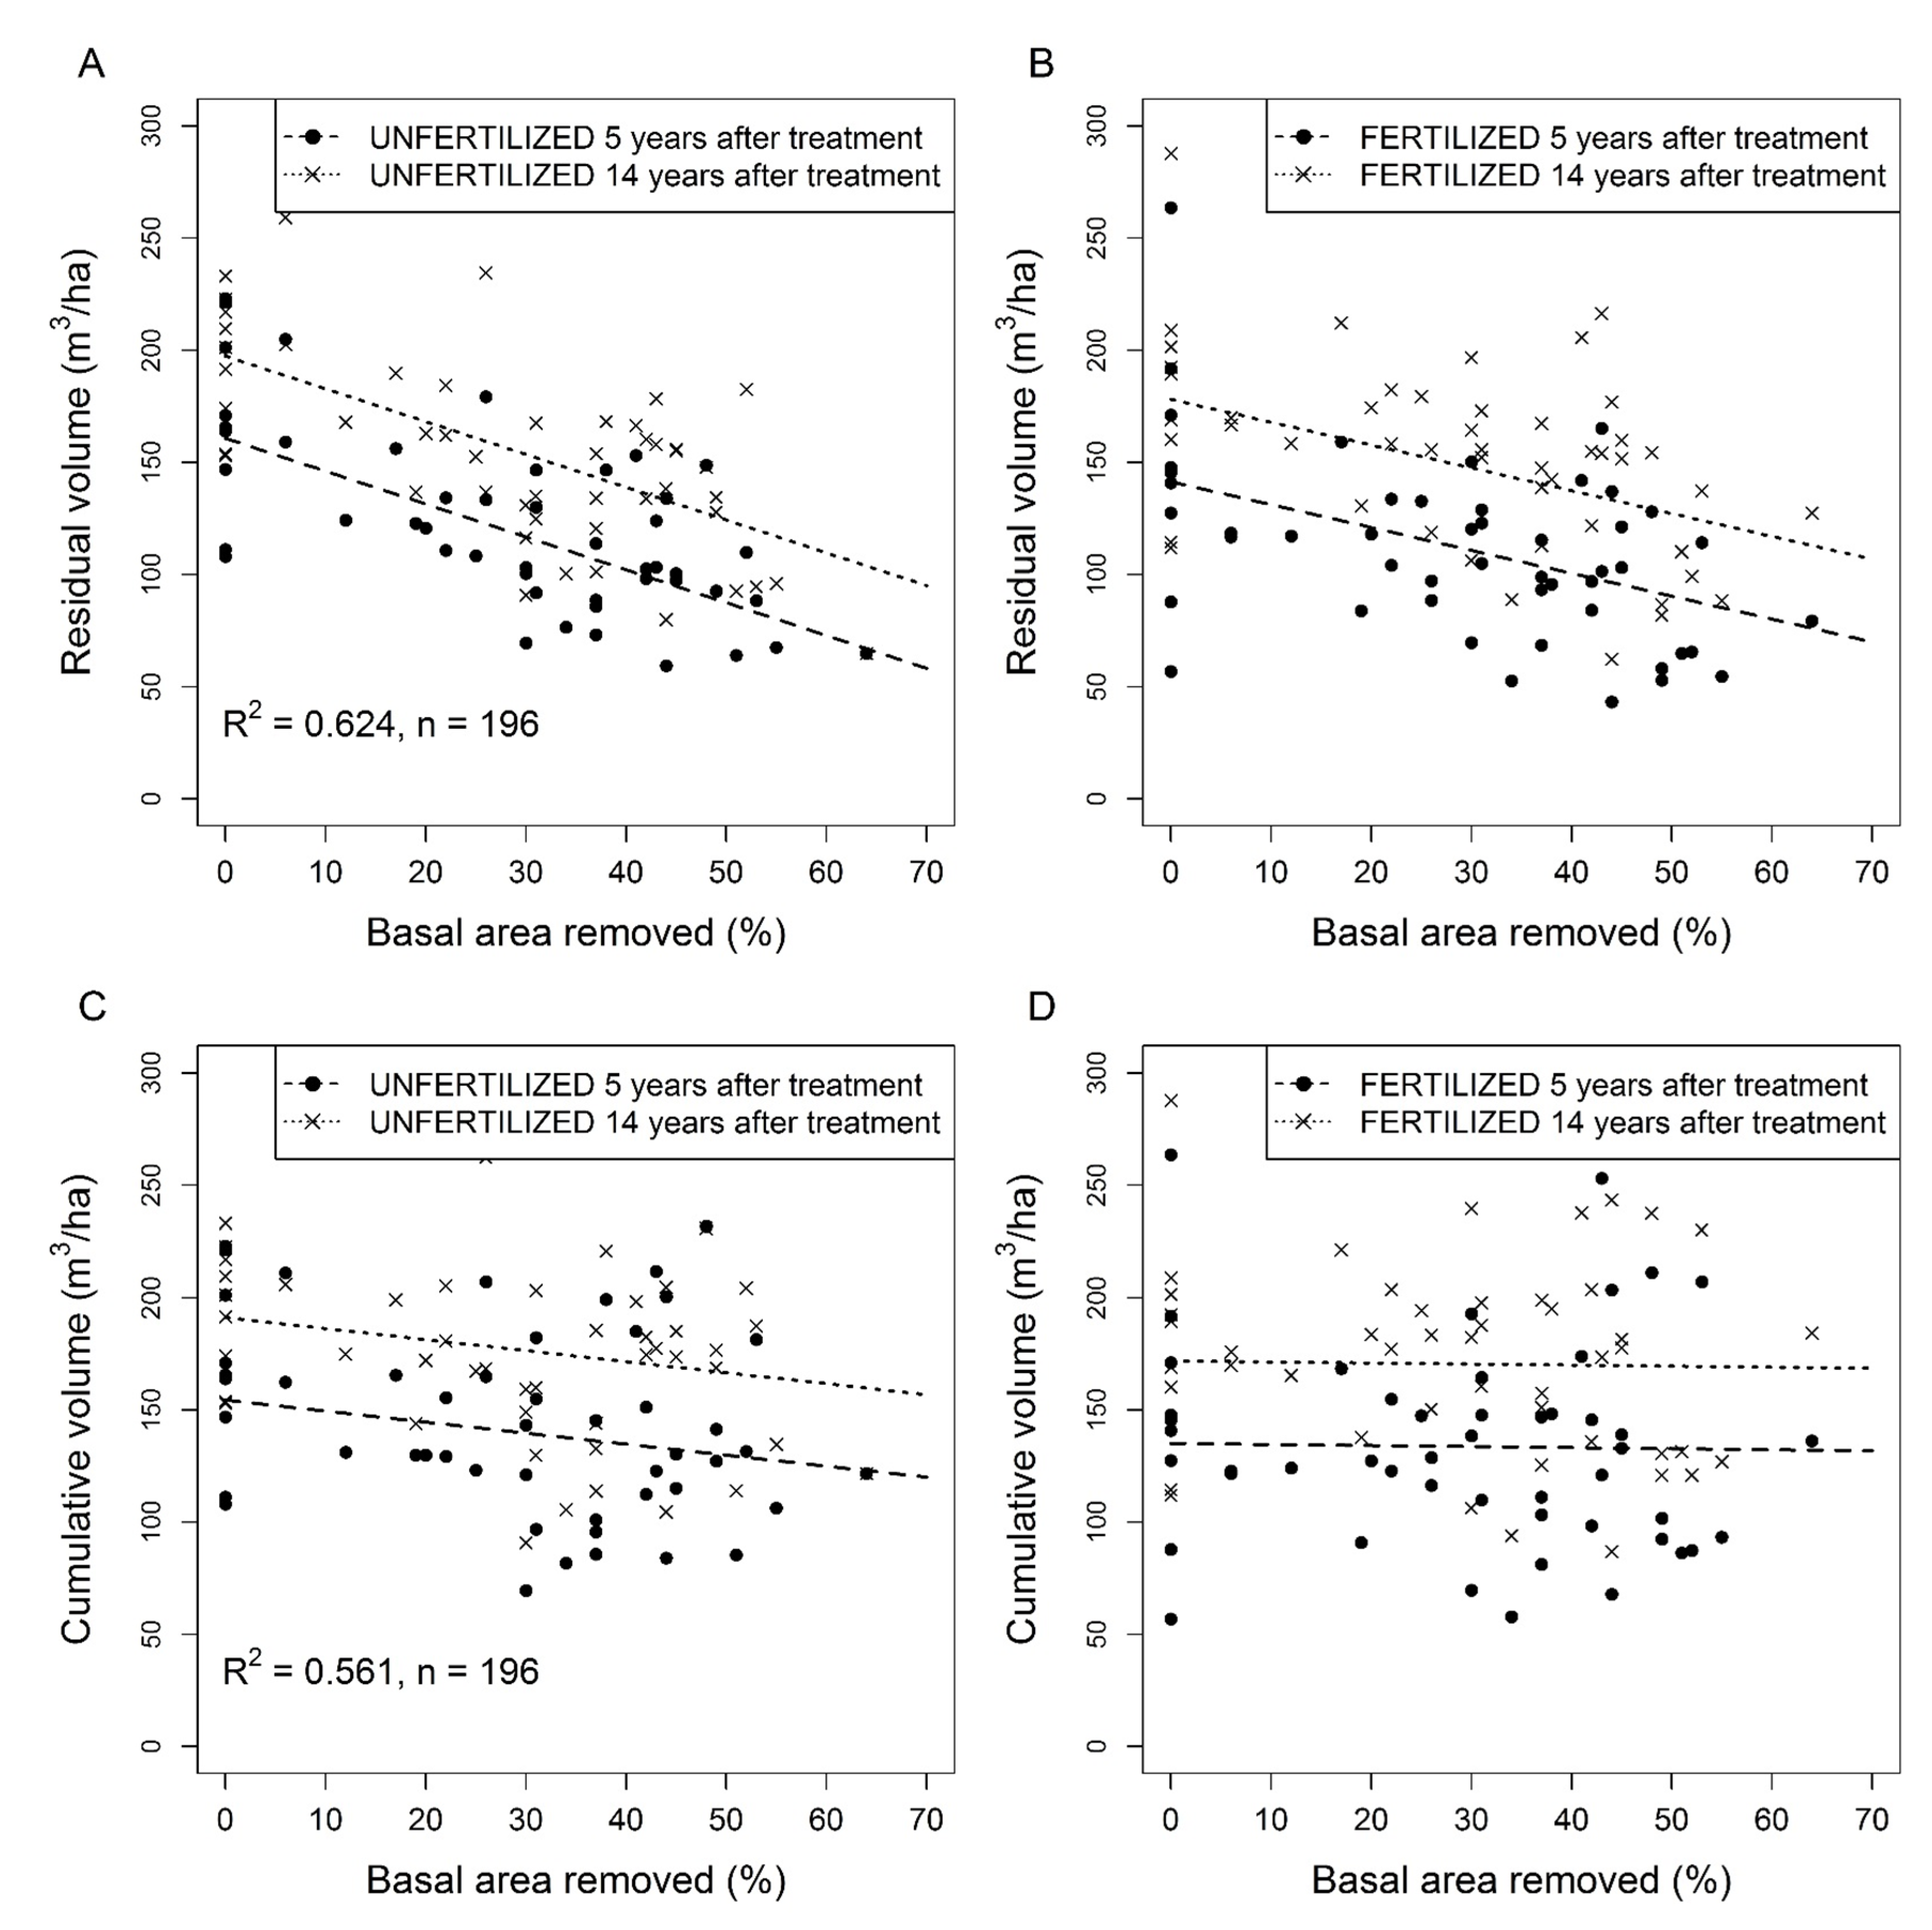
3.4. Stand Basal Area and Volume Increment Following Thinning with and without Fertilization

Absolute basal area increment during the initial 5 year period after thinning was not affected by the relative basal area removed but increased significantly with the initial stand basal area (Table 4). During the following 5 to 14 year period, no effect of basal area removed on absolute basal area increment was observed but absolute basal area increment increased with initial stand basal area and fertilization and decreased with stand age (Table 4).
During the first 5 years following thinning, the absolute stand volume increment decreased slightly with relative basal area removed (Figure 5A) and increased to some extent with initial stand basal area (Table 4). Absolute stand volume increment during the 5 to 14 year period after thinning was significantly and positively affected by initial basal area and fertilization but decreased with stand age (Table 4). The effect of relative basal area removed on absolute stand volume increment was positive but marginally significant (Table 4, Figure 5B).
Relative stand volume increment during the initial 5 year (Figure 5C) and the following 5 to 14 year periods (Figure 5D) after thinning showed a significant positive relationship with relative basal area removed and decreased with stand age (Table 4). Relative stand volume increment 0 to 5 years after thinning increased from 13.8% in control PSPs to 29.1% in the most intensively thinned PSPs. The respective values for 5 to 14 years after thinning were 20.5% and 47.1% in unfertilized PSPs. During this period, fertilization increased relative stand volume increment by 11.5%, independent of basal area removed (Table 4).
Table 4. Jack pine stand basal area increment, absolute and relative volume increment in response to commercial thinning and fertilization over periods of 5 and 5 to 14 years. Fertilization was conducted within experimental sub-plots 3 to 5 years after thinning. Effects of initial stand basal area and age, basal area removed by commercial thinning, fertilization and selected interactions assessed by means of linear mixed models.
Response VariablesAbsolute Basal Area IncrementAbsolute Basal Area IncrementAbsolute Volume IncrementAbsolute Volume IncrementRelative Volume IncrementRelative Volume Increment
Period After Thinning5 Years5 to 14 Years5 Years5 to 14 Years5 Years5 to 14 Years
Fixed factorsEpEpEpEpEpEp
Intercept1.820.1033.91<0.00117.790.10162.1<0.00138.50.00685.6<0.001
BA initial0.050.0010.12<0.0010.420.0610.940.008−0.300.234−0.160.672
BA removed−0.010.1340.010.837−0.040.5050.200.0600.220.0010.410.001
Age−0.020.378−0.040.024−0.170.319−0.830.006−0.290.199−0.830.018
Fertilization (UnF)-−0.790.050−8.330.096-−11.50.024
BA removed × Fertilization-−0.010.338−0.050.729-−0.060.666
BA = basal area; DBH = diameter at breast height; UnF = unfertilized; Estimates of fixed factors and interactions effects (E) are presented with p-values (p); p-values in bold type are significant (p ≤ 0.05); Reference levels of categorical variables are shown in brackets; -: not applicable.
Figure 5. Jack pine stand response to commercial thinning and fertilization over the 5- to 14-year period following commercial thinning; (A) Stand volume increment over the first 5 years after commercial thinning in unfertilized plots as a function of basal area removed; (B) Stand volume increment between 5 and 14 years after thinning as a function of basal area removed and fertilization; (C) Relative stand volume increment over the first 5 years after commercial thinning in unfertilized plots as a function of basal area removed; (D) Relative stand volume increment between 5 and 14 years after thinning as a function of basal area removed and fertilization. Untransformed observed (dots) and predicted (lines) values. Predicted values for tree volume increment were back-transformed from a log transformation.
Forests 06 02678 g005
In unfertilized and fertilized PSPs, residual stand volume and cumulative merchantable volume 5 and 14 years after thinning decreased with relative basal area removed but increased significantly with initial stand basal area (Table 4). Stand age had no significant effect on residual volume 5 and 14 years after treatments. The slope between thinning intensity and volume remained constant over time in both unfertilized and fertilized PSPs. Stand volume was 0.44 m3 ha−1 lower for each additional percent of basal area removed in unfertilized PSPs (Figure 6A). Stand volume increased by an average of 36.8 m3 ha1 over the 5 to 14 year period after thinning regardless of thinning intensity (Table 5, Figure 6A,B).
Figure 6. Residual and cumulative (harvested and residual) jack pine stand volume 5 and 14 years after commercial thinning as a function of basal area removed in unfertilized (A,C) and fertilized (B,D) plots. Untransformed observed (dots) and predicted (lines) values.
Forests 06 02678 g006
Cumulative stand volume (harvested and residual) 5 and 14 years after commercial thinning increased significantly with initial stand basal area in both fertilized and unfertilized PSPs (Table 5). However, cumulative stand volume decreased with increasing thinning intensity, and the significant interaction between basal area removed and fertilization showed that cumulative stand volume decreased faster with increasing thinning intensity in unfertilized than fertilized PSPs (Table 5). Fourteen years after thinning, the mean cumulative stand volume was 191 m3 ha−1 in unfertilized control PSPs and 156 m3 ha−1 in the most intensively thinned (and unfertilized) PSPs (Figure 6C) while mean cumulative stand volume was 172 m3 ha−1 in fertilized control PSPs in and 169 m3 ha−1 in the most intensively thinned and fertilized PSPs (Figure 6D).
Table 5. Changes in merchantable stand volume induced by commercial thinning and fertilization in jack pine stands over a period of 14 years. Fertilization was conducted within experimental sub-plots 3 to 5 years after thinning. Effects of initial stand basal area and age, basal area removed by commercial thinning, fertilization, time since thinning and selected interactions assessed by means of linear mixed models.
Response VariablesResidual Live VolumeCumulative Volume
Fixed factorsEpEp
Intercept14.30.646−75.80.073
BA initial3.33<0.0015.20<0.001
BA removed−1.02<0.001−0.050.830
Age0.680.1871.280.115
Time since thinning (14 years)36.8<0.00136.8<0.001
BA removed × time (14 years)0.010.9900.010.986
Fertilization (UnF)19.3<0.00119.3<0.001
BA removed × Fertilization−0.440.008−0.440.008
BA = basal area; DBH = diameter at breast height; UnF = unfertilized; Estimates of fixed factors and interactions effects (E) are presented with p-values (p); p-values in bold type are significant (p ≤ 0.05); Reference levels of categorical variables are shown in brackets; -: not applicable.

4. Discussion

4.1. Tree Growth

Our study clearly indicates a positive effect of thinning on tree diameter and volume growth that increased with thinning intensity. These results are consistent with other experiments that have reported increases in stem growth after thinning in jack pine [6,14,17,53], Scots pine [7,8], Norway spruce (Picea abies (L.) Karst. [54]), Douglas fir [55] and black spruce [56] stands. Thinning significantly enhanced mean tree volume in both fertilized and unfertilized treatments. As reported by Mäkinen and Isomäki for Scots pine [7,8] and Norway spruce [57,58], moderately to heavily thinned stands produce larger trees than lightly thinned and unthinned stands. Our study adds to these previous findings by reporting trends over a much larger thinning range than what has generally been reported.
Despite a higher absolute volume increment of large trees, relative volume increment was greater in smaller trees. These results are consistent with our hypothesis and again consistent with previous findings that reported that small and medium-size trees have the highest relative response to thinning [56,57,59,60]. However, smaller trees have also been shown to be sometimes less reactive than larger stems [7,58,61].
Numerous studies have reported increases in light transmittance with decreasing stand basal area [62,63,64] and following thinning [36], conditions which would tend to induce increased production of foliar biomass [18] and eventually tree growth. Following stem analyses conducted 6 years after thinning in five of the studied stands, Goudiaby et al. [47] reported an increase in stem volume of dominant jack pine stems resulting from increased mid crown foliage biomass and improved growth efficiency. The stronger response in relative growth rate of small and intermediate jack pine trees compared to larger trees could result from a greater increase in light exposure to their crown foliage following thinning. That is, the relative increase in light availability would be considerably greater for suppressed trees whereas, according to Goudiaby et al. [47], light availability after thinning increased only for mid-crown foliage of dominant trees. Increased solar radiation following thinning [36] can also enhance soil temperatures and accelerate nitrogen mineralization [65,66]. This cascade of processes could contribute to improving tree growth, particularly in cold climates such as that of the boreal forest [67].
Because trees in mature stands generally grow slowly due to declining photosynthesis rates [68], growth response to thinning in older stands is expected to be less pronounced than in younger ones [69]. Our results confirm the effect of stand age on individual tree response to thinning for small trees only. The decreasing volume growth rate with stand age 5 and 14 years after thinning was caused by an increase in tree mortality.

4.2. Mortality

Mortality in natural pre-mature and mature jack pine stands tends to occur as density-dependant self-thinning resulting from intra-specific competition among neighbours [70]. As jack pine is shade intolerant, stems in the suppressed and intermediate crown classes tend to lose vigour earlier than dominants and co-dominants as a result of lower light resources [71]. Thinning from below, as in this study, pre-empts this natural mortality [72], but may also contribute to mortality due to other factors. These include direct physical damage to residual stems or crowns during thinning operations which can eventually increase the probability of fungal infection. As well, heavy thinning, like other high-intensity partial cutting treatments, can reduce stability of residual stems and render stands more susceptible to windthrow [73]. For example, Scott and Mitchell [74] suggested a lower threshold for residual stands of 20% of original stand density in Tsuga heterophylla (Raf.) Sarg. and Mason and Kerr [75] recommended that harvesting should not exceed 20% of the original stand basal area in Picea sitchensis (Bong.) Carr. In unfertilized stands, tree mortality over the 5 to 14 years period after thinning was similar (around 10%) across the gradient of thinning intensities and windthrow remained marginal. By removing imminent natural tree mortality, thinning from below reduces mortality as shown by the negative relationship between basal area removed and volume lost to mortality 14 years after thinning. The increase in tree mortality and volume lost to mortality with initial basal area and stand age observed between 5 and 14 years after thinning confirms previous reports of higher mortality rates in denser and older stands [19,70].

4.3. Fertilization Effect on Tree Growth

As expected, nitrogen fertilization enhanced growth of tree diameter and volume, corroborating results of previous studies [25,26,29,32]. However, the low explanatory power for individual tree increment models is an indication that a host of other factors, besides those accounted for, affected tree growth during the study period. Also, fertilization effect on tree volume increment decreased with thinning intensity. Responses of both small and large trees suggest that there exists a threshold of basal area removal (around 45%) after which the effect of fertilization appeared to dissipate or cancel out. Contributions of harvesting slash to tree nutrition in thinned stands have been reported for Scots pine and Norway spruce [76] and for Monterey pine (Pinus radiata D. Don. [65]). It is possible that an increase in N availability due to increased slash loads and mineralisation reduced N limitation in heavily thinned stands.

4.4. Fertilization and Tree Mortality

We expected that by increasing tree growth, fertilization would also increase self-thinning mortality due to higher intraspecific competition [42]. Contrary to our hypothesis, fertilization did not increase tree mortality in controls or low intensity thinned plots. Moreover, the strongest observed effect of fertilization was a reduction of tree mortality with thinning intensity. This pattern could result from reduced intraspecific competition for soil resources and generally better tree vigour. However, this result disagrees with studies by Yang [18] and Zhang et al. [42] which reported that nitrogen loadings increased tree mortality.

4.5. Stand Volume Increment and Cumulative Volume

Although stand volume increment has generally been reported to decrease with increased thinning intensity [8,19,77], absolute stand volume increment increased with the proportion of basal area removed up to values as high as 70%. These unexpected results may be explained by two factors: (1) higher volume loss to self-thinning mortality in controls and low intensity thinned plots and (2) greater recruitment of stems into commercial size classes (DBH ≥ 9.1 cm) in thinned treatments during the experiment. (Commercial-sized tree recruitment is not always considered in stand growth calculations but was in this study.) Given these factors, this study suggests that a relatively low number of residual trees could contribute to maintain equal or higher annual volume increment than in control stands. This said, another important and perhaps surprising point to recognize is that the upper limit of basal area removal in this study did not appear to reach the threshold at which stand volume increment begins to decrease as a result of sub-optimal stand occupancy and the low number of stems on which volume can accrue. According to Assmann [78], increases in stand production with increasing thinning intensity should reach a maximum value beyond which stand growth decreases due to suboptimal tree density (or site occupancy).
Consistent with individual tree response to nitrogen fertilization and lower mortality, the relative stand volume increment was 11.5% higher in fertilized than unfertilized stands. This was also consistent with the response of jack pine to urea fertilization observed in an interprovincial forest fertilization program [21]. These results are consistent with an improvement of above- and belowground resource availability through thinning and fertilization. The subsequent reduction of intraspecific competition and mortality contributed to increase volume growth at the stand level.
Despite evidence, over the 14 year period, of a general increase in residual stand volume with increased basal area removal, cumulative volume, (volume harvested + residual stand volume at year 14 post-treatment), showed the opposite trend. That is, the greater stand volume increment in high intensity thinning treatments did not compensate for the relatively low residual basal areas (and sub-optimally occupied growing space) in these treatments. This is particularly evident in unfertilized stands and consistent with previous thinning experiments in which cumulative volumes were usually greater in controls than in thinned stands [19]. However, low thinning intensities combined with short thinning cycles could result in cumulative stand volumes higher than that of controls [42]. Finally, in fertilized stands, improved tree growth and, more importantly, reduced tree mortality compensated for the loss of harvested trees. Our results indicate that on these low fertility sites combining thinning and fertilization can produce cumulative stand volumes similar to unthinned control stands and with larger trees than if stands had only be thinned or fertilized. The operational benefits in terms of mean tree size and spacing optimization are obviously greater and more large stems would also increase product yield and value. It should be noted, however, that because this study evaluated responses to thinning and fertilization in plots situated between (and not including) forwarding trails, thinning intensity values are lower than those that would incorporate trails and, more importantly, differences in cumulative volume increment between untreated controls (no trails) and thinned treatments would actually be greater at the stand level.

5. Conclusions

By reducing competition and redistributing below- and above-ground resources to a reduced number of stems, commercial thinning increased diameter and volume increment of residual trees, with smaller diameter trees exhibiting greater relative volume increment than larger trees. On low-fertile stands such as those in our study, fertilization improves stand response to thinning. It is expected that diameter and volume gains at the tree level and more regular residual spacing will lower future operational costs and yield higher product value per volume harvested.
The experiment covers a large area in the Canadian Precambian Shield where jack pine is predominantly found on poor, coarse-textured sites. Despite the body of knowledge on commercial thinning, little hard data can be found regarding long-term response of jack pine to commercial thinning combined with fertilization. Given its predominance on poor soils and its straightforward response to N fertilization, it is surprising that thinned jack pine stands are not fertilized more often on an operational level. Our results indicate that the silvicultural benefits of commercial thinning of jack pine on coarse-textured sites can only partially materialize without fertilization. However, the effects of these combined treatments on wood quality and the economics of treatment inputs versus product value need further investigation.

Supplementary Material

Merchantable tree volume estimated using Equation (3) compared with tree volume measurements from stem analyses of 30 trees from five of the nine investigated stands. Stem analyses for these 30 trees [47]. Figure S1 indicates that although the equation underestimates tree volume, the fit between predicted and observed values is not affected by thinning intensity. Equations used in this study were therefore considered suitable for volume estimation from DBH measurements.
Figure S1. Merchantable tree volume estimated compared with tree volume measurements from stem analyses of 30 trees from five of the nine investigated Jack pine stands in the Abitibi-Témiscamingue region of Northwestern Québec, Canada. Stem analyses for these 30 trees [47].
Forests 06 02678 g007

Acknowledgments

This research was funded by the Canadian Natural Sciences and Engineering Research Council (CFSPJ 256356 01), the Fonds Québécois de Recherche-Nature et Technologies, the Ministère des Forêts, de la Faune et des Parcs du Québec, MITACS-Accelerate, Scierie Landrienne, AECOM, Tembec and Resolute Forest Products. We are grateful to Toma Guillemette, Marie-Hélène Longpré, Mario Major, and Alfred Coulombe for logistical and technical support. Particular thanks extended to Yvon Grenier for establishing and early monitoring of this experiment, to Louis Dumas and Geneviève Labrecque (Tembec Inc.) for their silvicultural expertise and support, and to Marc Mazerolle (CEF, Centre d’étude de la forêt) for statistical advice.

Author Contributions

Suzanne Brais designed the study. Julien Moulinier and Suzanne Brais contributed to the data analysis and manuscript preparation. Brian Harvey and Ahmed Koubaa contributed in writing and revising the manuscript.

Conflicts of Interest

The authors declare no conflict of interest.

References

  1. Pothier, D.; Margolis, A. Analysis of growth and light interception of balsam fir and white birch saplings following precommercial thinning. Ann. For. Sci. 1991, 48, 123–132. [Google Scholar] [CrossRef]
  2. Karsh, M.B.; Lavigne, M.B.; Donnelly, J.G. Growth Responses of the Balsam Fir and Black Spruce Spacing Trials; Information Report N-X-291; Natural Resources Canada, Atlantic Forestry Centre: St-John’s, NF, Canada, 1994.
  3. Smith, D.M.; Larson, B.C.; Kelty, M.J.; Ashton, P.M.S. The Practice of Silviculture: Applied Forest Ecology, 9th ed.; John Wiley & Sons, Inc.: New York, NY, USA, 1997. [Google Scholar]
  4. Schneider, R.; Zhang, S.Y.; Swift, D.E.; Bégin, J.; Lussier, J.M. Predicting selected wood properties of jack pine following commercial thinning. Can. J. For. Res. 2008, 38, 2030–2043. [Google Scholar] [CrossRef]
  5. Zeide, B. Thinning and growth: A full turn around. J. For. 2001, 99, 20–25. [Google Scholar]
  6. Schneider, R. Effet de L’éclaircie Commerciale sur la Croissance et la Qualité du bois du pin Gris. Ph.D. Thesis, Université Laval, Québec, QC, Canada, 2007. [Google Scholar]
  7. Mäkinen, H.; Isomäki, A. Thinning intensity and long-term changes in increment and stem form of Scots pine trees. For. Ecol. Manag. 2004, 203, 21–34. [Google Scholar] [CrossRef]
  8. Mäkinen, H.; Isomäki, A. Thinning intensity and growth of Scots pine stands in Finland. For. Ecol. Manag. 2004, 201, 311–325. [Google Scholar] [CrossRef]
  9. Allen, H.L. Silvicultural treatments to enhance productivity. In The Forests Handbook: Volume II; Evans, J., Ed.; Blackwell Science Ltd: Oxford, UK, 2001; p. 382. [Google Scholar]
  10. Curtis, R.O.; Marshall, D.D. Levels-of-Growing-Stock Cooperative Study in Douglas Fir: Report No. 14-Stampede Creek: 30 Year Results; Research Paper PNW-RP-543; USDA Forest Service: Portland, OR, USA, 2002; p. 77.
  11. Ontario Ministry of Natural Resources (OMNR). Provincial Wood Supply Strategy; Queen’s Printer for Ontario: Toronto, ON, Canada, 2004. [Google Scholar]
  12. Boulay, E. Ressources et industries forestières. Portrait statistique. Édition 2013. Available online: http://www.mffp.gouv.qc.ca/publications/forets/connaissances/portrait-statistique-2013.pdf (accessed on 10 June 2014).
  13. Cameron, A.D. Importance of early thinning in the development of long-term stand stability and improved log quality: A review. Forestry 2002, 75, 25–35. [Google Scholar] [CrossRef]
  14. Bella, I.E.; de Franceschi, J.P. Commercial Thinning Improves Growth of Jack Pine; Information Report NOR-X-112; Natural Resources Canada, Northern Forest Research Centre: Edmonton, AB, Canada, 1974; p. 23.
  15. Smith, C.R.; Oerlemans, W.J.A.M. Ten-Year Growth Response and Financial Evaluation of Commercial Strip Thinning of Jack Pine: A Case Study; Information Report O-X-396; Canadian Forestry Service, Great Lakes Forestry Centre: Sault Ste. Marie, ON, Canada, 1988; p. 25.
  16. Barbour, R.J.; Fayle, D.C.F.; Chauret, G.; Cook, J.; Karsh, M.B.; Ran, S. Breast-heigth relative density and radial growth in mature jack pine (Pinus bansksiana) for 38-years after thinning. Can. J. For. Res. 1994, 24, 2439–2447. [Google Scholar] [CrossRef]
  17. Zhang, S.Y.; Chauret, G.; Swift, D.E.; Duchesne, L. Effects of pre-commercial thinning on tree growth and lumber quality in a jack pine stand in New Brunswick, Canada. Can. J. For. Res. 2006, 36, 945–952. [Google Scholar] [CrossRef]
  18. Yang, R.C. Foliage and stand growth responses of semimature lodgepole pine to thinning and fertilization. Can. J. For. Res. 1998, 28, 1794–1804. [Google Scholar] [CrossRef]
  19. Tremblay, S.; Laflèche, V. Résultats Obtenus 5 ans après Traitement dans les Placettes du Réseau de la Mesure des Effets Réels de L’éclaircie Commerciale en Peuplements Résineux. Mémoire de Recherche Forestière n°166. Direction de la Recherche Forestière; Ministère des ressources naturelles du Québec: Québec, QC, Canada, 2012; p. 52. (In French)
  20. Moorhead, D.J.; Dickens, E.D. Fertilization Pine Plantations. A County Agent’s Guide for Making Fertilization Recommendations; Warnell School of Forest Ressources, the University of Georgia: Athens, GA, USA, 2002. Available online: http://bugwood.org/fertilization/csoillab.html (accessed on 10 March 2015).
  21. Weetman, G.F.; Krause, H.H.; Koller, E.; Veilleux, J.M. Interprovincial Fertilization Program, 1968–1983: Standardized Fertilization Installations in 81 Unmanaged Middle-Aged Stands in Seven Provinces; Final Report: Results of Ten-Year Growth Measurements; Information Report DPC-X-21; Canadian Forestry Service: Ottawa, ON, Canada, 1987.
  22. Weetman, G.F.; Aigar, D. Jack pine nitrogen fertilization and nutrition studies: Three year results. Can. J. For. Res. 1974, 4, 381–398. [Google Scholar] [CrossRef]
  23. Morrison, I.K.; Swan, H.S.D.; Foster, N.W.; Winston, D.A. Ten-year growth in two fertilization experiments in a semimature jack pine stand in northwestern Ontario. For. Chron. 1997, 53, 142–146. [Google Scholar] [CrossRef]
  24. Bernier, C.; Camiré, B. Fertilization azotée en forêt de pin gris (Pinus banksiana) II. Variations de la masse foliaire et des éléments nutritifs du feuillage de pin gris et de quelques espèces du sous-bois. Can. J. For. Res. 1981, 11, 423–432. (In French) [Google Scholar]
  25. Newton, P.F.; Amponsah, I.G. Systematic review of short-term growth responses of semi-mature black spruce and jack pine stands to nitrogen-based fertilization treatments. For. Ecol. Manag. 2006, 237, 1–14. [Google Scholar] [CrossRef]
  26. Groot, A.; Brown, K.M.; Morrison, I.K.; Barker, J.E. A 10-year tree and stand response of jack pine to urea fertilization and low thinning. Can. J. For. Res. 1984, 14, 44–50. [Google Scholar] [CrossRef]
  27. Valinger, E. Effect of thinning and nitrogen fertilization on stem growth and stem form of Pinus sylvestris trees. Can. J. For. Res. 1992, 7, 219–228. [Google Scholar]
  28. Valinger, E.; Elfving, B.; Morling, T. Twelve-year growth response of Scots pine to thinning and nitrogen fertilization. For. Ecol. Manag. 2000, 134, 45–53. [Google Scholar] [CrossRef]
  29. Eriksson, E. Thinning operation and their impact on biomass production in stands of Norway spruce and Scots pine. Biomass Bioenergy 2006, 30, 848–854. [Google Scholar] [CrossRef]
  30. Brix, H. Effects of thinning and fertilization on growth of Douglas-fir: Relative contribution of foliage quantity and efficiency. Can. J. For. Res. 1983, 13, 167–175. [Google Scholar] [CrossRef]
  31. Brix, H.; Mitchell, A.K. Effects of thinning and nitrogen fertilization on xylem development in Douglas-fir. Can. J. For. Res. 1980, 10, 121–128. [Google Scholar] [CrossRef]
  32. DeBell, D.S.; Harrington, C.A.; Shumway, J. Thinning Shock and Response to Fertilizer Less than Expected in Young Douglas-fir Stand at Wind River Experimental Forest; USDA Forest Service Res. Paper PNW-RP-547; Pacific Northwest Research Station: Portland, OR, USA, 2002; p. 20. [Google Scholar]
  33. Cown, D.J.; McConchie, D.L. Effects of thinning and fertilizer application on wood properties of Pinus radiala. N. Z. For. Sci. 1981, 11, 79–91. [Google Scholar]
  34. Van Cleve, K.; Zasada, J. Response of 70-yr-old white spruce to thinning and fertilization in interior Alaska. Can. J. For. Res. 1976, 6, 145–152. [Google Scholar] [CrossRef]
  35. Weetman, G.F.; Roberge, M.R.; Meng, C.H. Black spruce: 15-year growth and microbiological response to thinning and fertilization. Can. J. For. Res. 1980, 10, 502–509. [Google Scholar] [CrossRef]
  36. Hale, S.E. The effect of thinning intensity on the below-canopy light environment in a Sitka spruce plantation. For. Ecol. Manag. 2003, 179, 341–349. [Google Scholar] [CrossRef]
  37. Latham, P.; Tappeiner, J. Response of old growth conifers to reduction in stand density in western Oregon forests. Tree Physiol. 2002, 22, 137–146. [Google Scholar] [CrossRef] [PubMed]
  38. Wright, E.F.; Coates, K.D.; Canham, C.D.; Bartemucci, P. Species variability in growth response to light across climatic regions in northwestern British Columbia. Can. J. For. Res. 1998, 28, 871–886. [Google Scholar] [CrossRef]
  39. Weiner, J. Size hierarchies in experimental populations of annual plants. Ecology 1985, 66, 743–752. [Google Scholar] [CrossRef]
  40. Weiner, J. How competition for light and nutrients affects size variability in Ipomea tricolor populations. Ecology 1986, 67, 1425–1427. [Google Scholar] [CrossRef]
  41. Del Río, M.; Condés, S.; Pretzsch, H. Analyzing size-symmetric vs. size-asymmetric and intra- vs. inter-specific competition in beech (Fagus sylvatica L.) mixed stands. For. Ecol. Manag. 2014, 325, 90–98. [Google Scholar] [CrossRef]
  42. Zhang, J.; Oliver, W.W.; Powers, R.F. Long-term effects of thinning and fertilization on growth of red fir in northeastern California. Can. J. For. Res. 2005, 35, 1285–1293. [Google Scholar] [CrossRef]
  43. Veillette, J.J. Evolution and paleohydrology of glacial Lakes Barlow and Ojibway. Quat. Sci. Rev. 1994, 13, 945–971. [Google Scholar] [CrossRef]
  44. Environment Canada. Available online: http://climat.meteo.gc.ca/climate_normals/index_f.html (accessed on 18 February 2014).
  45. Rowe, J.S. Forest Regions of Canada Publication No. 1300; Environment Canada, Canadian Forest Service: Ottawa, ON, Canada, 1972; p. 172.
  46. Saucier, J.-P.; Robitaille, A.; Grondin, P.; Bergeron, J.-F.; Gosselin, J. Les Régions Écologiques du Québec Méridional (4ème version). Carte à L’échelle de 1/1250000; Ministère des Ressources naturelles et de la Faune du Québec: Québec, Canada, 2011. (In French)
  47. Goudiaby, V.; Brais, S.; Berninger, F.; Schneider, R. Vertical patterns in specific volume increment along stems of dominant jack pine (Pinus banksiana) and black spruce (Picea mariana) after thinning. Can. J. For. Res. 2012, 42, 733–748. [Google Scholar] [CrossRef]
  48. Alemdag, I.S.; Honer, T.G. Metric Relationship between Breast-Height and Stump Diameters for Eleven Tree Species from Eastern and Central Canada; Canadian Forestry Service Information report FMR-X-49M; Forest Management Institute: Ottawa, ON, Canada, 1977; p. 26. [Google Scholar]
  49. Perron, J.-Y. Tarif de Cubage Général—Volume Marchand Brut, 3rd ed.Gouvernement du Québec, Ministère des Ressources Naturelles de la Faune et des Parcs: Québec, QC, Canada, 2003; p. 60. (In French)
  50. Pinheiro, J.; Bates, D.; DebRoy, S.; Sarkar, D.; the R Core team. The Nlme Package. 2008. Available online: http://cran.stat.sfu.ca/ (accessed on 10 October 2014).
  51. R Development Core Team. R: A Language and Environment for Statistical Computing; R Foundation for Statistical Computing: Vienna, Austria, 2014. [Google Scholar]
  52. Sprugel, D.G. Correcting for bias in log-transformed allometric equations. Ecology 1983, 64, 209–210. [Google Scholar] [CrossRef]
  53. Tarroux, E.; DesRochers, A.; Krause, C. Effect of natural root grafting on growth response of jack pine (Pinus banksiana) after commercial thinning. For. Ecol. Manag. 2010, 260, 526–535. [Google Scholar] [CrossRef]
  54. Pape, R. Influence of thinning and tree diameter class on the development of basic density and annual ring width in Picea abies. Scand. J. For. Res. 1999, 14, 27–37. [Google Scholar] [CrossRef]
  55. Aussenac, G.; Granier, A. Effects of thinning on water stress and growth in Douglas-fir. Can. J. For. Res. 1998, 18, 100–105. [Google Scholar] [CrossRef]
  56. Vincent, M.; Krause, C.; Zhang, S.Y. Radial growth response of black spruce roots and stems to commercial thinning in the boreal forest. Forestry 2009, 82, 557–571. [Google Scholar] [CrossRef]
  57. Mäkinen, H.; Isomäki, A. Thinning intensity and growth of Norway spruce stands in Finland. Forestry 2004, 77, 349–364. [Google Scholar] [CrossRef]
  58. Mäkinen, H.; Isomäki, A. Thinning intensity and long-term changes in increment and stem form of Norway spruce trees. For. Ecol. Manag. 2004, 201, 295–309. [Google Scholar] [CrossRef]
  59. Moore, J.A.; Zhang, L.; Newberry, J.D. Effects of intermediate silvicultural treatments on the distribution of within-stand growth. Can. J. For. Res. 1994, 24, 398–404. [Google Scholar] [CrossRef]
  60. Pukkala, T.; Miina, J.; Kellomäki, S. Response to different thinning intensities in young Pinus sylvestris. Scand. J. For. Res. 1998, 13, 141–150. [Google Scholar] [CrossRef]
  61. Mäkinen, H.; Hynynen, J.; Isomäki, A. Intensive management of Scots pine stands in southern Finland: First empirical results and simulated further development. For. Ecol. Manag. 2005, 215, 37–50. [Google Scholar] [CrossRef]
  62. Kuusipalo, J. On the use of tree stand parameters in estimating light conditions below the canopy. Silva Fenn. 1985, 19, 185–196. [Google Scholar] [CrossRef]
  63. Comeau, P. Measuring Light in the Forest; Extension Note 42; Ministry of Forests Research Program: Victoria, BC, Canada, 2000; p. 7.
  64. Hale, S.E. Light regime beneath Sitka spruce plantations in northern Britain: Preliminary results. For. Ecol. Manag. 2001, 151, 61–66. [Google Scholar] [CrossRef]
  65. Carlyle, J.C. Nutrient management in a Pinus radiata plantation after thinning: The effect of thinning and residues on nutrient distribution, mineral nitrogen fluxes, and extractable phosphorus. Can. J. For. Res. 1995, 25, 1278–1291. [Google Scholar] [CrossRef]
  66. Thibodeau, L.; Raymond, P.; Camiré, C.; Munson, A.D. Impact of precommercial thinning in balsam fir stands on soil nitrogen dynamics, microbial biomass, decomposition, and foliar nutrition. Can. J. For. Res. 2000, 30, 229–238. [Google Scholar] [CrossRef]
  67. Pothier, D. Twenty-year results of precommercial thinning in balsam fir stand. For. Ecol. Manag. 2002, 168, 177–186. [Google Scholar] [CrossRef]
  68. Ryan, M.G.; Binkley, D.; Fownes, J.H. Age-related decline in forest productivity: Pattern and process. Adv. Ecol. Res. 1997, 27, 213–262. [Google Scholar]
  69. Skovsgaard, J.P.; Vanclay, J.K. Forest site productivity: A review of the evolution of dendrometric concepts for even-aged stands. Forestry 2008, 81, 13–31. [Google Scholar] [CrossRef]
  70. Kenkel, N.C.; Hoskins, J.A.; Hoskins, W.D. Local competition in a naturally established jack pine stand. Can. J. Bot. 1989, 67, 2630–2635. [Google Scholar] [CrossRef]
  71. Peet, R.K.; Christensen, N.L. Competition and tree death. BioScience 1987, 37, 586–595. [Google Scholar] [CrossRef]
  72. Elfving, B. Natural mortality in thinning and fertilization experiments with pine and spruce in Sweden. For. Ecol. Manag. 2010, 260, 353–360. [Google Scholar] [CrossRef]
  73. Ruel, J.C. Understanding windthrow: Silvicultural implications. For. Chron. 1995, 71, 434–445. [Google Scholar] [CrossRef]
  74. Scott, R.E.; Mitchell, S.J. Empirical modelling of windthrow risk in partially harvested stands using tree, neighbourhood, and stand attributes. For. Ecol. Manag. 2005, 218, 193–209. [Google Scholar] [CrossRef]
  75. Mason, W.L.; Kerr, G. Transforming Even-Aged Conifer Stands to Continuous Cover Management; Information note 40; Forestry Commission: Edinburgh, UK, 2001.
  76. Helmisaari, H.S.; Hanssen, K.H.; Jacobson, S.; Kukkola, M.; Luiro, J.; Saarsalmi, A.; Tamminen, P.; Tveite, B. Logging residue removal after thinning in Nordic boreal forests: Long-term impact on tree growth. For. Ecol. Manag. 2011, 261, 1919–1927. [Google Scholar] [CrossRef]
  77. Del Rio, M.; Calama, R.; Canellas, I.; Roig, S.; Montero, G. Thinning intensity and growth response in SW-European Scots pine stands. Ann. For. Sci. 2008, 65, 308. [Google Scholar] [CrossRef]
  78. Assmann, E. The Principles of Forest Yield Study; Pergamon Press: Oxford, UK, 1970. [Google Scholar]

