Next Article in Journal
Seasonal Water Relations and Leaf Temperature in a Deciduous Dipterocarp Forest in Northeastern Thailand
Previous Article in Journal
Pine Nuts: A Review of Recent Sanitary Conditions and Market Development
 
 
Correction to Forests 2017, 8(3), 85.
Correction

Correction: Schelfhout, S.; et al. Tree Species Identity Shapes Earthworm Communities. Forests 2017, 8, 85

1
Department of Applied Biosciences, Faculty of Bioscience Engineering, Ghent University, Valentin Vaerwyckweg 1, 9000 Gent, Belgium
2
Forest & Nature Lab, Department of Forest and Water Management, Faculty of Bioscience Engineering, Geraardsbergsesteenweg 267, 9090 Gontrode, Belgium
3
Department of Geosciences and Natural Resource Management, University of Copenhagen, Rolighedsvej 23, DK-1958 Frederiksberg C, Denmark
4
Division of Forest, Nature and Landscape, Department of Earth & Environmental Sciences, KU Leuven, Celestijnenlaan 200 E, Box 2411, 3001 Leuven, Belgium
5
Faculty of Science and Technology, University College Ghent, Brusselsesteenweg 161, 9090 Melle, Belgium
*
Author to whom correspondence should be addressed.
Forests 2017, 8(10), 366; https://doi.org/10.3390/f8100366
Submission received: 14 September 2017 / Revised: 22 September 2017 / Accepted: 22 September 2017 / Published: 27 September 2017
It has come to our attention that there was a mistake in this paper [1]: namely, the units of soil cations K+, Na+, Mg2+, Ca2+ and Al3+ were written in mg·g−1 while they should have been in µg·g−1.
This mistake occurs in Table 1 on page 3 and Table A3 and Table A4 on page 15; and, in Figure 4a and Figure 5a–c on page 10 and Figure A1a–f on page 16.
Further, this correction is also needed in the following two lines: The line on page 11 “For the anecic species, A. longa was only scarcely present when soil Al concentrations were higher than 50 mg·g−1” should be “For the anecic species, A. longa was only scarcely present when soil Al concentrations were higher than 50 µg·g−1”; and, the line on page 11 “In our study, burrowing earthworm communities (endogeic and anecic species) appeared to be abundant when exchangeable soil Al concentrations were lower than 100 mg·g−1, and soil pH-KCl values were higher than about 4.” should be “In our study, burrowing earthworm communities (endogeic and anecic species) appeared to be abundant when exchangeable soil Al concentrations were lower than 100 µg·g−1, and soil pH-KCl values were higher than about 4.”
The authors would like to apologize for any inconvenience caused. The change does not affect the scientific results.
Here, we supply the corrected Tables and Figures.

Reference

  1. Schelfhout, S.; Mertens, J.; Verheyen, K.; Vesterdal, L.; Baeten, L.; Muys, B.; De Schrijver, A. Tree species identity shapes earthworm communities. Forests 2017, 8, 85. [Google Scholar] [CrossRef]
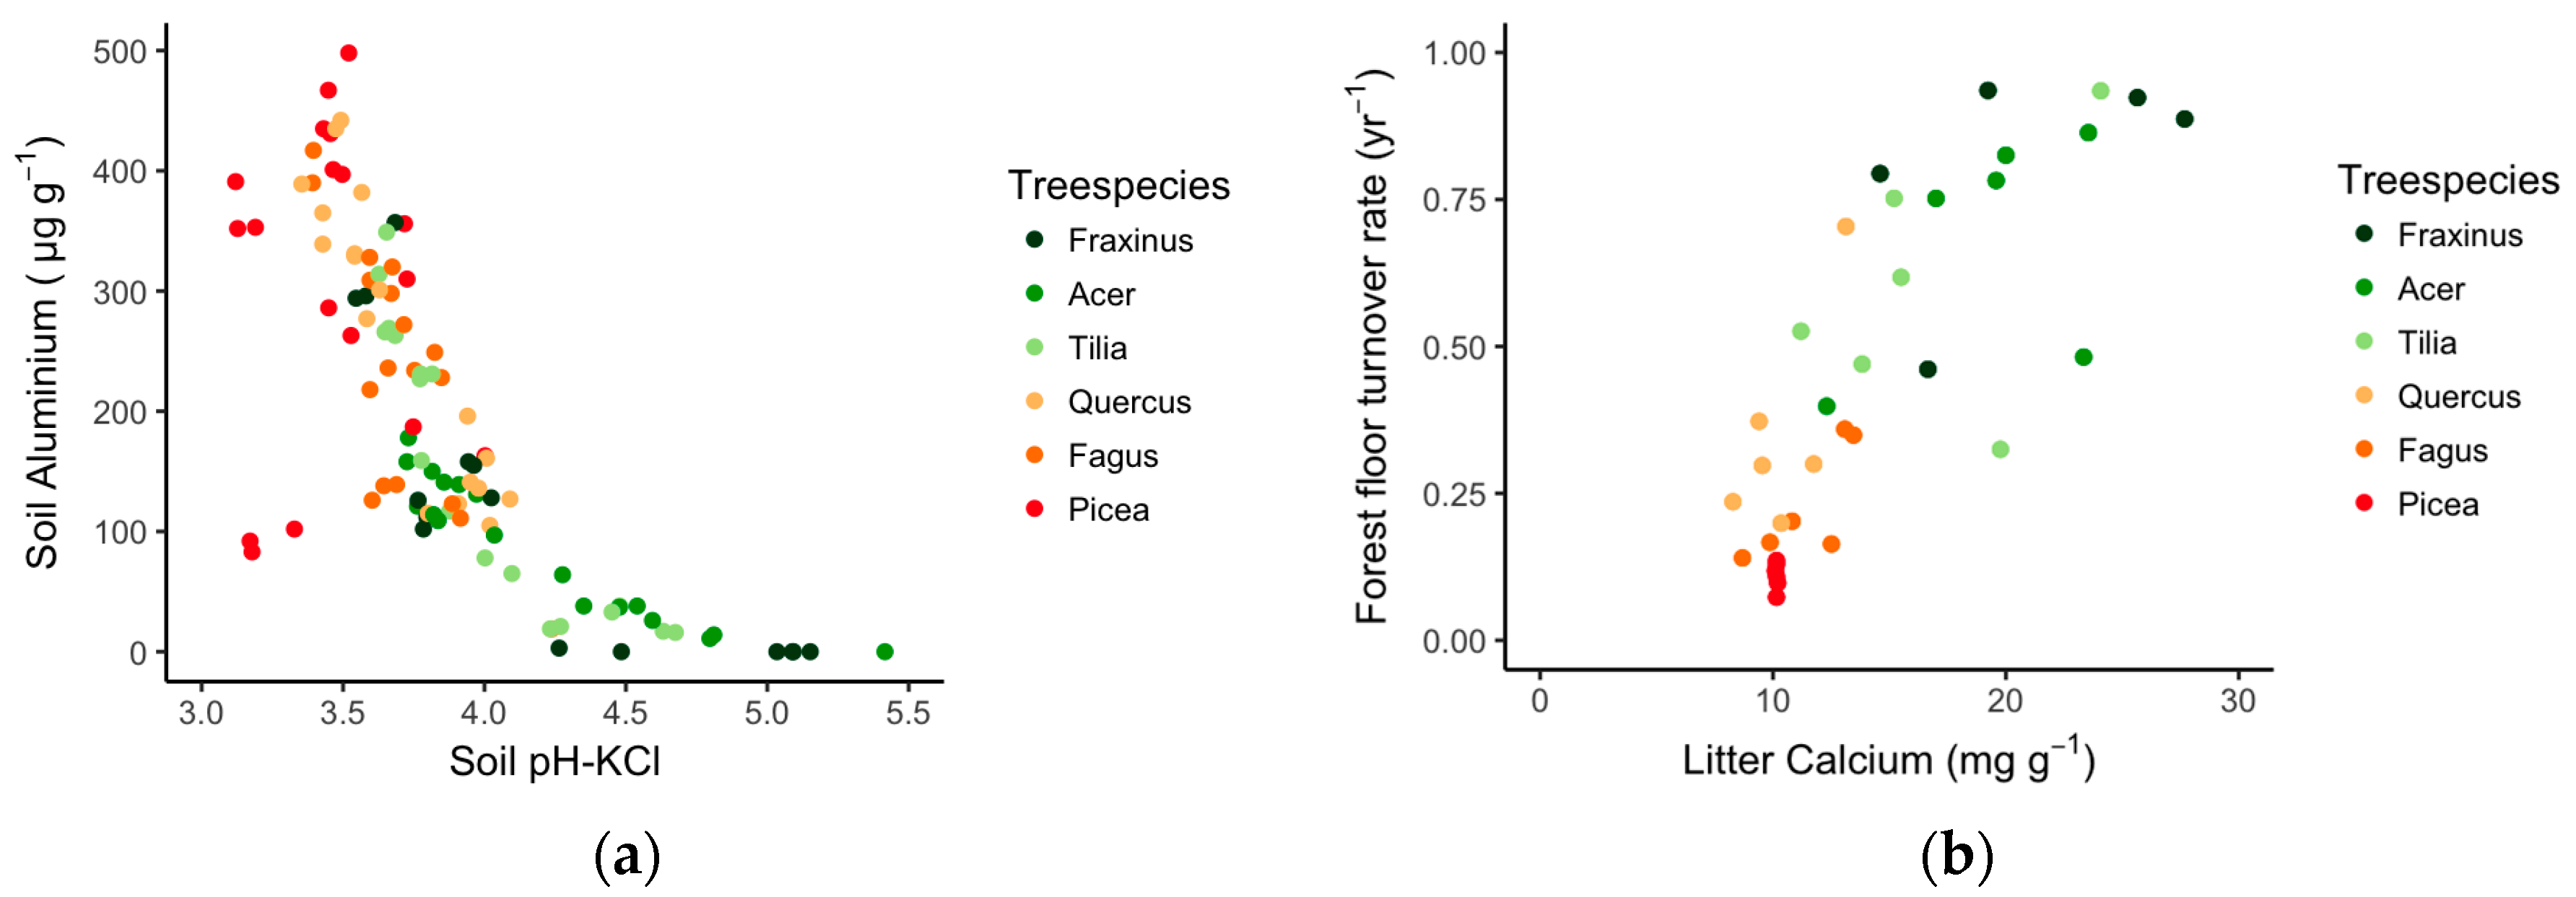
Figure 4. Relation between pH-KCl and exchangeable Al concentration in the 0–5 cm soil layer ((a) n = 105); In (b), the relation between Ca concentration in foliar litter and the forest floor turnover rate (n = 35) is shown. The points are colored according to the tree species. The foliar litter Ca concentration was previously published by Vesterdal et al. [36].
Forests 08 00366 g001
Figure 5. Relation between exchangeable Al concentration in the 0–5 cm soil layer (ac) or Ca concentration in foliar litter (df); and density of anecic (a,d); endogeic (b,e); and epigeic (c,f) earthworms. Plots where zero earthworms were found are indicated by a cross symbol. The foliar litter Ca concentration was previously published by Vesterdal et al. [36].
Forests 08 00366 g002aForests 08 00366 g002b
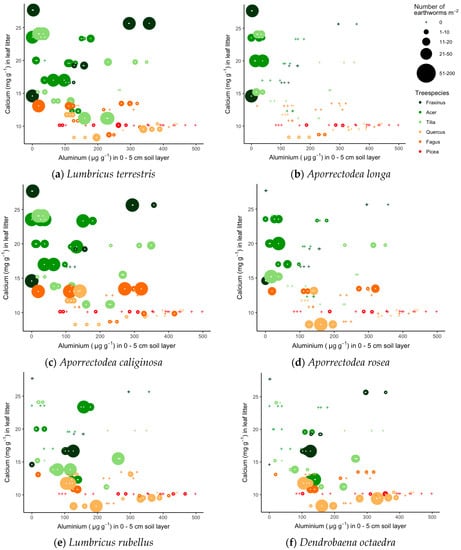
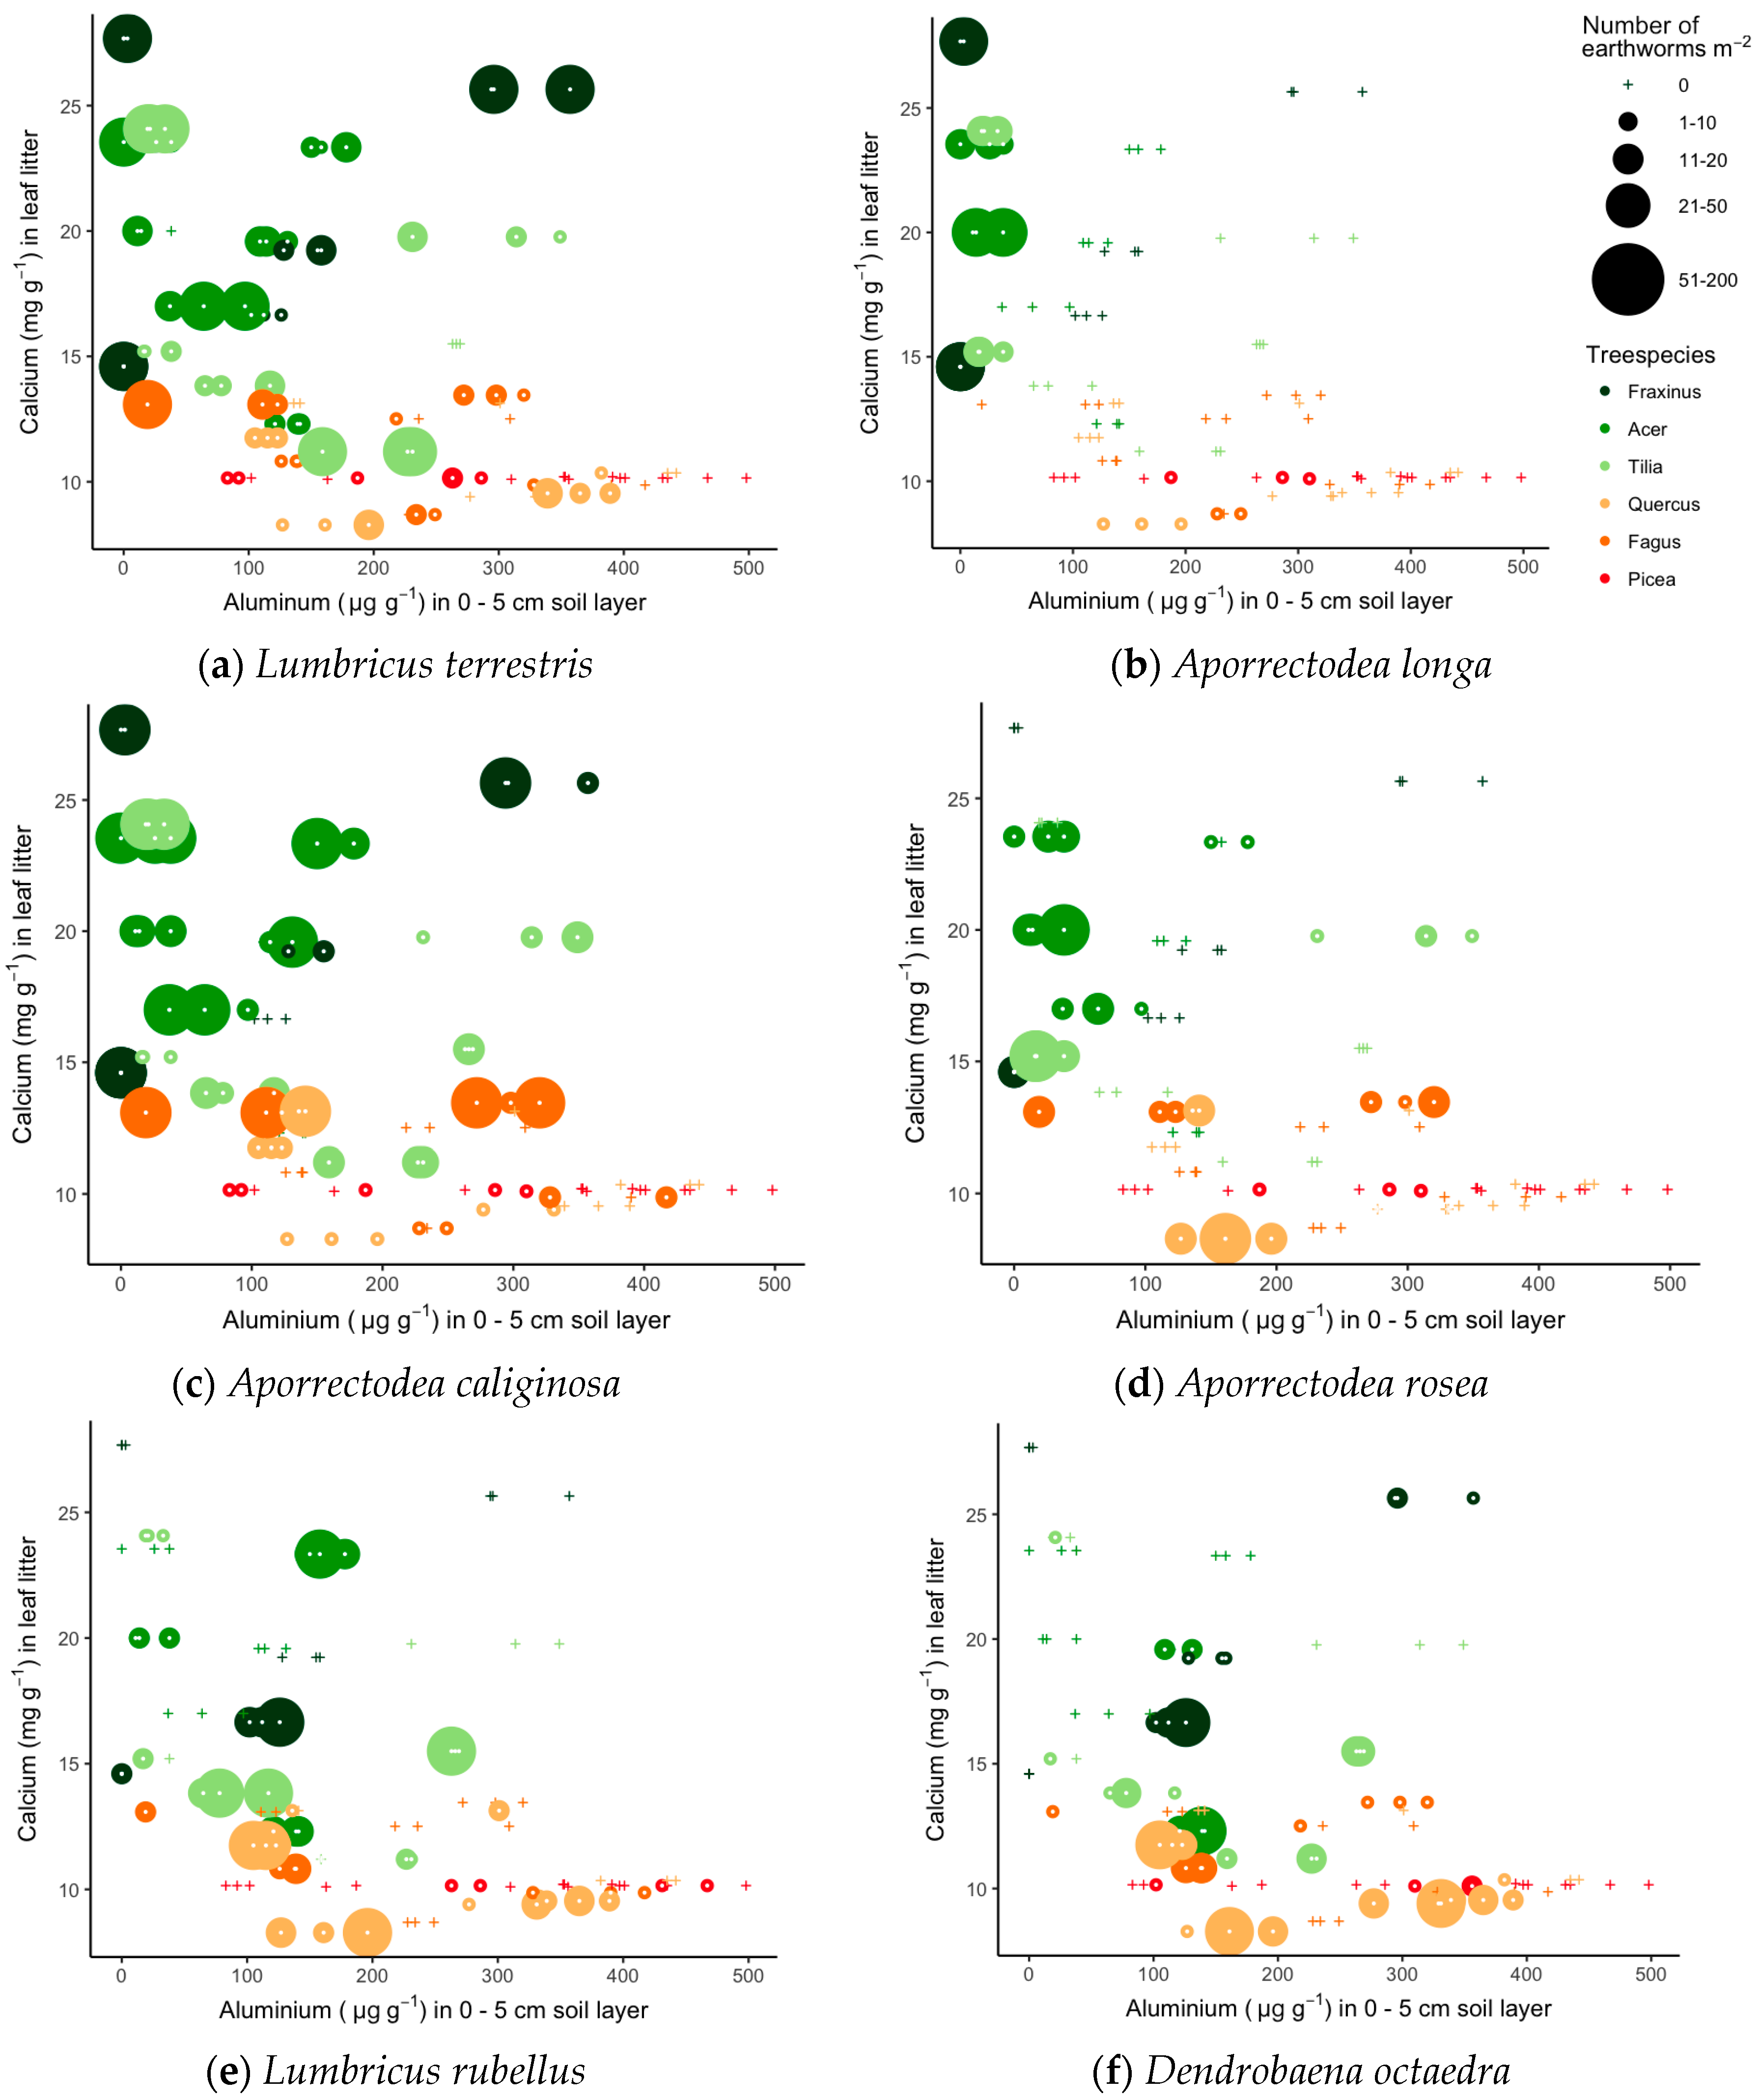
Figure A1. The density of the most common earthworm species (anecic: L. terrestris (a) and A. longa (b); endogeic: A. caliginosa (c); A. rosea (d); and epigeic: L. rubellus (e) and D. octaedra (f)) in relation with exchangeable soil Al concentration and Ca concentration in litter. Earthworm density is shown by the size of the circles; a cross symbol indicates plots where no earthworms were found. The color of the circle indicates the tree species. The foliar litter Ca concentration was previously published by Vesterdal et al. [36].
Forests 08 00366 g003
Table 1. Mean and standard deviation of topsoil (0–5 cm) properties for each tree species across all six common gardens. Significant differences between tree species are indicated with letters, means with the same letter are not significantly different (Tukey post-hoc tests on linear mixed-effects (LME) models, 1|Site).
Tree Species
Soil Variables (0–5 cm)f-ValuepFraxinusAcerTiliaQuercusFagusPicea
Moisture (%)1475<0.00114 ± 5 c15 ± 4 c12 ± 3 b13 ± 4 bc12 ± 4 b9 ± 2 a
pH-KCl325<0.0014.2 ± 0.6 c4.2 ± 0.5 c4.0 ± 0.4 c3.7 ± 0.3 b3.7 ± 0.2 b3.5 ± 0.2 a
Base saturation (%)108<0.00173 ± 28 b78 ± 24 b71 ± 20 b49 ± 20 a49 ± 21 a41 ± 19 a
K+ in BaCl2 (µg·g−1)50<0.001100 ± 88 b,c114 ± 91 c91 ± 56 bc85 ± 57 bc67 ± 42 ab41 ± 22 a
Na+ in BaCl2 (µg·g−1)28<0.00119 ± 16 a17 ± 11 a15 ± 8 a13 ± 7 a13 ± 7 a38 ± 48 b
Mg2+ in BaCl2 (µg·g−1)48<0.001139 ± 106 c108 ± 72 bc81 ± 39 ab68 ± 53 a49 ± 32 a57 ± 41 a
Ca2+ in BaCl2 (µg·g−1)42<0.0011241 ± 1020 c1050 ± 690 bc796 ± 437 ab481 ± 388 a446 ± 293 a467 ± 351 a
Al3+ in BaCl2 (µg·g−1)42<0.001115 ± 121 a87 ± 58 a151 ± 118 a261 ± 121 bc231 ± 105 b309 ± 133 c
Table A3. Mean and standard deviation of the deeper soil (5–15 cm) properties for each tree species across all six common gardens. Significant differences according to the Tukey post-hoc test between tree species are indicated with letters, means with the same letter are not significantly different (Tukey post-hoc tests on LME models, 1|Site).
Tree Species
Soil Variables (15–30 cm)f-ValuepFraxinusAcerTiliaQuercusFagusPicea
pH-KCl275<0.0014.2 ± 0.58 c4 ± 0.37 bc3.9 ± 0.28 ab3.8 ± 0.27 a3.8 ± 0.17 a3.7 ± 0.26 a
Base saturation (%)10<0.00160 ± 36 bc60 ± 30 c43 ± 27 ab35 ± 28 a36 ± 26 a41 ± 32 a
K in BaCl2 (µg·K·g−1)28<0.00138 ± 17 b54 ± 57 b43 ± 35 b46 ± 34 b36 ± 23 b28 ± 20 a
Na in BaCl2 (µg·Na·g−1)26<0.00117 ± 19 a13 ± 9 a10 ± 5 a9 ± 7 a11 ± 6 a37 ± 47 b
Mg in BaCl2 (µg·Mg·g−1)16<0.00177 ± 81 b61 ± 61 b33 ± 26 a38 ± 42 ab29 ± 25 a53 ± 45 ab
Ca in BaCl2 (µg·Ca·g−1)18<0.001954 ± 1049 b659 ± 603 b375 ± 358 ab357 ± 433 a312 ± 288 a482 ± 481 a
Al in BaCl2 (µg·Al·g−1)57<0.001133 ± 131 a136 ± 87 ab211 ± 118 bc262 ± 133 c232 ± 103 bc248 ± 136 bc
Table A4. Mean and standard deviation of the deeper soil (15–30 cm) properties for each tree species across all six common gardens. Significant differences according to the Tukey post-hoc test between tree species are indicated with letters, means with the same letter are not significantly different (Tukey post-hoc tests on LME models, 1|Site).
Tree Species
Soil Variables (15–30 cm)f-ValuepFraxinusAcerTiliaQuercusFagusPicea
pH-KCl236<0.0014.4 ± 0.57 b4.2 ± 0.37 ab4.0 ± 0.31 a4.1 ± 0.4 ab4.1 ± 0.43 ab4.1 ± 0.37 ab
Base saturation (%)4.0<0.00560 ± 3855 ± 3339 ± 3346 ± 3351 ± 3551 ± 39
K in BaCl2 (µg·K·g−1)13<0.00129 ± 2132 ± 3829 ± 2634 ± 2927 ± 2426 ± 22
Na in BaCl2 (µg·Na·g−1)17<0.00117 ± 20 a12 ± 7 a9,0 ± 5,4 a10 ± 9,5 a13 ± 8,7 a42 ± 58 b
Mg in BaCl2 (µg·Mg·g−1)8.7<0.00176 ± 94 b47 ± 59 ab28 ± 33 a51 ± 60 ab43 ± 44 ab58 ± 55 ab
Ca in BaCl2 (µg·Ca·g−1)13<0.0011109 ± 1252 b590 ± 694 ab339 ± 402 a522 ± 628 a527 ± 524 ab692 ± 733 ab
Al in BaCl2 (µg·Al·g−1)37<0.001115 ± 113128 ± 86175 ± 105175 ± 117149 ± 97149 ± 113