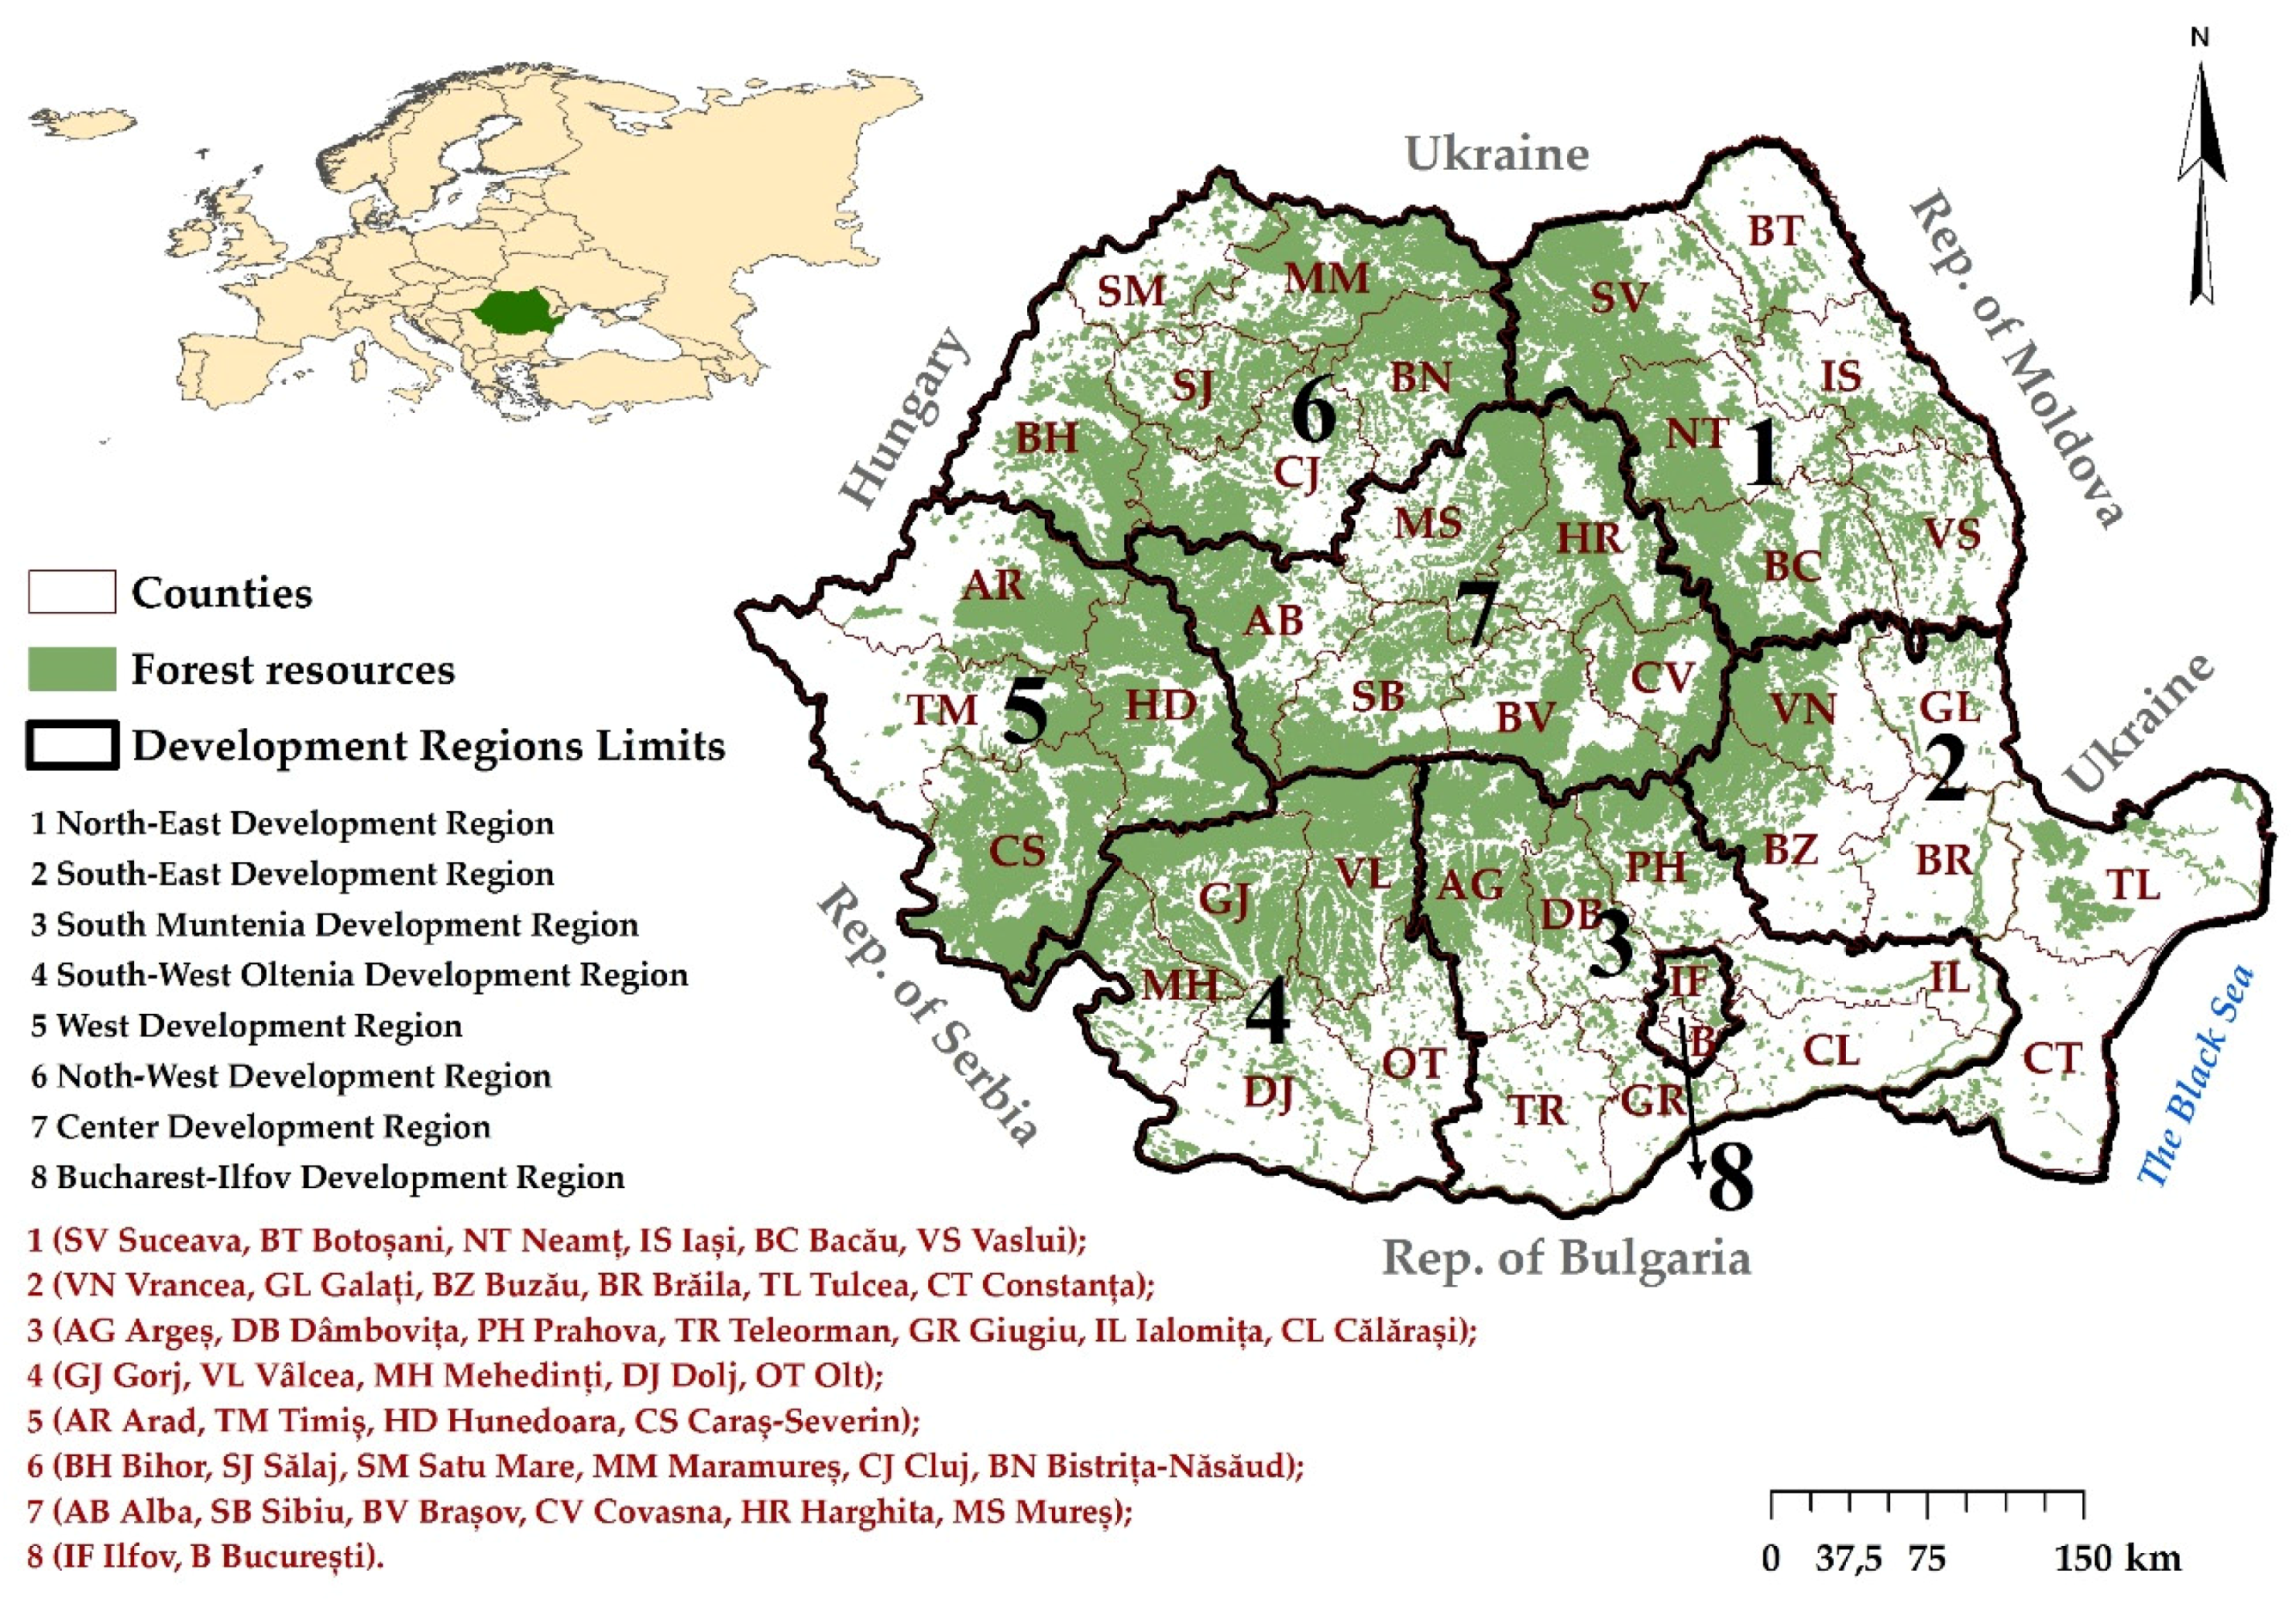
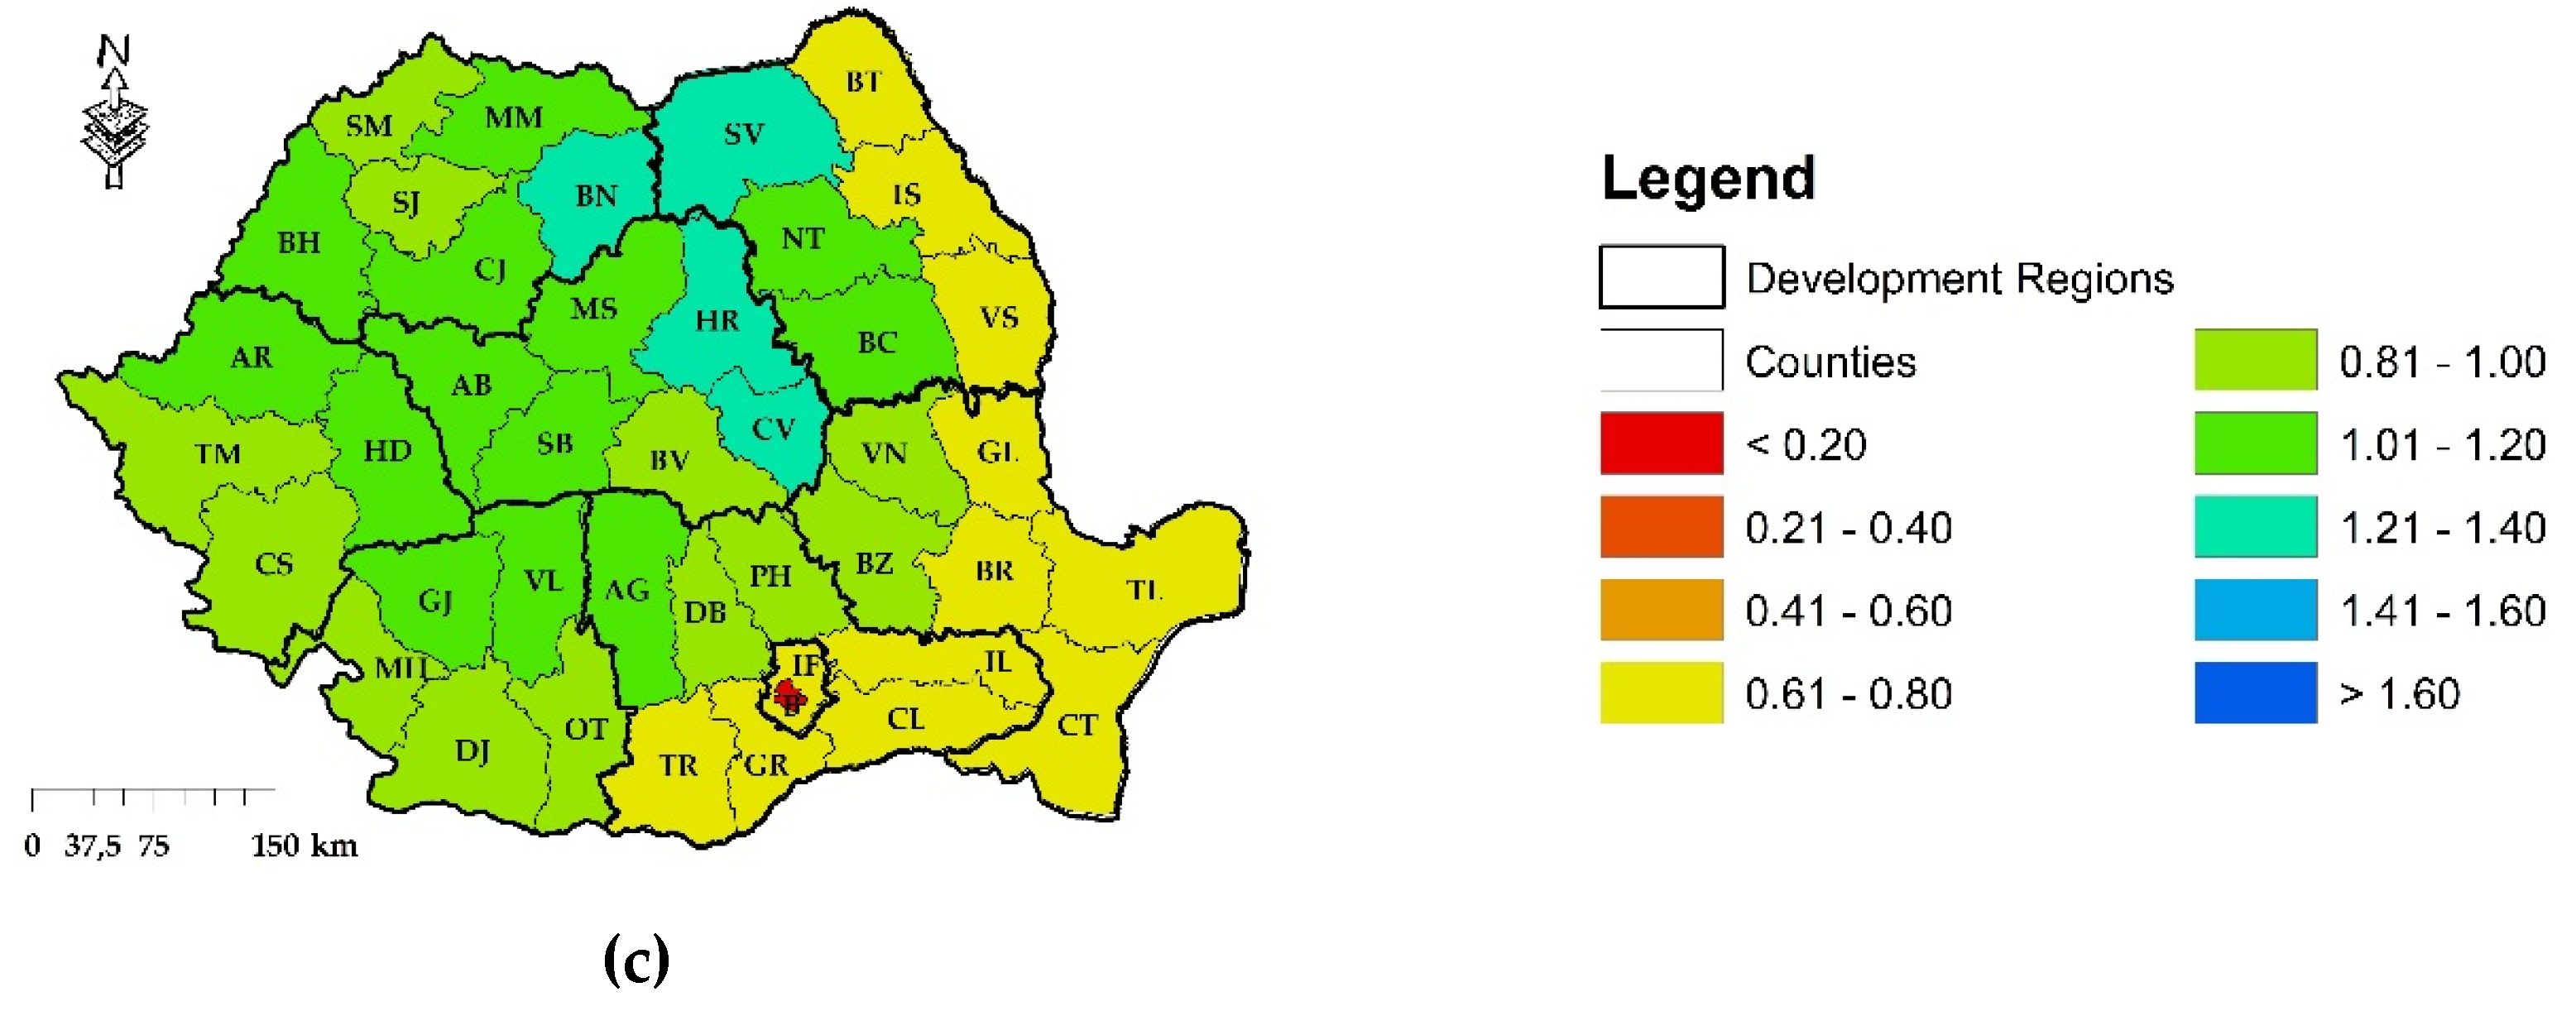
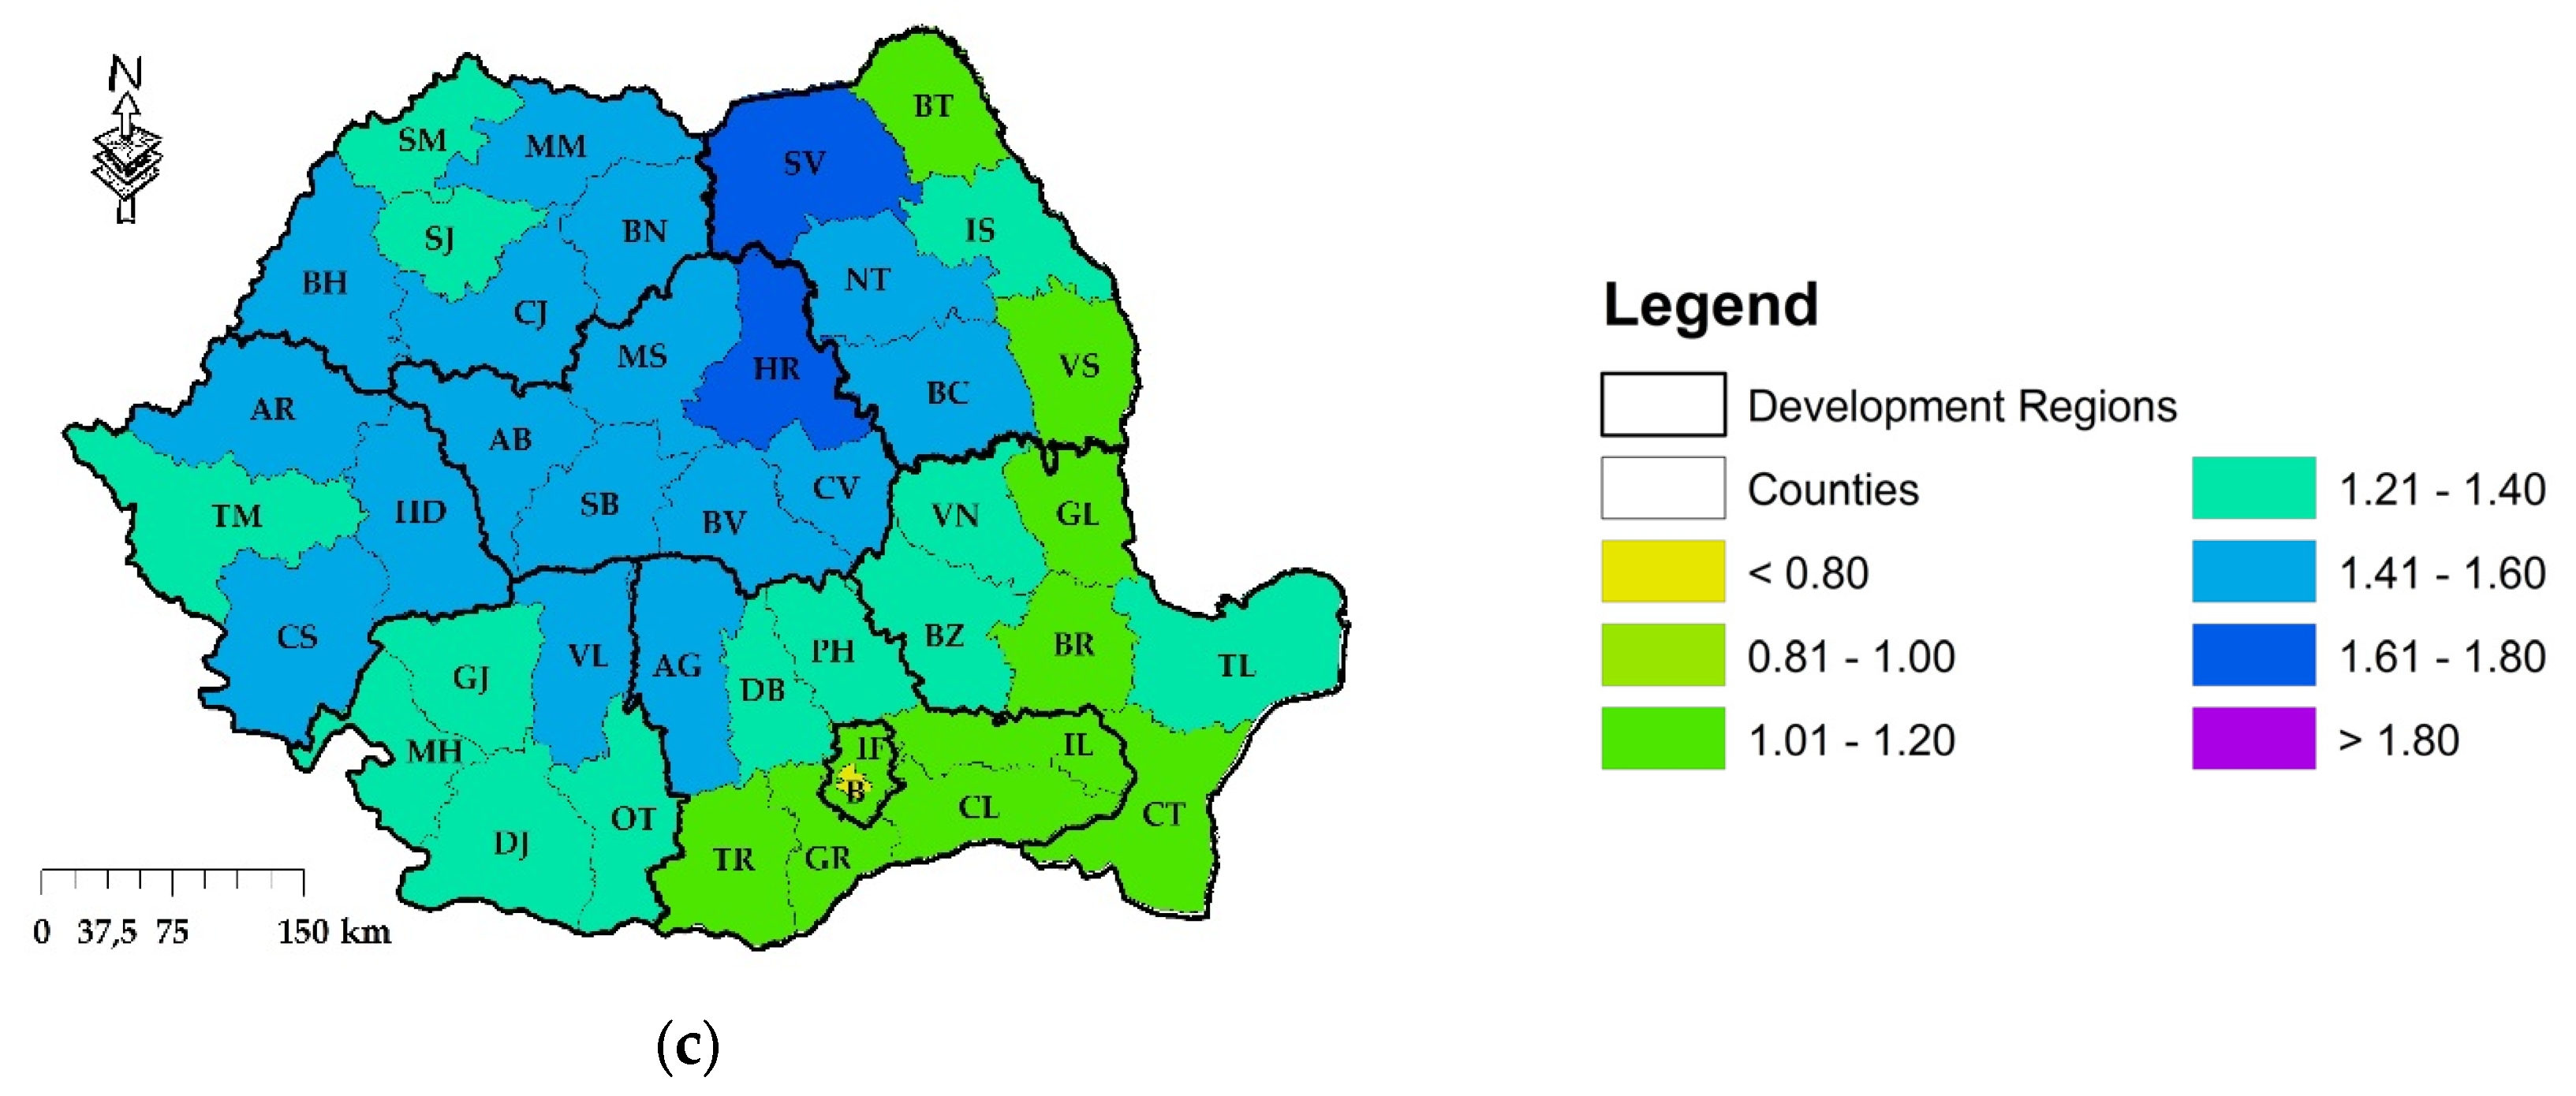
2.1. Study Area
This study includes eight administrative regions (development regions; DRs) in Romania, namely, North-East, South-East, South Muntenia, South-West Oltenia, West, North-West, Center and Bucharest-Ilfov DRs (
Figure 1).
The development regions of Romania were established in 1998 to facilitate the effective regional coordination in Romania following the European Union (EU) accession. According to the law 315/2004, development regions are not administrative-territorial units and are therefore not legal entities of the counties, thus posing challenges to forest management [
39]. Forest cover in Romania of 63,990 km
2 includes beech (
Fagus sylvatica), fir (
Abies alba), spruce
(Picea abies), oak
(Quercus robur), ash
(Fraxinus excelsior) and pine
(Pinus) [
40]. The largest forest area of 51.9% is in the Carpathian Mountains (formed by coniferous and deciduous species) followed by 37.2% in the hills (the Subcarpathians, the Getic Plateau, the Transylvanian Plateau, the Western Hills) and 10.9% in the plains (the West Plain and the Romanian Plain). Forest exploitations in Romania is in continuous growth in the Carpathian Mountains and in the hilly areas [
20]. The most deforested areas are in the Eastern Carpathians (counties Suceava (SV), Maramureș (MM), Harghita (HR), Covasna (CV), Vrancea (VN)) and in the Southern Carpathians (counties Argeș (AG), Vâlcea (VL), Hunedoara (HD)).
The development regions with the most intense deforestation are the regions with the largest forest areas, characterized by a mountain relief and high hills: North-East Region (599.31 km²), Center Region (581.19 km²) and North-West Region (505.04 km²). The regions with the lowest forest cover, dominated by low hills and plains, are generally less deforested (the West Region (194.57 km²), South Region (139.71 km²), South-East Region (98.39 km²) and Bucharest-Ilfov Region (3.16 km²) [
40]. The most intense deforestation has occurred in North-East and North-West Regions (deforestation rates of 4.8% and 3.9% respectively), followed by the Center Region (3.9%), South Region (2.5%), South-West Region (1.5%), West Region (1.4%), South-East Region (1.4%) and Bucharest-Ilfov Region (1.2%) [
36].
The analysis was conducted at the level of development regions because of the pronounced differences in the way forest resources have been managed between regions which in turn reflected the levels of deforestation and reforestation.
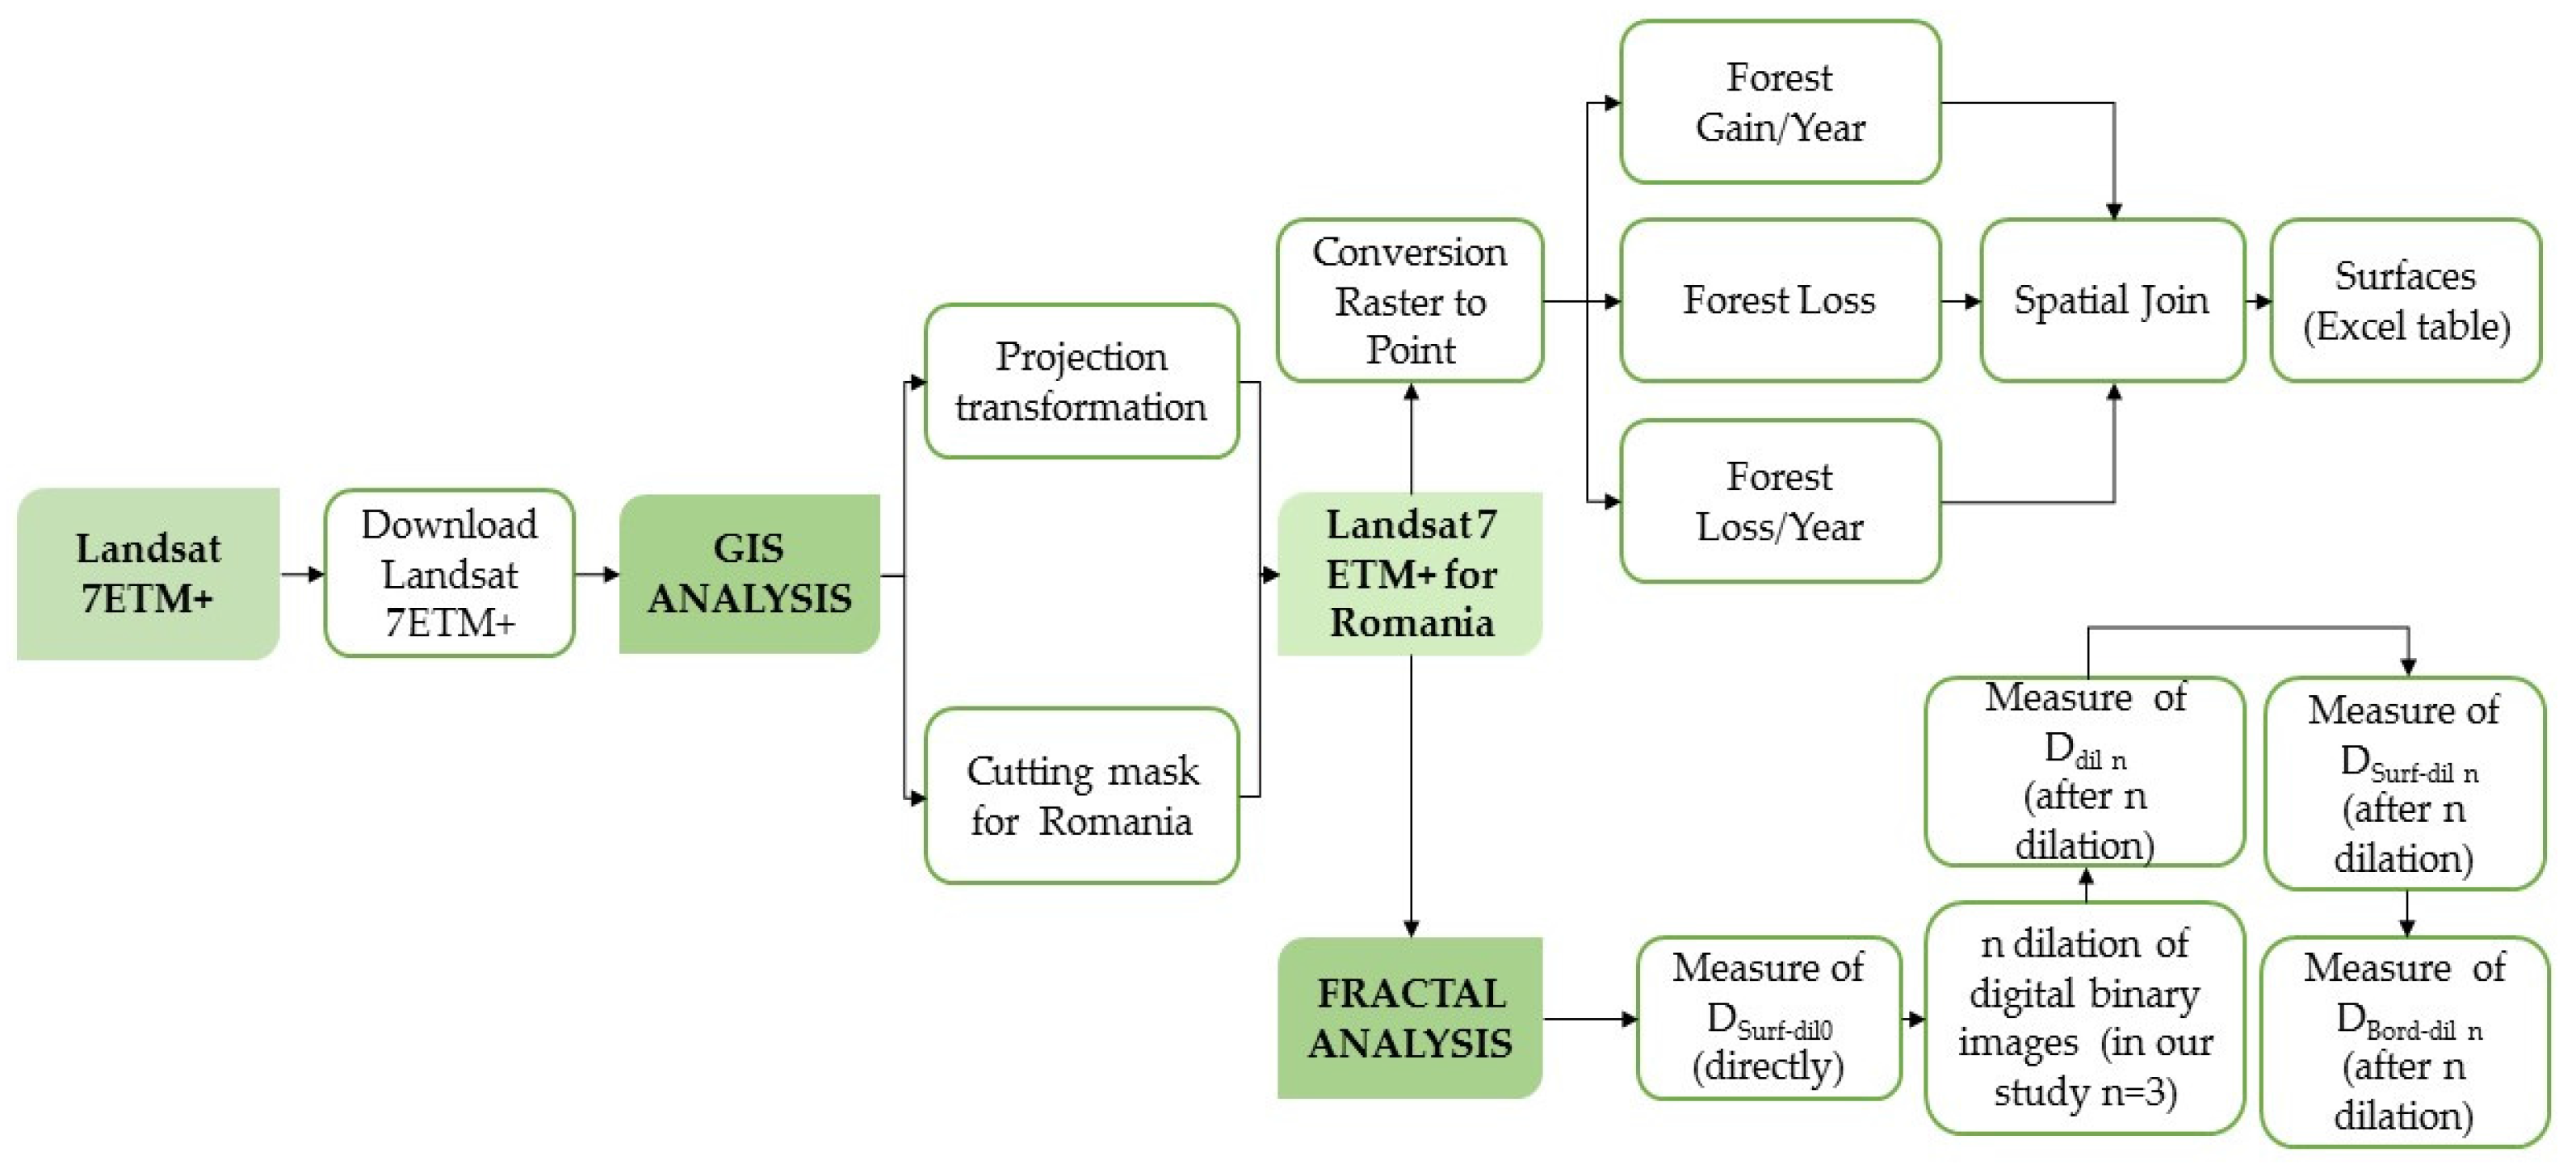
2.3. Fractal Analysis
We conducted a fractal analysis of the digital binarized images of the forest area evolution affected by deforestation and reforestation for eight DRs. Fractal analysis was conducted because of the ability to provide additional textural information on the effects incurred by deforestation which provides complementary information on forest disturbance as compared to traditional per-pixel forest disturbance analysis. Fractalyse 2.4. software (Research Centre ThéMA, University of Franche-Comté, Besançon, France) was employed for fractal analysis [
43,
44].
The box-counting dimension was used for determining the fractal dimension of the forest areas (DSurf-dil0), the fractal dimension of the dilated forest areas (DSurf-dil3) and the fractal dimension of the border of the dilated forest areas (DBord-dil3). This is the most used method to estimate fractal dimensions. The image is covered by a quadratic grid and the grid size ε is varied. For each value ε, the number of squares N(ε) containing any black pixels are counted. In Fractalyse 2.4, grids of different sizes are overlaid on a two-dimensional black and white image of forest areas and the number of black cells is counted for each grid size. The black cells represent the forest areas while the white ones indicate an absence of forest areas. A double logarithmic plot of N(ε), the number of occupied cells versus 1/ε is drawn and subsequently the slope of a linear regression gives an estimate of the box dimension.
The mathematical formula used for the calculation of the box counting fractal dimension was:
where
DB-C is the box-counting fractal dimension,
ε is the side length of the box, and
N(
ε) is the number of non-overlapping and contiguous boxes of side
ε required to cover the area of the fractal object [
40,
45]. As the zero limits cannot be applied to digital images,
DB-C was estimated by means of the equation:
where
d is the slope of the graph log (
N(
ε)) against log (1/
ε) [
45].
The box-counting algorithm cannot offer a perfect coverage of a fractal pattern, so the number of occupied boxes is approximative. Hence, the estimation of the box-counting dimension requires a sufficient number of levels of analysis [
43] but also the largest possible range of box sizes [
46].
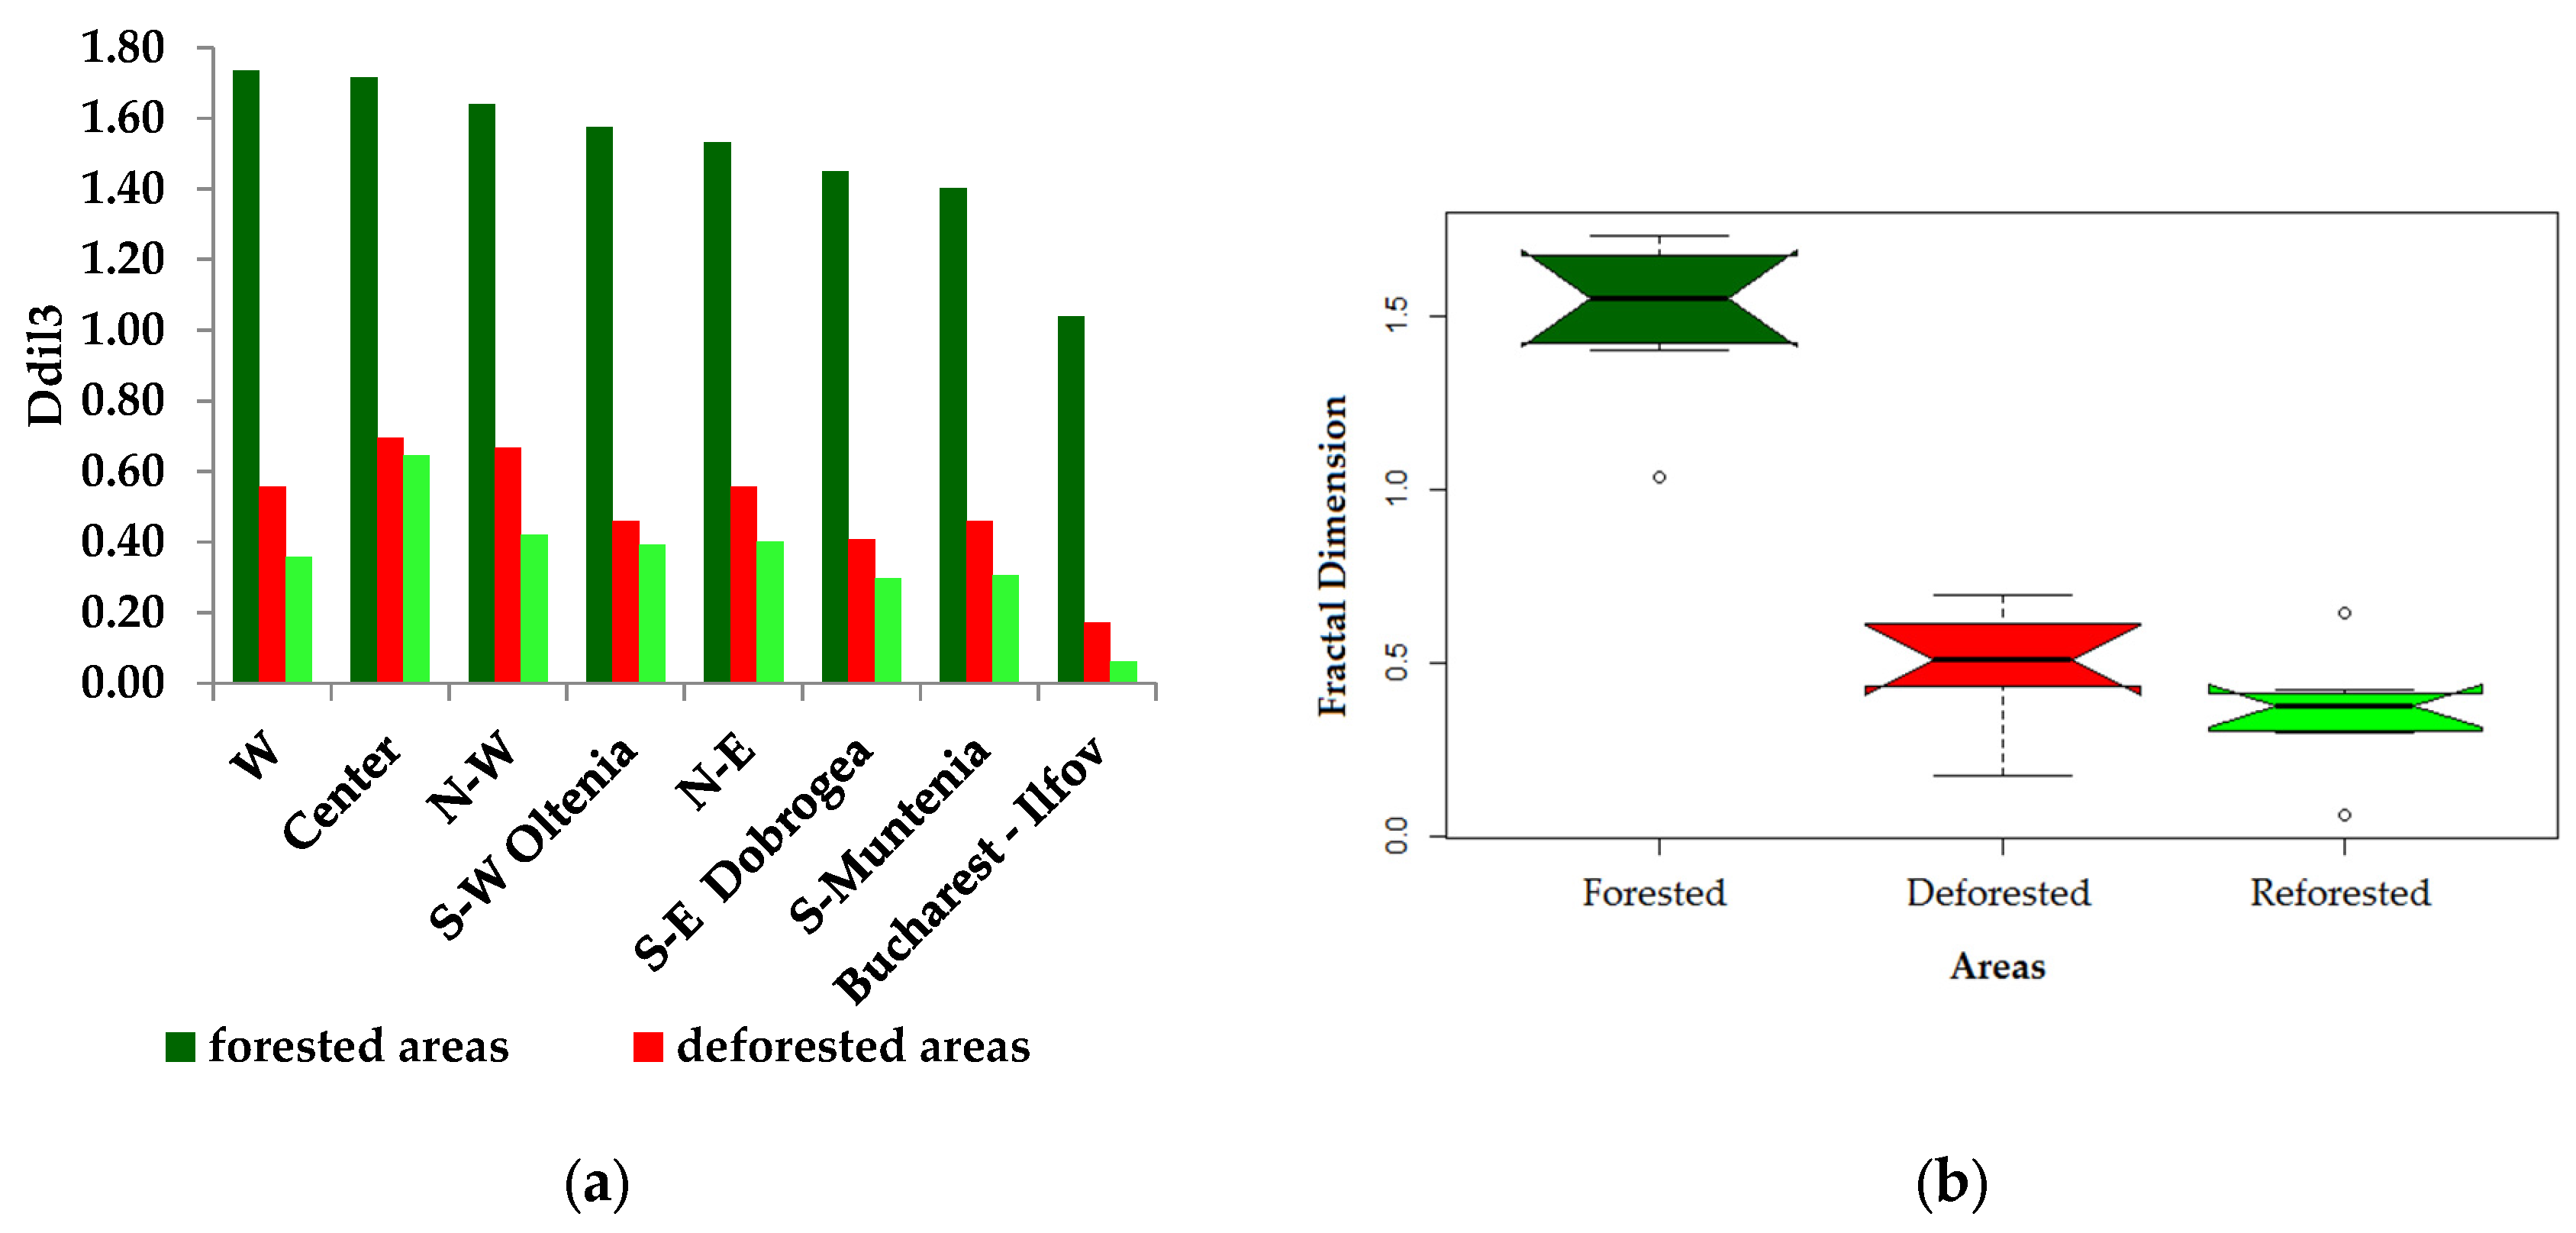
Four fractal dimensions were considered in this study: the fractal box-counting dimension of the forest areas (D
Surf-dil0), the fractal box-counting dimension of the dilated forest areas (D
Surf-dil3), the dilation fractal dimension (D
dil3) and the fractal box-counting dimension of the border of the dilated forest areas (D
Bord-dil3). We analyzed D
Surf-dil3, D
dil3 and D
Bord-dil3 to determine whether large variation in the fractal dimension was a resultof a transition from the fractal organization with a lot of free spaces (D
Surf-dil0) to another organization with less free spaces or a more compact organization (D
Surf-dil3) (
Figure 2).
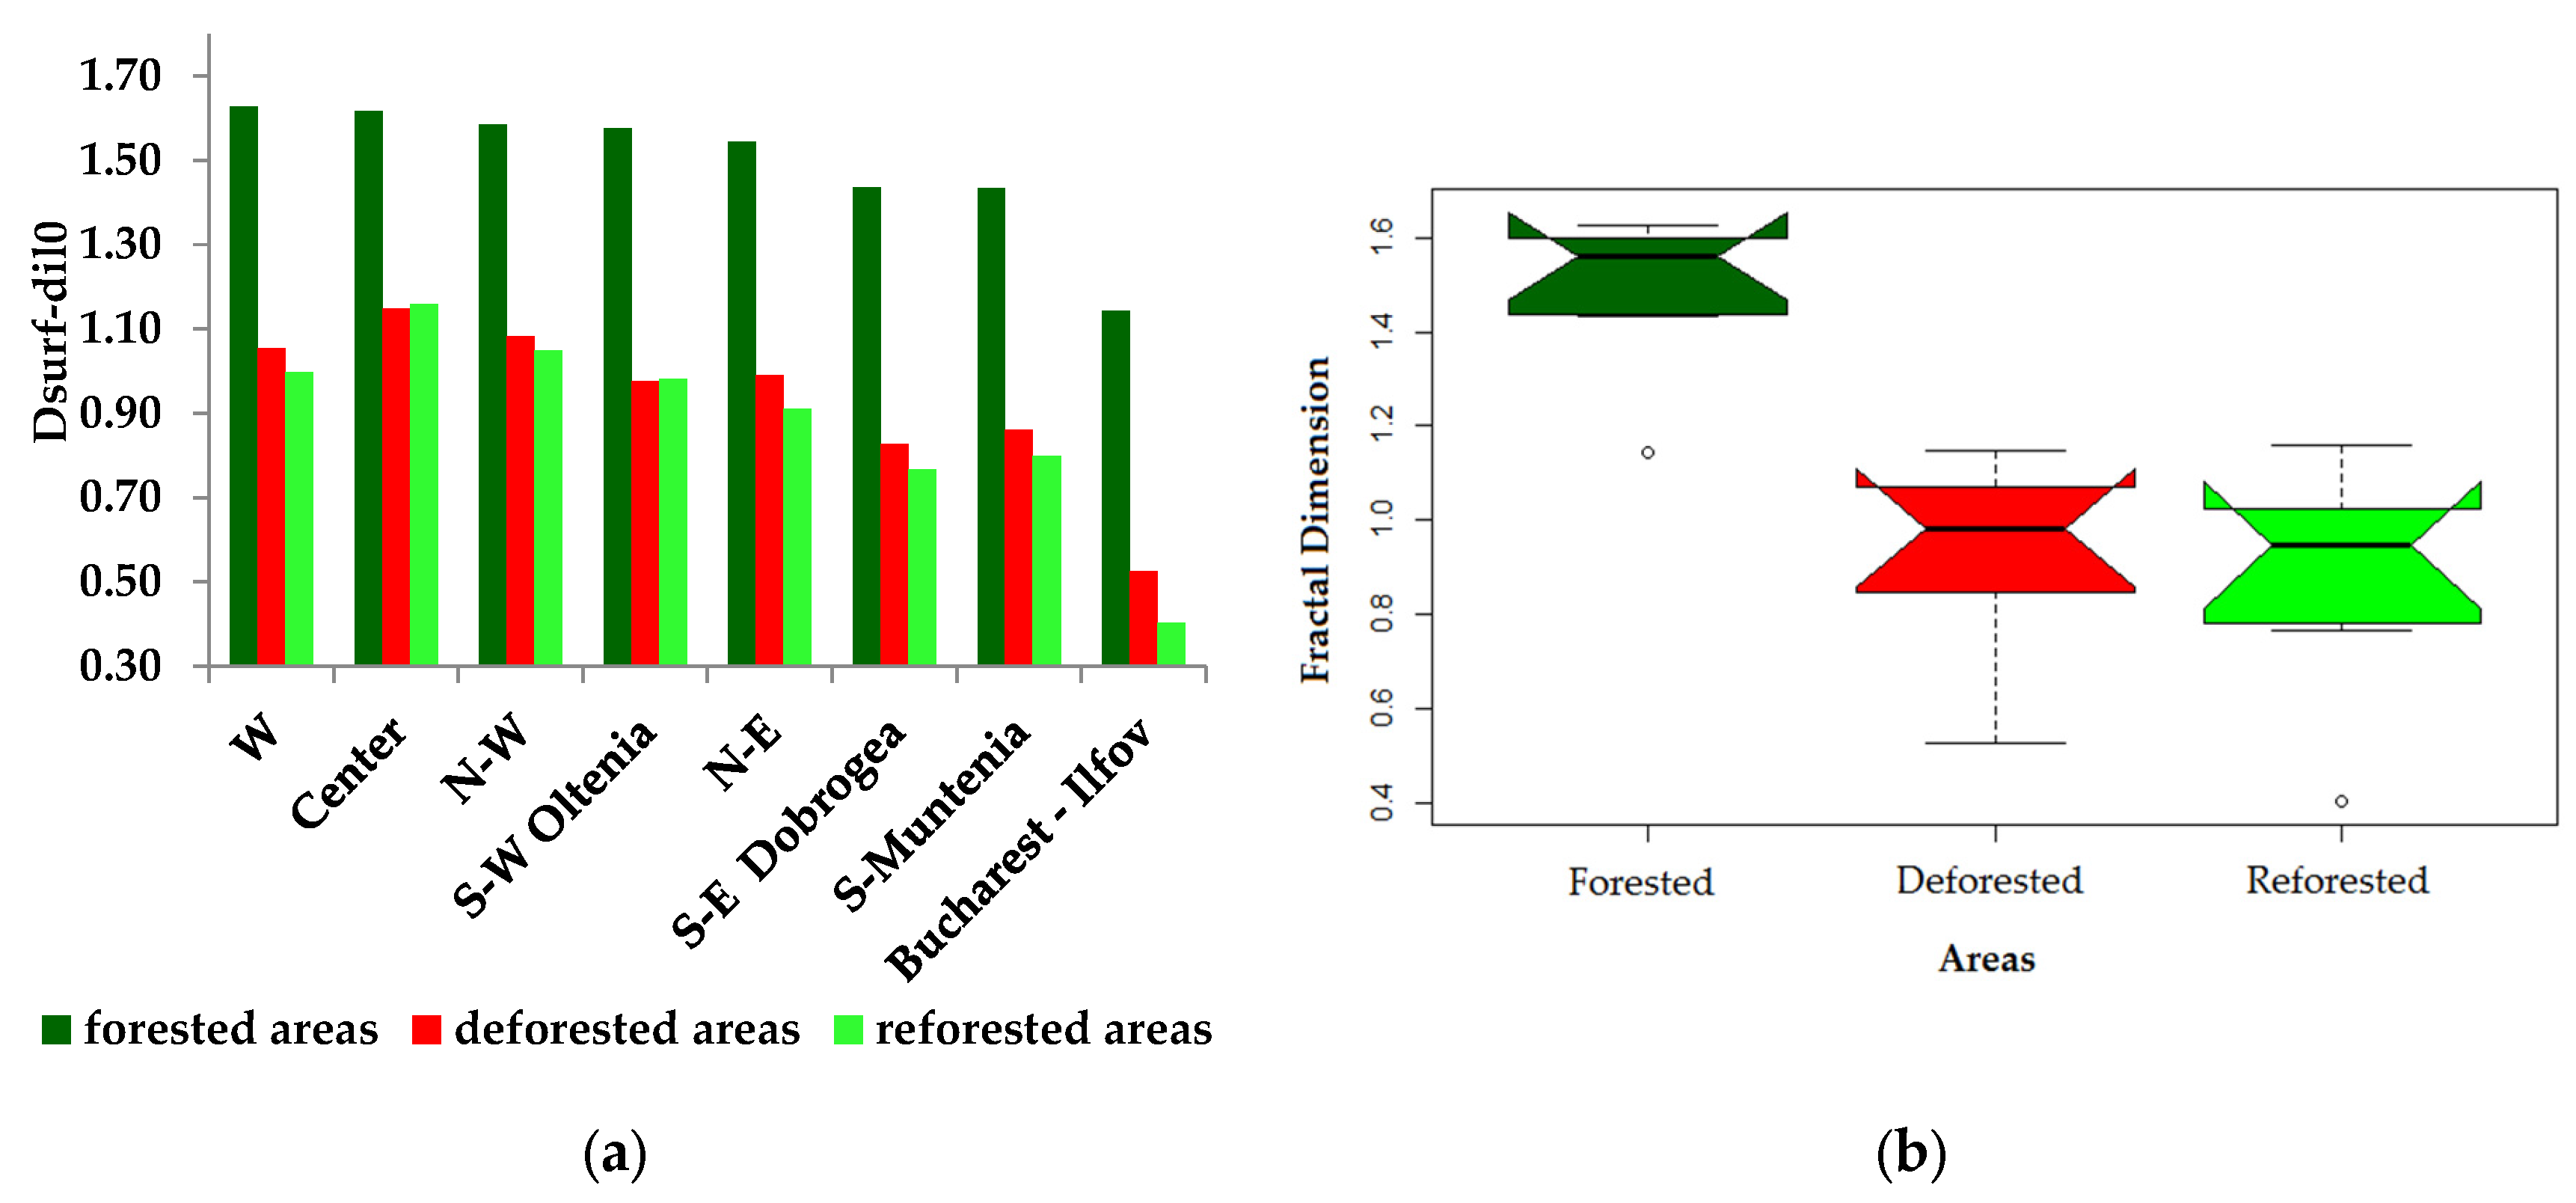
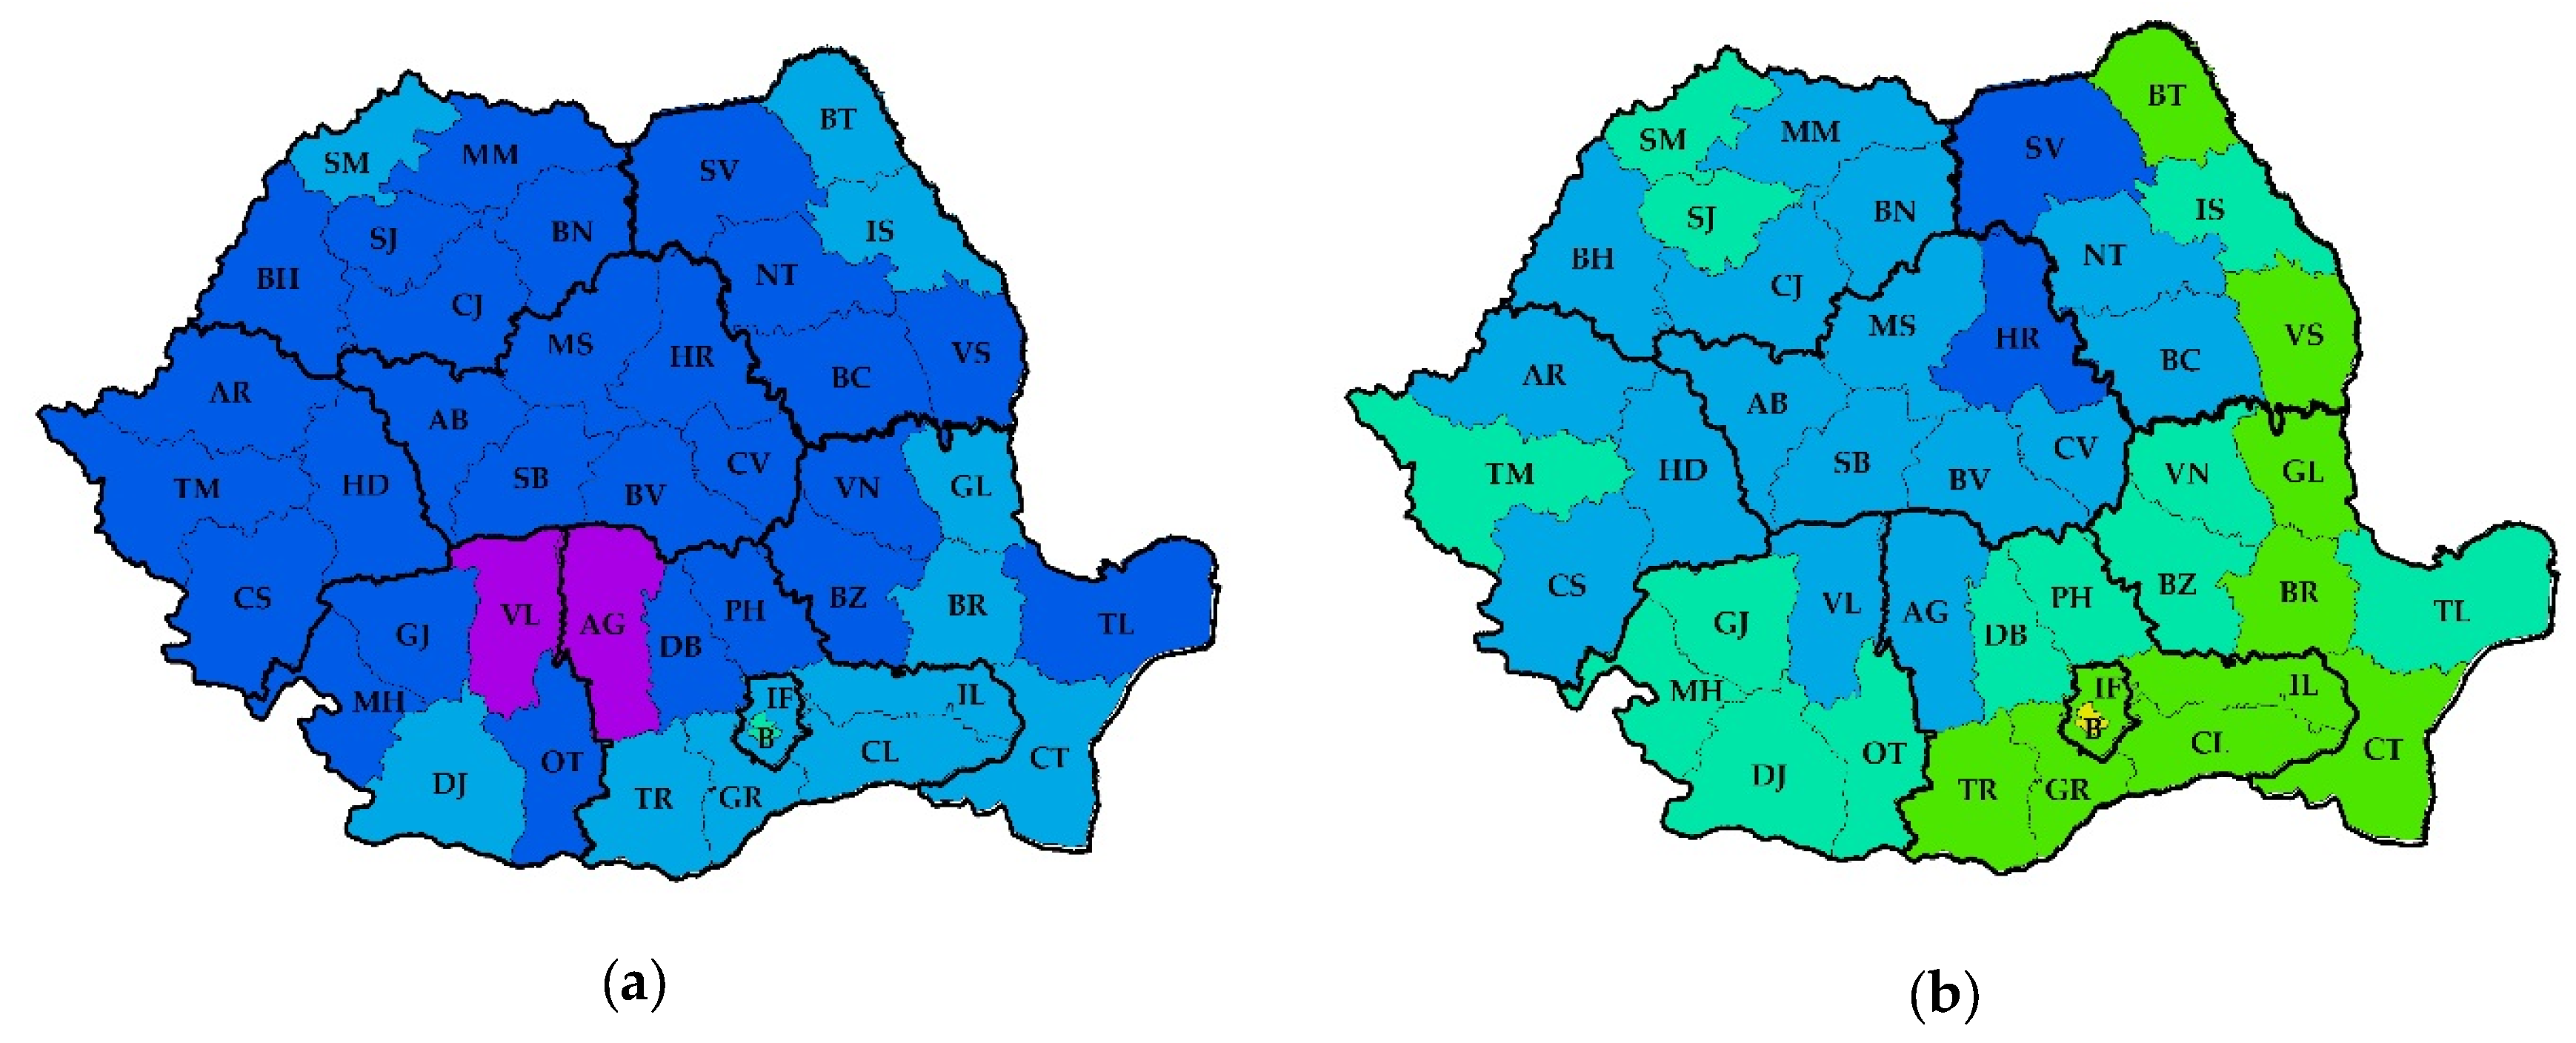
The first step of the morphological characterization of the forest patterns involves measuring the D
Surf-dil0 which describes how the forest mass is concentrated across scales on a given area. D
Surf-dil0 can take any value between 0 and 2. D
Surf-dil0 equal to 0 corresponds to a limited case where the pattern is made up of a single point (e.g., a single patch of forest was only 0.022 km
2). D
Surf-dil0 < 1 corresponds to a pattern made up of unconnected elements, detached clusters (the patches of forests are highly dispersed and mostly isolated from one another, similarly to a Fournier Dust). D
Surf-dil0 > 1 corresponds to a mix of connected elements forming large clusters, connected elements forming small clusters, and isolated elements. When D
Surf-dil0 is close to 2, the forest pattern is quite uniformly distributed following only a single scale with a high degree of homogeneity. In this case, the forest is uniformly distributed and most elements are connected to each other. The overall shape is then mainly a single large and compact cluster. An increasing D
Surf-dil0 indicates a more dense and homogenous pattern of forest areas with increasing filling of the existing areas characterized by gaps. A decreasing D
Surf-dil0 indicates a growing fragmentation in multi-scale clusters and a more uneven distribution of forest areas. This uneven fragmentation of deforested or reforested areas can be imposed by human activity or natural conditions by themselves. The quality of the fractal dimension estimation is controlled by using the Pearson correlation coefficient
R. Estimations were accepted when R exceeded the value of 0.99 [
47]. If the fit between the empirical curve and the estimated curve is low, it is be concluded that either the pattern being studied is not fractal, or that it is multi-fractal [
43].
The second step of the morphological characterization of the forest pattern involves a measure of the D
dil3. The principle of dilation is based on an algorithm introduced by Minkowski and Bouligand [
48] to establish the dimension of an object using the measure theory and involves surroundings of each object point by additional border points with increasing size for the each iteration step. During the first dilation, each pixel is surrounded by a border of one pixel in width. Then, the reference element was a square of 3
2 pixels in size. At the second iteration step, each pixel was surrounded by a border of two pixels in width. The structuring element is then a square of 5
2 pixels in size [
44]. At the third iteration step, each pixel is surrounded by a border of three pixels in width and the structuring element is then a square of 7
2 pixels in size.
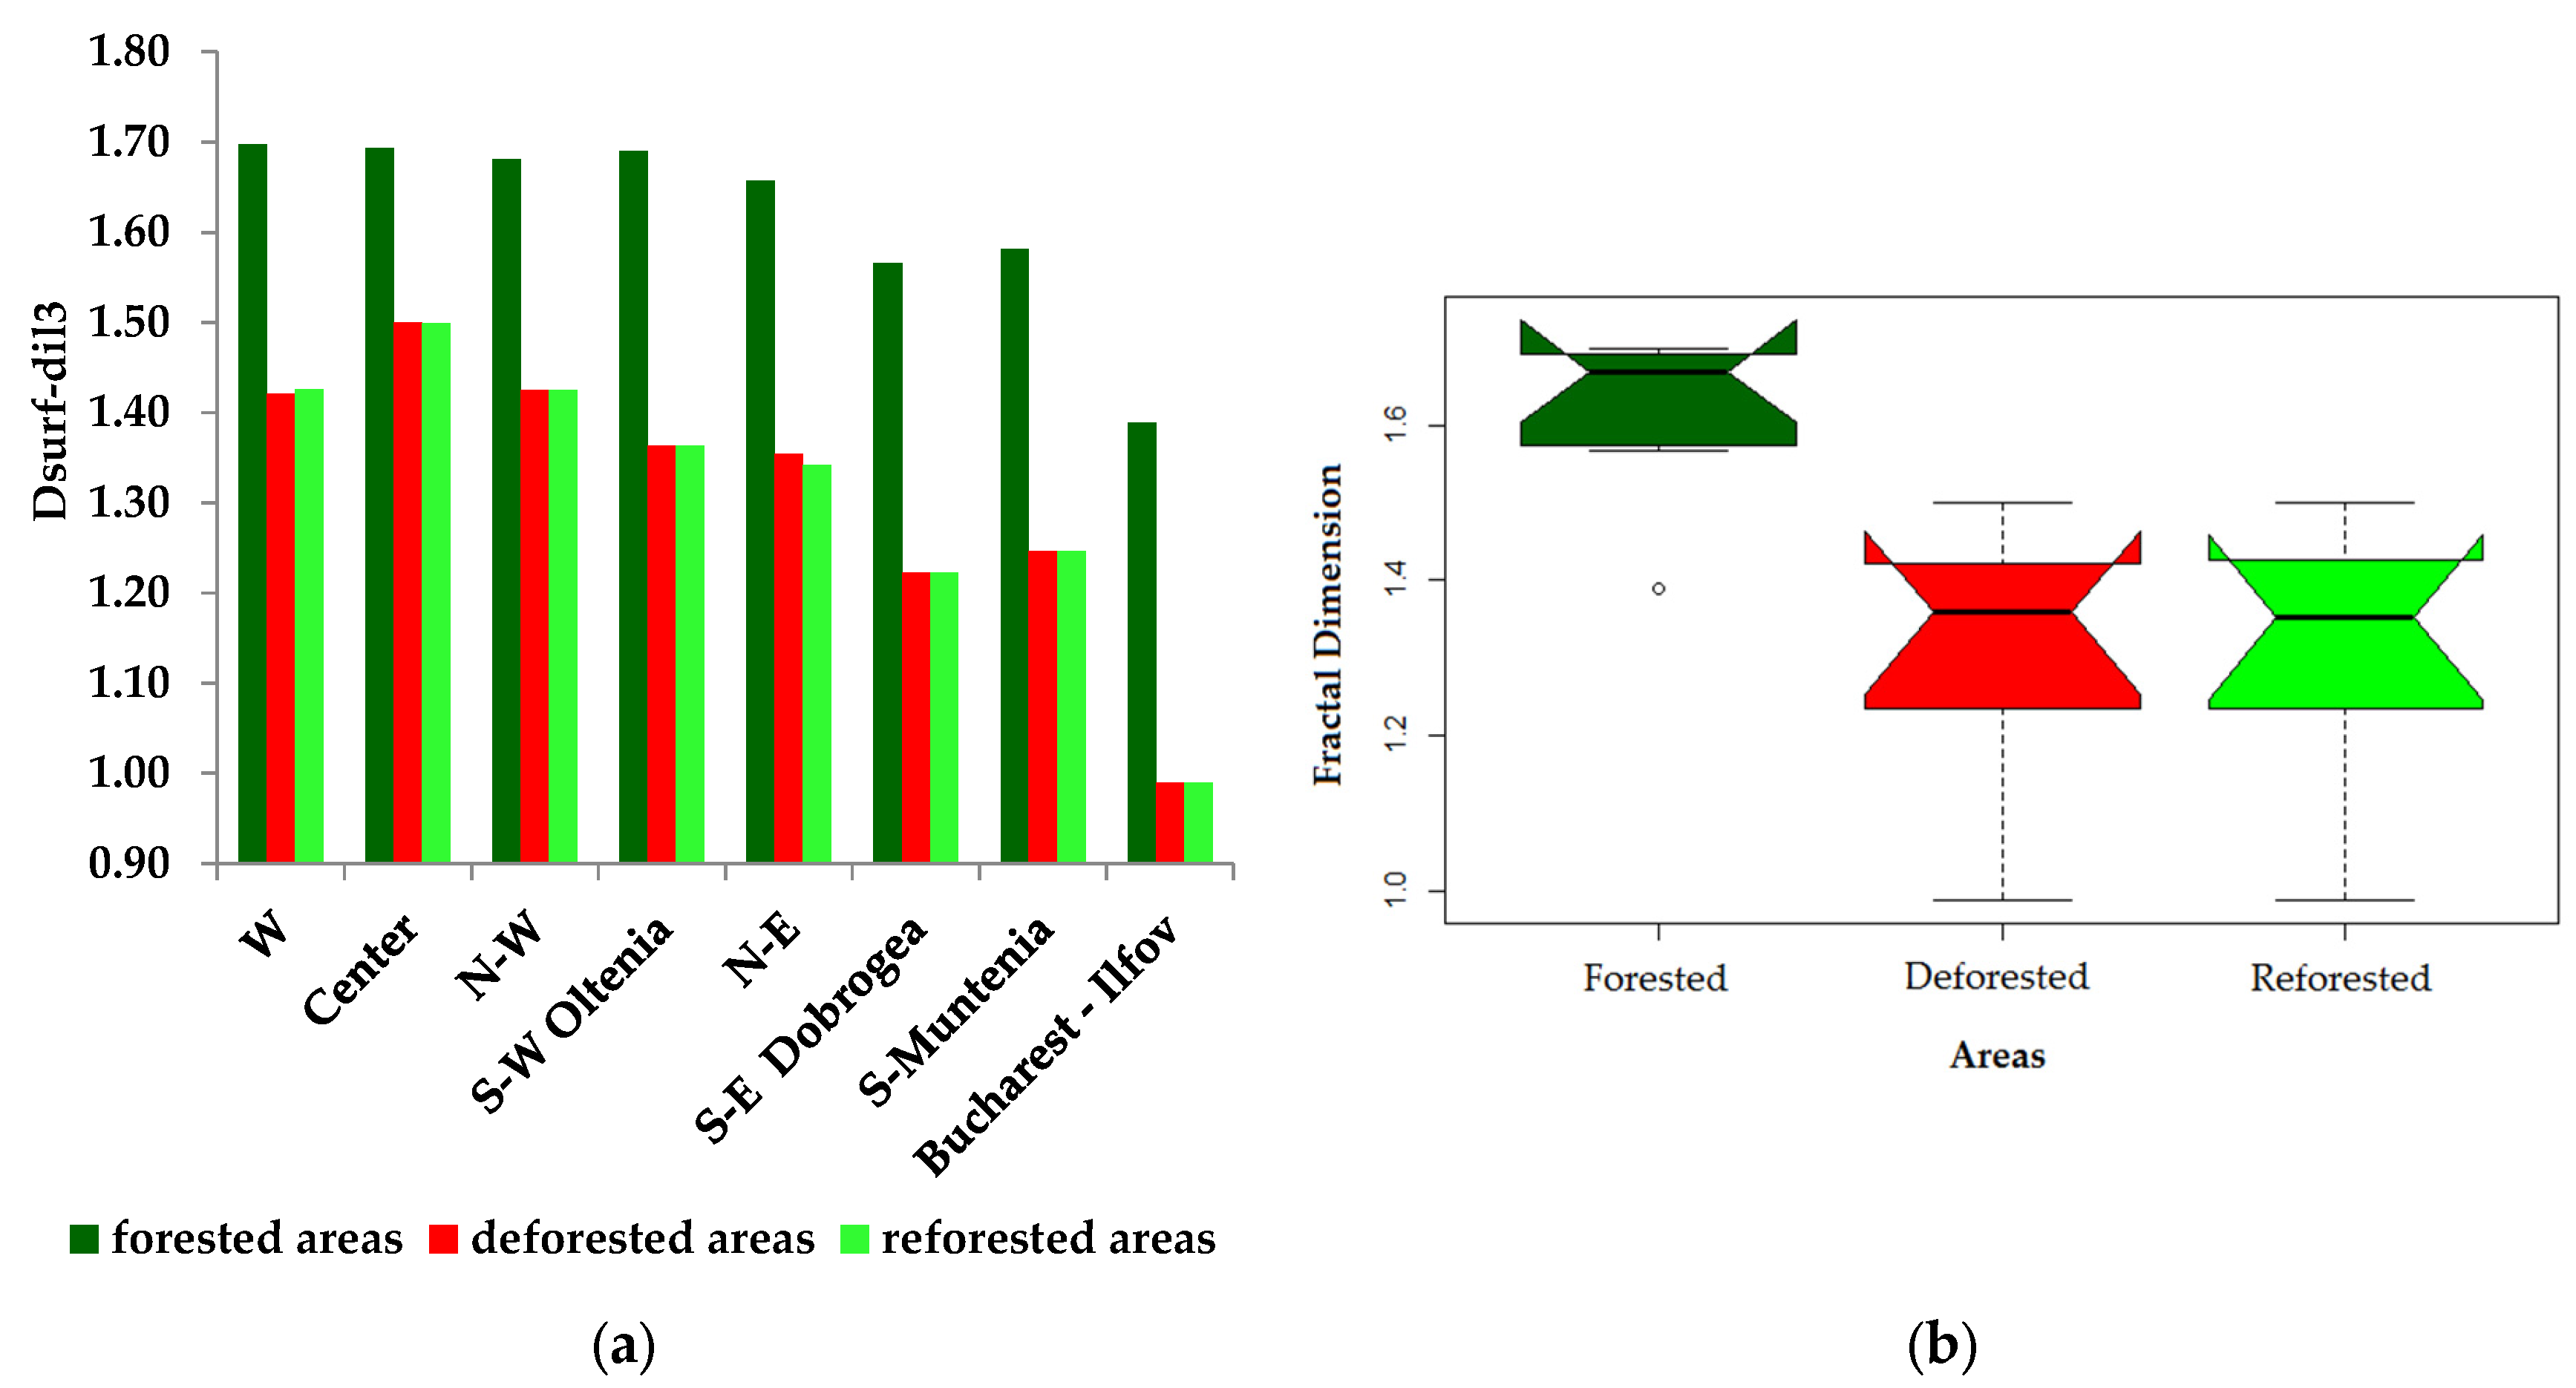
In the third step, we measured the box-counting dimension of forested patterns after three dilations. With three dilations, all details referring to 1.078 km
2 areas were unclear, meaning that the smallest spaces disappeared. The pattern is fully connected in a fractal manner and the fractal dimension of the dilated forested area (D
Surf-dil3) should be higher than forest-free areas; D
Surf-dil3 should also be higher than 1. If D
Surf-dil3 differs substantially from D
Surf-dil0, the way of combining the smallest free spaces with the surrounding forest pixels follows a fractal organization very different from the spatial organization of the forest pattern at larger scales. On the contrary, if D
Surf-dil3 is not very different from D
Surf-dil0, the smallest free spaces do not follow a multi-scale pattern; they only influence the value of D
Surf-dil0 slightly by introducing noise into the measure [
49].
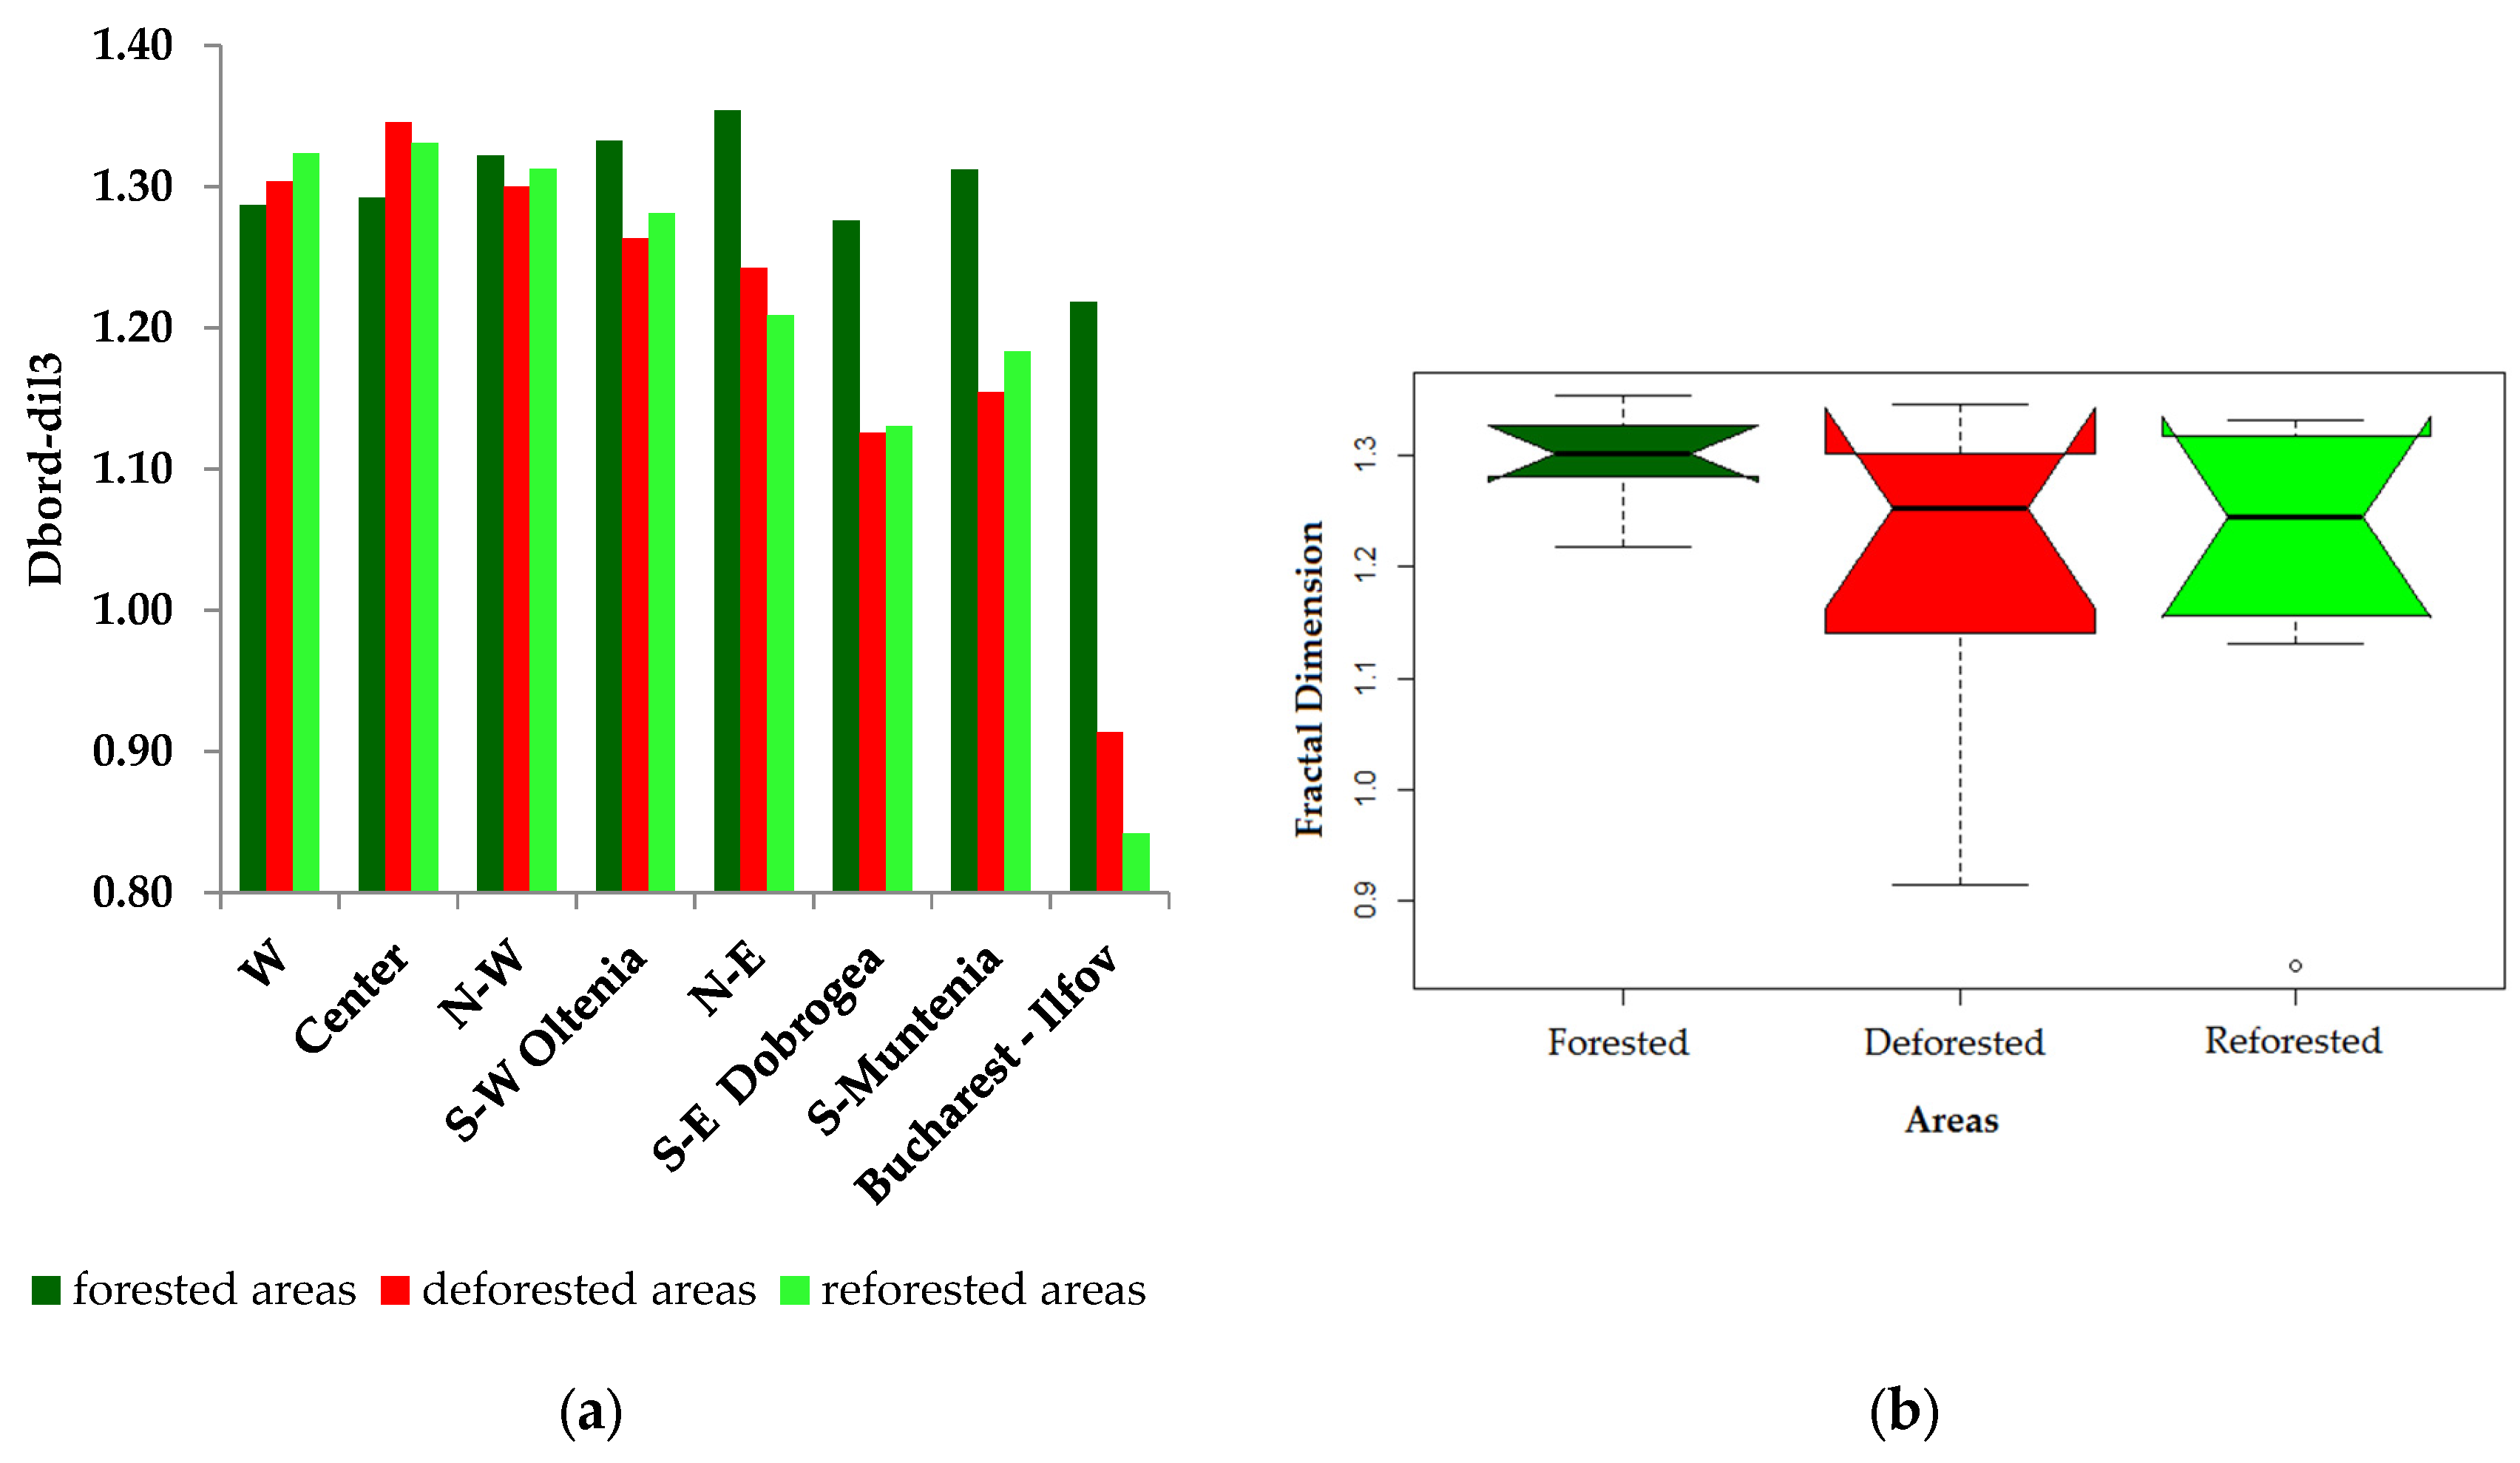
The fourth step of the morphological characterization of the forest pattern was to measure the box-counting dimension of its dilated borders (DBord-dil3). The morphology of the borders is different from that of the areas and involved different ways to describe the geometry of forest areas. We used fractal analysis of dilated borders in order to eliminate the tiniest free spaces whose spatial forest organization is not well known and tends to be rather irregular.
Because of the forests’ fragmentation and heterogeneity, many borders of forest areas tend to exert irregularity with the DBord-dil3 greater than 1. For more compact patterns, DSurf-dil3 tends to be higher than DBord-dil3 and vice versa, because the shapes of forested patterns are more diverse in the largest counties. This may lead to slight differences in the absolute values of the fractal dimensions, without affecting the general conclusions of the present paper.


 ,
, 


