Article

Sustained Biomass Carbon Sequestration by China’s Forests from 2010 to 2050

1
School of Resources and Environmental Engineering, Ludong University, Yantai 264025, China
2
International Institute for Earth System Science, Jiangsu Provincial Key Laboratory of Geographic Information Science and Technology, Nanjing University, Nanjing 210023, China
3
Jiangsu Center for Collaborative Innovation in Geographical Information Resource Development and Application, Nanjing 210023, China
4
Joint Center for Global Change Studies, Beijing 100875, China
5
Planning and Design Institute of Forest Products Industry, State Forestry Administration of China, Beijing 100010, China
*
Author to whom correspondence should be addressed.
Forests 2018, 9(11), 689; https://doi.org/10.3390/f9110689
Submission received: 16 October 2018 / Revised: 29 October 2018 / Accepted: 2 November 2018 / Published: 4 November 2018
(This article belongs to the Section Forest Ecology and Management)

Abstract

:
China’s forests have functioned as important carbon sinks. They are expected to have substantial future potential for biomass carbon sequestration (BCS) resulting from afforestation and reforestation. However, previous estimates of forest BCS have included large uncertainties due to the limitations of sample size, multiple data sources, and inconsistent methodologies. This study refined the BCS estimation of China’s forests from 2010 to 2050 using the national forest inventory data (FID) of 2009−2013, as well as the relationships between forest biomass and stand age retrieved from field observations for major forest types in different regions of China. The results showed that biomass–age relationships were well-fitted using field data, with respective R2 values more than 0.70 (p < 0.01) for most forest types, indicating the applicability of these relationships developed for BCS estimation in China. National BCS would increase from 130.90 to 159.94 Tg C year−1 during the period of 2010−2050 because of increases in forest area and biomass carbon density, with a maximum of 230.15 Tg C year−1 around 2030. BCS for young and middle-aged forests would increase by 65.35 and 15.38 Tg C year−1, respectively. 187.8% of this increase would be offset by premature, mature, and overmature forests. During the study period, forest BCS would increase in all but the northern region. The largest contributor to the increment would be the southern region (52.5%), followed by the southwest, northeast, northwest, and east regions. Their BCS would be primarily driven by the area expansion and forest growth of young and middle-aged forests as a result of afforestation and reforestation. In the northern region, BCS reduction would occur mainly in the Inner Mongolia province (6.38 Tg C year−1) and be caused predominantly by a slowdown in the increases of forest area and biomass carbon density for different age–class forests. Our findings are in broader agreement with other studies, which provide valuable references for the validation and parameterization of carbon models and climate-change mitigation policies in China.

1. Introduction

Forests play an irreplaceable role in the global carbon cycle and climate-change mitigation because of their high biomass carbon sequestration (BCS) potential [1,2,3,4,5]. Globally, forests are widely recognized as a significant carbon sink [6,7], currently absorbing carbon from the atmosphere at a rate of approximately 2.4 Pg C year−1 [2]. However, this carbon sink has large spatial and temporal variability [8,9]. It can be readily altered by restoring or degrading forest vegetation [10,11]. Restoration and degradation have contrasting implications for the magnitude of future BCS in forest ecosystems. Forest BCS may be expected to increase and reach a carbon equilibrium state as forests grow after restoration [12]. In contrast, BCS from forest degradation is highly uncertain, which depends on how quickly forests recover their capacity for photosynthesis [13,14]. Therefore, assessment of the BCS dynamics of forests in the future, and quantification of the dominant factors contributing to it are required for the guidance on future CO2-emission targets and forest management strategies.
Two approaches have been developed to quantify future forest BCS on the regional and global scales, including process-based carbon models [15,16,17,18,19,20] and empirical models fitted using ground-based field measurements [21,22,23,24,25]. Process-based models are commonly used tools for the projection of long-term BCS in forest ecosystems based on spatially heterogeneous input parameters. They incorporate a broad range of methodologies for describing ecophysiological processes, from semiempirical relationships to mechanistic descriptions [26]. However, it is often difficult to find sufficiently detailed input information for accurate parameterization of incorporated processes over large areas. In addition, the impact of forest demographic processes, such as age-related growth on BCS simulation, are usually ignored due to the lack of quantitative knowledge about age distribution. Forest-stand age, a surrogate for major disturbance information, is a critical factor determining both the state and potential of forest BCS [19,27,28]. An alternative approach is empirical models fitted using ground-based field measurements. These models project the trajectories of forest BCS according to stand age or development stages. Outputs from this kind of methods have even been applied to evaluate process-based carbon models as ‘observations’ [7,17,29]. Ground-based inventories and biometric observations of biomass and age have been widely available in forest ecosystems, and make this method more applicable [21,24,25]. Such a method does not require too many assumptions and data. Therefore, it is easy to extend over large areas. The key to this method is to calibrate empirical models for BCS estimation.
China ranks as the fifth biggest country in terms of forest area and holds the largest plantation area in the world [30,31]. Inventory-and model-based studies have suggested that China’s forests have been acting as a significant carbon sink in recent decades, and this sink can primarily be attributed to forest expansion and regrowth driven by large-scale afforestation and reforestation since the late 1970s [14,32,33,34]. Forests in China currently cover 21.6% of the total national land area [35]. Most of these forests are young and middle-aged with high potential for BCS, and might continuously enhance carbon sinks in the future [14]. Unfortunately, increasing disturbances, such as timber harvest and drought stress, have weakened forest growth and carbon uptake over the past decade [14,36,37]. With rapid changes in land use and climate in China [38,39], predicting the future dynamics of forest BCS at the national scale has received considerable attention [21,22,23,24,25]. However, the conclusions on the magnitude and distribution of this BCS are still controversial because of a lack of available data and appropriate methodology.
National forest inventory data (FID) have consistently recorded the area and volume of dominant forest types at each age class in individual provinces across China since the 1970s. They constitute precious data to quantify the magnitude and distribution of forest BCS and project its future trend according to the change rate of forest biomass with age and current stand age. Based on the logistic relationships between forest biomass and stand age for major forest types derived from the national FID during 1994−2003, Xu et al. [21] first estimated that the potential BCS of China’s forests would be 144.56 Tg C year−1 from 2005 to 2050. Hu et al. [23] developed an age-based matrix model using continuous FID and found that forest BCS in China from 2005 to 2050 was about 79.00 Tg C year−1. There are very high uncertainties in the estimates of BCS for China’s forests, mainly because of the limited field measurements used to calibrate the biomass–age relationship and the universal application of one unique model for a forest type across the whole country [29,40].
In this study, we estimate BCS in China’s forests from 2010 to 2050 using the latest national FID, as well as the relationships between forest biomass and stand age, refined with 3543 field observations for major forest types in different regions of China. The main objectives of this study were to (1) estimate BCS of forests in China with FID and field observations; (2) analyze the dynamics of forest BCS in different age classes and regions; and (3) assess the impact of changes in area expansion and forest growth resulting from afforestation and reforestation on forest BCS in China.

2. Materials and Methods

2.1. Forest Inventory Data

The 8th national FID in 2009−2013 was used in this study. This dataset was compiled from measurements at 415,000 permanent plots distributed evenly across China [35]. The investigations for all plots were implemented following the technical standards of the State Forestry Administration of China. The inventory was finished in a single year for a specific province, and in five years for the whole country. In the national FID, statistical data of areas and timber volumes of five age classes (young, middle-aged, premature, mature and overmature) for 77 different forest types were documented by province. For the convenience of analyses, these forest types were grouped into 30 types. According to Forest Resource Statistics of China, forests are divided into three large groups: forest stands (including natural and planted forests), economic forests, and bamboo forests. Note that forests in Hong Kong, Macao, Taiwan, and the South China Sea Islands were not included here because of fieldwork-data unavailability and the small forest areas in these islands. As the biomass of forest stands accounts for the dominant portion of all forest types in China [41], we only assessed the BCS by forest stands in this study.

2.2. Field Measurement Data

Published data from 3543 field plots with a wide range of forest types and plot conditions in China were compiled for fitting biomass growth models, which describe the changes of forest biomass with stand age. All the measurements were conducted for the period from 1979 to 2011 and examined using the same methods and criteria by Zhang et al. [27,41]. Recorded information of field plots includes geographic location, forest type, stand age, density, and volume, mean tree height and diameter at breast height (DBH) for trees with DBH > 4 cm, and biomass of whole trees and their component parts (stems, branches, leaves, and roots). With the exception for Xinjiang and the Qinghai–Tibetan Plateau, these plots are evenly distributed in most regions of China (Figure 1). Forest types and site conditions of the plots are diverse and representative in most provinces. However, sampling plots are sparse in Xinjiang and the Qinghai–Tibetan Plateau. Forests in these regions make up only a small fraction of the national total. Therefore, the lack of enough field plots there might have little impact on the accuracy of the retrieved national forest BCS. In this study, we classified field plots into 30 common forest types, and then matched the forest types with the FID classification.

2.3. Estimation of Forest Biomass Carbon Stock

Forest biomass was estimated using the 8th national FID from 2009 to 2013 and the refined continuous biomass expansion factor (CBEF) models [41]:
B = a V + b  
where B is the stand biomass (Mg ha−1); V is the stand volume (m3 ha−1); and a and b are the coefficients for a specific forest type, which were refined using 3543 field plots by Zhang et al. [41].
In this study, we only calculated forest stand living biomass; carbon contained in wood products and soils were excluded. With consideration to both forest types and age classes, the biomass carbon stock of China’s forests was first estimated at the province scale, and then the results were summed up at the regional and national scales. Since a forest inventory spans about 5 years for the whole of China, BCS during 2009−2013 was calculated as the change of biomass carbon stock from 2004−2008 to 2009−2013 divided by the interval between their median years [14]. This study took the period of 2009−2013 as its base year to predict forest BCS in the following 40 years.

2.4. Calculation of Forest BCS

1. Step 1. Fitting the biomass–age relationship
Statistical analysis is commonly used to fit the biomass–age relationship. Widely used regression models include Gompertz, Logistic, Korf, Mitscherlich, and Richards growth functions [22,43]. Previous studies have reported that biomass–age relationships greatly change through environmental gradients and among different forest types [21,24]. In this study, five types of the stand growth models mentioned above were selected separately to describe the relationship between forest biomass and stand age for forests in the different regions of China (Table 1). The parameters for biomass–age relationship models were determined through nonlinear regression, which used the Levenberg–Marquardt optimization algorithm to minimize the square of absolute differences between estimates and forest biomass observations. A total of 3055 field plots with both forest biomass and age measurements were first selected from all 3543 sampling plots. Then, different models were fitted to quantify biomass–age relationships for major forest types widely distributed in different regions of China. The optimal model for each forest type in a region was determined using the highest R2 and the lowest RMSE as statistical criteria.
2. Step 2. Calculating a forest density index
An increasing number of studies have recently highlighted that stand-growth models may yield biased estimation of forest biomass carbon stock based on the biomass–age relationships, such as overestimating the carbon stock under poor site conditions and underestimating it under favorable site conditions [21,24,49]. Forest density index (DI) is widely recognized as an effective indicator of forest structure and function, and less affected by changes in forest age and site class [50]. It can be described as a function of forest biomass under the scenario that forests have a relatively even-aged stand structure. In this study, such bias in estimated BCS was corrected using the DI, which is calculated as:
D I i j m = B i j m / B i j m s ( A i j m )  
where Bijm is the forest biomass (Mg ha−1) estimated from timber volume using the refined CBEF model; Bijms is the forest biomass (Mg ha−1) estimated using the biomass–age relationship determined in Step 1; Aijm is the present mean stand age; Subscripts i (i = 1, 2, …, 31), j (j = 1, 2, …, 30), and m (m = 1, 2, 3, 4, 5) denote the province, forest type, and age class, respectively. Timber volume and Aijm were retrieved from the national FID of 2009−2013 (Table S1).
3. Step 3. Calculating forest BCS
Future BCS of different forest types in individual provinces of China was estimated with two assumptions. First, DI derived from the national FID during 2009−2013 would not change in the future. Second, neither clear-cuts nor die-offs would occur in the next 40 years. Then, increment of forest biomass carbon stock in ten-year intervals is used as a proxy of BCS:
P ( t + 10 ) = [ B S ( t + 10 ) B S ( t ) ] / 10  
B S ( t ) = 0.5 i = 1 31 j = 1 30 m = 1 5 ( S i j m + Δ S i j m ( t ) ) B i j m s ( A i j m + t ) D I i j m  
where P is the national total of forest BCS during the period from year (t = 0, 10, 20, 30) to year (t + 10) since 2010; BS(t) and BS(t + 10) are the forest biomass carbon stocks in years t and (t + 10) estimated using the fitted biomass–age relationships; Sijm and ΔSijm are the areas of existing forest stands in 2010 and newly planted forests in year t; (Aijm + t) is the mean stand age in year t; Coefficient 0.5 means that carbon content of biomass equals 50%.
The total forest area for every 10 years from 2010 to 2050 was estimated according to the development goals set by China Forestry Sustainable Development Strategy Research Group [51] (Table S2). Here, we assumed that the ratio of forest stands to total forests would remain unchanged in the next 40 years (80.1%), and calculated the area of forest stands between 2010 and 2050 in China. The area of newly planted forests was estimated as the difference in total forest stand area between any two sequential periods. Based on the area proportion of planted forests in different types reported by the national FID of 2009−2013, we allocated the area of newly planted forests into different forest types in the next 40 years with the assumption that proportions of planted forests in different types remain unchanged in the period from 2010 to 2050. The estimated areas of newly planted forest in all forest types are shown in Supplementary Table S3.

3. Results

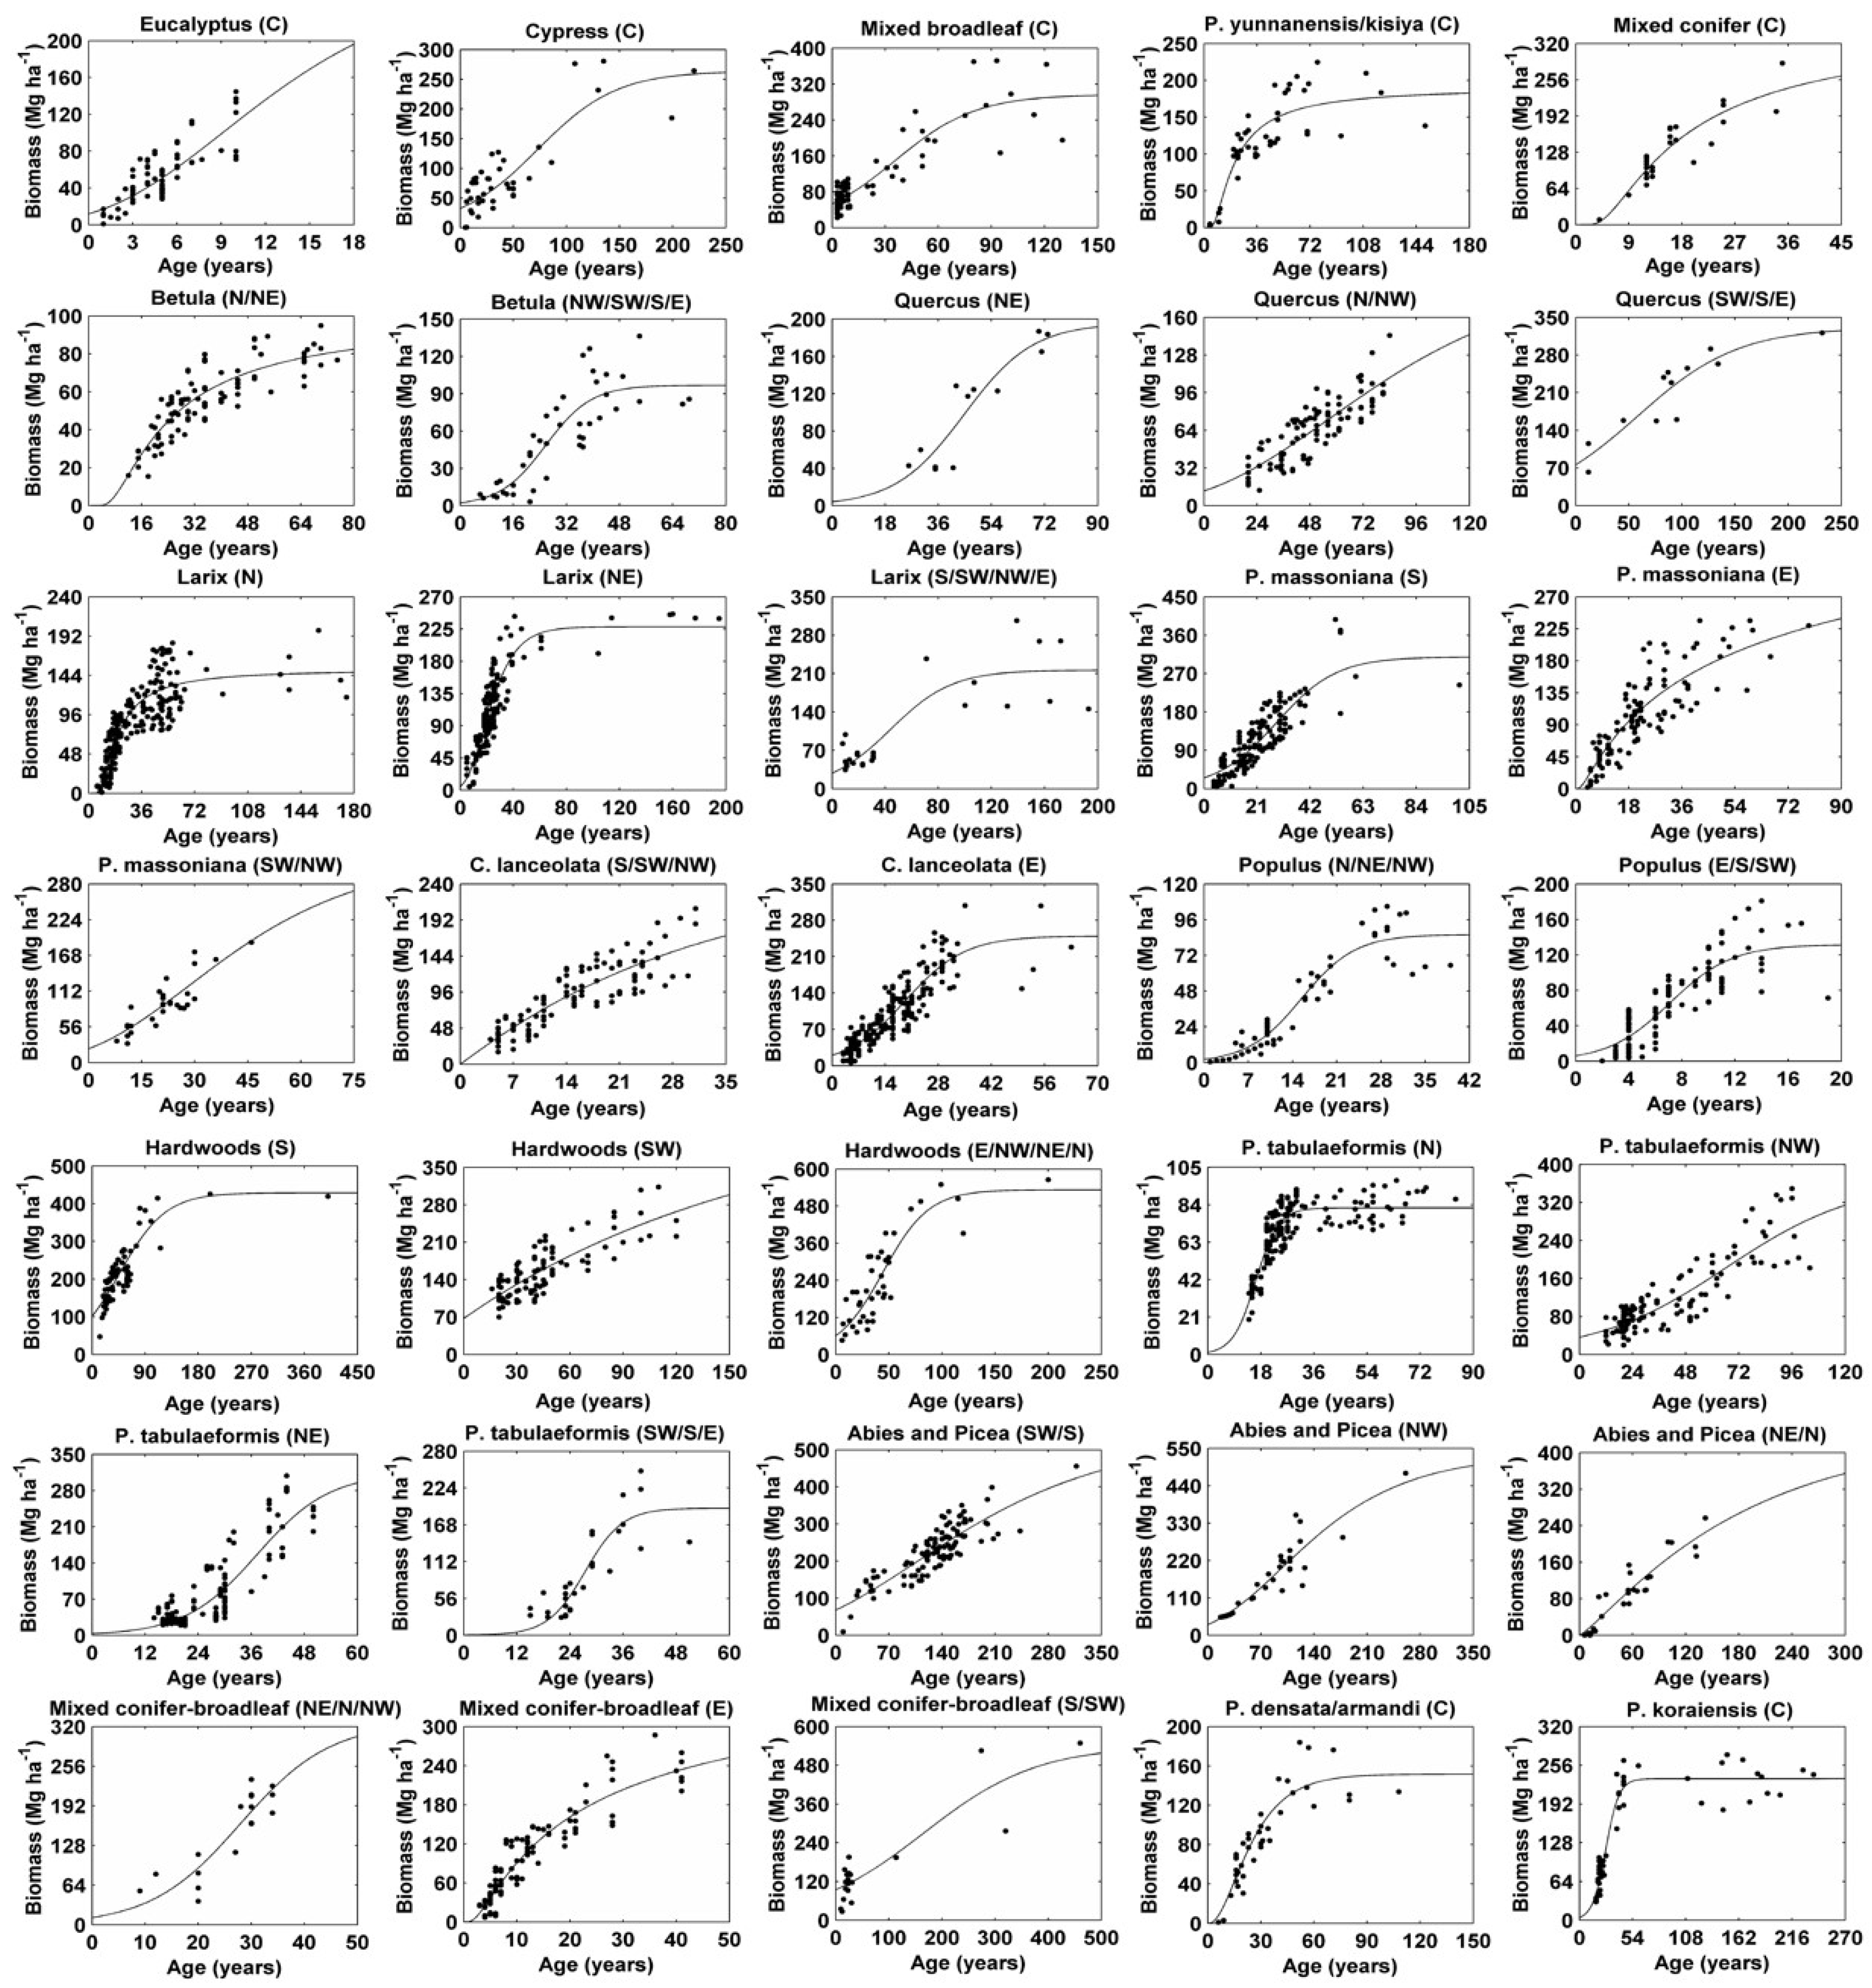
3.1. Models for Forest BCS Estimation

The optimal fitted biomass–age relationships for different forest types in individual regions of China are shown in Table 2. The majority of forest types could be predicted directly with the biomass–age relationships. Due to limited field data availability, Acer, Tilia, Ulmus, Davidia, and tropical forests were predicted using alternative biomass–age relationships that gave approximate values; the biomass–age relationship for hardwoods and softwoods was used for these forest types. For most forest types, the logistic function performed the best in describing biomass–age relationships. With the exception of Eucalyptus, hardwoods, and softwoods in the southwestern region, and Quercus forests in the northern and northwestern region, the fitted models for major forest types show statistical significance at the 0.01 level with R2 values above 0.70, confirming the applicability of these relationships in estimating forest biomass and consequently BCS in China. Figure 2 lists the fitted optimal biomass–age models for 17 major forest types, which account for approximately 96.0% of the total area of forest stands in China. Biomass increases quickly with stand age when forests are young. Then, the increase slows or even stops when forests mature. According to the FID of 2009−2013, the national area-weighted average ages were 5, 46, 51, 29, 46, 46, 51, 66, 22, 16, 13, 28, 31, 101, 49, 37, and 43 years for Eucalyptus, Cypress, mixed broadleaf, Pinus yunnanensis Franch. and Pinus kisiya Royle ex Gordon, mixed conifer, Betula L., Quercus L., Larix Philip Miller, Pinus massoniana Lamb., Cunninghamia lanceolate R.Br., Populus, hardwoods, Pinus tabulaeformis Carr., Abies and Picea, mixed conifer–broadleaf, Pinus densata Mast. and Pinus armandi Franch., and Pinus koraiensis Siebold & Zucc. forests, respectively. These ages are much younger than the ages at which forest biomass peaks, indicating the substantial future BCS potential for forests in China.

3.2. BCS Dynamics of Forests in China

The national total forest area, biomass carbon stock, and average biomass carbon density would increase gradually from 164.60 × 10⁶ ha, 6.90 Tg C, and 41.90 Mg C ha−1 in 2010 to 218.02 × 10⁶ ha, 14.79 Tg C, and 67.84 Mg C ha−1 in 2050, respectively, indicating that forests in China would function as a persistent carbon sink in the next four decades (Table 3). The BCS of China’s forests in 2020, 2030, 2040, and 2050 is expected to be 221.57, 230.15, 178.65, and 159.94 Tg C year−1, respectively, with an average of 184.04 Tg C year−1 over the period from 2010 to 2050. BCS would increase dramatically for the period of 2010−2030, driven by considerable area expansion (31.61 × 10⁶ ha) and forest growth (i.e., an increase of 16.27 Mg C ha−1 in carbon density), and it was predicted to reach the maximum around 2030. Since then, total forest BCS would slightly decrease, largely caused by the slowdown in increases of forest area and biomass carbon density.

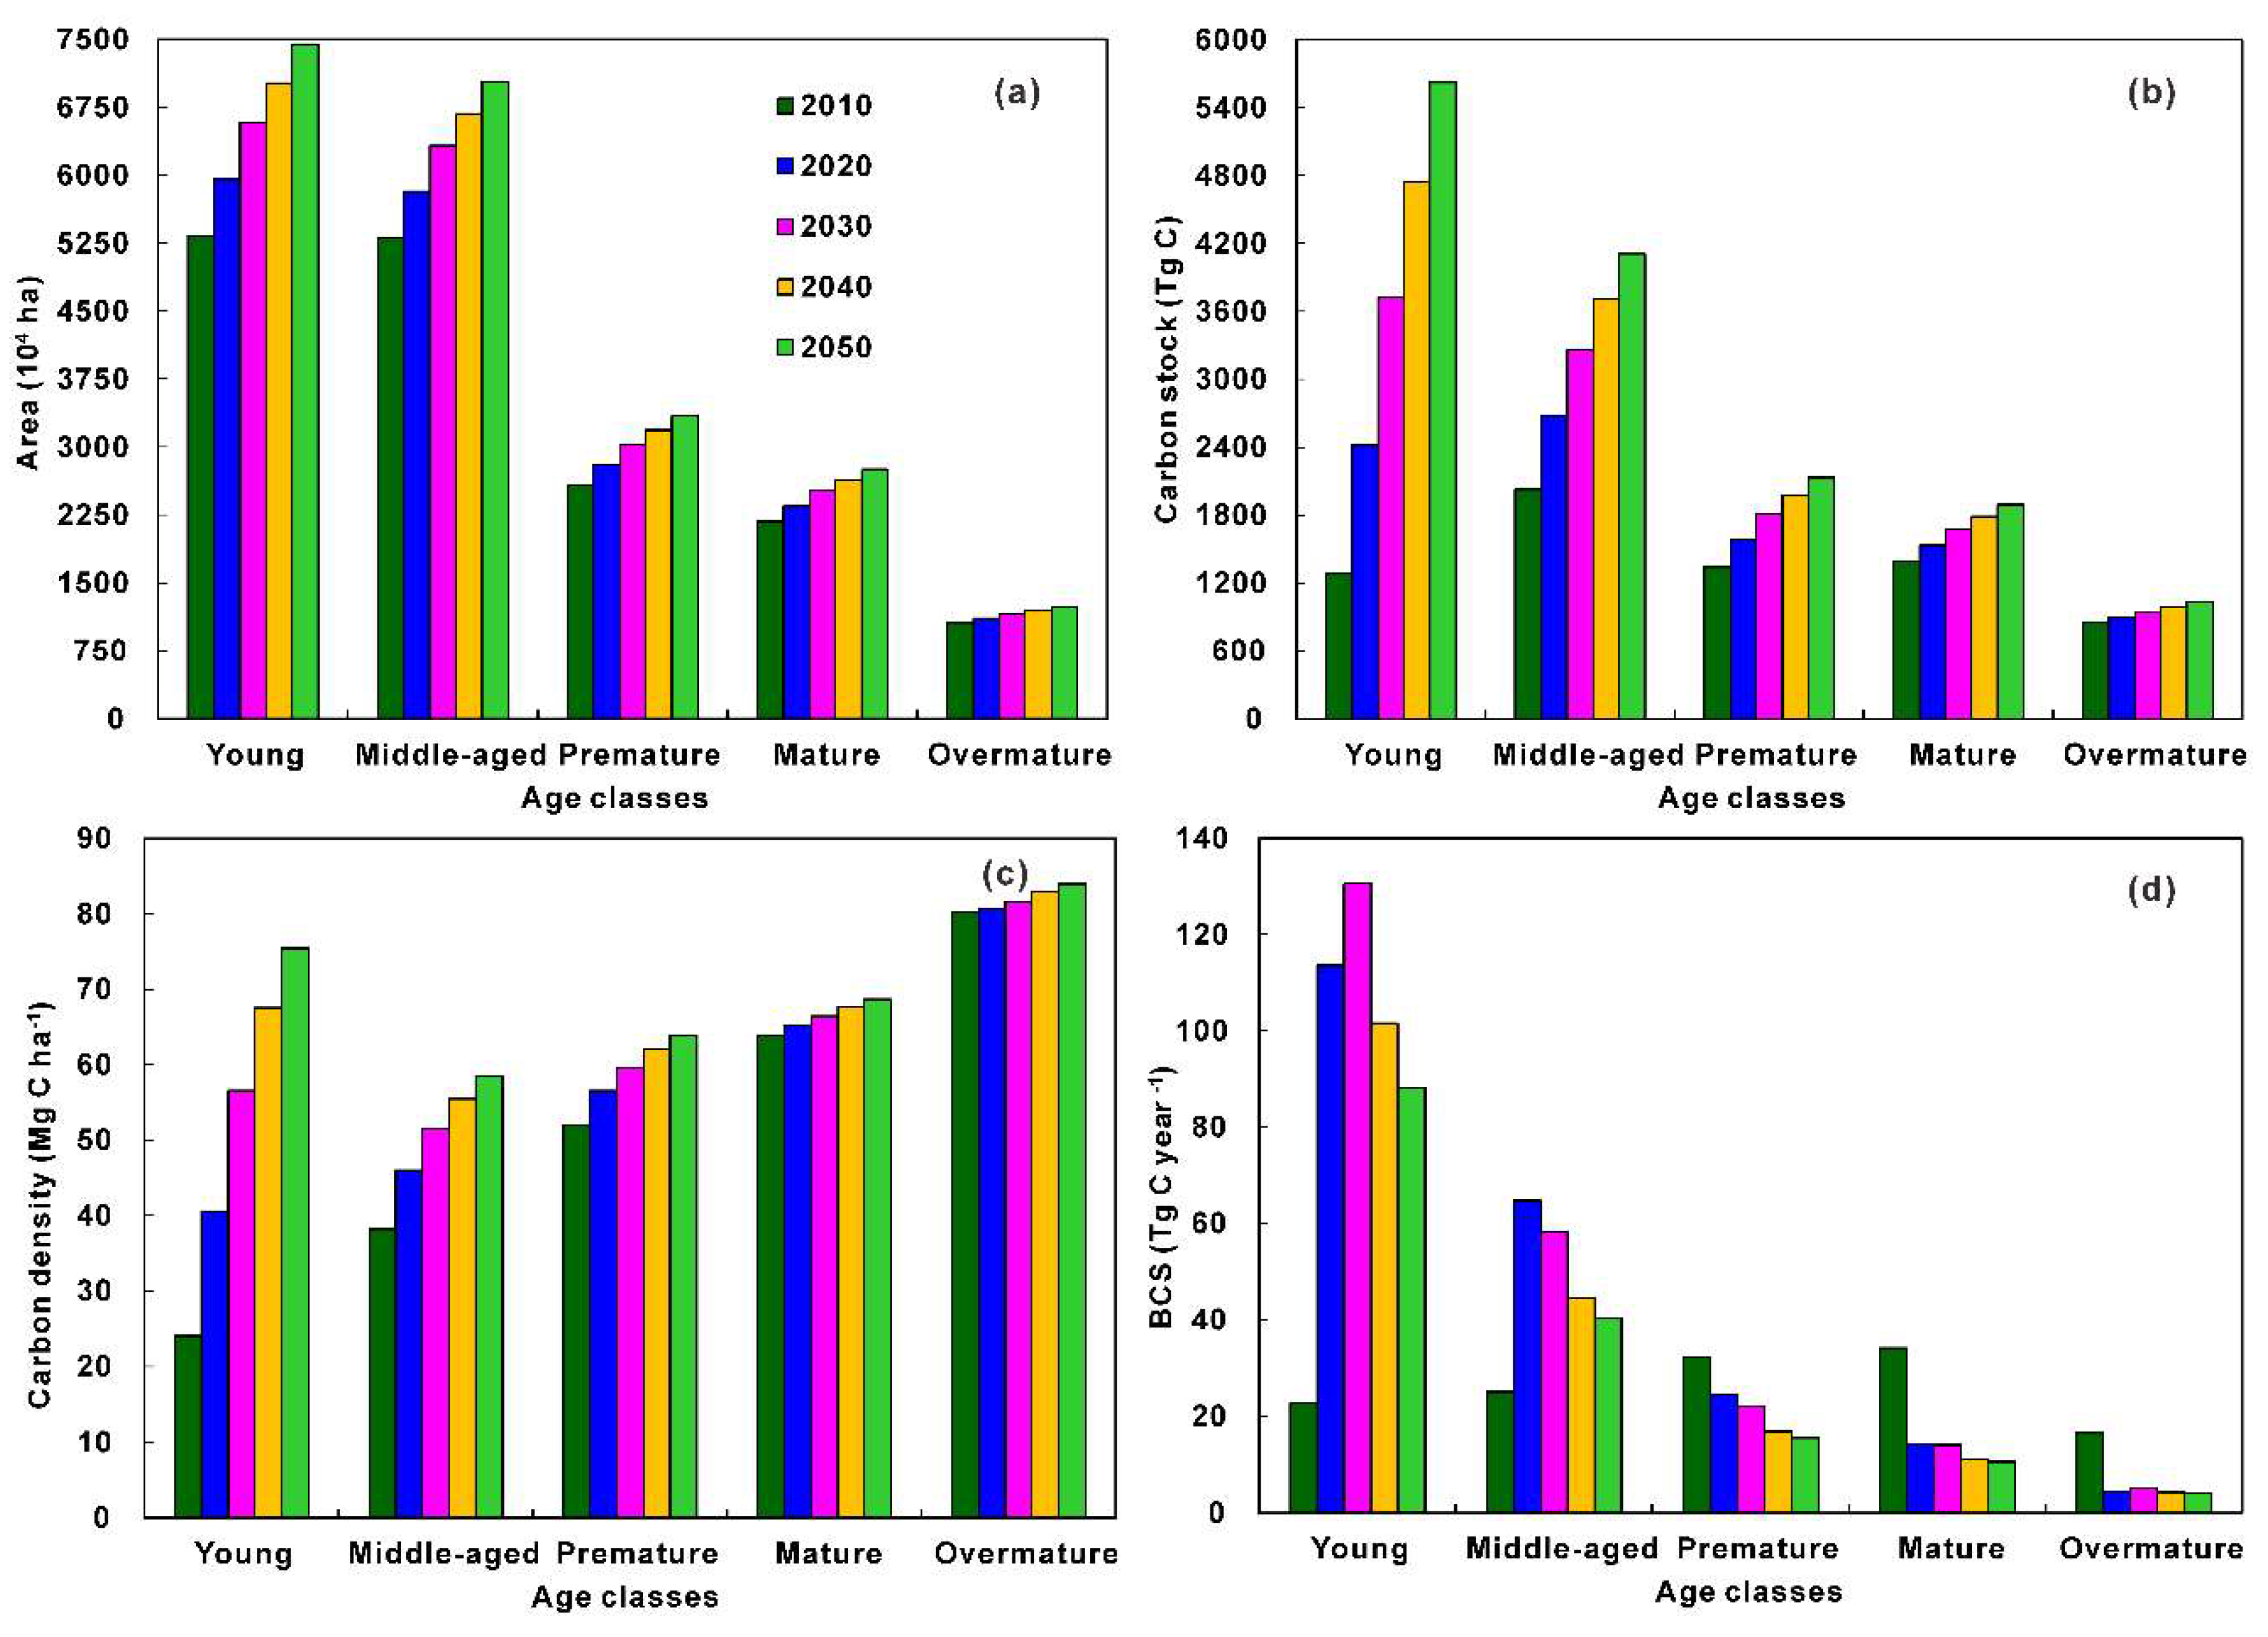
3.3. BCS in Different Forest Age Classes

Forest BCS in China greatly varied with age classes over the study period (Figure 3). All areas, biomass carbon stock, and average biomass carbon density of young, middle-aged, premature, mature, and overmature forests consistently increased from 2010 to 2050 (Figure 3a–c). BCS for young and middle-aged forests would increase significantly, from 22.76 and 25.05 Tg C year−1 in 2010, to 113.63 and 64.80 Tg C year−1 in 2020, respectively, amounting to 100.2% and 43.8% of the national total increase of forest BCS during the corresponding period (Figure 3d). The very large BCS of these two age classes of forests could be attributable to the significant increase in areas and biomass carbon density. The areas of young and middle-aged forests would increase by 6.26 × 10⁶ and 5.08 × 10⁶ ha, respectively. The biomass carbon density of these two age classes of forests would increase by 16.54 and 7.79 Mg C ha−1. However, 44.0% of the BCS increase of young and middle-aged forests would be offset by the reduction in BCS of premature, mature, and overmature forests for the period of 2010−2020. During the period from 2020 to 2030, the BCS of middle-aged, premature, mature, and overmature forests would gradually shrink, owing to the decrease in increasing rates of forest area and biomass carbon density. Over the entire study period, the BCS of premature, mature, and overmature forests would decrease by 16.64, 23.47, and 12.56 Tg C year−1, respectively. Meanwhile, the BCS of young and middle-aged forests would increase by 65.35 and 15.38 Tg C year−1 as a consequence of accelerated area expansion and forest growth. Young and middle-aged forests together contributed to 36.5%, 80.5%, 82.0%, 81.8%, and 80.9% of the national total forest BCS in 2010, 2020, 2030, 2040, and 2050, respectively. Forests in China have great potential to sequester more biomass carbon in the future because of large fractions of young and middle-aged forests.

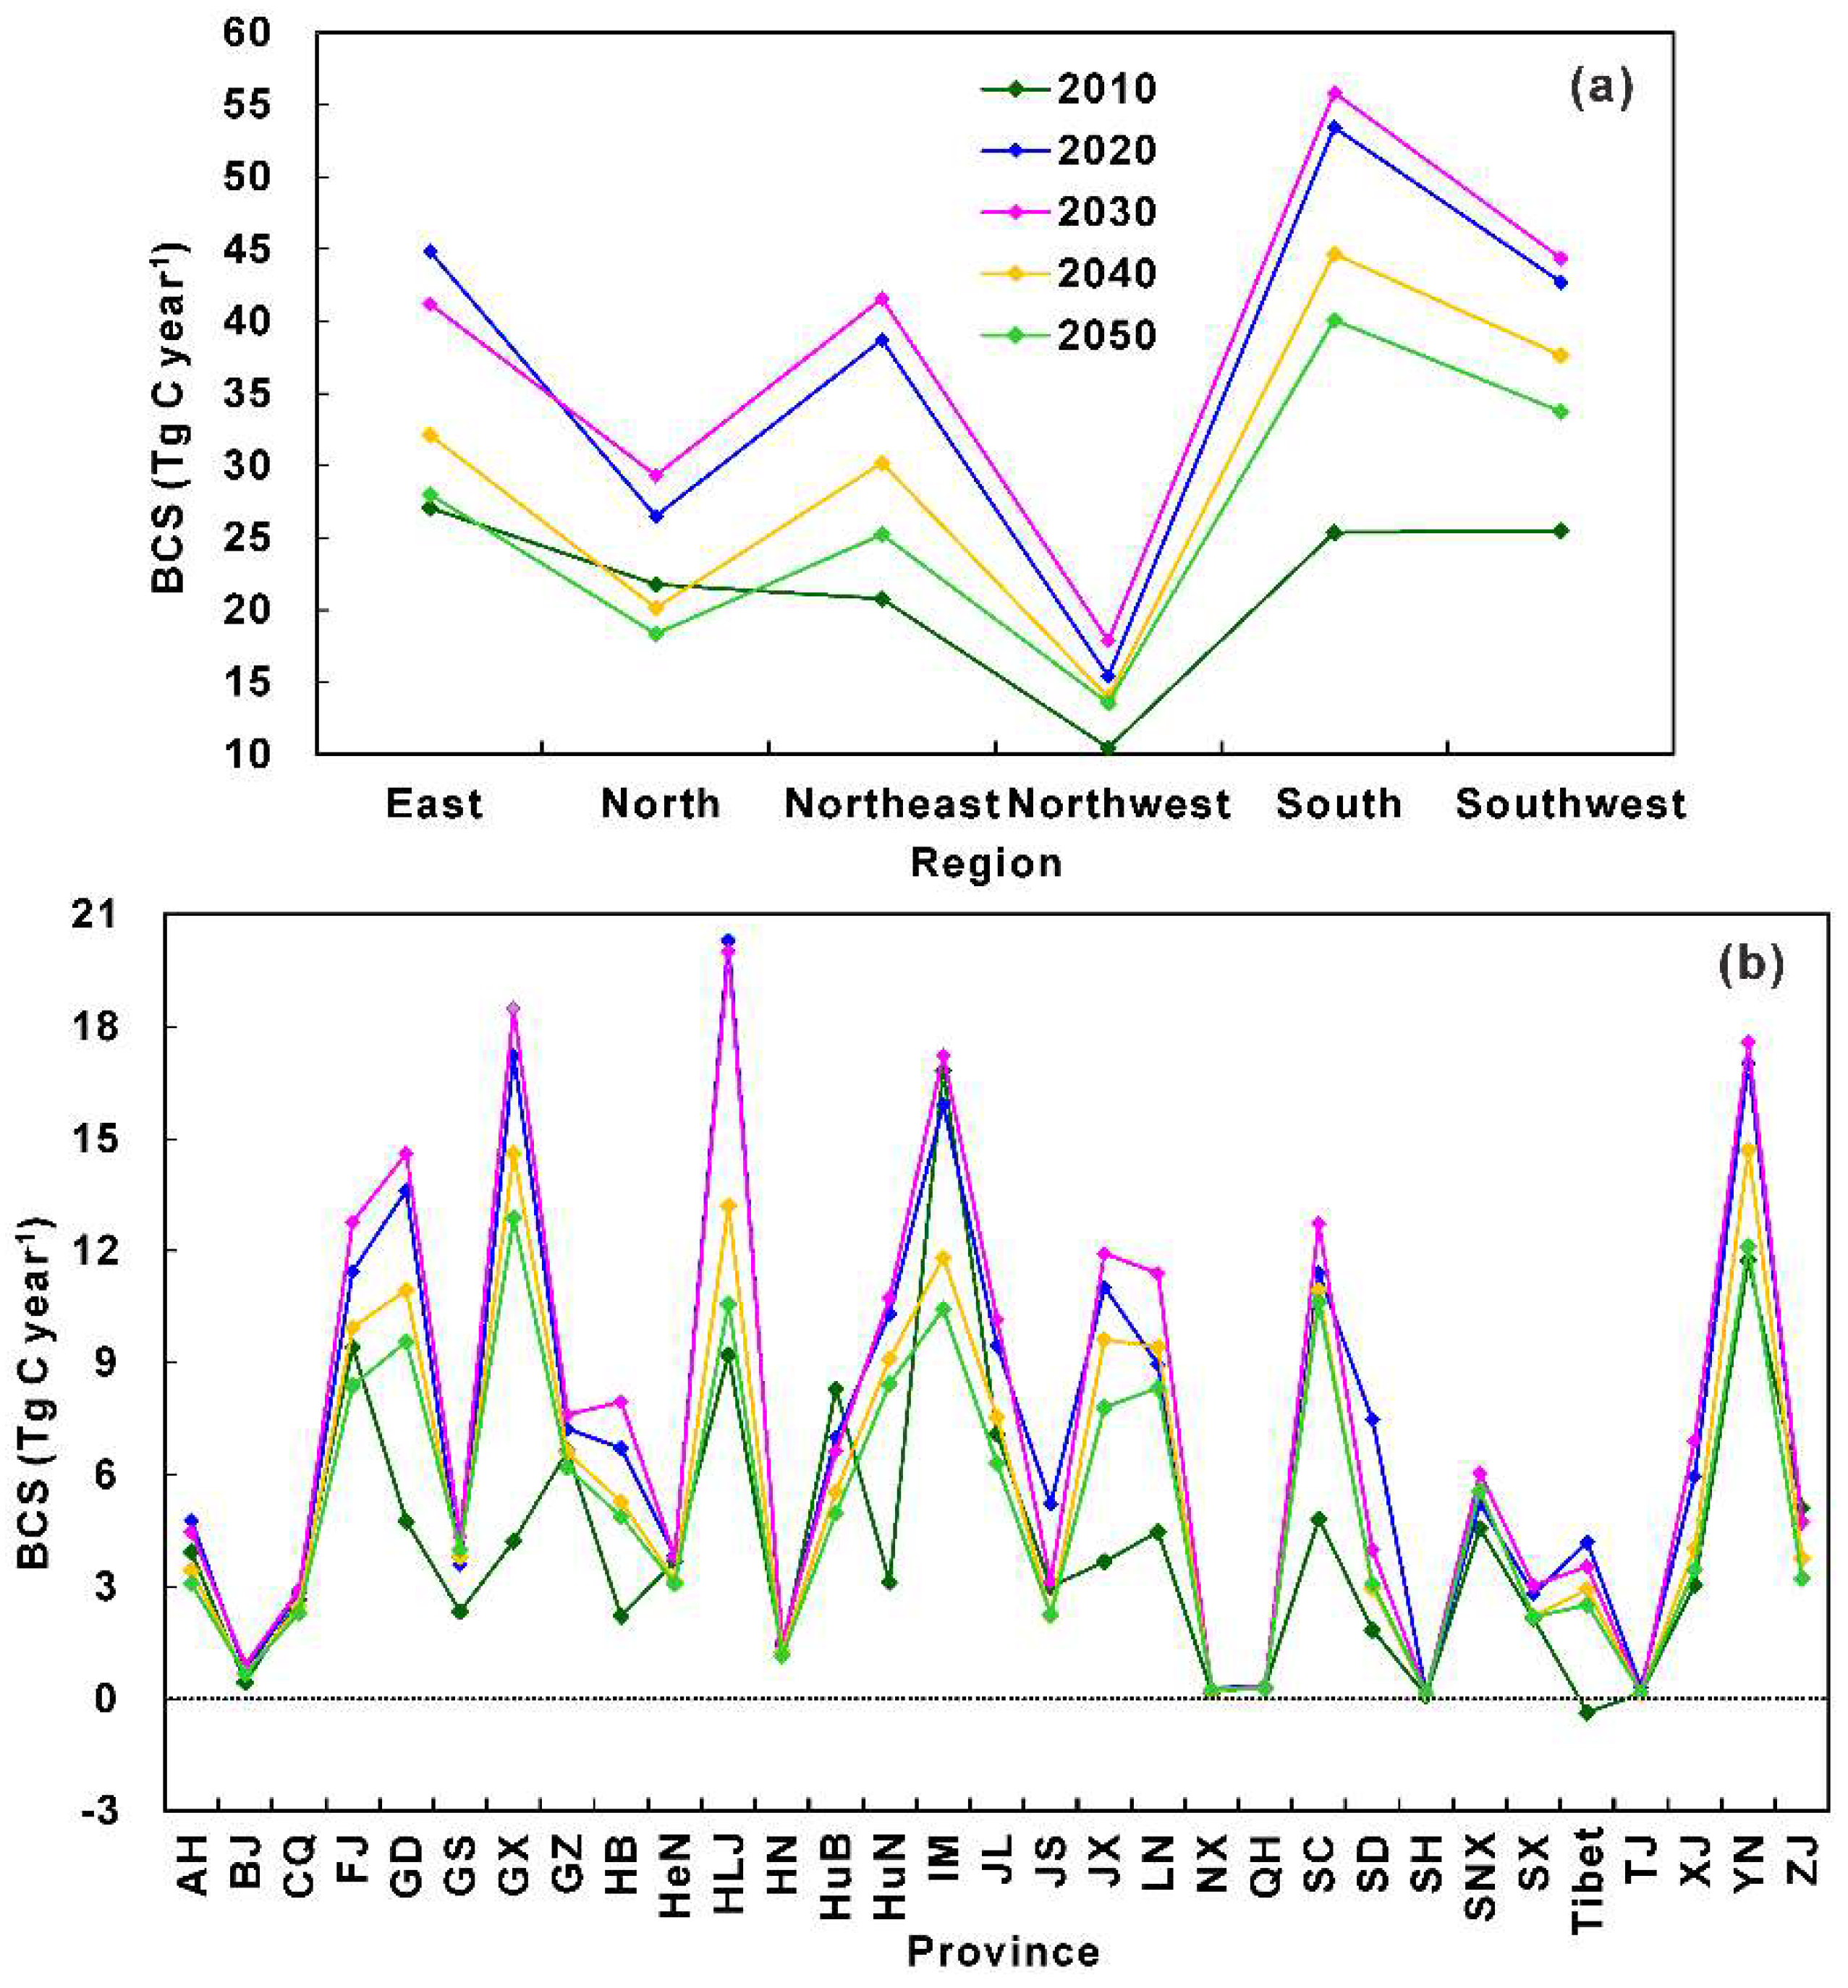
3.4. Regional Differences of Forest BCS

The BCS by China’s forests shows substantial spatial and temporal variations, ranging from a minimum of 10.45 Tg C year−1 around 2010 in the northwestern region to a maximum of 55.82 Tg C year−1 around 2030 in the southern region (Figure 4a). Overall, BCS of forests would increase from 2010 to 2050 in all but the northern region. The largest increase (14.72 Tg C year−1) of forest BCS would occur in the southern region, accounting for 52.5% of the national total increase. The large BCS in the southern region around 2030 would primarily be caused by the significant increases of 30.2% and 34.8% in forest area and biomass carbon density there (Table S4). Over the study period from 2010 to 2050, the southern region would have the largest average BCS of 43.87 Tg C year−1, followed by the southwestern (36.79 Tg C year−1), east (34.64 Tg C year−1), northeastern (31.29 Tg C year−1), northern (23.21 Tg C year−1), and northwestern (14.24 Tg C year−1) regions.
All Chinese regions except the eastern region would exhibit similar temporal variations of forest BCS, increasing during the period from 2010 to 2030 and then gradually decreasing (Figure 4a). The increase of BCS would be largely driven by the area expansion and forest growth of young and middle-age forests during 2010−2030 (Table S4) resulting from intensive national afforestation and reforestation practices (Table S2), as well as improved sustainable management of forest resources and environmental conservation initiated in 1998 (Zhang et al., 2000). Forests in the northeastern, southern, and southwestern regions would contribute to 20.9%, 30.7%, and 19.0% of national total of increase in forest BCS between 2010 and 2030, respectively. Due to the concurrent decrease in the increasing rates of forest area and biomass carbon density for different age classes of forests (Table S4), forest BCS in the northern, northeastern, northwestern, southern, and southwestern regions would decrease from 29.31, 41.56, 17.88, 55.82, and 43.38 Tg C year−1 in 2030 to 18.34, 25.21, 13.55, 40.07, and 33.76 Tg C year−1 in 2050, respectively. In the eastern region, the BCS of forests would significantly increase from 27.06 to 44.82 Tg C year−1 during 2010−2020, and decrease to 28.01 Tg C year−1 in 2050. From 2010 to 2050, the BCS of forests was estimated to increase in provinces accounting for 66.8% of the national total forest area (Figure 4b). The BCS increase would occur mainly in southern provinces with large forest areas, such as the Guangxi, Sichuan, Hunan, Guangdong, Jiangxi, and Tibet provinces (Table S5), with values of 8.65, 5.81, 5.31, 4.81, 4.14, and 2.88 Tg C year−1, respectively. During 2010−2050, forest BCS would decrease in most eastern provinces, such as Anhui, Fujian, Jiangsu, and Zhejiang, and northern provinces such as Henan, Inner Mongolia, Jilin, and Qinghai. The largest decrease of 6.38 Tg C year−1 in the BCS of forests would occur in Inner Mongolia. The Liaoning province would be an exception—the BCS of forests there would increase by 3.87 Tg C year−1.

4. Discussions

4.1. Methodology for Forest BCS Estimation

In this study, the BCS by forests was estimated according to biomass carbon stock retrieved from the refined CBEF model and biomass–age relationships. The latter is of particular importance to BCS estimation. The biomass–age relationship has been a widely used method for estimating forest BCS at the national and regional scales [21,24,52,53]. Early studies indicated that the biomass–age relationship could be described using a logistic [24,54], Richards [55,56] or Korf [43] function. It is hard to establish biomass–age relationships using a uniform expression at present. Consequently, five types of stand growth models (Table 2) were separately selected to fit the relationship between forest biomass and stand age. The biomass–age relationship changes depending on region and forest type, which should be kept in mind.
Our estimated forest BCS at the decadal and annual scales was comparable to the national mean value estimated using the FID-based relationship between forest biomass and stand age by Xu et al. [21]. The estimate output from this study gives more detailed information on spatial and temporal variations of forest BCS because of the combined use of information from FID and field observations, and biomass–age relationships optimized for major forest types in different regions. The future rate of forest BCS, to a large extent, might depend on disturbances and stand age [6,19]. BCS estimated from FID-based forest age and biomass–age relationships, which contained information on historical forest disturbance, might have high accuracy [21]. However, this method may not be applicable in other areas since the long-term spatially distributed FID used to establish the biomass–age relationship is not always available. With the consideration of both data availability and the urgent requirement for reliable BCS estimation of China’s forests, the eighth national FID of 2009−2013 was first used to predict forest BCS in combination with the biomass-age relationship obtained from field observations. To some extent, this method can alleviate the bias in forest BCS estimation compared with methods using some models without consideration of forest age, since FID-based stand age is embedded within the current framework of stand growth models. In addition, it can be conducted with limited observations of forest biomass and stand age. Therefore, this method can be widely used for many regional applications. The BCS estimates in this case are for the decadal intervals from 2010 to 2050. In the future, this approach might be utilized to estimate regional- and national-scale forest BCS on a yearly basis if annual newly planted forest areas are available.

4.2. Uncertainties in BCS Estimations

This study was conducted using the national FID of 2009−2013 and the relationships between forest biomass and stand age retrieved from field observations. We attempted to quantitatively explore the dynamics of BCS in China’s forests from 2010 to 2050. Biomass carbon stock in the baseline year 2010 was estimated using the CBEF model, which was firstly developed by Fang et al. [42] and then refined by Zhang et al. [41], and it is very sensitive to model parameters. Based on the refined CBEF model parameters, estimates of forest biomass carbon stock in China could be improved in comparison with early studies [14,41]. However, the study still contains some uncertainties. Biomass carbon stock was estimated using the refined empirical relationships between biomass and volume, which were developed using available field measurements. If the number of samples used to establish a biomass model for a forest type is inadequate, the estimation error might reach about 10% [57]. We attempted to collect almost all data published in recent decades in China. However, the number of plots is still too small for some forest types, such as Acacia, Phoebe, and Sassafras [41]. In addition, the field data might be collected using different methods, dates, and plot sizes. Uncertainties in field biomass data would be propagated into estimated carbon stocks.
Stand growth models are generally applicable for quantifying age-related forest biomass dynamics at plot or local scales [53], in which changes in species composition, stand age, site quality, and stand density are relatively small. Thus, species-specific growth models should only be used in a small region, and make predictions for limited time periods. Here, the optimal species-specific growth models of major forest types, which account for large area proportions (96.0%) of China’s forests, were parameterized for different regions. Forest BCS predicted with biomass–age relationships needs adequate and representative field measurements. In this study, relationships from a neighboring region were adopted if the relationship could not be developed for a certain forest type in a region due to the unavailability of field data. Forest-growth conditions might spatially differ. One unique biomass–age relationship used for a large region might result in uncertainties in forest BCS estimation. In addition, the space-for-time substitution was employed to establish the biomass–age relationship for each forest type because of a lack of long-term data. This approximation could lead to a bias in estimated biomass carbon stocks, since assumptions that the spatial and temporal variations in forest biomass in response to stand age are equivalent [58,59,60].
Estimates of FID-based stand age directly represent the dynamics of forest age induced by both disturbed and nondisturbed factors [19,27], and were used as benchmarks to predict forest BCS in combination with the biomass–age relationship. The national FID does not include age observations per se. Forest-stand age was estimated as the median value of each age class for given forest types in a province. This is a widely used method for estimating mean forest age from national FID. However, if forest ages are not evenly distributed within individual age classes, the mean forest age calculated in this way might include uncertainties.
Uncertainties also arise from several assumptions used to estimate forest BCS. First, the forest density index (Equation (1)) was used to correct possible biases in biomass carbon stocks estimated using the biomass–age relationships with the assumption that forest density index would change marginally during the study period. This assumption is not always realistic. Second, we assumed that neither clear-cuts nor die-offs would occur, and all existing forests would naturally grow. This simplification ignores the impacts of disturbances and the stochastic process of recovery. Third, we assigned the area of newly planted forests to each forest type according to the area proportion of planted forests reported by the national FID of 2009−2013. However, many factors would actually hamper future forestation, such as the availability of suitable forest lands, the rate at which plantations can be established, and the long-term sustainability of forestry projects [22,23,24,25,26,27,28,29,30,31,32,33,34]. Furthermore, our current estimation does not consider environmental change factors. Changes in climate, CO2 enrichment, and nitrogen deposition have been shown to affect future forest growth and biomass carbon accumulation [19,24,25], which is difficult to be incorporated into the method used in this study.

4.3. Implications for Future Forest BCS in China

Our nationwide FID and field data provide both an up-to-date estimate of forest BCS in China and a baseline for understanding future dynamics of the terrestrial carbon cycle and climate-change mitigation policies. Within the limits of reported uncertainties, our results suggest that the national forest BCS was estimated to continuously increase between 2010 and 2030, and then gradually decrease for the period of 2030−2050. The increment of forest biomass carbon stock in China was estimated at 7.89 Pg C over the entire study period, with an average annual BCS of 184.04 Tg C year−1. These findings are comparable to values reported by Xu et al. [21], who reported that forest biomass carbon would increase by 7.23 Pg C, and CBS would be 144.56 Tg C year−1 on the basis of FID and biomass–age relationships. However, our estimates were lower than the corresponding values of 13.92 Pg C and 340.00 Tg C year−1 reported by He et al. [24] with a forest carbon sequestration model. If the BCS of four other carbon pools (dead wood, litter, soil organic carbon, and harvested wood products) are also considered, the whole forest sector would act as a carbon sink of about 291.26 Tg C year−1 from 2010 to 2050 with the ratios of different carbon pools in China’s forests following Pan et al. [2]. This forest carbon sink could offset 10.4% of the national contemporary CO2 emissions from fossil fuel and industry (~2.81 Pg C year−1 in 2017) [61]. The projected increase in future BCS indicates that forests have high carbon-uptake capacity to mitigate atmospheric CO2 buildup from deforestation and fossil-fuel combustion in China.
In this study, we quantified the BCS of China’s forests in the near future, integrating the effects of stand development, human activities, and historic factors. A large BCS is directly associated with areal expansion and forest growth from large-scale afforestation and reforestation, and ecological restoration programs. According to the China Forestry Sustainable Development Strategy Research Group [51], the quantity and quality of forests in China are expected to enter into a steady development stage, which implies that the potential for the increase of BCS might be limited. Under the assumption that the planted forest area from 2009 to 2013 could be used as a proxy of future forest area expansion, the total area of newly planted forests would be 0.53 × 10⁸ ha between 2010 and 2050 (Table S2). However, the area of wastelands currently available for forest development in China is only 0.39 × 10⁸ ha (about half of the preserved plantation area) [35]. About two-thirds of these wastelands are located in the vast northwestern and southwestern regions, where plantations are restricted by cold and drought climate conditions, and have low survival rates. Therefore, enhancing BCS through forestation in the future might become more difficult, because the newly planted forest area would markedly decrease after 2030. Compared with human impact, restoration and conservation practices may enable carbon gains to continually increase and compensate for the ecological footprint in China’s forest ecosystems [11].
Stand age is a major determinant of forest biomass carbon stock [7,14,53], and, thus, also forest BCS [24,25,62]. Therefore, information on the stage of stand development should be included in the prediction of future forest BCS. It was found here that forest biomass carbon stock accumulated rapidly at a young stand age and gradually saturated at later stages (Figure 3), as indicated in other studies [24,53]. In contrast, forest BCS was predicted to decline with stand age as forests grow following ongoing afforestation and reforestation without mortality and harvest. Mature and overmature forests could continue to accumulate carbon with stand age, and play an important role in the carbon cycle despite the decreasing growth efficiency. This conclusion is consistent with previous studies [3,63]. The increases in forest area and biomass carbon density through ecological restoration projects and sustainable forest managements in the next four decades would make forests in different age classes function as carbon sinks in China (Figure 3). Most of the forests are young and middle-aged, and have significant potential in future carbon sequestration. Middle-aged and mature forests have high biomass carbon density. If young and middle-aged forests could evolve into mature forests, large amounts of carbon will be sequestered by China’s forests in the future. Therefore, afforestation and reforestation, as well as increasing forest productivity, would be efficient methods to maintain both the carbon amount and annual rate of carbon uptake.

5. Conclusions

In this study, the BCS dynamics for China’s forests from 2010 to 2050 were systematically assessed using the national FID of 2009−2013 and the biomass–age relationships, optimized using field observations for major forest types in each region of China. The following conclusions could be drawn:
(1) The biomass–age relationships are well-fitted using field observations with statistical significance of R2 values above 0.70 for most forest types. These relationships can be best described using mostly the logistic function. Forest biomass increases quickly at a young stand age, and gradually saturates when forests become mature. For forest types in 96.0% of the national forest area, their current ages are much younger than the ages at which forest biomass peaks, indicating strong BCS potential in China’s forests.
(2) The national BCS would increase from 130.90 Tg C year−1 in 2010 to 230.15 Tg C year−1 in 2030, and then decrease to 159.94 Tg C year−1 by 2050. Forests in China function as an averaged biomass carbon sink of 184.04 Tg C year−1 in the next four decades, mainly driven by the increases in forest area and biomass carbon density. Young and middle-aged forests would contribute 65.35 and 15.38 Tg C year−1 of this BCS increase, respectively, during the period of 2010−5050. The decreased BCS of premature, mature, and overmature forests would counteract 187.8% of BCS increase of younger forests.
(3) Forest BCS would increase in all but the northern region during the study period. The southern region holds the largest increase of 14.72 Tg C year−1 in BCS, followed by the southwestern, northeastern, northwestern, and eastern regions. The area expansion and forest growth of young and middle-aged forests from afforestation and reforestation are the major contributors to the BCS increase in these regions. The slowdown in the increases of forest area and biomass carbon density for different age classes of forests is primarily responsible for the BCS reduction in the northern region.
This study is an up-to-date estimate of future BCS by China’s forests based on FID and field data. Our results provide new insights to the characteristics of forest BCS increase in the next four decades and highlight the importance of explicit representation of forest age in analyzing regional and national carbon balance. They are fundamental for the validation and parameterization of carbon models in China. However, it should be kept in mind that there are still uncertainties in our estimates, largely due to inadequate field observations and simplified estimation parameters, without consideration of spatial variability of forest ages, and the application of the biomass–age relationships at large scales. Future studies may incorporate high-quality data into the current framework of stand growth models to reduce these uncertainties.

Supplementary Materials

The following are available online at https://www.mdpi.com/1999-4907/9/11/689/s1: Table S1. Classification of forest ages for different forest types in China; Table S2. Projected forest area by 2050 in China; Table S3. Projected area of newly planted forests of different forest types during the period of 2010−2050 in China; Table S4. Projected forest area, biomass carbon stock, carbon density, and BCS for five different age classes between 2010 and 2050 in six regions of China; Table S5. Projected forest area, biomass carbon stock and carbon density between 2010 and 2050 in different provinces of China.

Author Contributions

All authors contributed to the design and development of this manuscript. C.Z. carried out the research and prepared the first draft of the manuscript; W.J. and J.C. were responsible for manuscript proofreading; M.F. and M.W. collected the field data; X.C., T.W., and X.W. analyzed the data.

Funding

This study is supported financially by the National Natural Science Foundation of China and Shandong (41601054 and ZR2016DP05), and the National Key R and D Program of China (2016YFA0600202).

Acknowledgments

We gratefully acknowledge the constructive and thoughtful comments of the referees and the editor, which helped to greatly improve the quality of manuscript.

Conflicts of Interest

The authors declare no conflict of interest.

References

  1. Bonan, G.B. Forests and climate change: Forcings, feedbacks, and the climate benefits of forests. Science 2008, 320, 1444–1449. [Google Scholar] [CrossRef] [PubMed]
  2. Pan, Y.; Birdsey, R.A.; Fang, J.Y.; Houghton, R.; Kauppi, P.E.; Kurz, W.A.; Phillips, O.L.; Shvidenko, A.; Lewis, S.L.; Canadell, J.G.; et al. A large and persistent carbon sink in the world’s forests. Science 2011, 333, 988–993. [Google Scholar] [CrossRef] [PubMed]
  3. Liu, Y.C.; Yu, G.R.; Wang, Q.F.; Zhang, Y.J. How temperature, precipitation and stand age control the biomass carbon density of global mature forests. Glob. Ecol. Biogeogr. 2014, 23, 323–333. [Google Scholar] [CrossRef]
  4. Grassi, G.; House, J.; Dentener, F.; Federici, S.; den Elzen, M.; Penman, J. The key role of forests in meeting climate targets requires science for credible mitigation. Nat. Clim. Chang. 2017, 7, 220–226. [Google Scholar] [CrossRef]
  5. Piao, S.L.; Huang, M.T.; Liu, Z.; Wang, X.H.; Ciais, P.; Canadell, J.G.; Wang, K.; Bastos, A.; Friedlingstein, P.; Houghton, R.A.; et al. Lower land-use emission responsible for increased net land carbon sink during the slow warming period. Nat. Geosci. 2018, 11, 739–743. [Google Scholar] [CrossRef]
  6. Pan, Y.; Birdsey, R.A.; Phillips, O.L.; Jackson, R.B. The structure, distribution, and biomass of the world’s forests. Annu. Rev. Ecol. Evol. Syst. 2013, 44, 593–622. [Google Scholar] [CrossRef]
  7. Volkova, L.; Roxburgh, S.H.; Weston, C.J.; Benyon, R.G.; Sullivan, A.L.; Polglase, P.J. Importance of disturbance history on net primary productivity in the world’s most productive forests and implications for the global carbon cycle. Glob. Chang. Biol. 2018, 24, 4293–4303. [Google Scholar] [CrossRef] [PubMed]
  8. Forkel, M.; Carvalhais, N.; Rodenbeck, C.; Keeling, R.; Heimann, M.; Thonicke, K.; Zaehle, S.; Reichstein, M. Enhanced seasonal CO2 exchange caused by amplified plant productivity in northern ecosystems. Science 2016, 351, 696–699. [Google Scholar] [CrossRef] [PubMed]
  9. Zhang, X.Z.; Wang, Y.P.; Peng, S.S.; Rayner, P.J.; Ciais, P.; Silver, J.D.; Piao, S.L.; Zhu, Z.C.; Lu, X.J.; Zheng, X.G. Dominant regions and drivers of the variability of the global land carbon sink across timescales. Glob. Chang. Biol. 2018, 24, 3954–3968. [Google Scholar] [CrossRef] [PubMed]
  10. Law, B.E.; Hudiburg, T.W.; Berner, L.T.; Kent, J.J.; Buotte, P.C.; Harmon, M.E. Land use strategies to mitigate climate change in carbon dense temperate forests. Proc. Natl. Acad. Sci. USA 2018, 115, 3663–3668. [Google Scholar] [CrossRef] [PubMed] [Green Version]
  11. Tang, X.L.; Zhao, X.; Bai, Y.F.; Tang, Z.Y.; Wang, W.T.; Zhao, Y.C.; Wan, H.W.; Xie, Z.Q.; Shi, X.Z.; Wu, B.F.; et al. Carbon pools in China’s terrestrial ecosystems: New estimates based on an intensive field survey. Proc. Natl. Acad. Sci. USA 2018, 115, 4021–4026. [Google Scholar] [CrossRef] [PubMed] [Green Version]
  12. Crouzeilles, R.; Curran, M.; Ferreira, M.S.; Lindenmayer, D.B.; Grelle, C.E.; Benayas, J.M.R. A global meta-analysis on the ecological drivers of forest restoration success. Nat. Commun. 2016, 7, 11666. [Google Scholar] [CrossRef] [PubMed] [Green Version]
  13. Saatchi, S.S.; Harris, N.L.; Sandra, B.; Michael, L.; Mitcard, E.T. A Benchmark map of forest carbon stocks in tropical regions across three continents. Proc. Natl. Acad. Sci. USA 2011, 108, 9899–9904. [Google Scholar] [CrossRef] [PubMed]
  14. Zhang, C.H.; Ju, W.M.; Chen, J.M.; Wang, X.Q.; Yang, L.; Zheng, G. Disturbance-induced reduction of biomass carbon sinks of China’s forests in recent years. Environ. Res. Lett. 2015, 10, 114021. [Google Scholar] [CrossRef] [Green Version]
  15. Kurz, W.A.; Stinson, G.; Rampley, G.J.; Dymond, C.C.; Neilson, E.T. Risk of natural disturbances makes future contributions of Canada’s forests to the global carbon cycle highly uncertain. Proc. Natl. Acad. Sci. USA 2008, 105, 1551–1555. [Google Scholar] [CrossRef] [PubMed]
  16. Loudermilk, E.L.; Scheller, R.M.; Weisberg, P.J.; Yang, J.A.; Dilts, T.E.; Karam, S.L.; Skinner, C. Carbon dynamics in the future forest: The importance of long-term successional legacy and climate-fire interactions. Glob. Chang. Biol. 2013, 19, 3502–3515. [Google Scholar] [CrossRef] [PubMed]
  17. Dai, E.F.; Wu, Z.; Ge, Q.S.; Xi, W.M.; Wang, X.F. Predicting the responses of forest distribution and aboveground biomass to climate change under RCP scenarios in southern China. Glob. Chang. Biol. 2016, 22, 3642–3661. [Google Scholar] [CrossRef] [PubMed]
  18. Jin, W.C.; He, H.S.; Thompson, F.R., III; Wang, W.J.; Fraser, J.S.; Shifley, S.R.; Hanberry, B.B.; Dijak, W.D. Future forest aboveground carbon dynamics in the central United States: The importance of forest demographic processes. Sci. Rep. 2017, 7, 41821. [Google Scholar] [CrossRef] [PubMed]
  19. Zhang, Y.; Yao, Y.; Wang, X.; Liu, Y.; Piao, S. Mapping spatial distribution of forest age in China. Earth Space Sci. 2017, 4, 108–116. [Google Scholar] [CrossRef] [Green Version]
  20. Tharammal, T.; Bala, G.; Narayanappa, D.; Nemani, R. Potential roles of CO2 fertilization, nitrogen deposition, climate change, and land use and land cover change on the global terrestrial carbon uptake in the twenty-first century. Clim. Dyn. 2018. [Google Scholar] [CrossRef]
  21. Xu, B.; Guo, Z.D.; Piao, S.L.; Fang, J.Y. Biomass carbon stocks in China’s forests between 2000 and 2050: A prediction based on forest biomass-age relationships. Sci. China Life Sci. 2010, 53, 776–783. [Google Scholar] [CrossRef] [PubMed]
  22. Huang, L.; Liu, J.Y.; Shao, Q.Q.; Xu, X.L. Carbon sequestration by forestation across China: Past, present, and future. Renew. Sustain. Energy Rev. 2012, 16, 1291–1299. [Google Scholar] [CrossRef]
  23. Hu, H.; Wang, S.; Guo, Z.; Xu, B.; Fang, J.Y. The stage-classified matrix models project a significant increase in biomass carbon stocks in China’s forests between 2005 and 2050. Sci. Rep. 2015, 5, 11203. [Google Scholar] [CrossRef] [PubMed] [Green Version]
  24. He, N.P.; Wen, D.; Zhu, J.X.; Tang, X.L.; Xu, L.; Zhang, L.; Hu, H.F.; Huang, M.; Yu, G.R. Vegetation carbon sequestration in Chinese forests from 2010 to 2050. Glob. Chang. Biol. 2017, 23, 1575–1584. [Google Scholar] [CrossRef] [PubMed]
  25. Yao, Y.T.; Piao, S.L.; Wang, T. Future biomass carbon sequestration capacity of Chinese forests. Sci. Bull. 2018, 63, 1108–1117. [Google Scholar] [CrossRef]
  26. Keenan, T.F.; Davidson, E.; Moffat, A.M.; Munger, W.; Richardson, A.D. Using model-data fusion to interpret past trends, and quantify uncertainties in future projections, of terrestrial ecosystem carbon cycling. Glob. Chang. Biol. 2012, 18, 2555–2569. [Google Scholar] [CrossRef] [Green Version]
  27. Zhang, C.H.; Ju, W.M.; Chen, J.M.; Li, D.; Wang, X.; Fan, W.; Li, M.; Zan, M. Mapping forest stand age in China using remotely sensed forest height and observation data. J. Geophys. Res. Biogeosci. 2014, 119, 1163–1179. [Google Scholar] [CrossRef] [Green Version]
  28. Curtis, P.S.; Gough, C.M. Forest aging, disturbance and the carbon cycle. New Phytol. 2018, 219, 1188–1193. [Google Scholar] [CrossRef] [PubMed]
  29. Wang, S.Q.; Zhou, L.; Chen, J.M.; Ju, W.M.; Feng, X.F.; Wu, W.X. Relationships between net primary productivity and stand age for several forest types and their influence on China’s carbon balance. J. Environ. Manag. 2011, 92, 1651–1662. [Google Scholar] [CrossRef] [PubMed] [Green Version]
  30. Food and Agriculture Organization of the United Nations (FAO). Global Forest Resources Assessment 2010: Main Report; FAO Forestry Paper 163; FAO: Rome, Italy, 2010. [Google Scholar]
  31. Peng, S.S.; Piao, S.L.; Zeng, Z.Z.; Ciais, P.; Zhou, L.M.; Li, L.Z.X.; Myneni, R.B.; Yin, Y.; Zeng, H. Afforestation in China cools local land surface temperature. Proc. Natl. Acad. Sci. USA 2014, 111, 2915–2919. [Google Scholar] [CrossRef] [PubMed] [Green Version]
  32. Piao, S.L.; Fang, J.Y.; Ciais, P.; Peylin, P.; Huang, Y.; Sitch, S.; Wang, T. The carbon balance of terrestrial ecosystems in China. Nature 2009, 458, 1009–1013. [Google Scholar] [CrossRef] [PubMed]
  33. Fang, J.Y.; Guo, Z.D.; Hu, H.F.; Kato, T.; Muraoka, H.; Son, Y. Forest biomass carbon sinks in East Asia, with special reference to the relative contributions of forest expansion and forest growth. Glob. Chang. Biol. 2014, 20, 2019–2030. [Google Scholar] [CrossRef] [PubMed]
  34. Lu, F.; Hu, H.; Sun, W.; Zhu, J.; Liu, G.; Zhou, W.; Zhang, Q.; Shi, P.; Liu, X.; Wu, X.; et al. Effects of national ecological restoration projects on carbon sequestration in China from 2001 to 2010. Proc. Natl. Acad. Sci. USA 2018, 115, 4039–4044. [Google Scholar] [CrossRef] [PubMed] [Green Version]
  35. Chinese Ministry of Forestry. Forest Resource Statistics of China (2009–2013); Department of Forest Resource and Management, Chinese Ministry of Forestry: Beijing, China, 2014. [Google Scholar]
  36. Yuan, W.; Cai, W.; Chen, Y.; Liu, S.; Dong, W.; Zhang, H.; Yu, G.; Chen, Z.; He, H.; Guo, W.; et al. Severe summer heatwave and drought strongly reduced carbon uptake in Southern China. Sci. Rep. 2016, 6, 18813. [Google Scholar] [CrossRef] [PubMed] [Green Version]
  37. Wang, J.; Dong, J.; Yi, Y.; Lu, G.; Oyler, J.; Smith, W.K.; Zhao, M.; Liu, J.; Running, S. Decreasing net primary production due to drought and slight decreases in solar radiation in China from 2000 to 2012. J. Geophys. Res. Biogeosci. 2017, 122, 261–278. [Google Scholar] [CrossRef] [Green Version]
  38. Deng, L.; Liu, S.G.; Kim, D.G.; Peng, C.H.; Sweeney, S.; Shangguan, Z.P. Past and future carbon sequestration benefits of China’s grain for green program. Glob. Environ. Chang. 2017, 47, 13–20. [Google Scholar] [CrossRef]
  39. Fang, J.Y.; Yu, G.R.; Liu, L.L.; Hu, S.J.; Chapin, F.S. Climate change, human impacts, and carbon sequestration in China. Proc. Natl. Acad. Sci. USA 2018, 115, 4015–4020. [Google Scholar] [CrossRef] [PubMed] [Green Version]
  40. Pregitzer, K.S.; Euskirchen, E.S. Carbon cycling and storage in world forests: Biome patterns related to forest age. Glob. Chang. Biol. 2004, 10, 2052–2077. [Google Scholar] [CrossRef]
  41. Zhang, C.H.; Ju, W.M.; Chen, J.M.; Zan, M.; Li, D.Q.; Zhou, Y.L.; Wang, X.Q. China’s forest biomass carbon sink based on seven inventories from 1973 to 2008. Clim. Chang. 2013, 118, 933–948. [Google Scholar] [CrossRef]
  42. Fang, J.Y.; Chen, A.P.; Peng, C.H.; Zhao, S.Q.; Ci, L.J. Changes in forest biomass carbon storage in China between 1949 and 1998. Science 2001, 292, 2320–2322. [Google Scholar] [CrossRef] [PubMed]
  43. Wang, B.; Li, M.Z.; Fan, W.Y.; Yu, Y.; Chen, J.M. Relationship between net primary productivity and forest stand age under different site condictions and its implications for regional carbon cycle study. Forests 2018, 9, 5. [Google Scholar] [CrossRef]
  44. Pienaar, L.V.; Turnbull, K.J. The Chapman-Richards generalization of Von Bertalanffy’s growth model for basal area growth and yield in even-aged stands. For. Sci. 1973, 19, 2–22. [Google Scholar]
  45. Ricker, W.E. Growth rates and models. In Fish Physiology, III, Bioenergetics and Growth; Academic Press: New York, NY, USA, 1979; Volume 8, pp. 677–743. [Google Scholar]
  46. Von Gadow, K.; Hui, G. Modeling Forest Development; Faculty of Forest and Woodland Ecology, University of Göttingen: Göttingen, Germany, 1998. [Google Scholar]
  47. Charles, P.W. The Gompertz curve as a growth curve. Proc. Natl. Acad. Sci. USA 1932, 18, 1–8. [Google Scholar]
  48. Zeide, B. Accuracy of equations describing diameter growth. Can. J. For. Res. 1989, 19, 1283–1286. [Google Scholar] [CrossRef]
  49. Wang, Y.F.; Liu, L.; Shangguan, Z.P. Carbon storage and carbon sequestration potential under the Grain for Green Program in Henan Province, China. Ecol. Eng. 2017, 100, 147–156. [Google Scholar] [CrossRef]
  50. Nie, H.; Wang, S.Q.; Zhou, L.; Wang, J.Y.; Zhang, Y.; Deng, Z.W.; Yang, F.T. Carbon sequestration potential of forest vegetation in Jiangxi and Zhejiang provinces based on national forest inventory. Chin. J. Appl. Ecol. 2011, 22, 2581–2588. (In Chinese) [Google Scholar]
  51. China Forestry Sustainable Development Strategy Research Group. General View of China Forestry Sustainable Development Strategy Research; China Forestry Publishing House: Beijing, China, 2002. [Google Scholar]
  52. Sun, X.Y.; Wang, G.X.; Huang, M.; Chang, R.Y.; Ran, F. Forest biomass carbon stocks and variation in Tibet’s carbon-dense forests from 2001 to 2050. Sci. Rep. 2016, 6, 34687. [Google Scholar] [CrossRef] [PubMed] [Green Version]
  53. Zhu, K.; Zhang, J.; Niu, S.L.; Chu, C.J.; Luo, Y.Q. Limits to growth of forest biomass carbon sink under climate change. Nat. Commun. 2018, 9, 2709. [Google Scholar] [CrossRef] [PubMed]
  54. Keith, H.; Mackey, B.; Lindenmayer, D.B. Re-evaluation of forest biomass carbon stocks and lessons from the world’s most carbon-dense forests. Proc. Natl. Acad. Sci. USA 2009, 106, 11635–11640. [Google Scholar] [CrossRef] [PubMed]
  55. Hudiburg, T.; Law, B.; Turner, D.P.; Campbell, J.; Donato, D.; Duane, M. Carbon dynamics of Oregon and Northern California forests and potential land-based carbon storage. Ecol. Appl. 2009, 19, 163–180. [Google Scholar] [CrossRef] [PubMed]
  56. Yu, Y.; Chen, J.M.; Yang, X.; Fan, W.; Li, M.; He, L. Influence of site index on the relationship between forest net primary productivity and stand age. PLoS ONE 2017, 12, e0177084. [Google Scholar] [CrossRef] [PubMed]
  57. Smith, J.E.; Heath, L.S.; Jenkens, J.C. Forest Tree Volume to Biomass Models and Estimates for Live and Standing Dead Trees of U.S. Forest; General Technical Report NE-298; U.S. Department of Agriculture, Forest Service: Newtown Square, PA, USA, 2002; p. 57. [Google Scholar]
  58. Johnson, E.A.; Miyanishi, K. Testing the assumptions of chronosequences in succession. Ecol. Lett. 2008, 11, 419–431. [Google Scholar] [CrossRef] [PubMed]
  59. Poorter, L.; Bongers, F.; Aide, T.M.; Zambrano, A.M.A.; Balvanera, P.; Becknell, J.M.; Boukili, V.; Brancalion, P.H.S.; Broadbent, E.N.; Chazdon, R.L.; et al. Biomass resilience of Neotropical secondary forests. Nature 2016, 530, 211–214. [Google Scholar] [CrossRef] [PubMed]
  60. Ma, J.; Xiao, X.M.; Bu, R.C.; Doughty, R.; Hu, Y.M.; Chen, B.Q.; Li, X.P.; Zhao, B. Application of the space-for-time substitution method in validating long-term biomass predictions of a forest landscape model. Environ. Model. Softw. 2017, 94, 127–139. [Google Scholar] [CrossRef]
  61. Le Quéré, C.; Andrew, R.M.; Friedlingstein, P.; Sitch, S.; Pongratz, J.; Manning, A.C.; Korsbakken, J.I.; Peters, G.P.; Canadell, J.G.; Jackson, R.B.; et al. Global Carbon Budget 2017. Earth Syst. Sci. Data 2018, 10, 405–448. [Google Scholar] [CrossRef] [Green Version]
  62. Zhou, L.; Wang, S.Q.; Zhou, T.; Chi, Y.G.; Dai, M. Carbon dynamics of China’s forests during 1901–2010: The importance of forest age. Sci. Bull. 2016, 6, 2064–2073. [Google Scholar]
  63. Luyssaert, S.; Schulze, E.D.; Börner, A.; Knohl, A.; Hessenmöller, D.; Law, B.E.; Ciais, P.; Grace, J. Old-growth forests as global carbon sinks. Nature 2008, 455, 213–215. [Google Scholar] [CrossRef] [PubMed]
Figure 1. Distributions of forest regions and plots in China. (a) Forest regions following Fang et al. [42]; (b) geographical distribution of the 3543 forest plots used in this study. The northeastern region includes Liaoning (LN), Jilin (JL), and Heilongjiang (HLJ); the northern region includes Beijing (BJ), Tianjin (TJ), Hebei (HB), Shanxi (SX), and Inner Mongolia (IM); the eastern region includes Shanghai (SH), Jiangsu (JS), Zhejiang (ZJ), Anhui (AH), Fujian (FJ), Jiangxi (JX), and Shandong (SD); the southern region includes Henan (HeN), Hubei (HuB), Hunan (HuN), Guangdong (GD), Guangxi (GX), and Hainan (HN); the southwestern region includes Chongqing (CQ), Sichuan (SC), Guizhou (GZ), Yunnan (YN), and Tibet; the northwestern region includes Shannxi (SNX), Gansu (GS), Qinghai (QH), Ningxia (NX), and Xinjiang (XJ).
Forests 09 00689 g001
Figure 2. Fitted biomass–age relationships of major forest types in different regions of China. C, E, N, NE, NW, S, and SW are abbreviations for China, and the eastern, northern, northeastern, northwestern, southern, and southwestern regions, respectively. C. and P. are abbreviations of Cunninghamia and Pinus, respectively.
Forests 09 00689 g002
Figure 3. Changes in (a) projected forest area, (b) biomass carbon stock, (c) biomass carbon density, and (d) BCS for five age classes (young, middle-aged, premature, mature, and overmature) during the period from 2010 to 2050 in China. Data in 2010 were estimated from the national forest inventory data of 2009−2013 [14].
Forests 09 00689 g003
Figure 4. Trends of forest BCS in different (a) regions and (b) provinces of China during the period from 2010 to 2050. Data in 2010 were estimated from the national forest inventory data of 2009−2013 [14]. Negative values indicate a carbon source, and vice versa. Province letter designations are stated in the Figure 1 caption.
Forests 09 00689 g004
Table 1. Five types of theoretical stand growth models to describe the relationship between forest biomass and stand age.
Model aFormulaParameter RangeInflect PointSource
RB = a(1 − exp( − bA))1/(1 − c)a, b, c > 0A = ln(1/(1 − c))/b, B = ac1/(1 − c)[44]
MB = a(1 − bexp( − cA))a > 0, 0 < b ≤ 1, c > 0-[45]
LB = a/(1 + exp(bcA))a, b > 0A = b/c, B = 2/a[46]
GB = aexp( − exp(bcA))a, c > 0A = b/c, B = a/e[47]
KB = aexp( − b/Ac)a, b, c > 0A = ((c + 1)/bc)1/c, B = aexp( − (c + 1)/c)[48]
a Model identifications are Richards, R; Mitscherlich, M; Logistic, L; Gompertz, G; and Korf, K. A and B represent stand age (year) and forest biomass (Mg ha−1), respectively. a, b, and c are parameters of stand growth equations that are fitted using field measurements.
Table 2. Fitted parameters of biomass–age relationships for different types of forests in each region of China based on stand growth models a.
Forest TypeRegionModelParametersR2NRMSE
abc
Abies, PiceaE, S, SWG537.53140.72700.00680.7410936.85
N, NER441.22450.00600.16940.862825.70
NWG533.16561.04240.01080.874136.00
AcaciaCL192.11843.12530.85020.732235.77
BetulaE, NW, S, SWL96.74273.72540.14480.744318.91
N, NEK100.509033.79551.17250.74919.09
CasuarinaCL494.58462.36400.09620.853529.29
Cinnamomum, PhoebeCL175.63702.49320.13240.791824.18
Cryptomeria fortunei, Keteleeria, Tsuga chinensisCK221.54206.85360.84360.851211.64
Cunninghamia lanceolataE, N, NEL249.63672.44700.12700.8020230.32
NW, S, SWR256.63360.03220.03380.7510521.62
CypressCL263.60221.96460.02690.734533.79
EucalyptusCG272.31201.14580.12570.658317.97
Fraxinus, Juglans, PhellodendronCR127.41850.05540.20670.741115.73
Hardwoods, SoftwoodsE, N, NE, NWL532.88062.05700.04620.764268.66
SL428.74091.17580.02540.786636.75
SWM459.69660.85360.00590.669828.66
LarixE, NW, S, SWL216.34011.88600.04290.762640.28
NK150.978489.89291.60110.7523125.10
NEG228.13241.33510.07550.8015724.83
Metasequoia glyptostroboidesCL301.28427.23000.43520.712456.17
Mixed broadleaf forestCL296.75741.53240.04340.817235.96
Mixed conifer–broadleaf forestEK431.58717.19350.66340.8911423.25
N, NE, NWL326.41803.30100.11810.791829.03
S, SWL540.76291.55280.00930.802060.84
Mixed coniferous forestCK360.225919.17801.07900.842824.67
Pinus armandi, Pinus densataCR151.74610.06150.60180.824018.76
Pinus densifolia, Pinus sylvestrisCL131.97633.91190.19120.849016.86
Pinus kisiya, Pinus yunnanensisCK190.689645.32591.34040.774527.13
Pinus koraiensisCL233.81903.96610.14840.925322.86
Pinus massonianaE, N, NEK545.24796.76240.46810.7411629.60
NW, SWG326.50930.99800.03520.743019.70
SL309.06342.40080.08390.7414036.39
Pinus tabulaeformisE, S, SWL193.31286.49210.23700.783129.60
NL82.28014.19540.25860.751628.35
NEL312.99784.56990.12240.7817132.20
NWL367.67102.21050.03320.7711435.71
Pinus taedaCK143.520013.14591.26340.861510.93
PopulusE, S, SWL131.50023.04440.42850.749822.27
N, NE, NWL86.01273.62100.23440.895710.31
QuercusE, S, SWL331.06951.21350.02100.841229.88
N, NWG199.19421.01880.01810.699614.55
NEL195.47473.83540.08570.841221.63
SassafrasCL306.48292.03600.06630.861625.37
a Model formulas are listed in Table 1. a, b, and c are model parameters fitted using field measurements at 3055 forest plots for different forest types and regions. RMSE is the root mean square error (Mg ha−1). All statistics are significant at the 0.01 confidence level.
Table 3. Projected forest area, biomass carbon stock (BCS), and carbon sequestration of China’s forests between 2010 and 2050.
YearArea (106 ha)Carbon Stock (Pg C)Carbon Density (Mg C ha−1)BCS (Tg C year−1)
2010 a164.606.9041.90130.90
2020180.409.1150.51221.57
2030196.2111.4158.17230.15
2040207.1213.2063.73178.65
2050218.0214.7967.84159.94
2010–2050 184.04
a Data estimated from the national forest inventory data of 2009−2013. BCS in 2010 was calculated as the change of biomass carbon stocks during the period from 2004−2008 to 2009−2013 divided by the interval between their median years [14].

