Abstract
Plant leaf vein traits are partially the result of adaptation to environmental factors during long-term evolution. For terrestrial plants, leaf veins greatly vary in size and numbers. Parrotia subaequalis (H. T. Chang) R. M. Hao et H. T. Wei, an endangered tree species endemic to China, has a limited distribution, and inhabits both hillsides and valleys. The variations in P. subaequalis leaf venation and vein density in response to environmental changes were examined by collecting samples from all 14 extant populations and analyzing the association between leaf vein density and environmental factors. The results revealed that leaf characteristics were strongly associated with different habitats. A set of vein traits, namely base angle, intercostal tertiary areole development and shape, and free ending veinlet branching, were related to habitat. Significant relationships between vein density and environmental variables (mean annual temperature, mean annual precipitation, and elevation) were doubtless confirmed by this study. These findings indicate that phenotypic plasticity in leaf vein traits is an important ecophysiological characteristic that enables P. subaequalis to adapt to spatiotemporally fluctuating environments. Furthermore, these results also provide important reference data for in-depth studies on the protection strategies used by the tree.
1. Introduction
Environmental conditions in combination with resource availability appear to be key factors involved in determining the distribution and functional characteristics of a species inhabiting a particular region [1]. Higher plants typically cope with varying environmental conditions by altering their tissues and organs [2]. The leaf morphology of angiosperm plants varies across different taxa. The leaves of plants are highly diverse and have various leaf venation patterns. Leaf venation is an important morphological structure, which characterizes the distribution and arrangement of the vein system in the leaves. Leaf veins provide mechanical support to display the leaf towards light, and contain the xylem that transports water and nutrients for photosynthesis and transpiration [3]. Leaf vein characteristics and functional traits jointly reflect the adaptation of a given plant to local environments [4,5,6]. Vein traits, such as vein density (VD), vary considerably across species. VD strongly influences leaf hydraulic conductance (Kleaf), stomatal density, stomatal conductance, and rates of gas exchange per leaf area [7,8]. The leaf hydraulic conductance (Kleaf) represents the capacity of the transport system to deliver water, which affects stomatal opening and photosynthesis [9]. There are individual differences in vein density within the same species when the species is subjected to different environmental conditions. These variations are closely related to plant growth environment, precipitation, and temperature [10,11]. Vein traits are thought to reflect the gas and water exchange conditions at the interface between the leaves and the atmosphere, which are greatly influenced by the climatic factors affecting the leaf [11,12]. Studies focusing on interspecific patterns between plant traits and climatic factors have identified a correlation between leaf vein density and mean annual precipitation (MAP), and dryness of soil water availability can lead to higher leaf venation densities [13].
Phenotypic plasticity is one of two complementary ecological strategies and it refers to the ability of a specific genotype to shape various phenotypes in response to environmental variation [14]. Venation properties have been recognized as a type of phenotypic plasticity that is caused by ontogeny. There have been numerous reports on the correlations between leaf vein density and leaf area [15], epidermal cell size [16], stomatal density [17,18,19], stomatal conductance [19], hydraulic conductance [19,20], and photosynthesis [13]. However, variations in leaf venation and leaf vein density under different environmental conditions have not been widely reported until recently [21], especially for endangered species.
Parrotia subaequalis (H. T. Chang) R. M. Hao et H. T. Wei [22], a rare and endangered deciduous tree endemic to China, belongs to the family Hamamelidaceae [23]. There are two species in this genus (P. subaequalis and Parrotia persica (DC.) C.A. Mey.), and P. subaequalis is an important living fossil angiosperm species that appeared 67 million years ago [22]. Due to the limited geographic range, alternate-year fruit production, serious habitat destruction, and increasing anthropogenic disturbance in the form of timber harvesting have occurred [24]. This species has been listed as a rare and endangered plant in China [25] and as a “plant species with extremely small populations” (PSESP) [23]. P. subaequalis is a tertiary relic plant and occurs in eastern China where there is a disjunct distribution in Anhui, Jiangsu, Henan, and Zhejiang Provinces (Table 1). In eastern China, the annual precipitation is usually over 1000 mm in humid regions. However, P. subaequalis can only grow and thrive within a small range of temperatures and environmental habitats that have a low heterogeneity [5]. Characteristic traits, such as leaf size, leaf length, color, and propagation ability, are highly diverse in P. subaequalis [26]. To date, there have only been a few studies on the P. subaequalis leaf trait responses to climatic stress, and the sensitivity of P. subaequalis leaf morphology to climate change is poorly understood. Therefore, an analysis of leaf morphology under different climatic conditions can increase the understanding of its adaptive strategies, and this knowledge can be used to improve the conservation of P. subaequalis populations.

Table 1.
Details of sample locations and sizes of 14 populations of Parrotia subaequalis (H. T. Chang) R. M. Hao et H. T. Wei from eastern China.
The aim of this study was to test the ecological adaptive strategy of P. subaequalis under different habitats with leaf venation and vein density. The VDs of materials with venation from leaves of 14 extant populations along an elevational gradient from 192–988 m was investigated. The objectives were (1) to determine how the P. subaequalis leaf trait varied under different climatic conditions; (2) to quantify the relationships between leaf trait and climatic factors, such as elevation, mean annual temperature (MAT), and mean annual precipitation (MAP); and (3) to set up a scientific foundation for designing conservation strategies.
2. Materials and Methods
2.1. Leaf Sample Collection
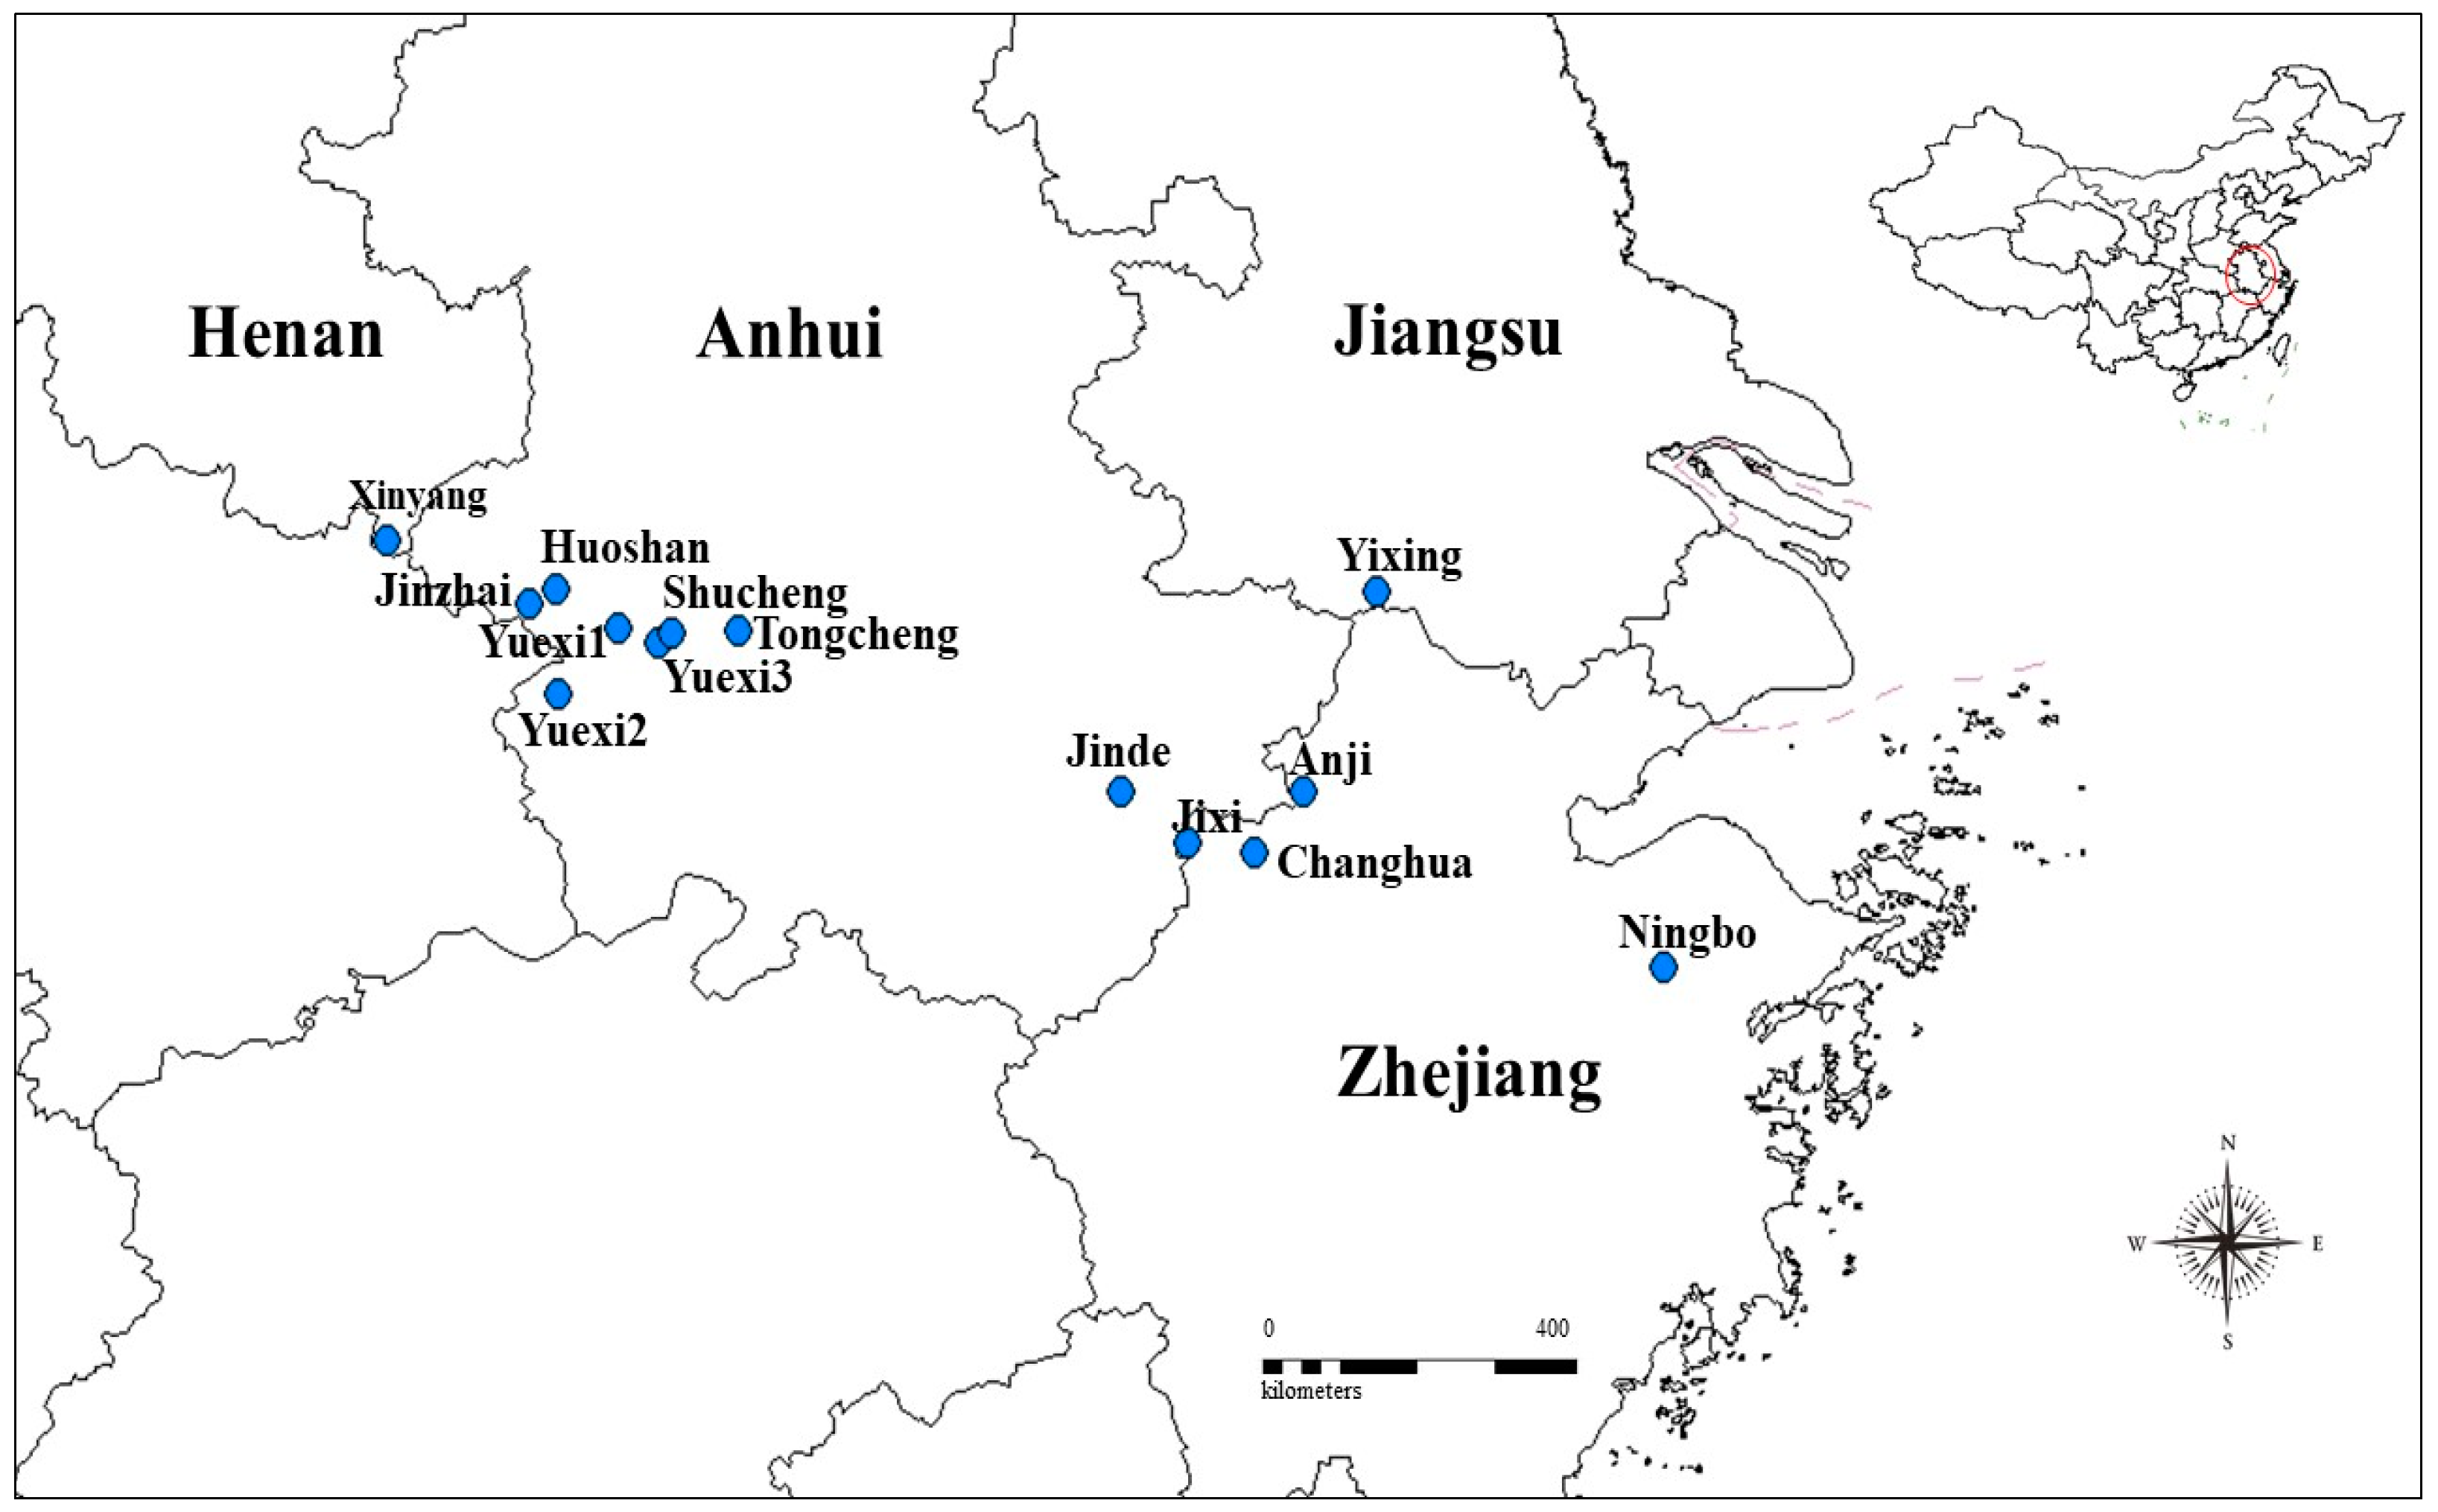
Fresh leaves of P. subaequalis were collected from all 14 known extant populations (Table 1) located across this historic range in eastern China (Figure 1) in July 2016. Five leaves per tree and 10 mature trees per population were selected, and from the four geographical sides of the crown, four outermost branches were randomly harvested. The distance between individual trees was approximately 50 m, which was far enough apart to minimize the possibility of sampling related individual effects [27,28]. Voucher specimens were deposited at Nanjing Forest University (NJFU). Long-term climate data collected over 29 years (1981–2010), including MAT (°C) and MAP (mm), were obtained for each sampling site from the China Meteorological Data Sharing Service System (CMDSSS; www. cdc.cma.gov.cn [29], Table 1).

Figure 1.
Distribution map of the sample Parrotia subaequalis (H. T. Chang) R. M. Hao et H. T. Wei populations across eastern China in 2016. The blue circles represent the extant population sites.
2.2. Leaf Venation
Observations of the leaf venation pattern were carried out according to Zhao et al. (2016) [18], with 15 leaf venation characteristics (Table 2) selected for analysis. Fresh or herbarium leaves were cleared according to Dizeo de Strittmatter (1973) [30] and stained in safranin/80% ethanol. The samples were mounted in DPX (Aldrich Chemical Company, Gillingham, UK) and viewed with the Zeiss Stereo Microscopea Zeiss Axiolab microscope (Carl Zeiss, Oberkochen, Germany), photographed using a color digital imaging camera.
Table 2.
Fifteen leaf venation characteristics of P. subaequalis.
2.3. Vein Density Measurements
To determine the vein density, five leaves per location were selected. The vein density (mm∙mm−2) measurement was performed on cleared leaves [31]. An approximately 1-cm2 adaxial section from the right side of the leaf midrib was excised to determine vein density. In total, 70 images were measured and analyzed using ImageJ image analysis software (National Instituted of Health, NIH, Bethesda, MD, USA) (public software; https://imagej.en.softonic.com/) [32]. Vein density (mm mm−2) was calculated as the sum of the lengths of all vein segments (mm) per unit area (mm2).
2.4. Data Analysis
Leaf venation characters were checked between populations using the unweighted pair-group method with the arithmetic means (UPGMA) procedure in PAST 3.14 software (public software, http://folk.uio.no/ohammer/past). Data analysis between vein density and environmental variables was determined using the linear regression analysis procedure in SPSS 22.0 software (SPSS Inc., Chicago, IL, USA). According to the variation in VD due to elevation, MAT, or MAP, we also obtained a more controlled measurement of the effect of habitat on VD through an analysis of covariance (ANCOVA). For statistical analysis, SigmaPlot 12.5 (Systat Software, Richmond, CA, USA) was employed.
3. Results
3.1. Leaf Venation Clustering Analysis of P. Subaequalis
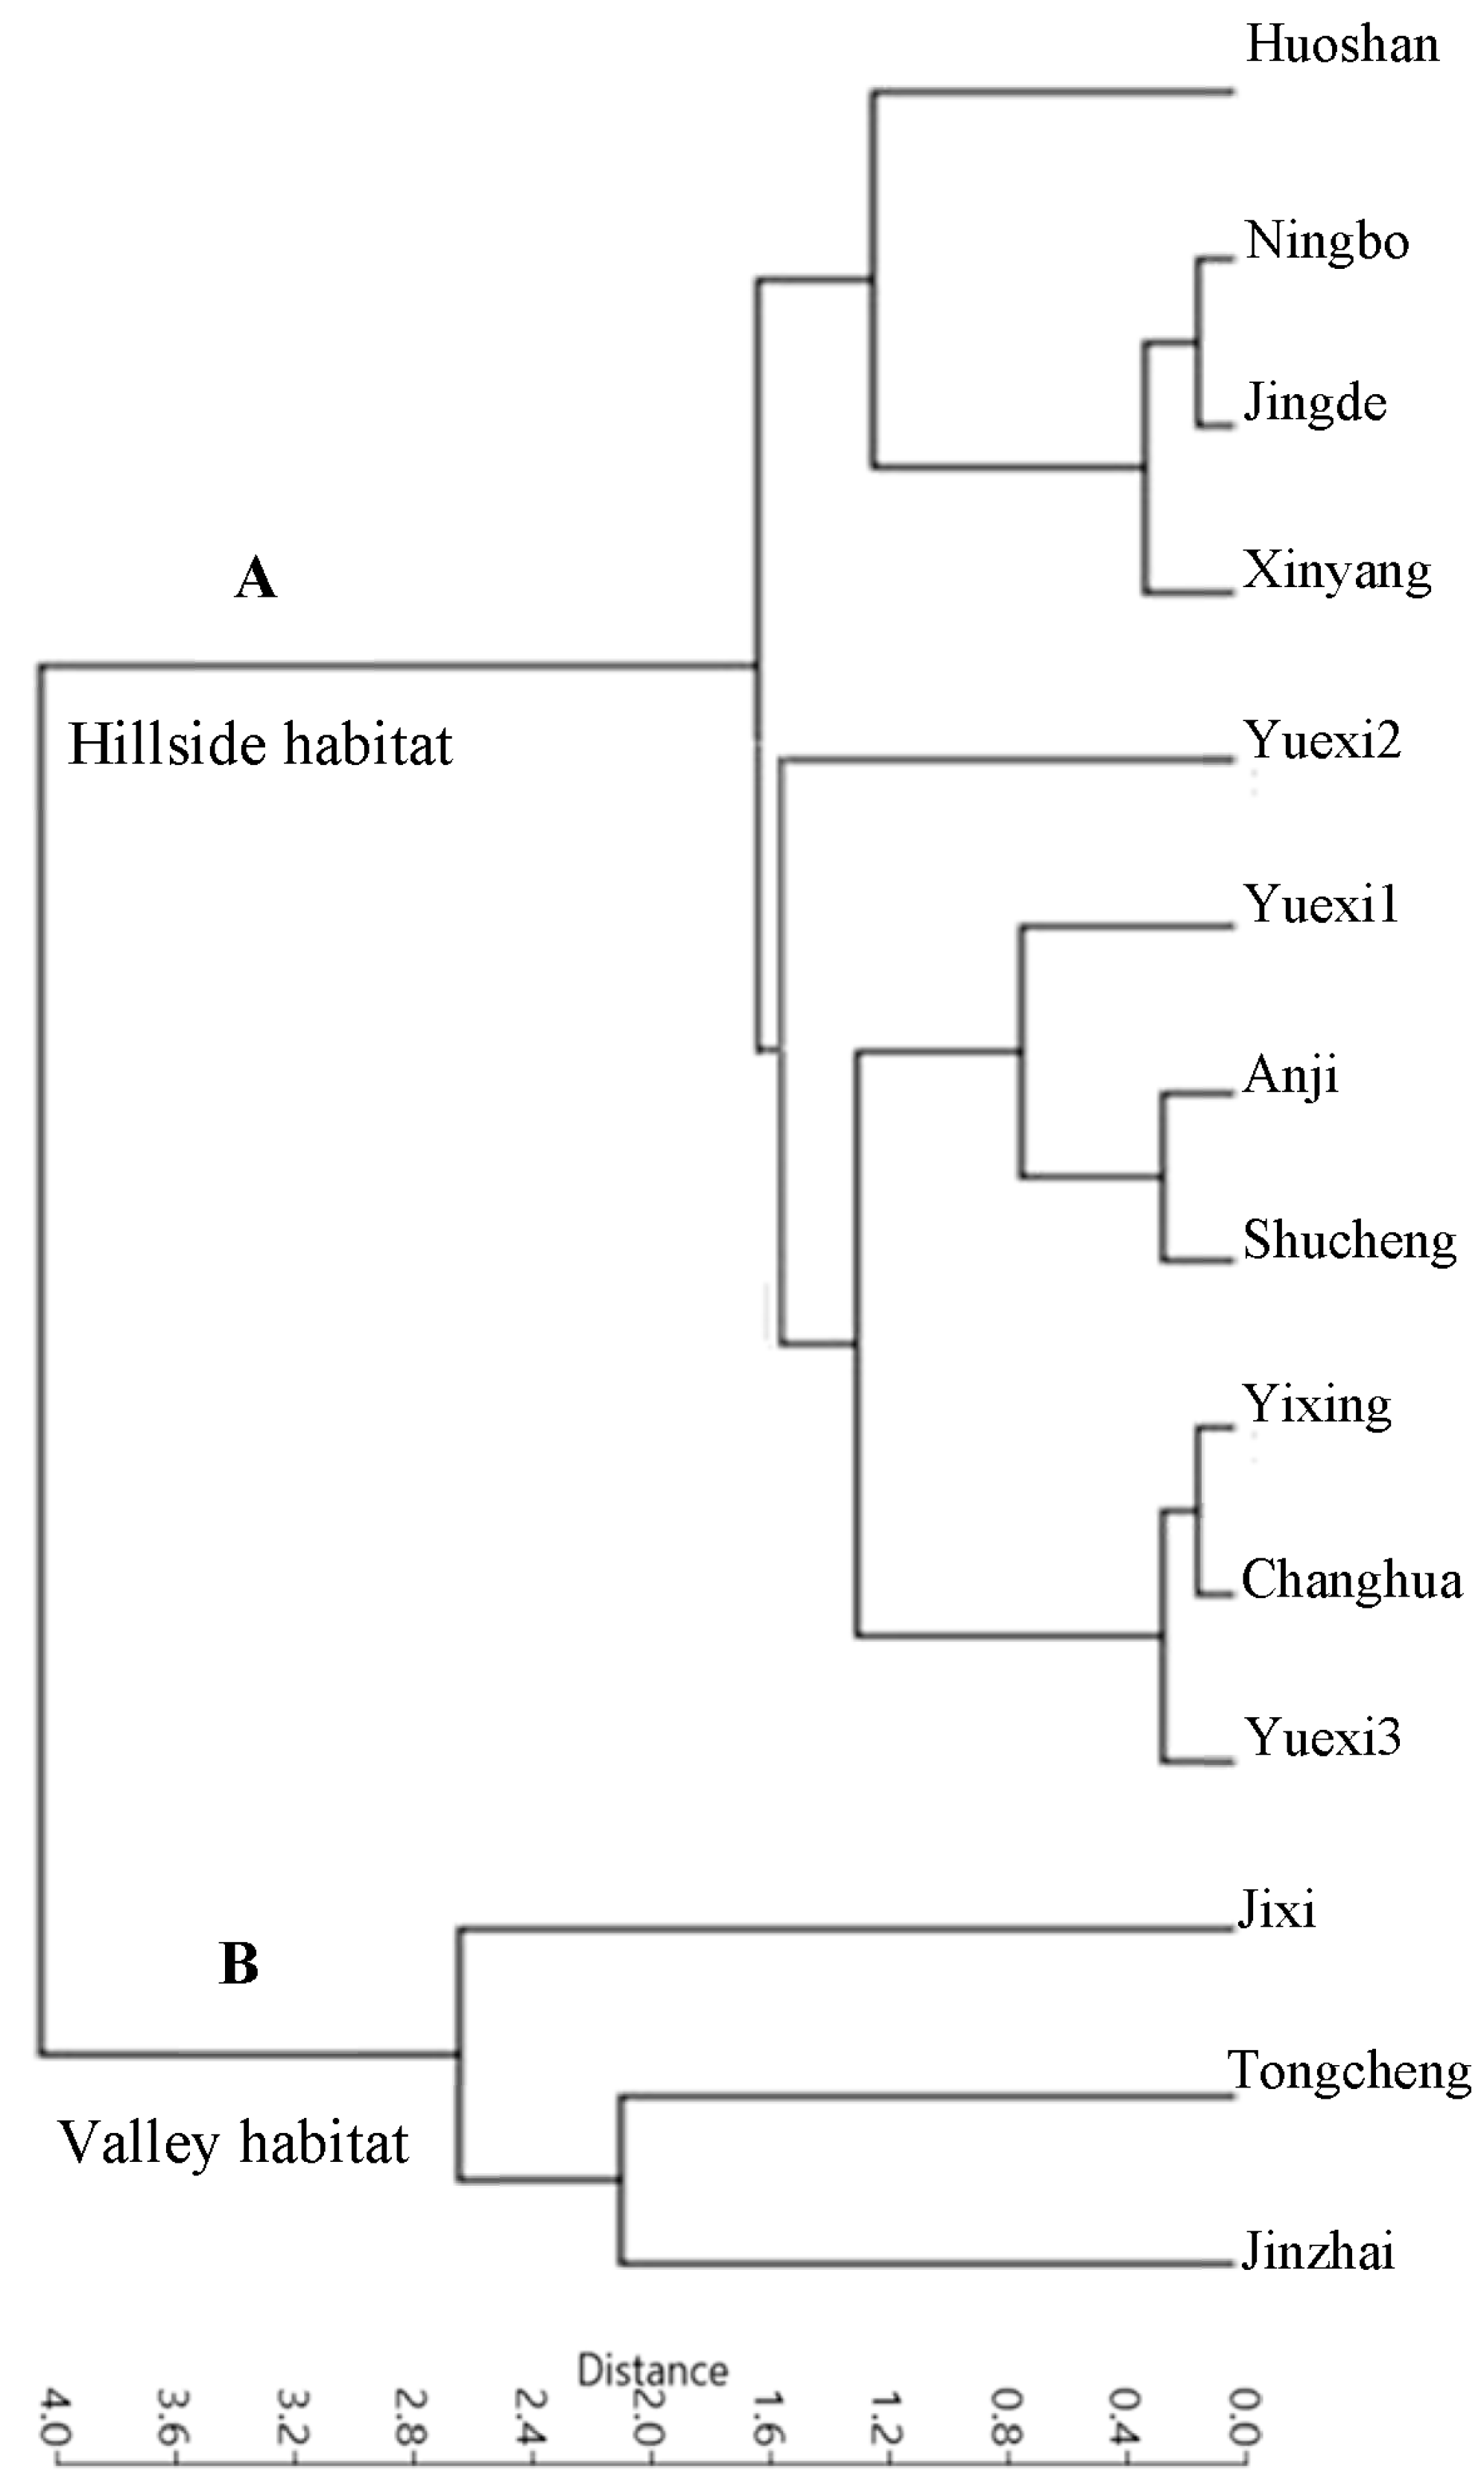
All the taxa analyzed had a basal pinnate primary vein framework, with no naked basal veins, 11–14 basal veins per lobe, and simple agrophic veins (Figure 2A and Figure 3A). The UPGMA clustering analysis of the 15 characteristics showed that the 14 P. subaequalis populations could be divided into two main groups, namely hillside and valley habitat types (Figure 4A,B; Table A1). The hillside habitat type group consisted of eleven populations, such as Ningbo, Shucheng, Yuexi3 (YX3), and Xinyang populations (Table 3, Figure 2A and Figure 5A). This group displayed different freely ending veinlets (FEV) that were similar to those observed in the Yuexi2 (YX2), Xinyang, Huoshan, and remaining populations (Figure 3D–F,H). These populations have an obtuse base angle, quadrangular and pentagonal but rarely triangular areoles, and moderate areole development. The Changhua, Yixing, and Yuexi3 (YX3) populations can be further recognized by two branched FEVs (Table 3). The Jingde and Huoshan populations have three branched FEVs and their areola shapes are more variable (Table 3; Figure 3B,E,I). The Xinyang population has looped marginal ultimate venation (Figure 3C,G).
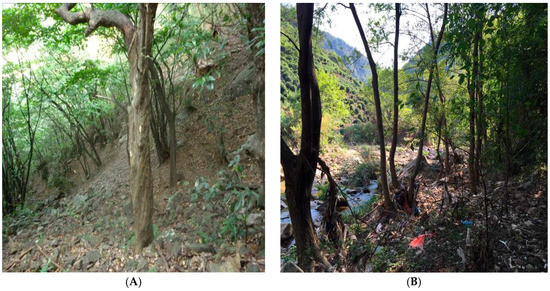
Figure 2.
Habitats of P. subaequalis in eastern China: (A) hillside habitat in Jingde, Anhui; and (B) valley habitat in Tongcheng, Anhui.
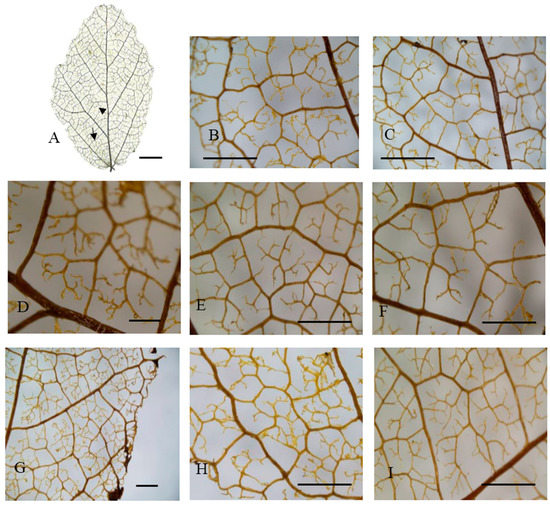
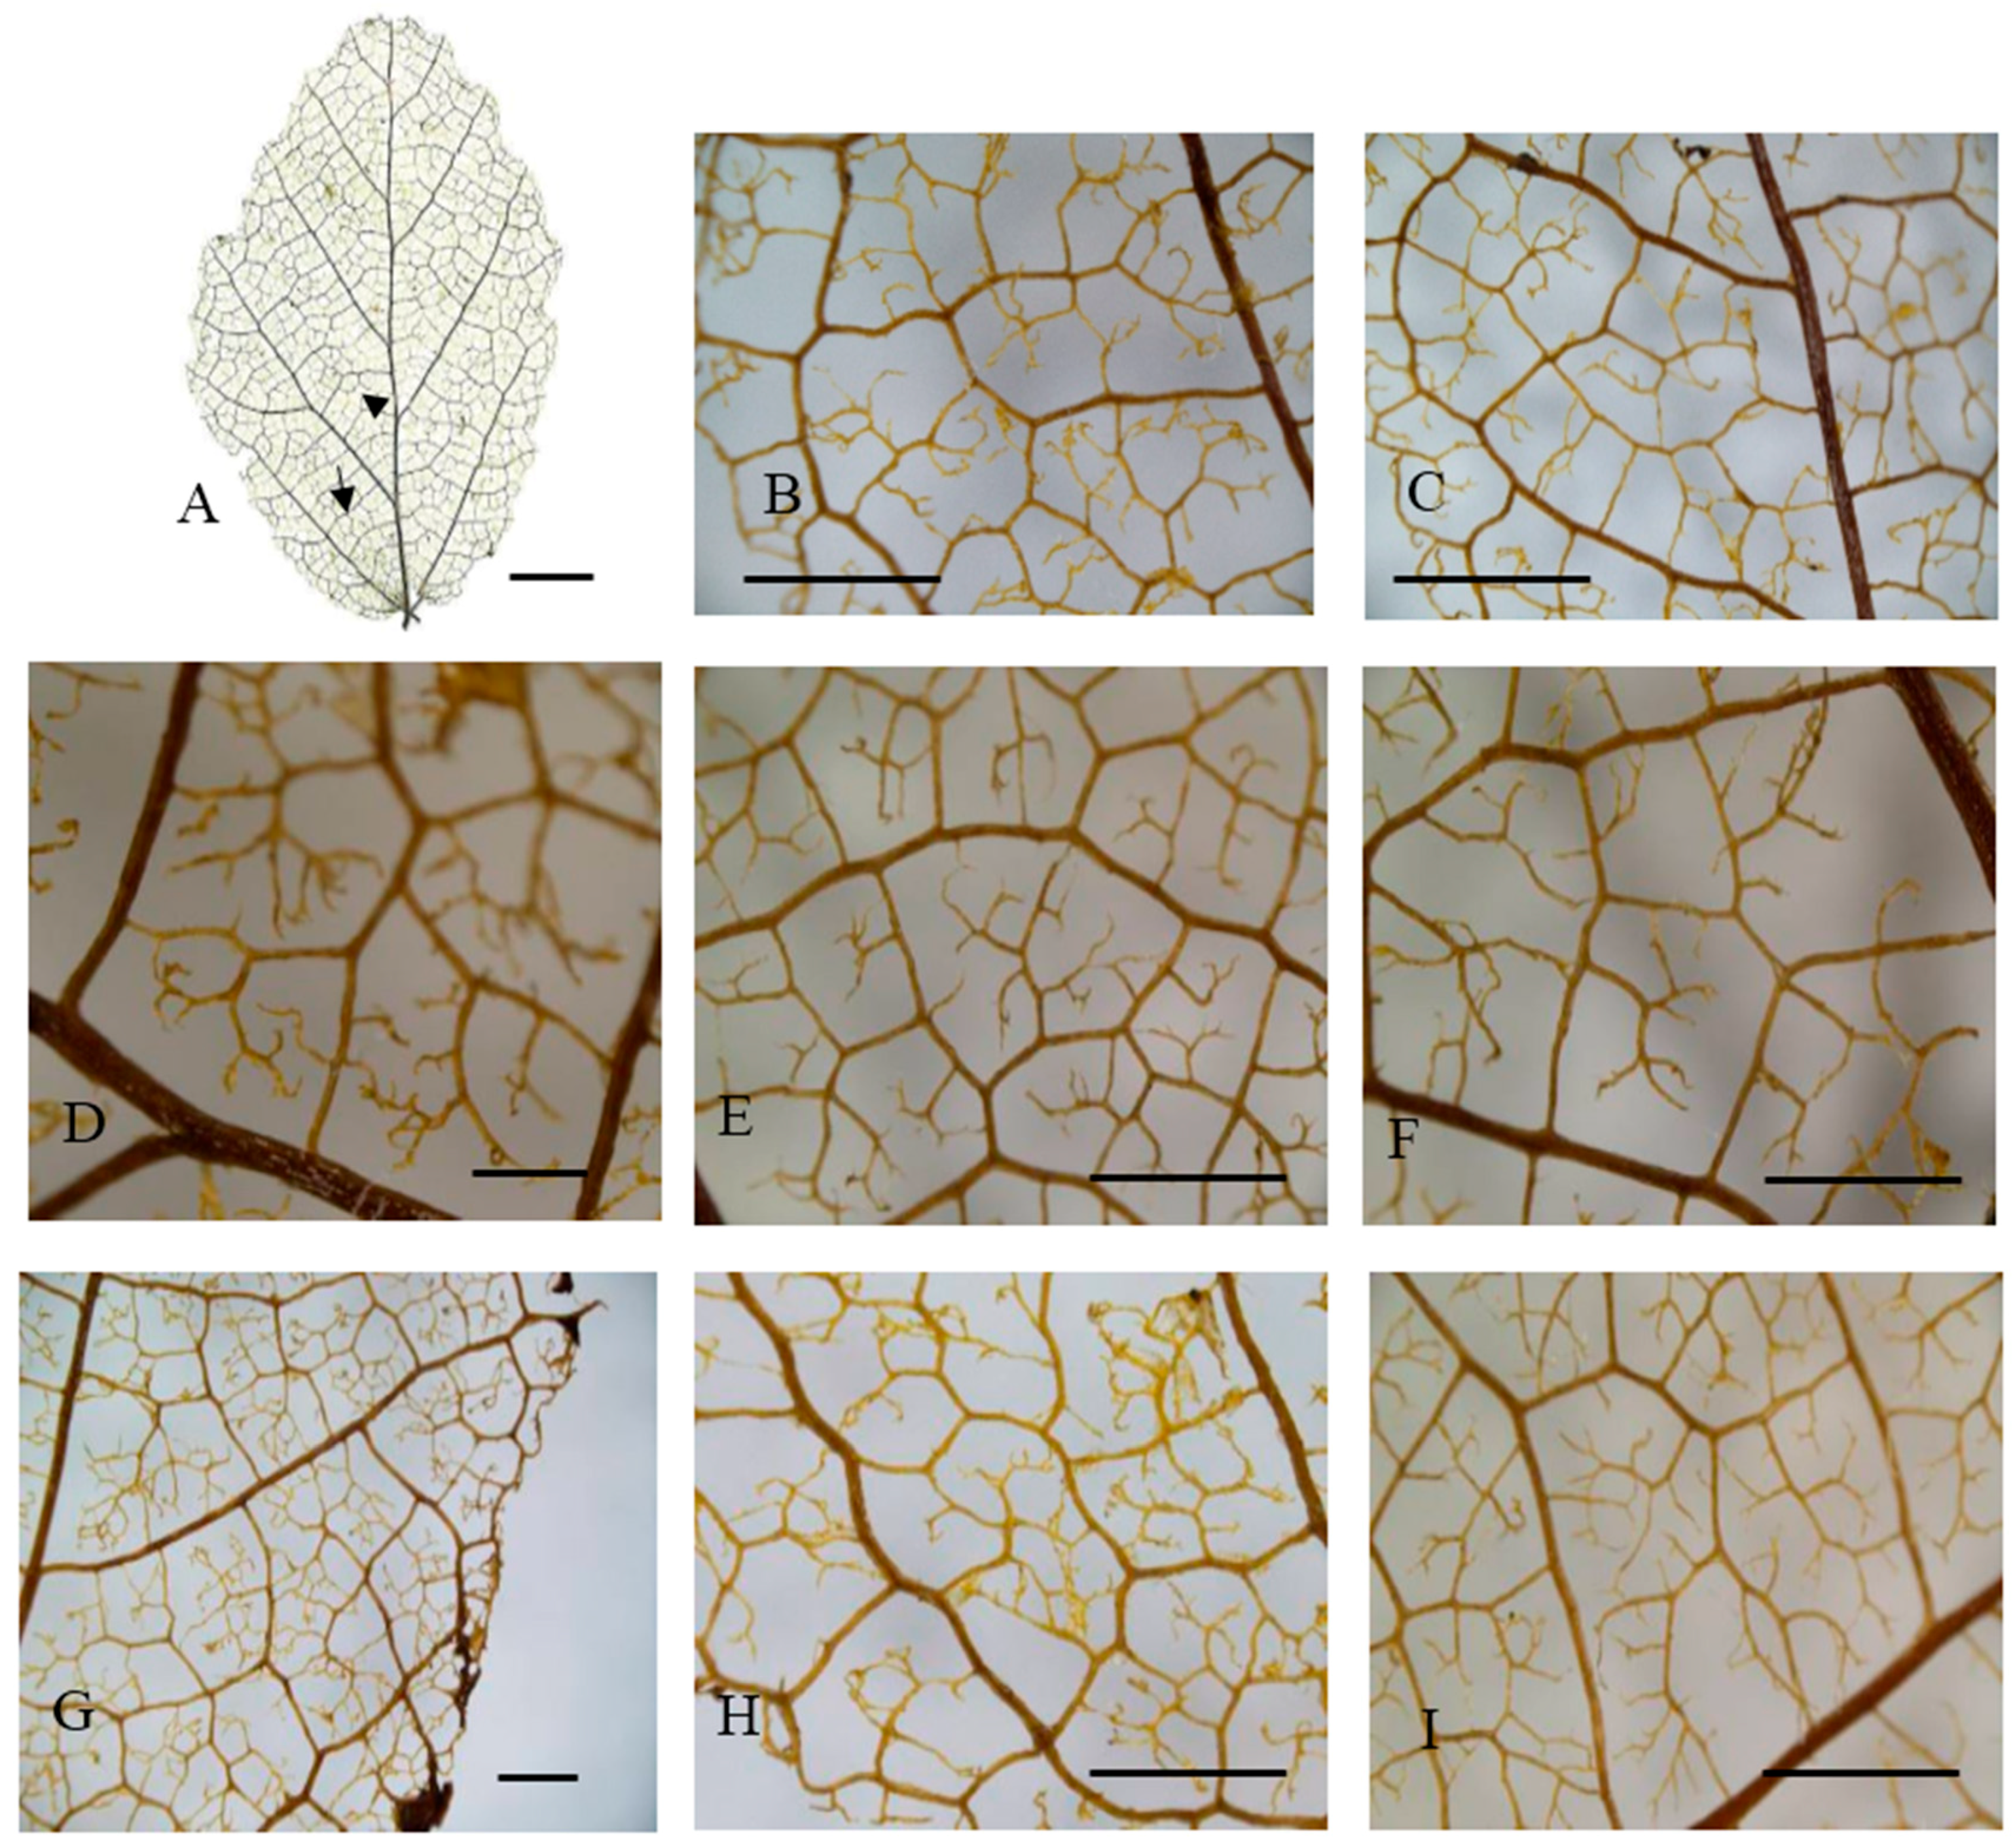
Figure 3.
Leaf venation of hillside trees in eastern China. (A) General vein pattern; (B,D–F,I) Areolation; (C,G,H) Looped marginal ultimate venation. Arrowhead: basal veins. (A) Shucheng, Anhui; (B,C) Jinzhai, Anhui; (D,G) Xinyang, Henan; (E,F,I) Huoshan, Anhui; (H) Yuexi2, Anhui. Arrow: agroaphic veins. Scale bar: (A): 1 cm; (D): 500 µm; (B,C,E–I): 1000 µm.
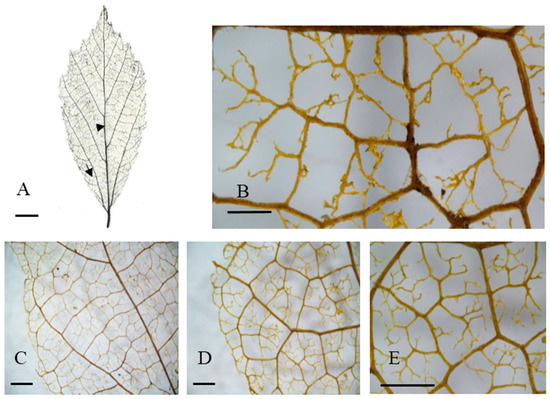
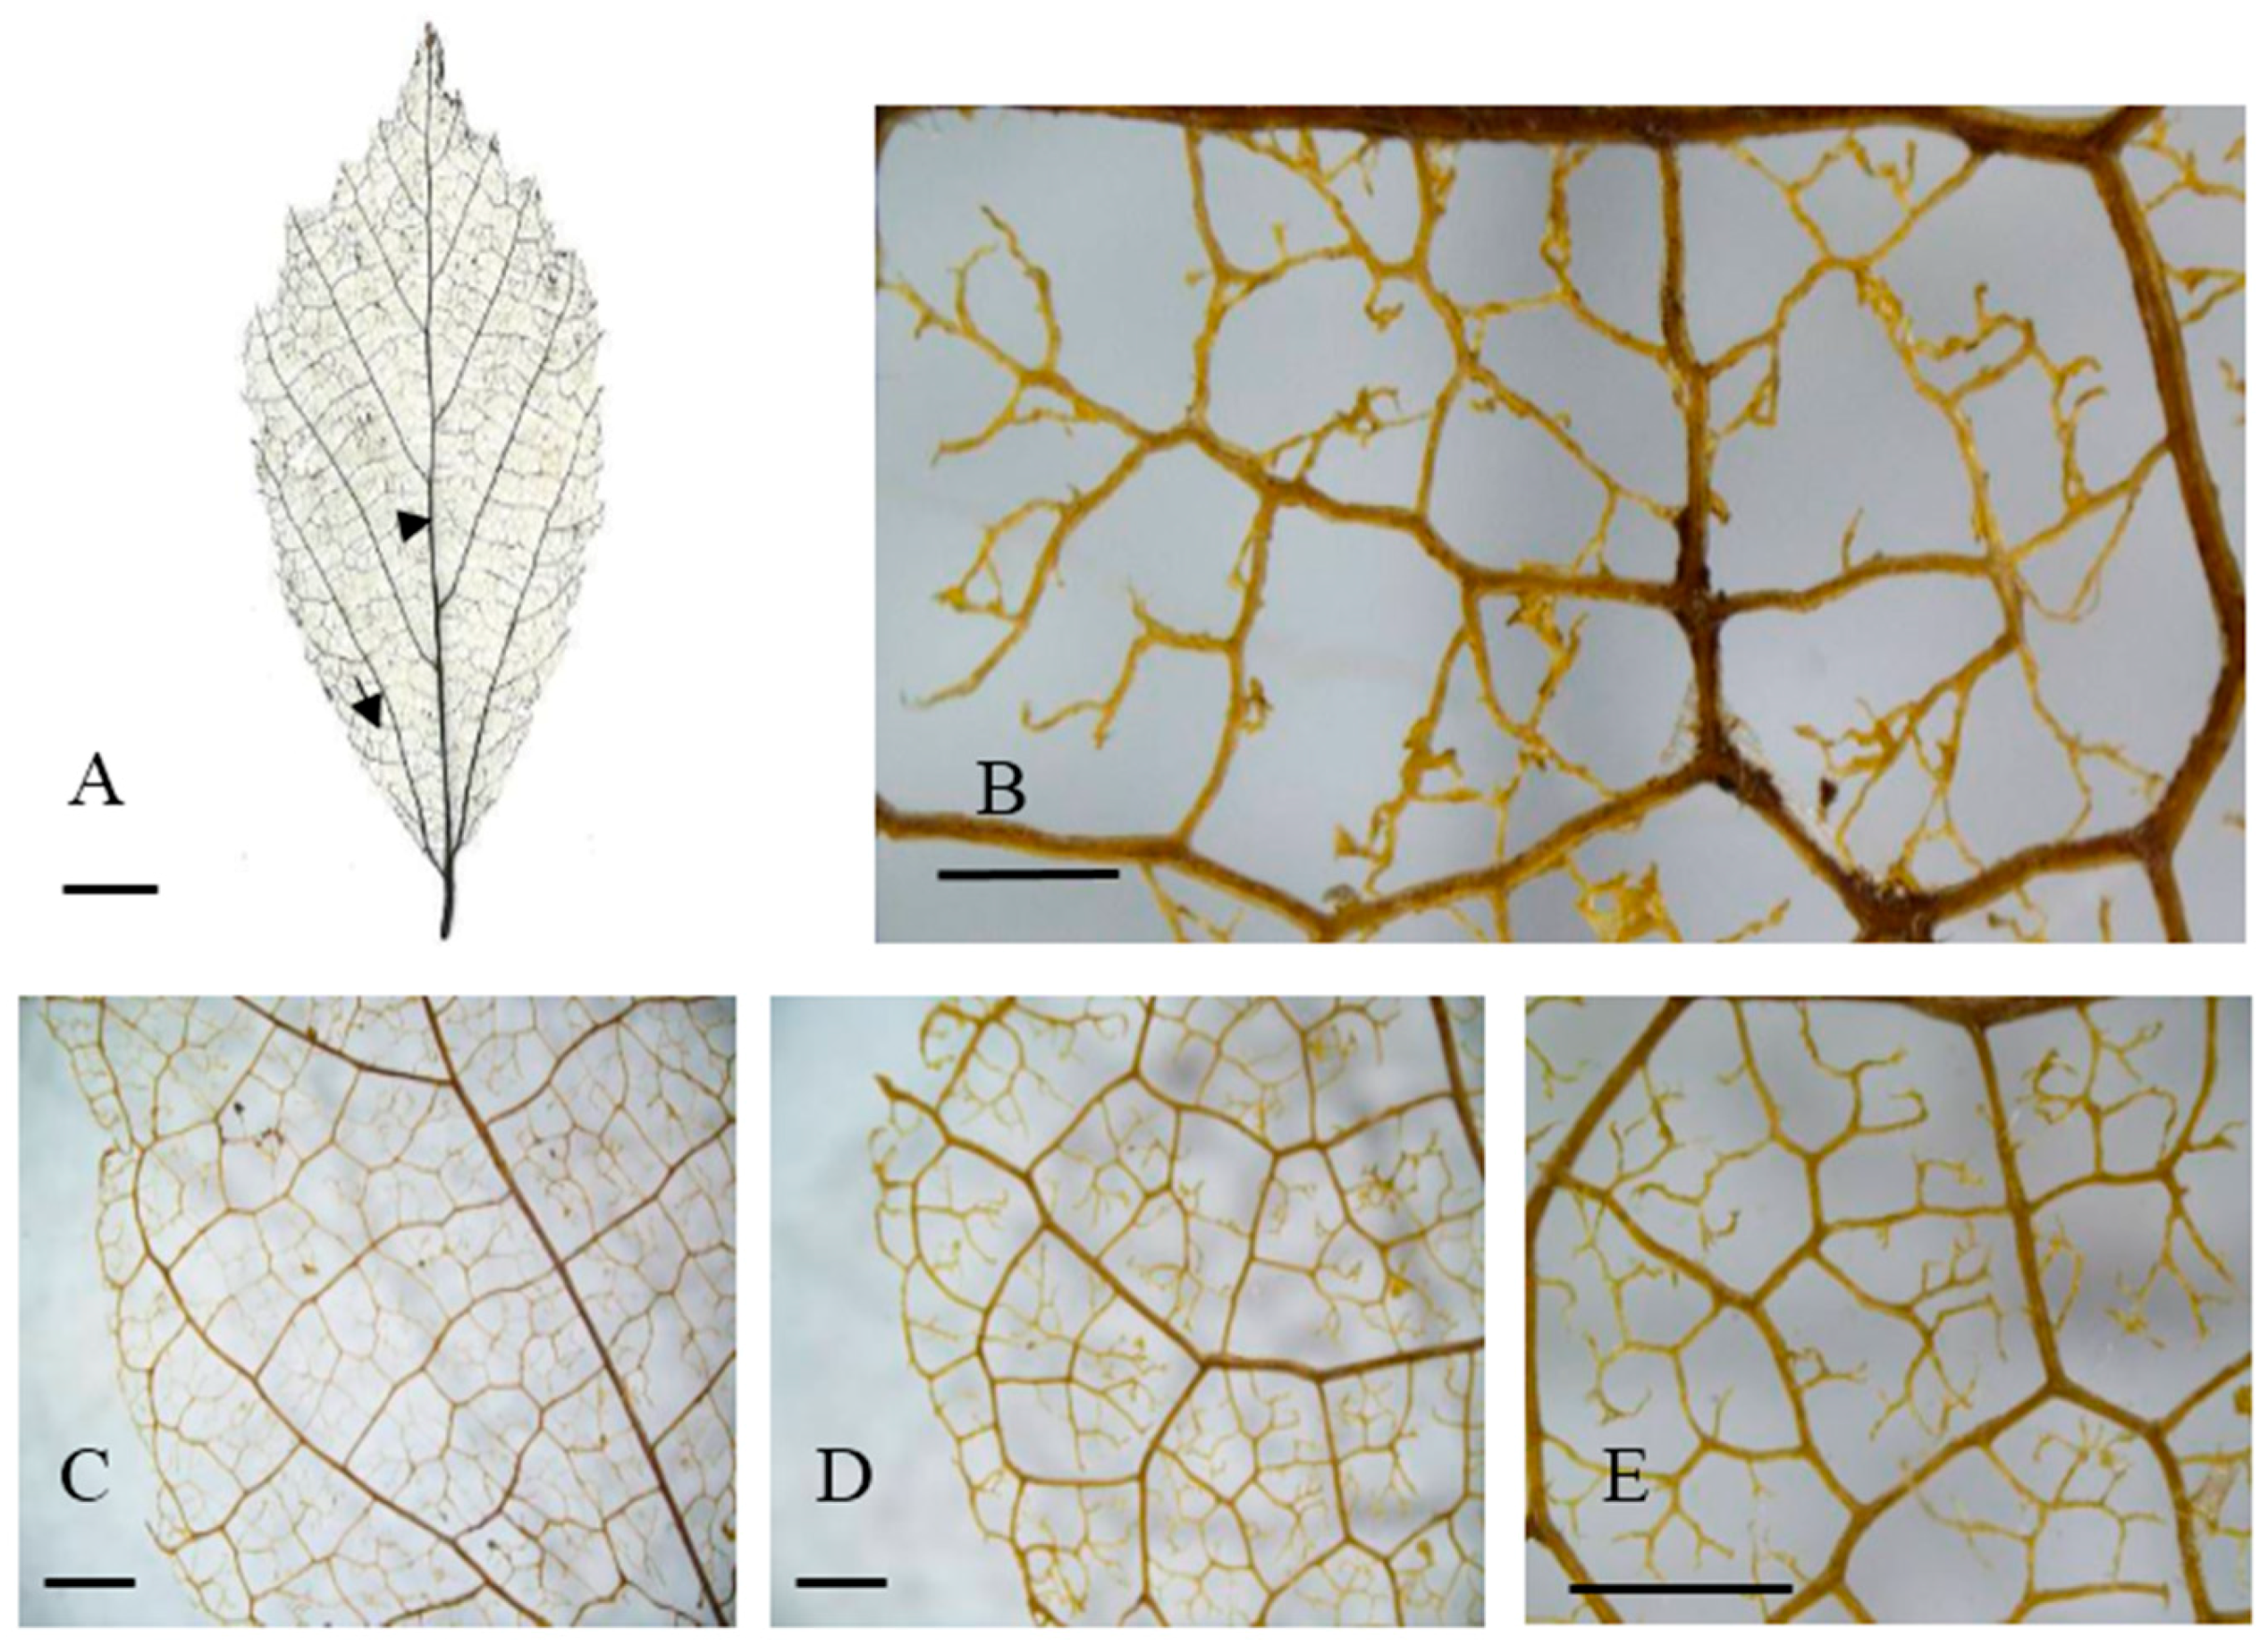
Figure 4.
Leaf venation of valley trees in eastern China. (A) General vein pattern; (B,E) Areolation; (C,D) Looped marginal ultimate venation. Arrowhead: basal veins. (A) Tongcheng, Anhui; (C,D) Tongcheng, Anhui; (D,E) Jixi, Anhui. Arrow: agroaphic veins. Scale bar: (A) 1 cm; (B) 500 µm; (C–E) 1000 µm.
Table 3.
Leaf venation pattern of P. subaequalis in eastern China. FEV, freely ending veinlets; P, pentagonal; PE, percurrent; Q, quadrangular; R, reticulate; T, triangular.

Figure 5.
Unweighted pair-group method with the arithmetic means (UPGMA) analysis using variables of 15 leaf venation characteristics of P. subaequalis. (A) Hillside habitat type; (B)Valley habitat type.
In contrast, the valley habitat type group contained three populations (Jixi, Jinzhou, and Tingeing) (Figure 2B and Figure 5B). They show moderate areole development and quintenary vein fabric is present (Figure 4F). The Jixi, Tongcheng, and Jinzhai populations have almost the same pattern, with two branching FEVs (Figure 4B,F). Jixi can be distinguished by its more variable areola shape, while the other two have quadrangular and pentagonal, but rarely triangular, areoles (Figure 4F). The Jixi and Tongcheng populations can also be recognized by the presence of looped, marginal, ultimate venation (Figure 4C–E). The base angle in the valley group is a right angle and the areola shape is more variable than in the hillside group. However, this group has almost the same vein pattern, with the same laminar shape, areole development, and intercostal tertiary vein fabric. It can be distinguished by its FEVs. The first group mostly displays two or three branched FEVs (Figure 3H), whereas the second group (Figure 4B) generally has three branched FEVs and their density is also different.
3.2. Effects of Elevation and Climatic Factors on VD
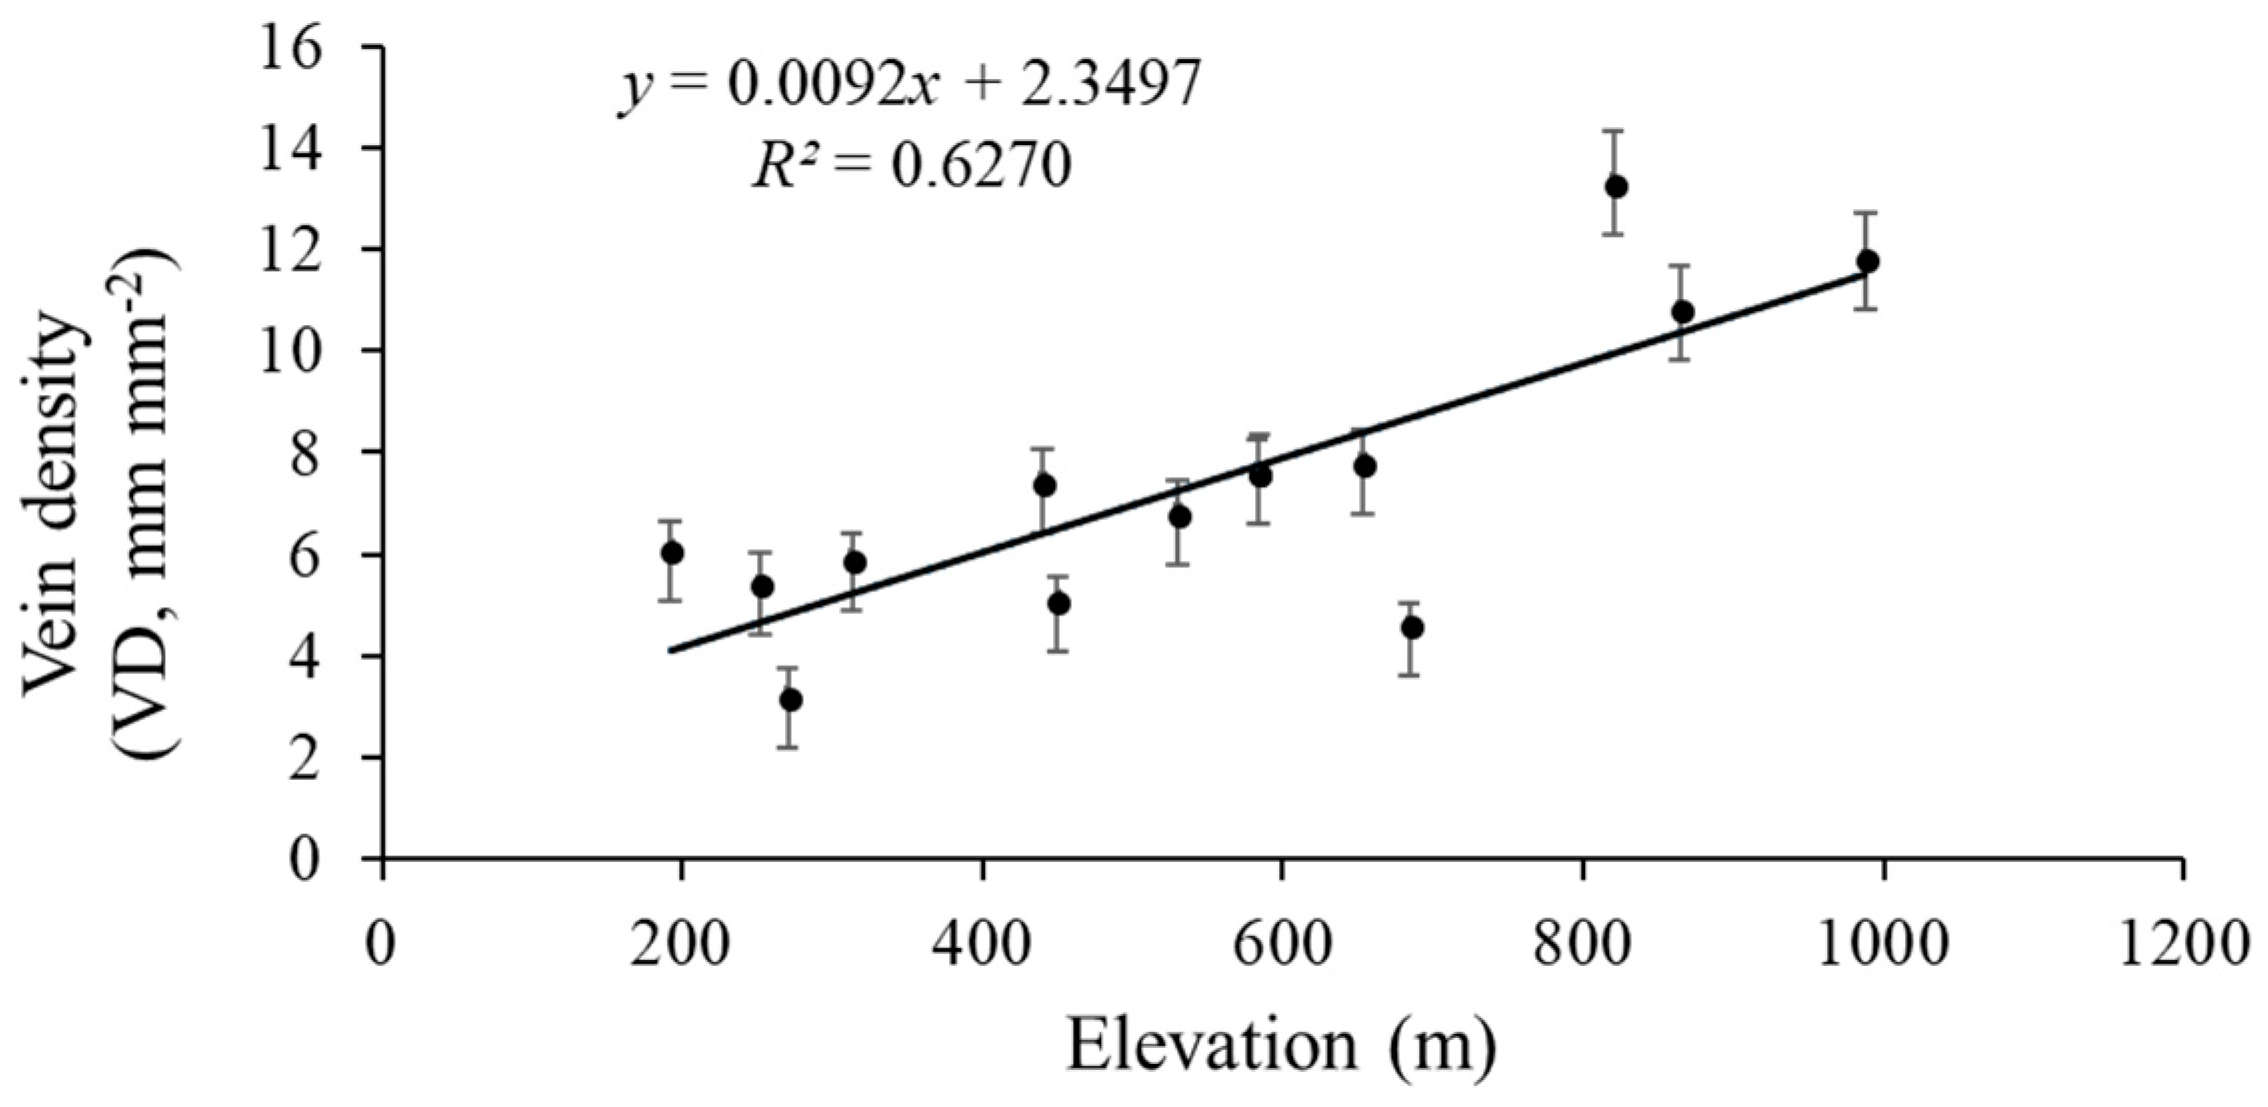
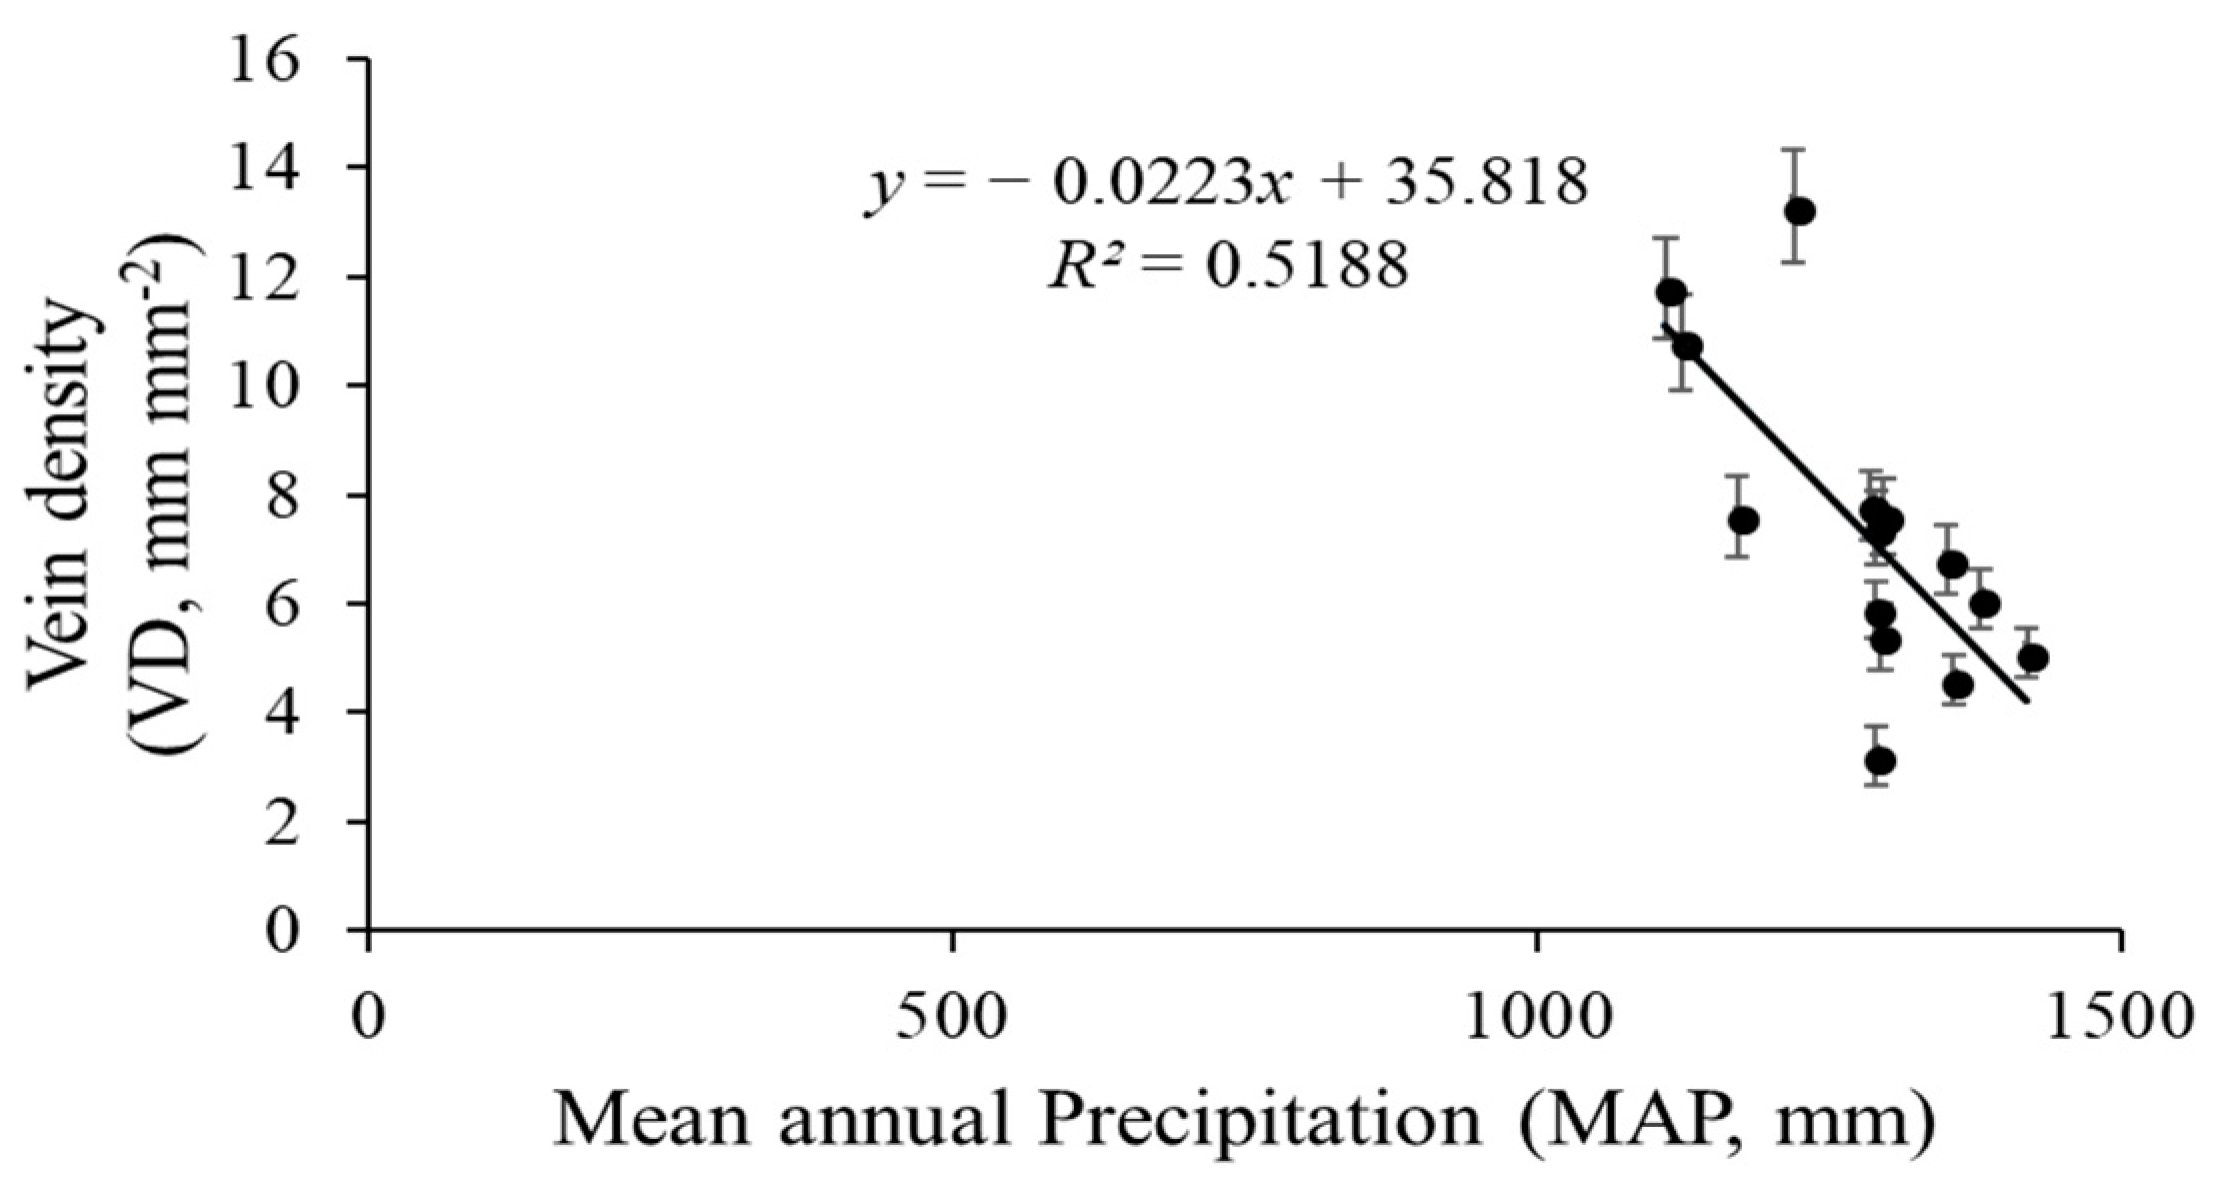
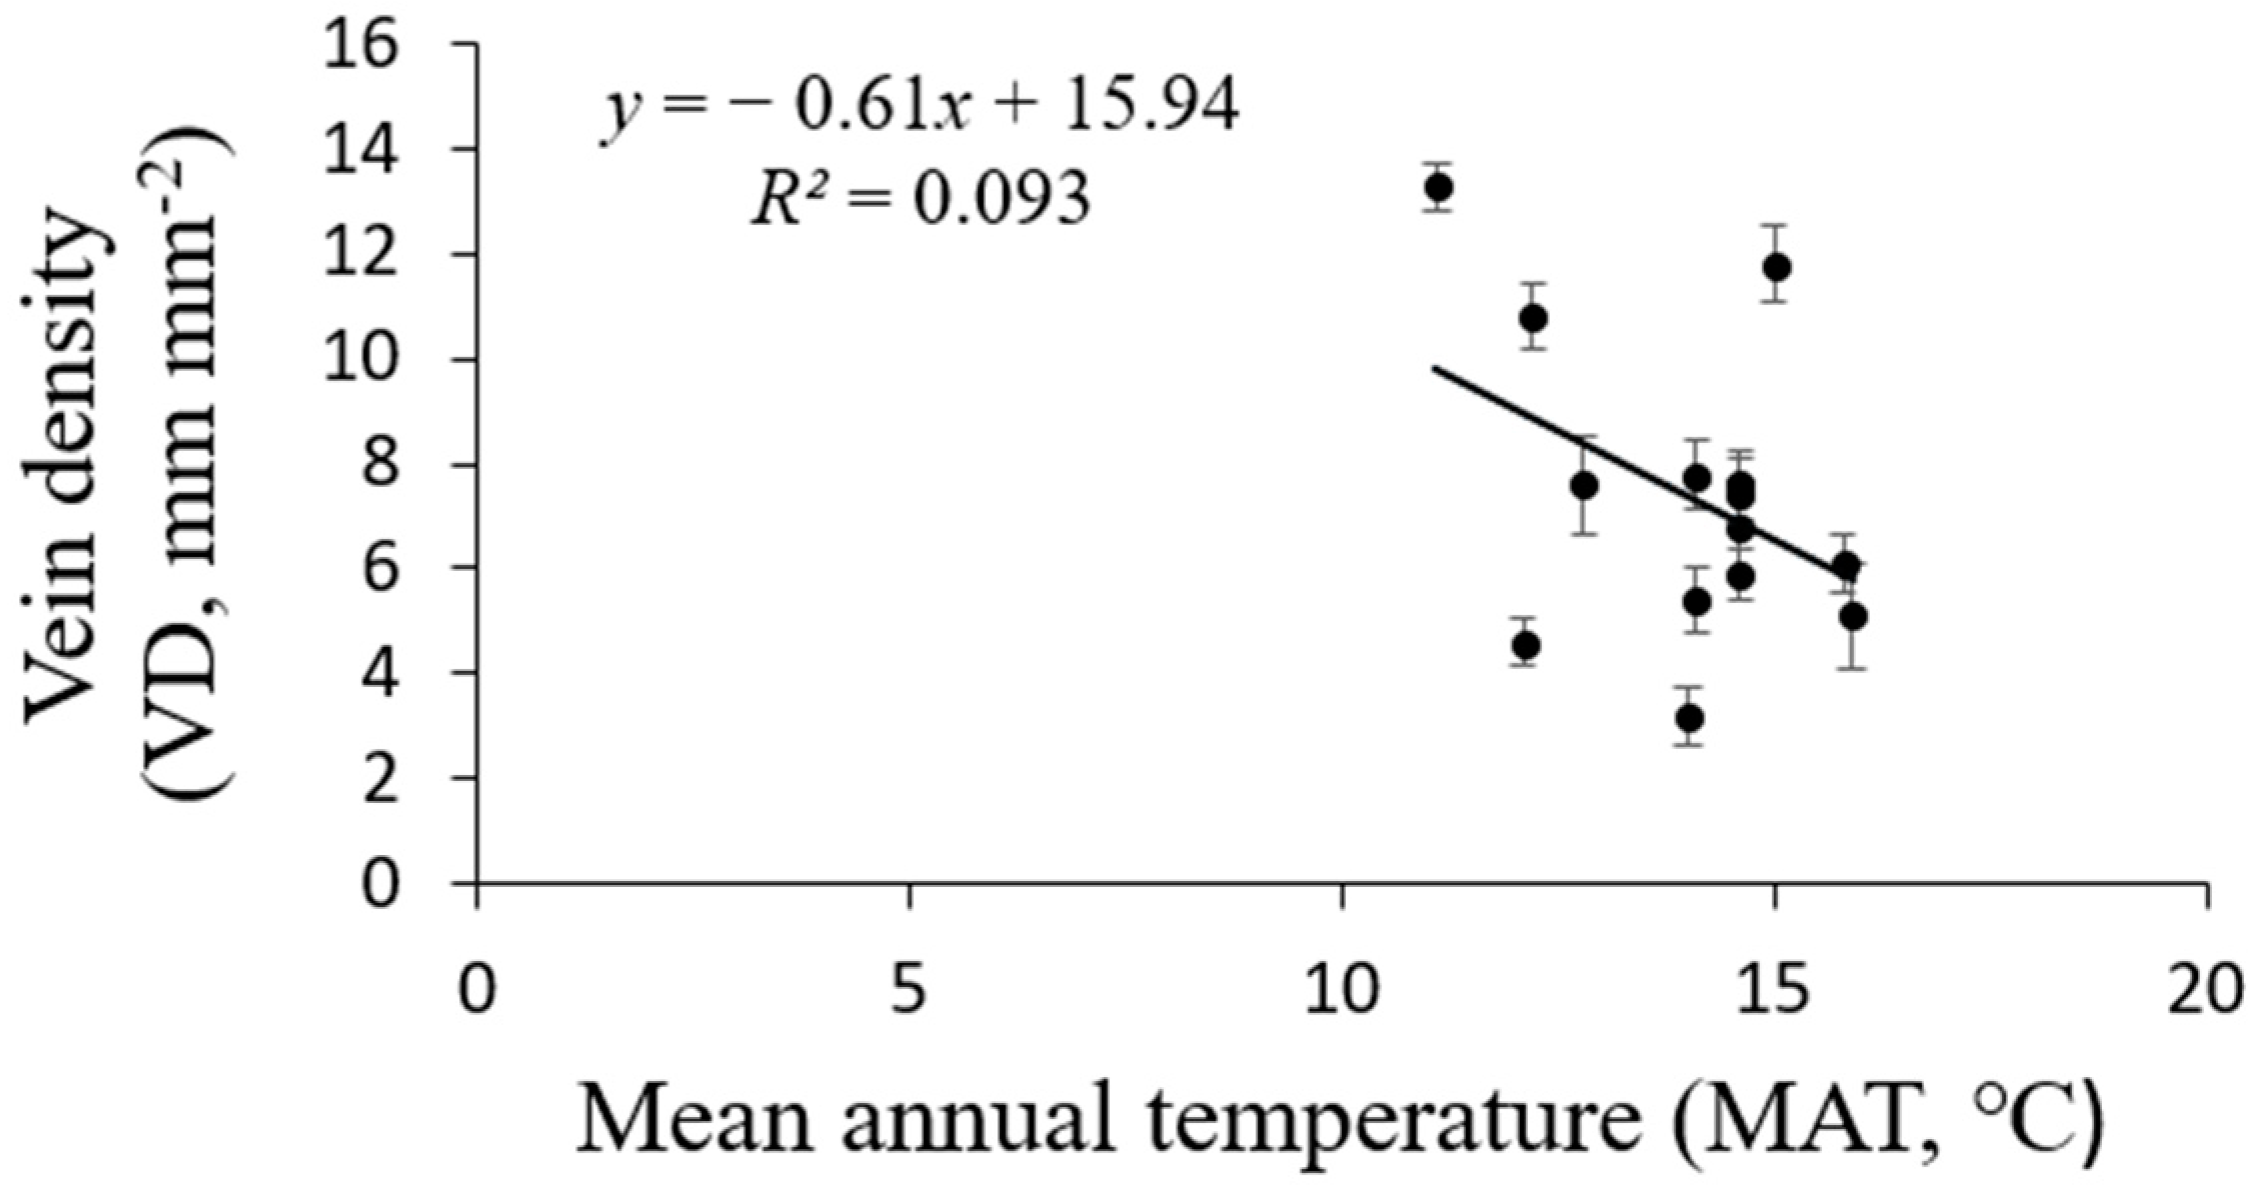
The vein density significantly varied from 3.2–13.3 mm mm−2 across the 14 sites. Elevation across the 14 sites varied markedly, with an elevation range from 192 m to 988 m (Table 1). The VD values of the 14 populations significantly rose as the elevation increased (R2 = 0.6270, p = 0.0007; Figure 6). Climate conditions, especially MAT and MAP, clearly varied among sites. The VD had a negative linear relationship with both MAP (R2 = 0.5188, p = 0.01; Figure 7) and MAT (R2 = 0.093, p = 0.145; Figure 8). The MAP values for the Anji, Changhua, and Ningbo sites were lower than for the other sites. The MATs for Anji and Changhua were also lower than the other populations (Table 4). Anji, Changhua (820 m), and Ningbo (988 m) populations had a higher VD, but the Jinzhai (450 m), Tongcheng (270 m), and Jixi (684 m) populations had a relatively low VD. Therefore, it can be concluded that P. subaequalis growing in a hillside habitat with a lower MAP had a higher VD, and those growing in a valley habitat with higher MAPs had lower VDs.
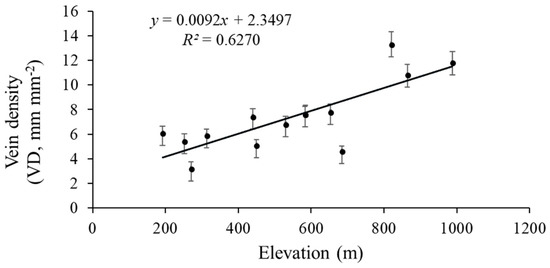
Figure 6.
Regression analysis of the VD (mean ± SD) with elevation. The VD is significantly related to the elevation (p = 0.0007). Each dot represents a sampling site in China.
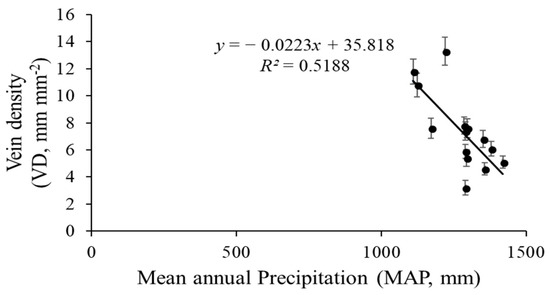
Figure 7.
Regression analysis between P. subaequalis of vein density (VD) and the climatic factors of mean annual precipitation (MAP) in 14 sampling sites across eastern China. Each dot represents a sampling site in China. (p = 0.001).

Figure 8.
Regression analysis between P. subaequalis of vein density (VD) and the climatic factors of mean annual temperature (MAT) in 14 sampling sites across eastern China. Each dot represents a sampling site in China. (p = 0.145).
Table 4.
Leaf vein density (mean ± Standard Deviation(SD)) of P. subaequalis by site examined in this study.
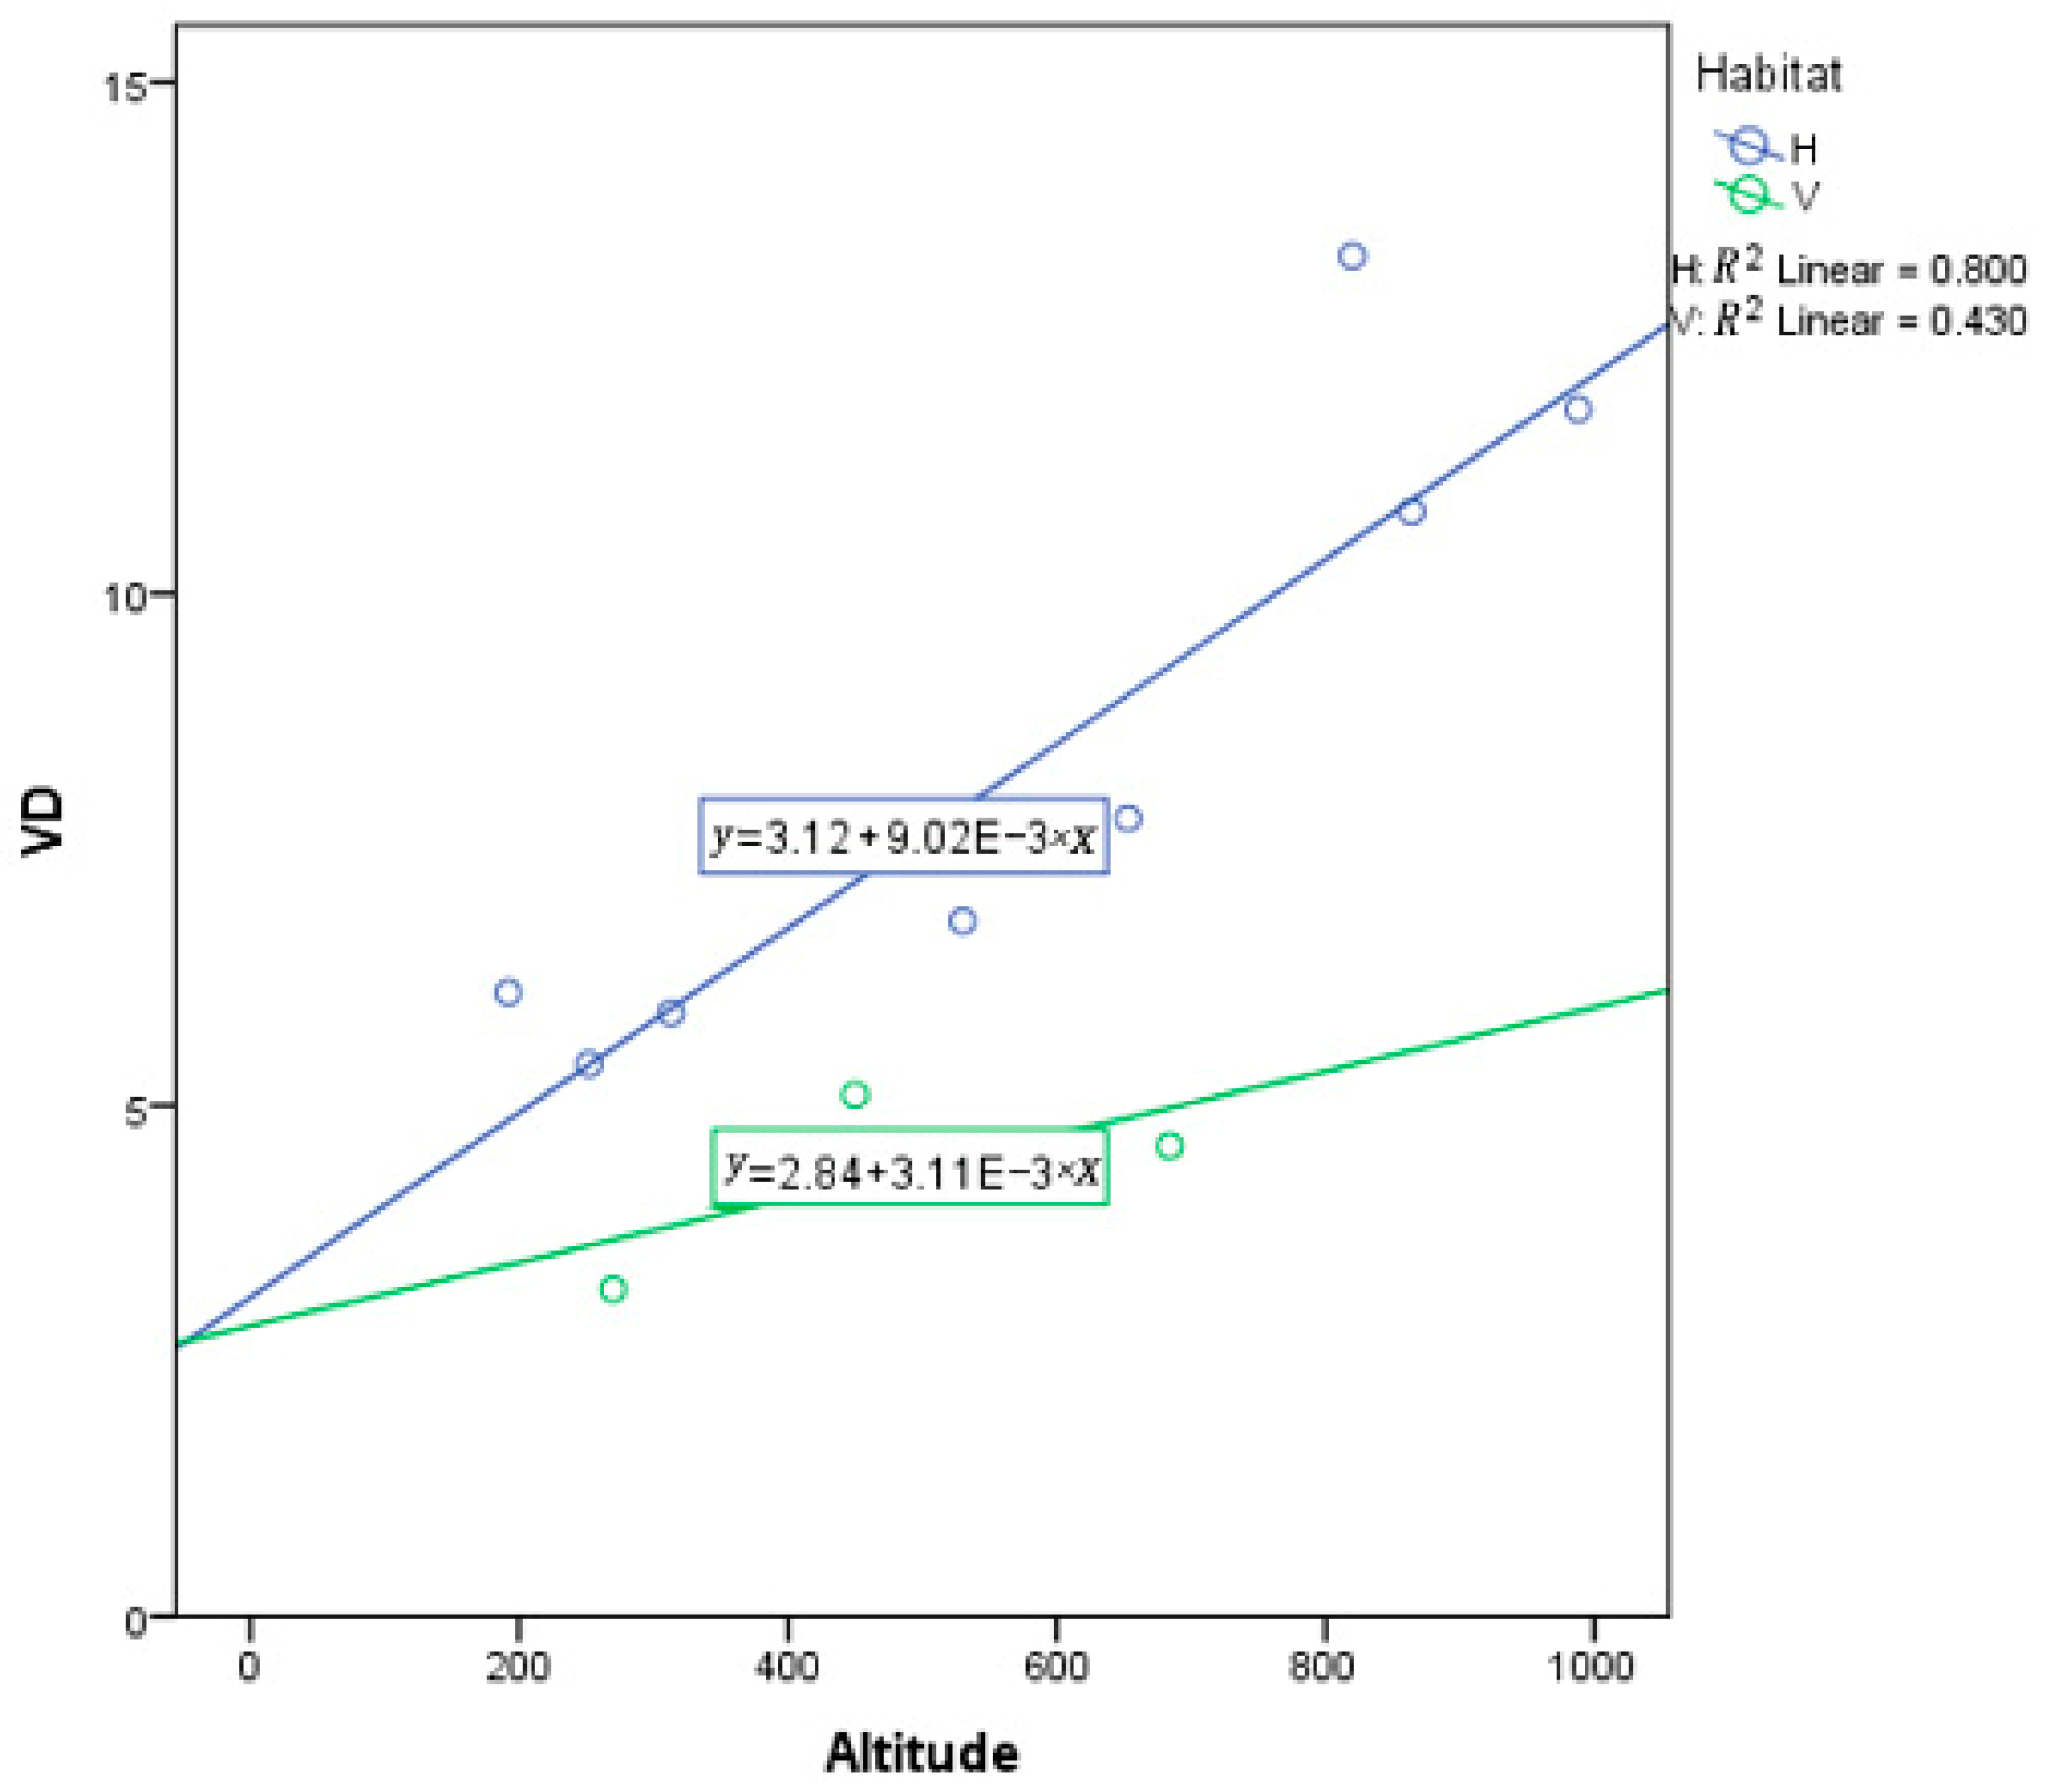
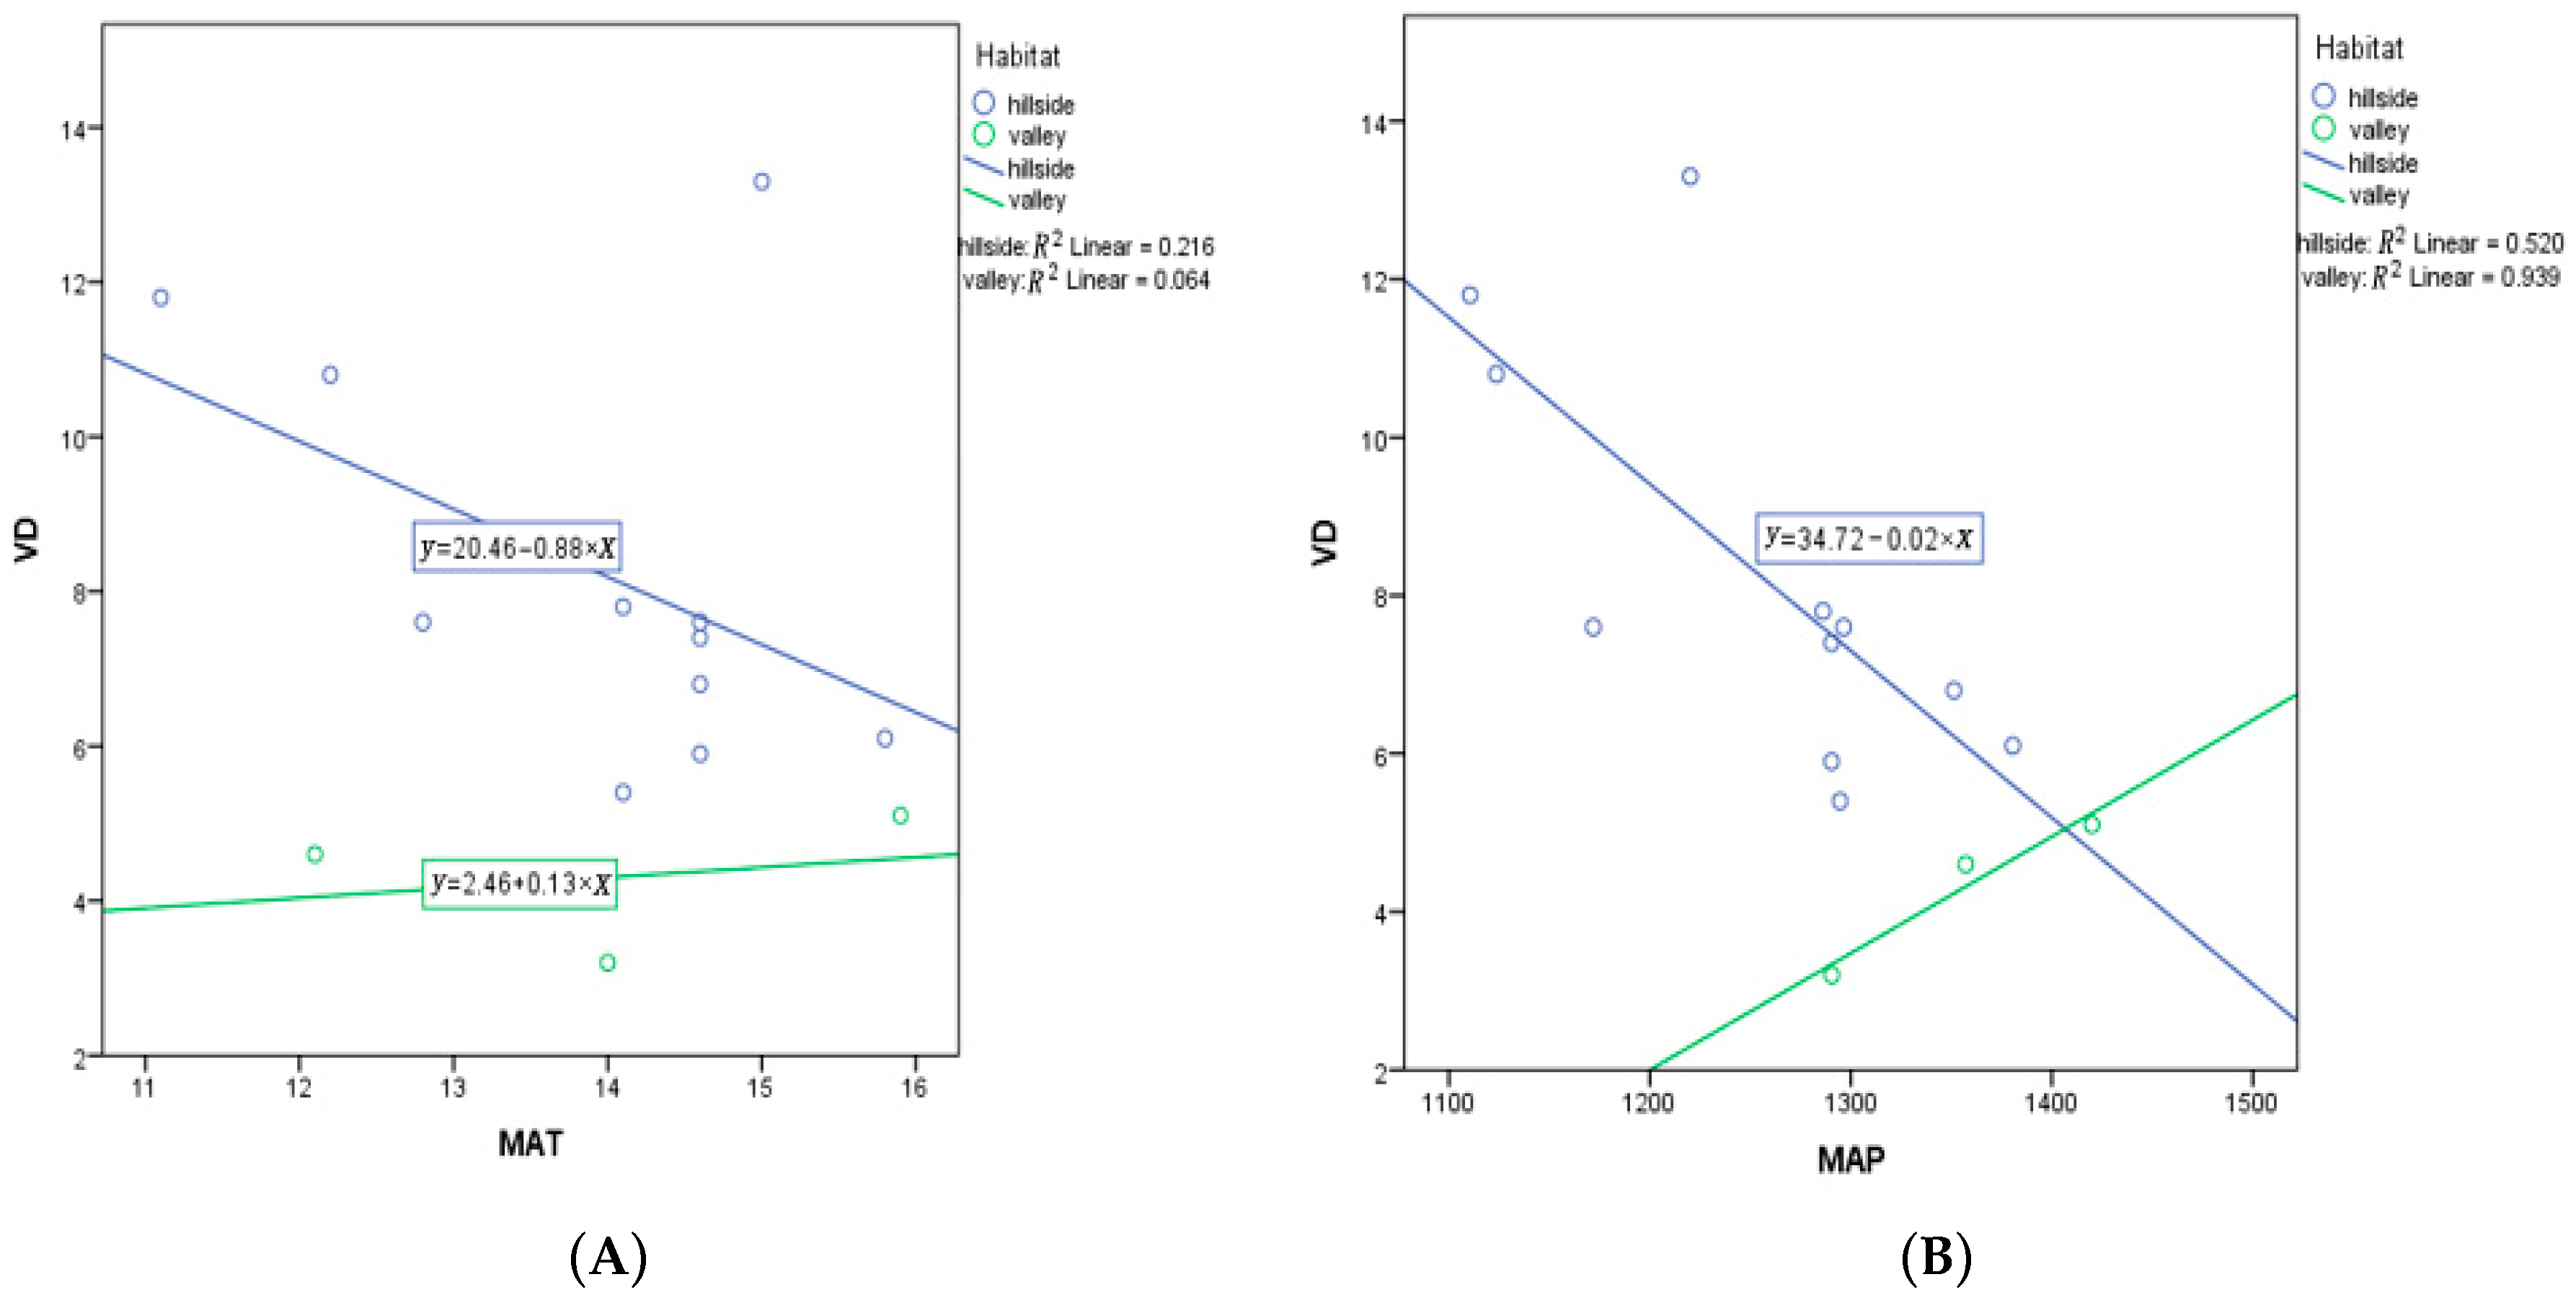
According to an analysis of covariance (ANCOVA), the result yields a result that populations from hillside habitats have a stronger response to elevation, MAT, and MAP than valley populations. Elevation as a covariate has a significant effect (p < 0.001) on VD, yet habitat remains a significant predictor for VD (p = 0.003) (Table A2). Of course, plants do not respond to elevation, but rather some other environmental variable that is associated with elevation. However, note that the slope for hillside habitats is substantially more positive than for valley habitats (Figure 9). MAT as a covariate was not a significant predictor of variation in VD (p = 0.218), yet habitat was a significant predictor for VD (p = 0.026) (Table A3). This suggests that MAT is not very important, while habitat is important. However, note that the slope for hillside habitats is substantially more negative than for valley habitats, which is rather flat (Figure 10).
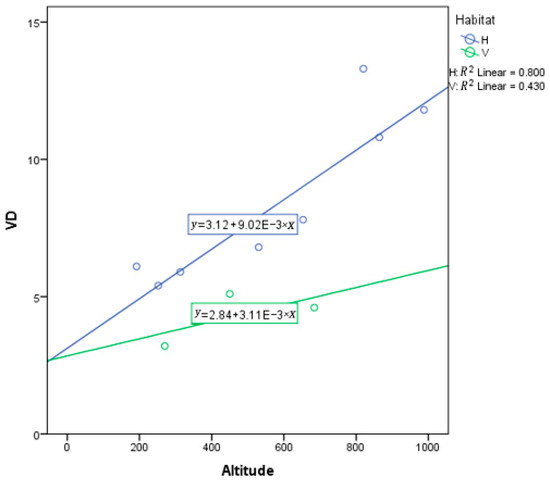
Figure 9.
Analysis of covariance (ANCOVA) between vein density (VD) and altitude in hillside and valley habitats. Each dot represents a sampling site in China. E represent ten to the power of N.
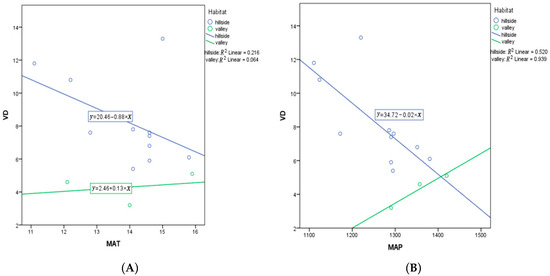
Figure 10.
(A) ANCOVA between vein density (VD) and MAT in hillside vs. valley habitats; (B) ANCOVA between vein density (VD) and MAP in hillside vs. valley habitats. Each dot represents a sampling site in China.
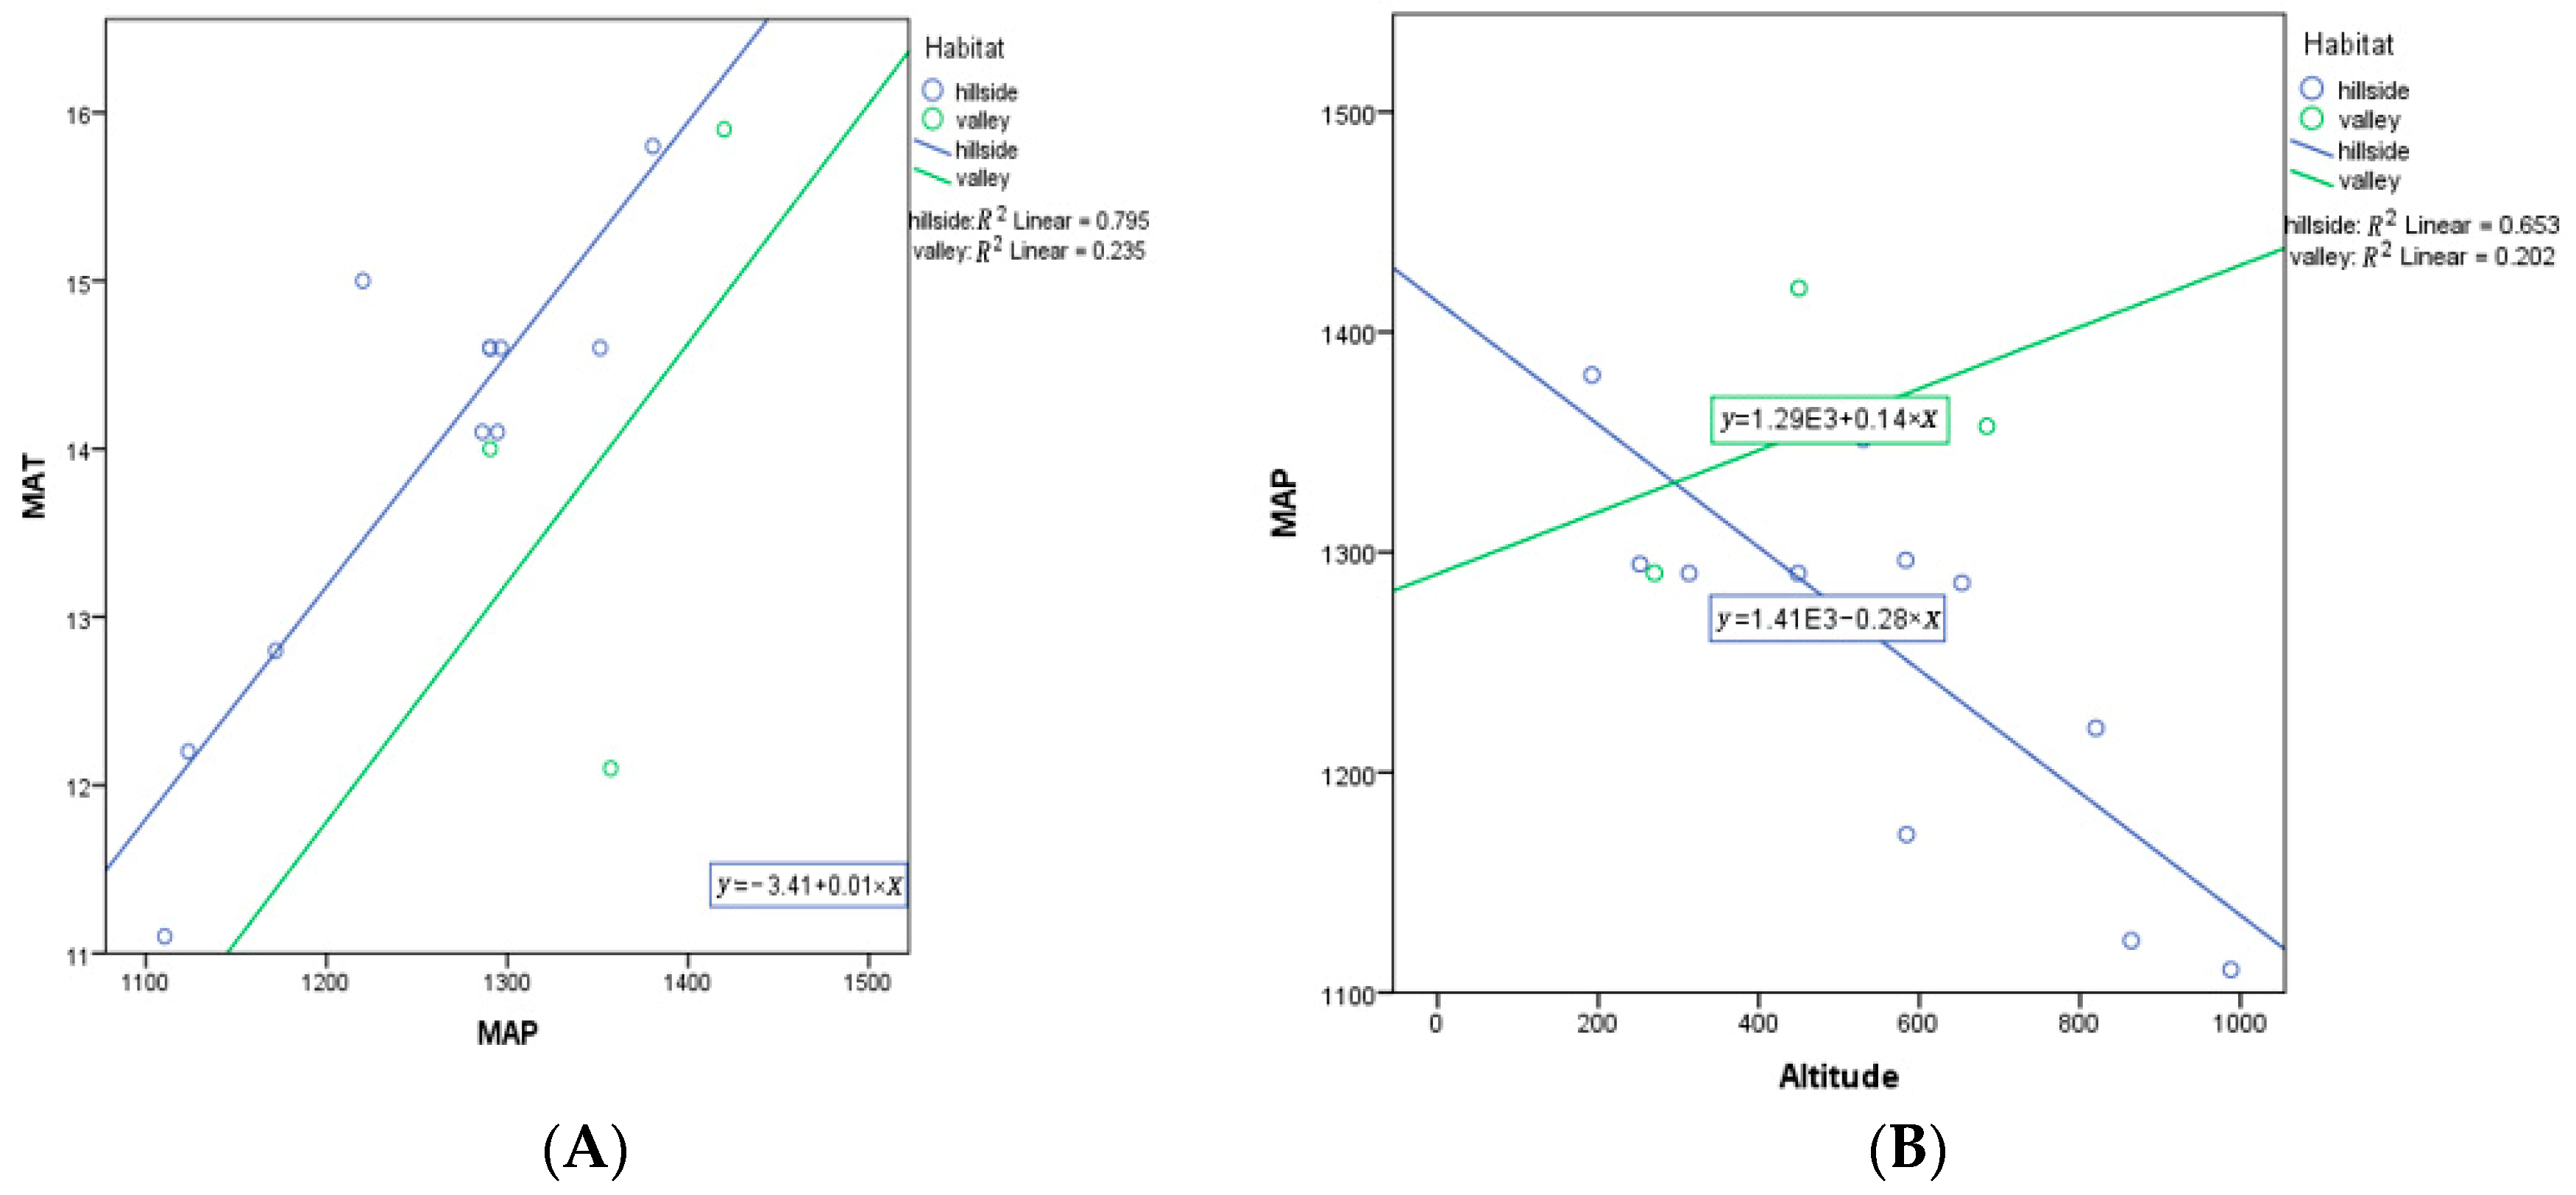
MAP as a covariate was a significant predictor of variation in VD (p = 0.022), while habitat was not a significant predictor for VD (p = 0.159) (Table A4). This suggests that MAT is important in driving VD, with no additional significant variation in VD explained by habitat (p = 0.159). Note that a MAP with habitat term in the model was not significant (p = 0.113). However, the slope for hillside habitats is very negative, while the slope for valley habitats is positive (Figure 10). MAP and MAT are highly correlated (R = 0.715, one-tailed p = 0.002), with a similar relationship found in both habitats (Figure 11). Additionally, MAP and altitude are negatively correlated (R = − 0.669, two-tailed p = 0.009), but the association is opposite for the two habitats (Figure 11).
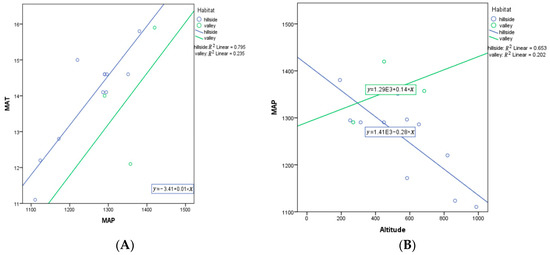
Figure 11.
(A) ANCOVA between MAP and MAT in different habitats (hillside and valley) (p = 0.002); (B) ANCOVA between altitude and MAP in different habitats (hillside and valley) (p = 0.009). Each dot represents a sampling site in China. E represent ten to the power of N.
4. Discussion
Correlation between Vein Trait and Climatic Conditions
Plants are subjected to multiple environment types and their survival occurs under many different environment conditions [28,33,34]. Leaf venation networks provide an integrated link between plant form, function, and climate niche because leaf water transport underlies the variations in plant performance [35,36]. This has key implications for the distribution and productivity of ecosystems, as well as applications in paleobiology, agriculture, and plant technology. For example, we can propose leaf venation as a new tool to interpret fossil angiosperm life forms. Vein density values of a standing forest are reflected in its leaf litter, suggesting that fossil leaf assemblages are representative of past forest ecosystems [34]. Our results imply that based on leaf venation, 14 P. subaequalis populations could be divided into two groups growing in different habitats. These results also show that the differences in venation between the populations were mainly affected by water availability, and this finding was in agreement with previous study [5,37,38].
As leaf morphology evolves and adapts in response to environmental change, there is the potential for functionally interdependent tissues to independently change [35,36,37,38]. Our results show that base angle, FEV, and areole shape changed during adaptive variation in leaf venation. The leaf of P. subaequalis showed varied changes in habitats (hillside and valley). In hillside habitats, leaves expanded their base angle, but the FEVs are lower than growing in valley habitats. Furthermore, FEV development is better in valley habitats, and the areole shape is more optimal compared to the leaves of those growing in hillside habitats. Leaves grown under well-watered conditions in the field show a decrease in leaf hydraulic conductance, whereas leaf hydraulic conductance increases under less-watered conditions [39,40,41].
Vein traits are thought to reflect the gas and water exchange characteristics between the atmosphere and the leaves, which are greatly influenced by climatic factors at the leaf, tree, and even regional scales [15]. The vein density was closely correlated to the long-time mean temperature (MAT) and water conditions (MAP). A higher vein density means shorter mesophyll distances, which leads to higher leaf hydraulic conductivity [11]. A lower evaporative demand should result in less investment in leaf venation because of the lower leaf hydraulic conductivity requirement. Our study shows that the Ningbo, Changhua, and Anji populations had a higher VD than Tongcheng, Jixi, and Jinzhai populations, which grew in valleys and had the lowest VD. Vein density was negatively and linearly related to MAP and MAT (Figure 7 and Figure 8), which agreed with previous reports by other studies [42,43].
However, the ANCOVA results also suggest that VD is responding more to MAP than anything else, including habitat, but especially in presumably drier hillside habitats. Given the strong positive correlation between MAT and MAP (in both habitats), it makes sense that VD is strongly predicted by MAT.
Some studies in south China have suggested that vein density has a strong positive correlation with MAP. This is probably due to the higher temperature and precipitation levels in southern China compared to northern or eastern China, thus leading to higher plant transpiration rates [34]. Higher leaf vein densities increased transpiration rates. Furthermore, previous studies indicated that there was a strong correlation between vein density and assimilation rates [44]. Leaf vein density also has a significantly positive effect on transport and photosynthetic capacities [16,45,46], and stomata density has a very strong linear correlation with vein density [37,45]. Some studies have shown that species with a low stomata density (44 stomata mm−2) have a low vein density (2.3 mm mm−2), while species with a high stomata density (521 stomata mm−2) have a high vein density (12.8 mm mm−2) [37,45,47]. Cell size has been significantly linked to key function traits, vein density, stomata density, and leaf thickness [16,46]. A high vein density has also been strongly associated with small stomata, as well as epidermis, palisade, and xylem cell sizes across a number of species [18]. Plants can effectively adapt to environmental changes through different adaptive strategies. These strategies coordinate the density of veins and stomata to maintain an efficient photosynthetic rate, which varies depending on the climatic conditions. For example, an increase in VD when moisture availability decreases leads to increased plant photosynthetic rates during pulses of high water availability in arid regions [42,48].
P. subaequalis is an endemic and endangered tree species from China. Currently, the extant populations are protected [46,49]. Nevertheless, a more proactive conservation strategy may be needed. A few populations (Ningbo, Jixi) have less than 20 individuals, and only some of these trees are of a reproductive size [50]. The results show that different P. subaequalis populations have different adaptive strategies and physiological reactions. Therefore, management measures that reflect these differences need to be introduced so that habitat quality can be improved and the long-term viability of P. subaequalis can be guaranteed. For instance, we can preserve all the extant populations and their habitats or the establishment of ex situ collections in gardens.
5. Conclusions
Leaf venation patterns and vein density are key anatomic traits closely related to climatic change. P. subaequalis is one of the endangered species of angiosperms distributed across eastern Asia. To understand the change of leaf morphology under different habitats, we measured 15 leaf venation characteristics of P. subaequalis. We have demonstrated that leaf venation is closely related to different habitats (hillside and valley). In hillsides, leaves expand the base angle, with lower FEV trees growing in valley habitats. FEV development is better in water-abundant valley habitats, and the areole shape is more optimal compared to the leaves growing in hillside habitats.
We further used elevation, MAT, and MAP to investigate the relationship with vein density (VD). The results revealed that a strong positive linear relationship was observed between vein density and elevation (R2 = 0.6270), and had a slightly negative linear relationship with both MAP (R2 = 0.5188) and MAT (R2 = 0.093). We also used ANCOVA to analyse the slopes of different habitats, and the results showed that the slope for hillside habitats is substantially more positive than for valley habitats when comparing altitude and VD. Additionally, for MAT and VD, the slope for hillside habitats is substantially more negative than for valley habitats, which is rather flat. For VD and MAP, the slope for hillside habitats is very negative, while the slope for valley habitats is positive. MAP and MAT are MAP and MAT are highly correlated (R = 0.715, one-tailed p = 0.002); however, MAP and altitude are negatively correlated (R = − 0.669, two-tailed p = 0.009). Populations from hillside habitats have a stronger response to elevation, MAT, and MAP than valley populations.
These results imply that P. subaequalis uses different strategies to adapt to different habitats. According to the analysis of leaf morphological traits, different P. subaequalis populations have gradually adapted to the local climatic condition. Moreover, leaf morphological traits might be used as a reference for the conservation of P. subaequalis populations.
Author Contributions
L.Z. and J.Y. conceived and designed the experiments; Y.H. and Z.J. performed the experiments; L.Z. analyzed the data; L.Z. and Y.F. wrote the paper.
Acknowledgments
We thank Lipeng Yu, Kaichao Chen, Zhong Zhang, and Huanong Hu for their assistance in sample collection. We also thank Jason Kilgore for the analysis of ANCOVA. This study was supported by the Wildlife Plant Protection Management Project of National Forestry Bureau, the Collaborative Innovation Plan of Jiangsu Higher Education, and the Priority Academic Program Development of Jiangsu Higher Education Institutions (PAPD).
Conflicts of Interest
The authors declare no conflicts of interest.
Appendix A
Table A1.
The values of 15 leaf venation characteristics of P. subaequalis.
Table A1.
The values of 15 leaf venation characteristics of P. subaequalis.
| Population | Laminar Shape | Base Shape | Base Angle | Primary Veins Size | The Pair of Major Secondary Veins | The Angle between Major Secondary Veins and Primary Veins | Intersecondary Veins | Intercostal Tertiary Veins Angle Varability | Variation of Major Secondary Angle to Tertiary | Tertiary Veins | Higher Level Veins | Veinlets | Areole | Areolation | Tooth |
|---|---|---|---|---|---|---|---|---|---|---|---|---|---|---|---|
| Changhua (CH) | 0 | 0 | 2 | 1 | 5.7 | 0 | 1 | 0 | 3 | 0 | 0 | 2 | 2 | 2 | 1 |
| Anji (AJ) | 0 | 0 | 2 | 1 | 5.6 | 0 | 1 | 0 | 3 | 0 | 0 | 3 | 2 | 2 | 1 |
| Ningbo (NB) | 0 | 0 | 2 | 1 | 5.7 | 1 | 1 | 0 | 3 | 0 | 0 | 3 | 2 | 2 | 1 |
| Yixing (YX) | 0 | 0 | 2 | 1 | 5.7 | 1 | 1 | 0 | 3 | 0 | 0 | 3 | 2 | 2 | 1 |
| Jixi (JX) | 1 | 0 | 1 | 1 | 5.1 | 1 | 1 | 0 | 0 | 0 | 0 | 2 | 2 | 2 | 1 |
| Jingde (JD) | 0 | 0 | 2 | 1 | 5.8 | 1 | 1 | 0 | 3 | 0 | 0 | 3 | 2 | 2 | 1 |
| Tongcheng (TC) | 0 | 1 | 1 | 1 | 6.3 | 0 | 1 | 0 | 0 | 0 | 0 | 2 | 2 | 2 | 1 |
| Huoshan (HS) | 1 | 0 | 2 | 1 | 6 | 1 | 1 | 0 | 3 | 0 | 0 | 3 | 2 | 2 | 1 |
| Shucheng (SC) | 0 | 0 | 2 | 1 | 5.55 | 0 | 1 | 0 | 3 | 0 | 0 | 2 | 2 | 2 | 1 |
| Yuexi3 (YX3) | 0 | 0 | 2 | 1 | 5.8 | 0 | 1 | 0 | 3 | 0 | 0 | 3 | 2 | 2 | 1 |
| Yuexi2 (YX2) | 1 | 0 | 2 | 1 | 5.3 | 0 | 1 | 0 | 3 | 0 | 0 | 3 | 2 | 2 | 1 |
| Yuexi1 (YX1) | 0 | 0 | 2 | 1 | 6.3 | 0 | 1 | 0 | 3 | 0 | 0 | 3 | 2 | 2 | 1 |
| Jinzhai (JZ) | 0 | 0 | 1 | 1 | 6.2 | 0 | 1 | 0 | 0 | 0 | 0 | 2 | 2 | 2 | 1 |
| Xinyang (XY) | 0 | 0 | 2 | 1 | 6 | 1 | 1 | 0 | 3 | 0 | 0 | 3 | 2 | 2 | 1 |
Table A2.
The result of ANCOVA between vein density (VD) and altitude in hillside and valley habitats.
Table A2.
The result of ANCOVA between vein density (VD) and altitude in hillside and valley habitats.
| Tests of Between-Subjects Effects | ||||||
|---|---|---|---|---|---|---|
| Dependent Variable: VD | ||||||
| Source | Type III Sum of Squares | df | Mean Square | F | Sig. | Partial Eta Squaed |
| Corrected Model | 87.946 a | 2 | 43.973 | 28.301 | 0.000 | 0.837 |
| Intercept | 8.209 | 1 | 8.209 | 5.284 | 0.042 | 0.324 |
| Altitude | 51.591 | 1 | 51.591 | 33.204 | 0.000 | 0.751 |
| Habitat | 22.112 | 1 | 22.112 | 14.231 | 0.003 | 0.564 |
| Error | 17.091 | 11 | 1.554 | |||
| Total | 868.72 | 14 | ||||
| Corrected Total | 105.037 | 13 | ||||
aR2 = 0.837(Adjusted R2 = 0.808).
Table A3.
The result of ANCOVA between vein density (VD) and MAT in hillside and valley habitats.
Table A3.
The result of ANCOVA between vein density (VD) and MAT in hillside and valley habitats.
| Tests of Between-Subjects Effects | ||||||
|---|---|---|---|---|---|---|
| Dependent Variable: VD | ||||||
| Source | Type Ⅲ Sum of Squares | df | Mean Square | F | Sig. | Partial Eta Squaed |
| Corrected Model | 45.596 a | 2 | 22.798 | 4.219 | 0.044 | 0.434 |
| Intercept | 27.954 | 1 | 27.954 | 5.173 | 0.044 | 0.320 |
| MAT | 9.241 | 1 | 9.241 | 1.71 | 0.218 | 0.135 |
| Habitat | 35.849 | 1 | 35.849 | 6.634 | 0.026 | 0.376 |
| Error | 59.441 | 11 | 5.404 | |||
| Total | 868.72 | 14 | ||||
| Corrected Total | 105.037 | 13 | ||||
aR2 = 0.434 (Adjusted R2 = 0.331).
Table A4.
The result of ANCOVA between vein density (VD) and MAP in hillside and valley habitats.
Table A4.
The result of ANCOVA between vein density (VD) and MAP in hillside and valley habitats.
| Tests of Between-Subjects Effects | ||||||
|---|---|---|---|---|---|---|
| Dependent Variable: VD | ||||||
| Source | Type Ⅲ Sum of Squares | df | Mean Square | F | Sig. | Partial Eta Squaed |
| Corrected Model | 63.194 a | 2 | 31.597 | 8.306 | 0.006 | 0.602 |
| Intercept | 43.208 | 1 | 43.208 | 11.359 | 0.006 | 0.508 |
| MAP | 26.838 | 1 | 26.838 | 7.055 | 0.022 | 0.391 |
| Habitat | 8.702 | 1 | 8.702 | 2.288 | 0.159 | 0.172 |
| Error | 41.843 | 11 | 3.804 | |||
| Total | 868.72 | 14 | ||||
| Corrected Total | 105.037 | 13 | ||||
aR2 = 0.602 (Adjusted R2 = 0.529).
References
- McELwain, J.C.; Yiotis, C.; Lawson, T. Using modern plant trait relationships between observed and theoretical maximum stomatal conductance and vein density to examine patterns of plant macroevolution. New Phytol. 2016, 209, 94–103. [Google Scholar] [CrossRef] [PubMed]
- Meng, X.Y.; Zhang, Z.X.; College of Nature Conservation; Beijing Forestry University. Leaf venation and its taxonomical significance in Sect. Denticulatae (Salix) of China. Bull. Bot. Res. 2017, 37, 481–491. [Google Scholar]
- Sack, L.; Scoffoni, C.; Mckown, A.D.; Frole, K.; Rawls, M.; Havran, J.C.; Tran, H.; Tran, T. Developmentally based scaling of leaf venation architecture explains global patterns. Nat. Commun. 2012, 3, 837. [Google Scholar] [CrossRef] [PubMed]
- Wang, X.L.; Wang, Z.X.; Li, R.Y.; Deng, P.; Ma, L.; Sun, B.-N. Vein density of angiosperms as a paleoclimate proxy: A case study using fossil leaves of Zelkova, and Machilus. Palaeoworld 2016, 25, 60–66. [Google Scholar] [CrossRef]
- Krober, W.; Heklau, H.; Bruelheide, H. Leaf morphology of 40 evergreen and deciduous broad leaved subtropical tree species and relationships to functional ecophysiological traits. Plant Biol. 2015, 17, 373–383. [Google Scholar] [CrossRef] [PubMed]
- Li, X.; Li, Y.; Zhang, Z.; Li, X. Influences of environmental factors on leaf morphology of Chinese jujubes. PLoS ONE 2015, 10, e0127825. [Google Scholar] [CrossRef] [PubMed]
- Sack, L.; Scoffoni, C. Leaf venation: Structure, function, development, evolution, ecology and applications in the past, present and future. New Phytol. 2013, 198, 983–1000. [Google Scholar] [CrossRef] [PubMed]
- Dunbar-Co, S.; Sporck, M.J.; Sack, L. Leaf trait diversification and design in seven rare taxa of the Hawaiian Plantago radiation. Int. J. Plant Sci. 2009, 170, 61–75. [Google Scholar]
- Sellin, A.; Õunapuu, E.; Kaurilind, E.; Alber, M. Size-dependent variability of leaf and shoot hydraulic conductance in silver birch. Trees 2012, 26, 821–831. [Google Scholar] [CrossRef]
- Xie, S.P.; Sun, B.N.; Zhao, J.Y. Leaf venation density of Ginkgo biloba L. as a palaeoclimaticproxy. In Proceedings of the 26th Annual Seminar of China Ancient Society (ASCAS 2011), Guizhou, China, 18–20 October 2011; p. 166. [Google Scholar]
- Brodribb, T.J.; Feild, T.S.; Sack, L. Viewing leaf structure and evolution from a hydraulic perspective. Funct. Plant Biol. 2010, 37, 488–498. [Google Scholar] [CrossRef]
- Wang, X.L.; Wang, J. Plant Morphology, Structure and Environment; Lanzhou University Press: Lanzhou, China, 1989. [Google Scholar]
- Zhu, Y.; Kang, H.; Xie, Q.; Wang, Z.; Yin, S.; Liu, C. Pattern of leaf vein density and climate relationship of Quercus variabilis populations remains unchanged with environmental changes. Trees 2012, 26, 597–607. [Google Scholar] [CrossRef]
- Liu, Y.; Zhang, L.; Xu, X.; Niu, H. Understanding the wide geographic range of a clonal perennial grass: Plasticity versus local adaptation. AoB Plants 2016, 8, 1–7. [Google Scholar] [CrossRef] [PubMed]
- Roth-Nebelsick, A.; Uhl, D.; Mosbrugger, V.; Kerp, H. Evolution and function of leaf venation architecture: A review. Ann. Bot. 2001, 87, 553–566. [Google Scholar] [CrossRef]
- Carins Murphy, M.R.; Jordan, G.J.; Brodribb, T.J. Cell expansion not cell differentiation predominantly coordinates veins and stomata within and among herbs and woody angiosperms grown under sun and shade. Ann. Bot. 2016, 118, 1127–1138. [Google Scholar] [CrossRef] [PubMed]
- Carins Murphy, M.R.; Jordan, G.J.; Brodribb, T.J. Acclimation to humidity modifies the link between leaf size and the density of veins and stomata. Plant Cell Environ. 2014, 37, 124–131. [Google Scholar] [CrossRef] [PubMed]
- Zhao, W.L.; Chen, Y.J.; Brodribb, T.J.; Cao, K.-F. Weak coordination between vein and stomatal densities in 105 angiosperm tree species along altitudinal gradients in Southwest China. Funct. Plant Biol. 2016, 43. [Google Scholar] [CrossRef]
- Price, C.A.; Munro, P.R.; Weitz, J.S. Estimates of leaf vein density are scale dependent. Plant Physiol. 2014, 164, 173–180. [Google Scholar] [CrossRef] [PubMed]
- Caringella, M.A.; Bongers, F.J.; Sack, L. Leaf hydraulic conductance varies with vein anatomy across Arabidopsis thaliana wild-type and leaf vein mutants. Plant Cell Environ. 2015, 38, 2735–2746. [Google Scholar] [CrossRef] [PubMed]
- Hao, R.M.; Wei, H.T. A new combination of Hamamelidaceae. Acta Phytotaxon. Sin. 1998, 36, 80. [Google Scholar]
- Chang, H.D. Hamamelidaceae. In Flora Republicae Popularis Sinica; Chang, H.D., Ed.; Science Press: Beijing, China, 1997; Volume 35, pp. 73–74. [Google Scholar]
- Ellie, M.W.; Jayanthi, N.; Yang, X.Y.; Ballesteros, D.; Sun, W.; Pritchard, H.W. Plant species with extremely small populations (PSESP) in China: A seed and spore biology perspective. Plant. Divers. 2016, 38, 209–220. [Google Scholar]
- Li, W.; Zhang, G.F. Population structure and spatial pattern of the endemic and endangered subtropical tree Parrotia subaequalis (Hamamelidaceae). Flora 2015, 212, 10–18. [Google Scholar] [CrossRef]
- Wang, S.; Xie, Y. China Species Red List; Higher Education Press: Beijing, China, 2004; Volume 1. [Google Scholar]
- Schneider, J.V.; Negraschis, V.; Habersetzer, J.; Rabenstein, R.; Wesenberg, J.; Wesche, K.; Zizka, G. Taxonomic diversity masks leaf vein–climate relationships: Lessons from herbarium collections across a latitudinal rainfall gradient in West Africa. Bot. Lett. 2018. [Google Scholar] [CrossRef]
- Yin, M.Y.; Jiang, Z.M.; Zhu, X.C.; Bao, W.-Q.; Zhao, H.; Wuyun, T. High-level phenotypic variations in populations of Armeniaca sibirica in Nei Mongol, China. Chin. J. Plant Ecol. 2016, 40, 1090–1099. [Google Scholar]
- Liu, J.Q.; Yin, M.Y.; Zuo, S.Y.; Yang, S.-B.; Tana, W. Phenotypic variations in natural populations of Amygdalus pedunculate. Chin. J. Plant Ecol. 2017, 41, 1091–1102. [Google Scholar]
- China Meteorological Data Service Center(CMDC). Available online: www. cdc.cma.gov.cn (accessed on 3 May 2018).
- Dizeo, D.; Strittmatter, C.G. Nueva técnica de diafanización. Bol. Soc. Argent. Bot. 1973, 15, 126–129. [Google Scholar]
- Zhang, Y.; Yang, S.J.; Sun, M.; Cao, K.-F. Stomatal traits are evolutionarily associated with vein density in basal angiosperms. Plant Sci. J. 2014, 32, 320–328. [Google Scholar]
- Abràmoff, M.D.; Magalhães, P.J.; Ram, S.J. Image processing with ImageJ. Biophotonics Int. 2004, 11, 36–42. [Google Scholar]
- Jaleel, C.A.; Manivannan, P.; Wallid, A.; Farooq, M.; Jasim Al-Juburi, H.; Somasundaram, R.; Panneerselvam, R. Drought stress in plants: A review on morphological characteristics and pigments composition. Int. J. Agric. Biol. 2009, 11, 100–105. [Google Scholar]
- Crifo, C.; Currano, E.D.; Baresch, A.; Jaramillo, C. Variations in angiosperm leaf vein density have implications for interpreting life form in the fossil record. Geology 2014, 42, 919–922. [Google Scholar] [CrossRef]
- Mario, P.; Paolo, S. Leaf vein density and photosynthetic rate in Rosa: Is there a correlation? Bol. Soc. Argent. Bot. 2016, 51, 683–687. [Google Scholar]
- Blonder, B.; Enquist, B.J. Inferring climate from angiosperm leaf venation networks. New Phytol. 2014, 204, 116–126. [Google Scholar] [CrossRef] [PubMed]
- Brodribb, T.J.; Jordan, G.J.; Carpenter, R.J. Unified changes in cell size permit coordinated leaf evolution. New Phytol. 2013, 199, 559–570. [Google Scholar] [CrossRef] [PubMed]
- Quintanilla, L.G.; Pias, B. Convergence in leaf phenology traits of two understory ferns in the northwestern Iberian Peninsula. Jour. Plant Ecol. 2018, 11, 92–102. [Google Scholar]
- Geekiyanage, N.; Goodale, U.M.; Cao, K.; Kitajima, K. Leaf trait variation associated with habitat affinity of tropical karst tree species. Ecol. Evol. 2018, 8, 286–295. [Google Scholar] [CrossRef] [PubMed]
- Brodribb, T.J.; Holbrook, N.M. Declining hydraulic efficiency as transpiring leaves desiccate: Two types of response. Plant Cell Environ. 2006, 29, 2205–2215. [Google Scholar] [CrossRef] [PubMed]
- Ellis, B.; Daily, D.C.; Hickey, L.J.; Mitchell, J.V.; Johnson, K.R.; Wilf, P.; Wing, S.L. Manual of Leaf Architecture; Cornell University Press: New York, NY, USA, 2009. [Google Scholar]
- Scoffoni, C.; Rawls, M.; McKown, A.; Cochard, H.; Sack, L. Decline of leaf hydraulic conductance with dehydration: Relationship to leaf size and venation architecture. Plant Physiol. 2011, 156, 832–843. [Google Scholar] [CrossRef] [PubMed]
- Ballian, D.; Faruk, B.; Azra, Č.; Saša, P.; Jozo, F. Population differentiation in the wild cherry (Prunus avium L.) in Bosnia and Herzegovina. Period. Biol. 2012, 114, 43–54. [Google Scholar]
- Boyce, C.K.; Brodribb, T.J.; Field, T.S.; Zwieniecki, M.A. Angiosperm leaf vein evolution was physiologically and environmentally transformative. Proc. Biol. Sci. 2009, 276, 1771–1776. [Google Scholar] [CrossRef] [PubMed]
- Zhang, S.B.; Guan, Z.J.; Sun, M.; Zhang, J.J.; Cao, K.F.; Hu, H. Evolutionary association of stomatal traits with leaf vein density in Paphiopedilum, Orchidaceae. PLoS ONE 2012, 7, e40080. [Google Scholar] [CrossRef] [PubMed]
- Zhang, L.Q. Floristic analysis on Anhui Wanfo Provincial Nature Reserve. Anhui For. Sci. Technol. 2014, 40, 56–58. [Google Scholar]
- Murphy, M.R.C.; Jordan, G.J.; Brodribb, T.J. Differential leaf expansion can enable hydraulic acclimation o sun and shade. Plant Cell Environ. 2012, 35, 1407–1418. [Google Scholar] [CrossRef] [PubMed]
- Zwieniecki, M.A.; Boyce, C.K.; Holbrook, N.M. Hydraulic limitations imposed by crown placement determine final size and shape of Quercus rubra L. leaves. Plant Cell Environ. 2004, 27, 357–365. [Google Scholar] [CrossRef]
- McAdam, S.A.M.; Eléouët, M.P.; Best, M.; Brodribb, T.J.; Murphy, M.R.C.; Cook, S.D.; Dalmais, M.; Dimitriou, T.; Gelinas-Marion, A.; Gill, W.M.; et al. Linking auxin with photosynthetic rate via leaf venation. Plant Physiol. 2017, 175, 351–360. [Google Scholar] [CrossRef] [PubMed]
- Fang, S.Q.; Yan, J.F.; Weng, Q. Population ecological status quo and protection study on Shaniondendron subaequalis MB Deng, HT Wei in Longchi Mountion Reserve in Yixing. J. Jiangsu For. Sci. Technol. 2004, 31, 4–5. [Google Scholar]

© 2018 by the authors. Licensee MDPI, Basel, Switzerland. This article is an open access article distributed under the terms and conditions of the Creative Commons Attribution (CC BY) license (http://creativecommons.org/licenses/by/4.0/).