Article

Identifying Spanish Areas at More Risk of Monthly BTV Transmission with a Basic Reproduction Number Approach

by
Cecilia Aguilar-Vega
1,*,
Jaime Bosch
1,
Eduardo Fernández-Carrión
1,
Javier Lucientes
2 and
José Manuel Sánchez-Vizcaíno
1
1
VISAVET Health Surveillance Centre, Animal Health Department, Faculty of Veterinary Medicine, Complutense University of Madrid, 28040 Madrid, Spain
2
Department of Animal Pathology (Animal Health), AgriFood Institute of Aragón IA2, Faculty of Veterinary Medicine, University of Zaragoza, 50013 Zaragoza, Spain
*
Author to whom correspondence should be addressed.
Viruses 2020, 12(10), 1158; https://doi.org/10.3390/v12101158
Submission received: 10 September 2020 / Revised: 8 October 2020 / Accepted: 12 October 2020 / Published: 13 October 2020
(This article belongs to the Special Issue Bluetongue Virus (BTV))

Abstract

:
Bluetongue virus (BTV) causes a disease that is endemic in Spain and its two major biological vector species, C. imicola and the Obsoletus complex species, differ greatly in their ecology and distribution. Understanding the seasonality of BTV transmission in risk areas is key to improving surveillance and control programs, as well as to better understand the pathogen transmission networks between wildlife and livestock. Here, monthly risk transmission maps were generated using risk categories based on well-known BTV R0 equations and predicted abundances of the two most relevant vectors in Spain. Previously, Culicoides spp. predicted abundances in mainland Spain and the Balearic Islands were obtained using remote sensing data and random forest machine learning algorithm. Risk transmission maps were externally assessed with the estimated date of infection of BTV-1 and BTV-4 historical outbreaks. Our results highlight the differences in risk transmission during April-October, June-August being the period with higher R0 values. Likewise, a natural barrier has been identified between northern and central-southern areas at risk that may hamper BTV spread between them. Our results can be relevant to implement risk-based interventions for the prevention, control and surveillance of BTV and other diseases shared between livestock and wildlife host populations.

1. Introduction

Bluetongue (BT) is an infectious and arboviral disease with a worldwide distribution, that affects primarily ruminants [1]. Bluetongue is caused by bluetongue virus (BTV), the type species of the Orbivirus genus [2]. Numerous serotypes of BTV have been identified, particularly in recent years due to the intensification of BTV sequencing [3]. Clinical forms of BT vary greatly depending on the affected species, sheep and white-tailed deer being the most susceptible ones to the disease [1]; however, the specific BTV strain is also important, as shown by the greater susceptibility of cattle during the BTV-8 circulation in north and central Europe [4]. Due to its transboundary dissemination and the economic losses that BT produces, it is a listed disease of the World Organization for Animal Health (OIE) [5].
Five different BTV serotypes have historically affected Spain (BTV-1, 2, 4, 8 and 10), differing in their spatial distribution. BTV-2 circulated in Minorca and eastern Majorca in 2000 and was deemed to have been eradicated in 2003 [6]. BTV-10 (1956–1960) was mainly recorded in southwestern and central-western areas of mainland Spain [7]. BTV-4 had a similar distribution, although it expanded more in southern areas of mainland Spain, and outbreaks were also notified in 2003 in west Minorca. BTV-1 spread across a wider geographical area causing outbreaks in northern livestock holdings during 2007–2009 [7,8], and having an overall similar distribution to BTV-4 in southwestern and central-western areas [9]. On the contrary, there were sporadic BTV-8 notifications in livestock holdings from 2008 to 2010 in both north and south areas of mainland Spain [7].
Culicoides spp. biting midges serve as biological vectors for the typical serotypes of BTV (BTV-1-24) [1,10], although secondary transmission routes have been identified, namely, transplacental [11,12], iatrogenic [13], oral transmission [12], and even a role for other vectors has been suggested [14,15,16,17]. The Obsoletus complex species are considered major vectors of BTV in central and northern European regions [17,18], while C. imicola is the major vector in the Mediterranean Basin [10,18]. Although, other Culicoides species have been identified as potentially competent vectors [18,19,20], in the present work we will be focusing exclusively on C. imicola and the Obsoletus complex species, since they are considered to be the most important vectors of BTV in Spain [21,22].
Since BTV is an arthropod-borne virus (arbovirus), the distribution of BTV is directly related to the distribution of its vector [10]. Culicoides species distribution is related to different climatological, topographic and anthropogenic factors [22,23,24,25,26]. BTV transmission is highly influenced by temperature. It influences the vector lifespan and metabolism, as well as the period between the vector ingestion of the virus in the blood meal and the virus infection of the salivary glands—enabling virus transmission—known as the extrinsic infection period (EIP) [27]. The basic reproduction number (R0) is defined as “the expected number of secondary cases following the introduction of one infectious individual into a fully susceptible population” [28]. Derived from this definition, when R0 > 1 the virus will spread among the susceptible host population, but when R0 < 1 the virus will eventually disappear [28]. However, due to the assumptions and uncertainties that affect R0 studies, this threshold (R0 > 1 or R0 < 1) is not always met [29]. In addition, R0 studies of vector-borne viruses are more complex, since they have to take into consideration the biology of its vector; and they are even more so when various hosts and vectors are involved [30,31]. Risk maps based on R0 can show areas at more risk of virus transmission, and therefore, they could be useful for decision making [32]. This kind of map has been previously used for different vector-borne diseases, such as West Nile [33], Lyme disease [34], Zika [35]; and for BT in Europe [36], Switzerland [37], the Netherlands [32] and Austria [38].
Taking into account the seasonality of BTV is key to better understand the disease dynamics and the modification of the risk of transmission during different times of the year [38,39]. In this study, we have assessed BTV seasonality in Spain based on the R0, taking into account the major European vectors: C. imicola and the Obsoletus complex species. 1-km2 monthly Culicoides spp. abundance maps for mainland Spain and the Balearic Islands (from April to October) have been generated using random forest algorithm and satellite-derived variables that are known to influence Culicoides spp. distribution.

2. Materials and Methods

2.1. Monthly Culicoides spp. Maps and Environmental Variables

Data of Culicoides spp. catches in Spain were provided by the Spanish Bluetongue National Surveillance Program. The entomological surveillance of this program was initiated in 2004, and is still ongoing to this date [40]. Briefly, CDC UV-light traps are placed near livestock farms weekly from dusk until dawn [41]. C. imicola and the Obsoletus complex species (Culicoides obsoletus and Culicoides scoticus) are the major vector species for BTV in Spain [21,22], therefore, we used data of these biological vectors from 2005 until 2015 to generate monthly abundance maps from April to October. This period coincides with the peak abundances of these species and with the greater transmission of BTV in Spain [21,41], as for northern countries such as the Netherlands [32]. To ensure the homogeneity and representativeness of the subsamples, we removed from the study data from traps that could have a bias. Hence, we exclusively selected traps with at least one catch per month during the seven months included in the study, also ensuring a maximal geographical coverage. From those, when the proximity was less than 10 km, one of the sampling sites was randomly removed to avoid spatial autocorrelation [26]. We finally used 331 sampling sites per month and per species. We chose the maximum abundance per site for C. imicola and the Obsoletus complex species, to mitigate the possible abundance reduction due to climatological or technical problems, as an approximation of the real monthly Culicoides spp. abundance [42].
A review of scientific literature was conducted to choose significant variables to generate predictive models for the Spanish principal vectors [22,23,24,25,42,43,44,45,46,47]. The selected variables can be classified into six different categories: climatic, vegetation indices, host, orography, land cover and soil composition.
Within climatic variables, Land Surface Temperature (LST) of day-time (LSTd) and night-time (LSTn) were retrieved from National Aeronautics and Space Administration’s (NASA) Moderate Resolution Imaging Spectroradiometer (MODIS) product MOD11A2 [48] as an accurate estimate of the day-time and night-time temperature for each day in the study period [49] and this was downloaded from the Level-1 and Atmosphere Archive & Distribution System (LAADS) Distributed Active Archive Center (DAAC) (https://ladsweb.nascom.nasa.gov/). Monthly precipitation and wind speed (m/s) at 10 m above ground level were retrieved from the approximately 1-km2 spatial resolution WorldClim dataset [50].
Vegetation indices are widely used to model arthropod species, being the Normalized Difference Vegetation Index (NDVI) the most common in predictive models due to its utility [51]. NDVI alongside the Enhanced Vegetation Index (EVI) and the medium-infrared (MIR) reflectance band were retrieved from MODIS product MOD13Q1 [52] and downloaded from the LAADS DAAC. Variables derived for MODIS products were acquired from 2005-2015, and mean maps were generated for each month included in the study.
Host availability has been proven to be useful for Culicoides spp. distribution modeling [53,54]. From the Gridded Livestock of the World v2.0 [55] of approximately 1-km grid cell size, cattle, sheep and goat densities were retrieved and unified as a unique variable: livestock density [26]. The estimation of presence/absence of red deer was obtained from the proportion of suitable red deer habitat at approximately 1-km2 spatial resolution [56].
Altitude values were obtained from the Global 30 Arc-Second Elevation (GTOPO30) provided by the U.S. Geological Survey [57]. Land cover and soil type can limit Culicoides spp. breeding sites [58]. Land cover was retrieved from the annual 300 meters’ resolution Climate Change Initiative (CCI) Land Cover provided by the European Space Agency [59]. This dataset was reduced to seven variables according to the midge habitat suitability [47,60]: rainfed cropland (LC1), irrigated cropland (LC2), mix of cropland and natural vegetation (LC3), broadleaved tree cover (LC4), mix of tree/shrub cover and grassland (LC5), grassland (LC6) and urban areas (LC7). Using ArcMapTM v10.4.1. (Esri®), we created a 1-km2 grid of the extension of the study and obtained the percentage of each land cover type. The percentage of clay, sand, silt and the topsoil organic carbon content were obtained from the dataset ‘Topsoil physical properties for Europe’ [61] and “OCTOP: Topsoil Organic Carbon Content for Europe” [62], respectively; available at the European Soil Data Centre (ESDAC; esdac.jrc.ec.europa.eu).
All the predictor rasters were transformed into a 1-km2 spatial and monthly resolution, and to the same extension and projection in ArcMapTM.
For each model, we randomly generated a training (70%) and test (30%) dataset [23]. The latter was used to assess model performance. We chose random forest (RF) to develop our models since it performed better than other machine learning algorithms for Culicoides spp. distribution models in several studies [26,45]. RF grows a specified number of decision trees from randomly bootstrapped samples, and their results are finally aggregated to give a prediction [63,64]. At each node in the splitting process, the variable that reduces the node impurities from a random subsample of them is chosen [63]. When all the trees are built, the average of the decreases provides the variable importance measure for each variable through the mean decrease Gini in classification and the increase in node purities for regression problems [64]. In this work, we used the above-mentioned measures for variable importance measurement. We chose the number of variables randomly selected at each node split which reduces the final mean square error (MSE) of the model. In addition, RF is useful for datasets with highly correlated predictors, being the most relevant ones selected as the most important variables [65].
We first generated monthly probability of presence maps, henceforth occurrence maps, for C. imicola and the Obsoletus complex species, to include those as a variable for abundance maps [24,26]. For occurrence maps, Culicoides spp. catch data was transformed into presence/absence classes, and the 21 variables listed above were used for modeling. In the case of imbalanced datasets, we used the Synthetic Minority Over-sampling Technique (SMOTE) algorithm, to oversample the minority class and randomly under-sample the majority class [66]. Models’ performance were assessed in terms of sensitivity (proportion of real positives classified as such), specificity or recall (proportion of real negatives classified as such), precision (proportion of true positives among predicted positives), the area under the receiver operating characteristic curve (AUC) and the F1 score. All these measures range from 0–1. AUC measures the discriminative power of the model between presence/absence classes. An AUC of 0.5 means that the model is not better than a random guess; values from 0.5–0.7 correspond to poor discrimination, 0.7–0.8 acceptable, 0.8–0.9 excellent, and 0.9–1 exceptional discrimination power [67]. The F1 score is calculated as the harmonic average of precision and recall, and it is a summary of the precision-recall curve [68]. The precision-recall curve best measures the performance of the model when the data set is imbalanced, with the majority class being negative [69]. The value of the F1 score means that the model is not better than random guess varies, and a value of 1 is the maximal model performance. For abundance models, we transformed the absolute catches of Culicoides spp. to log10(C+1), C being the number of individuals caught at each site. We evaluated the performance of abundance models using the mean absolute error (MAE) and root mean squared error (RMSE).
All the models were generated in R v.3.6.3 [70] using the following packages: “randomForest” [64], “DMwR” [71], “caret” [72], “raster” [73], and “pROC” [74].

2.2. Transmission Risk Maps Based on the Basic Reproduction Number (R0)

From the different R0 equations proposed in the literature for BTV [31,32,37,75], we chose the two-vector approach taken by Turner et al. [31] that was adapted from the one proposed by Gubbins et al. [75], since the major BTV vectors in Spain are quite different in terms of distribution and ecology [21], as well as vector capacity [76]. In Turner et al. [31], they only considered in their formulation cattle and sheep as the two hosts; however, we have combined small ruminants (sheep and goat) as one host since in Spain the number of goats is considerably high (more than 2.5 million in mainland Spain and the Balearic Islands [77]). We have considered all susceptible hosts as susceptible, not infectious or recovered, because our goal was to highlight areas at risk of BTV transmission. Moreover, more than two vector species are considered here because the Obsoletus complex is formed by C. obsoletus and C. scoticus.
We have maintained the same notation as Turner et al. [31] for the R0 equation (Equations (1) and (2)), of which the parameters are gathered in Table 1.
R 0 = 1 2 [ ( R 11   +   R 22 )   +   ( R 11   +   R 22 ) 2     4 ( R 11 R 22     R 12 R 21 ) ] ,
R 11 = ( b 1 β 1 a 1 2 µ 1 ) ( v 1 v 1   +   µ 1 ) ( φ 1 2 m C 1 r C   +   d C   +   ( 1 φ 1 ) 2 m S 1 r S   +   d S ) R 22 = ( b 2 β 2 a 2 2 µ 2 ) ( v 2 v 2   +   µ 2 ) ( φ 2 2 m C 2 r C   +   d C   +   ( 1 φ 2 ) 2 m S 2 r S   +   d S ) R 12 = ( b 2 β 1 a 2 a 1 µ 2 ) ( v 2 v 2   +   µ 2 ) ( φ 2 φ 1 m C 1 r C   +   d C   +   ( 1 φ 2 ) ( 1 φ 1 ) m S 1 r S   +   d S ) R 21 = ( b 1 β 2 a 1 a 2 µ 1 ) ( v 1 v 1   +   µ 1 ) ( φ 1 φ 2 m C 2 r C   +   d C   +   ( 1 φ 1 ) ( 1 φ 2 ) m S 2 r S   +   d S )
where subscript 1 denotes C. imicola, 2 the Obsoletus complex species, C cattle, and S small ruminants; and b being the probability of transmission from vector to host, βj the probability of transmission from a host to vector type j, aj the biting rate for vector type j, µj the natural mortality rate of the vector, vj the virogenesis rate in the vector, φ j the proportion of vectors type j attracted to cattle, mij the ratio of vector type j to hosts type i, ri the recovery rate of host type i, and di the mortality rate of host type i. Both vectors have only differed in terms of mij and aj.
φj depends on vector preference for cattle or small ruminants (Table 1). Both C. imicola and Obsoletus complex species prefer feeding on cattle rather than small ruminants [88]. We applied an antilog transformation to the predictive abundance of Culicoides spp. to calculate mij. Although several studies have pointed out the lack of correlation between UV-light trap catches and biting events [89,90,91,92,93], we have assumed that UV-light traps act in a similar way to a host and that the predicted abundance estimated here is an approximation of mij [36]. We used host data (the Gridded Livestock of the World v2.0 [55], merging sheep and goat to obtain small ruminants data), to estimate a minimum threshold of 10 animals [32], below which they would not contribute significantly to BTV transmission. Then, we transformed into integers rasters of vectors and hosts. In addition, mij could only range between 0–5000 [75].
Some parameters are well known to be temperature-dependent (aj, vj and µj) [84,94]. At higher temperatures biting, virogenesis rates and lifespan are shortened [85,94]. Replication of BTV in Culicoides spp. has not been found with temperatures <15 °C [94], and at approximately that temperature the midge lifespan is higher but decreases non-linearly alongside temperature [87]. Therefore, to make monthly R0 prediction maps we required monthly ground-level temperature for mainland Spain and the Balearic Islands that we obtained from the WorldClim dataset [50]. For the estimation of µj we used the formulation proposed by Fernández-Carrión et al. [87], in which µj is calculated by estimating intermediate values from [85,86] using the Hermite cubic interpolation in Matlab [95]. In addition, we have established that BTV transmission is very unlikely to occur below 13 °C [38,94]. We used the monthly mean maximal temperature from the WorldClim dataset [50] to apply this threshold. vj was set to zero when the temperature is less than 10.4071 °C.
We have implemented the R0 equations in R [70], and managed maps using the “raster” package [73]. To determine the degree of contribution of each vector species, we obtained the R0 for each vector using the one vector formulation ( R 11 and R 22 ) [75]. We defined three risk categories for each monthly map according to the natural break classification criteria [96] in ArcMapTM.
To externally assess the performance and usefulness of the monthly transmission risk maps we used historical data from 2007–2018 of BTV-1 (11,482) and BTV-4 (506) outbreaks from the European Animal Disease Notification System (ADNS) database [97], excluding BTV outbreaks in wildlife. We used an estimation of 14 day-lapse between the day of infection and the date of suspicion [98]. The suspicion date was calculated when missing from the mean lapse time between the suspicion and confirmation dates from observations with data (approximately 20 days). We calculated the percentage of outbreaks that fall into the three different risk categories. We compared the observed BTV outbreaks in each risk category with the number of outbreaks expected based on the expected probability, which is derived from the proportion of cells of each category in every monthly risk map. We used the Χ2-square goodness of fit test in R [70] only when the number of observed outbreaks was higher than 100.

3. Results

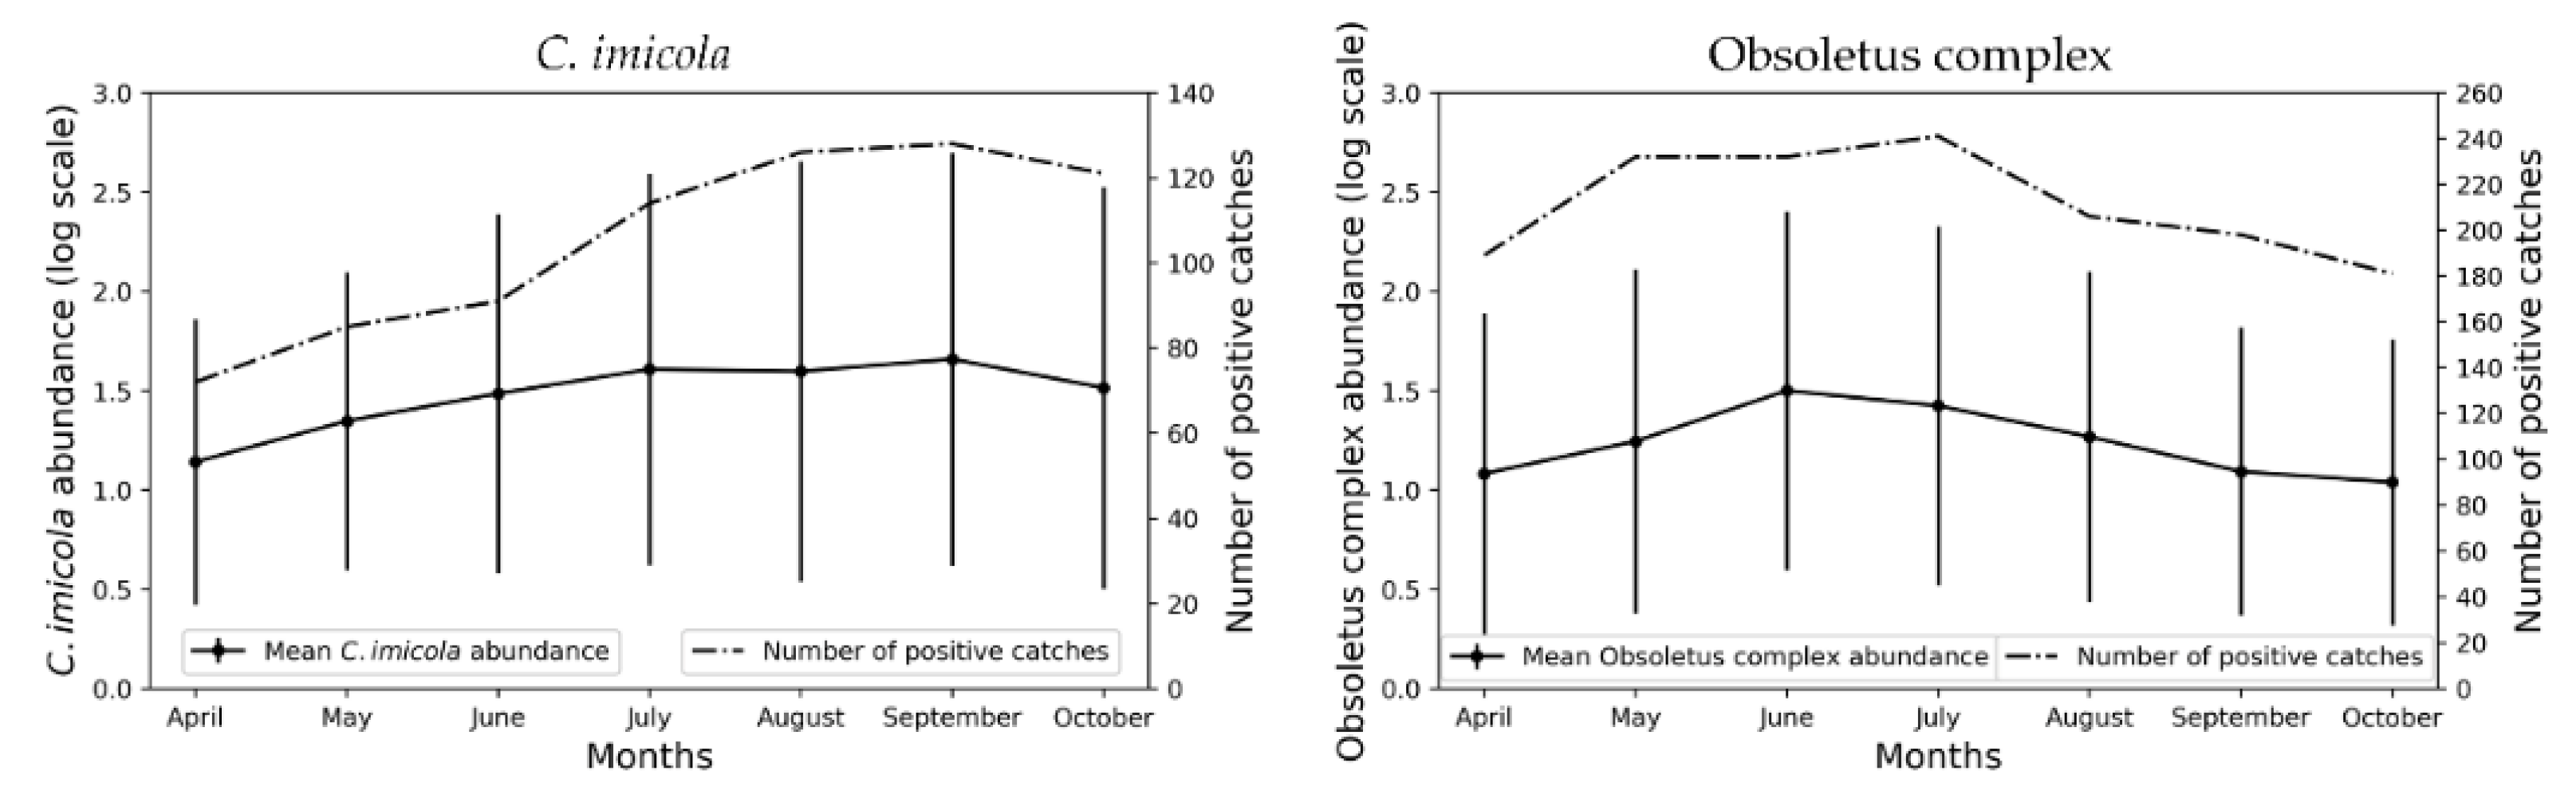
3.1. Monthly Culicoides spp. Maps

The peak of maximal positive catches and average abundance for C. imicola was September, while for the Obsoletus complex species it was July and June (Figure 1). We have generated monthly occurrence and abundance models for C. imicola and the Obsoletus complex species (Figure 2 and Figure 3) from April to October. The seasonality and distribution of these vectors are reflected in the prediction maps. C. imicola is restricted to south and southwestern areas of mainland Spain and the Balearic Islands, while the Obsoletus complex species are widespread in all the territory.
For occurrence models the majority of the datasets were imbalanced in favor of the negative class in the case for C. imicola datasets, and in favor of the positive class for Obsoletus complex species datasets; thus, the SMOTE algorithm was applied (Table S1). The C. imicola occurrence models have an average AUC of 0.83 in contrast with the Obsoletus complex species average of 0.68 (Figure 4, Table S2). The C. imicola models outperformed the Obsoletus species in terms of sensitivity (average 0.81 vs. 0.70) and specificity (average 0.86 vs. 0.65). Taking into account that the test dataset reflects the class distribution of the original dataset, in the case of imbalanced datasets that favors the negative class (C. imicola datasets), specificity is expected to be better. On the other hand, when the majority class is the positive one (as in the Obsoletus complex species datasets), precision is expected to outperform the recall/sensitivity measure, as happened in most of the performances of the Obsoletus complex species occurrence models. Obsoletus complex species models yielded better precision than C. imicola models (average 0.78 vs. 0.72). In terms of the F1 score, the difference between the average of both vectors is low: 0.76 for C. imicola models and 0.74 for Obsoletus species models. The average performance of the abundance models is quite similar between C. imicola and the Obsoletus complex species. The major discrepancy is in the MAE measure, with the C. imicola models performing better (0.53 vs. 0.63); followed by RMSE (0.74 vs. 0.78). As expected for the months of maximal abundance for each vector, the error of the correspondent models is higher.
Table S3 gathers the five most important variables for all the Culicoides spp. models. Climatic predictors are very relevant for all models, vegetation indices contribute in the majority of monthly models, and livestock density, altitude and soil type for some of them. Land cover predictors and probability of presence of red deer never appeared among the most significant predictors for any of the models.

3.2. Transmission Risk Maps

Monthly risk maps of BTV transmission were generated from April-October as can be seen in Figure 5. A clear seasonality closely associated with vector abundance leads to increased BTV transmission risk during the summer months (Figure 1, Figure 2 and Figure 3). This association was expected since vector abundance highly influences the third component of the R0 equation, but also the first and second components are driven by temperature-dependent variables (Equation (2)). Looking at the monthly results, in April, mean R0 was low (0.15), but it increased in May (0.53) and June (1.45), until it reached a peak in July (1.95). In August, the mean R0 slightly decreased (1.64); and it decreased more significantly in September (1.14) and October (0.43). R0 values only considering C. imicola as a vector, were higher in July-September, peaking in August; while in the case of the Obsoletus complex species R0 values were higher during June-August, reaching a peak in July (Figure 6).
Hence, according to our results, June-August are the months of greater transmission in terms of the R0 since during these months the abundance of the Obsoletus complex species is still high and the abundance of C. imicola is rising (Figure 1). The Obsoletus complex species influence the overall R0 more significantly since it is more widespread, and therefore, contribute more to the increase of the R0 in the hole territory; while C. imicola is restricted to south and central areas (Figure 2 and Figure 3). Proof of this is the gradual increase of infection for BTV-1 since June, when the abundance of the Obsoletus complex species peaks (Figure 1), in contrast with BTV-4 that has only circulated in south and central-western areas of mainland Spain.
As can be seen in Figure 5, in mainland Spain there is a clear low-risk area of separation between medium and high transmission risk areas between north and central-southern at-risk areas. In June this barrier it is not as clear, although medium risk areas are not continuous in that area.
The external assessment of the monthly BTV transmission risk maps shows a good fit of the models for BTV, being better for BTV-4 than BTV-1 (Table 2). The majority of outbreaks fell in areas of high and medium risk: for BTV-1, 97.19% in June, 96.67% in July, 95.26% in August, 87.58% in September and 89.77% in October; whilst for BTV-4, 94.94% in September and 94.12% in October. Only in September and October did more than 10% of BTV-1 outbreaks occur in predicted low transmission risk areas. However, in some of these months BTV transmission, inferred by the estimated date of infection, did not exceeded 10 reports during the 2007–2018 period. Therefore, this data does not allow to draw statistically significant conclusions but was included here due to its informative nature. Supporting the results of the external assessment, we found for each monthly risk map with more than 100 outbreaks for each serotype statistical significant differences between all observed BTV outbreaks and the number of expected BTV outbreaks calculated from the expected probability with the Χ2-square goodness of fit test (Table 3). Thus, this result suggests that the observed BTV outbreaks in a risk category reflect the importance of the risk areas rather than the surface size of them.
We have encountered a discrepancy between the highest monthly R0 values and the peak of outbreak notifications; this leap will be discussed later on.

4. Discussion

We have generated monthly BTV transmission risk maps based on the two-host, two-vector R0 formulation [31]. Few BTV R0 studies have been conducted in Spain [79,98], and none have estimated the R0 for all mainland Spain and the Balearic Islands nor have they considered both BTV vectors separately. Being able to estimate the R0 in the hole territory is necessary to better understand the transmission risk in a country, in comparison to the estimation of R0 only on Culicoides spp. sampled areas [32]. Hence, modeling the distribution of the main vector species of Culicoides is essential. Machine learning algorithms are powerful tools for this task, especially RF [26,45,99]. However, knowing the intrinsic characteristics of the datasets we are working with is essential to correctly apply and interpret the performance of the resulting models. The use of the AUC in this kind of imbalanced dataset is misleading and can lead to wrong conclusions, proving that AUC is not always the most convenient parameter to assess the performance of classification models [69]. Thus, although the C. imicola occurrence models outperformed the Obsoletus complex species models (Figure 4, Table S2), the extent of such outperformance cannot be easily quantified since in both cases the original datasets were imbalanced, but with different classes. Our monthly Culicoides spp. models (Figure 1, Figure 2 and Figure 3) are in agreement with the vector seasonality historically recorded for Spain [21], proving the suitability of the subsampled sampling sites chosen for modeling. Despite entomological surveillance programs not being designed specifically for the generation of species distribution modeling, predictive abundance models derived from them have proven to be effective and useful for the generation of disease models [26]. In addition, the external assessment of the monthly models shows their great performance (Table 2), i.e., for the month of the highest number of outbreaks according to the estimated date of infection, 89.77% for BTV-1 and 94.12% for BTV-4 fell in areas of high and medium risk of transmission. In the external assessment, in some months the medium risk category areas had a higher proportion of outbreaks than the high risk category (Table 3). This is explained by the classification method used here (natural breaks [96]) that does not always divide the data into balanced categories. The medium and high risk categories for April, September and October maps account for less than 50% of the total extension of the map, and in every monthly map the high risk area is smaller than the medium risk area.
The two-host, two-vector approach is essential for a country such as Spain in which major vectors are so different in terms of ecology and distribution [21]. These differences could hardly be reflected in the model due to the existing gaps in knowledge in some parameters that are especially relevant for R0 studies, namely, βj, aj, vj and µj. All of these are derived from studies performed in Culicoides sonorensis, the principal BTV American vector [1,10], although some have been adapted to C. imicola [79,87]. When future studies provide new data for the estimation of these parameters for C. imicola and the Obsoletus complex species, they could easily be implemented in our model. We deemed that our approach of estimating µj [87] is more precise than the usual formulation of µ(θ) = 0.0090.16θ [75,100], which does not take into account Culicoides spp. thermal limits, and therefore is not precise for low and high temperatures. The same issue can be attributed to the estimation of aj and vj [84]. This implies a limitation in our study since we have used mean predicted temperatures [50]; and while these could be under the temperature transmission threshold [94], temperature above the mean could have allowed BTV transmission. Sheep and goats have been considered equal in terms of duration of viremia and mortality. This might not be accurate, in particular for the mortality parameter, since goats are usually asymptomatic [1]. In addition, according to several studies that compared Culicoides spp. catches with UV-light traps and animal-baited traps, Culicoides spp. biting events are not faithfully represented by UV-light trap catches [89,90,91,92,93]. The majority of the literature in this respect agrees that C. imicola [90,91] and the Obsoletus complex species [89,93] are overestimated in UV-light traps, although the Obsoletus complex species can be also underestimated [90]. Although a weak linear correlation has been found between UV-light and animal-baited abundances in horses of some Culicoides species [93], the interpretation of the relation between the abundances using both methods is not yet clearly established. Hence, our estimates of mij might be overestimated, however, the models showed that more than 87% and 94% of outbreaks (BTV-1 and BTV-4, respectively) in Spain fell in areas with risk of transmission.
Due to the above-mentioned uncertainties, giving the threshold derived from the R0 definition of one, above which the disease would persist, would be arbitrary; and that is why using three categories to show the risk of BTV transmission for each month is more appropriate. Likewise, the external assessment of the monthly transmission risk maps proves this categorization convenient since the majority of the historically reported outbreaks fell into high and medium at-risk areas (Table 2). External assessment for the Balearic Islands was not possible since no accurate data of the outbreaks’ location was available. The low disagreement found in the external assessment can be partially explained because we are using predicted mean temperatures [50] and steady Culicoides spp. predicted abundance, without addressing annual variations in terms of climatic conditions. In addition, we did not include other Culicoides species that could be involved in BTV transmission in Spain, such as the Pulicaris complex [101], Culicoides dewulfi [102], Culicoides chiopterus [19], Culicoides circumscriptus and Culicoides paolae [20]. This could have also led to a slight overestimation of the transmission risk of areas inhabited by C. imicola in months of lesser abundance of this species (April-June) in comparison with Palearctic species, and therefore a slight underestimation of the risk of transmission in northern areas.
Another source of potential limitation is that we have deemed the host population as static and changeless through the months of study. Likewise, we have not included wildlife hosts in the model when red deer is potentially a BTV reservoir due to its long viremia [103]. However, in France, it was determined that red deer did not contribute to BTV maintenance [104], while in Spain the BTV wildlife cycle is more or less independent from the domestic, even more so with higher red deer abundance [105]. In addition, we have not fully addressed the Culicoides spp. feeding patterns, which are included in the study in the vector preference for host (σ). Culicoides spp. can feed in a wide variety of hosts depending on the species [106], including wild ruminant species for the Culicoides species that belong to the Obsoletus complex [107].
In our study, July is the month of maximal R0 transmission in Spain, followed by August, June and September. Our results are in agreement with Napp et al. [98] who studied the R0 during the epidemic wave of BTV-1 in the southern region of Andalusia. In their study, R0 reached its peak in July, and progressively decreased until almost reaching zero in November [98]. Our results are also comparable to the ones obtained in Austria, where the Obsoletus complex species are the major vector, in which higher R0 values were found between June-August [38]. In the case of strains that have been previously circulating during the previous year in areas where the Obsoletus complex species are more abundant, maximum vaccination coverage should be reached before June, since there is a quantum leap in the R0 between May and June. Although there is not a strong increase of R0 values between months when only considering C. imicola, vaccination campaigns should be ended before July.
For most years, October is the month of greater transmission except for BTV-1 during 2008–2010, when the virus was circulating in northern regions [26]. According to the cumulative outbreak data (Table 2), for both BTV strains there is a peak of notifications in October, although R0 is lower that month. Between May and June there is a noticeable leap in the mean R0 values, and according to our results in June-August the R0 is higher in Spain (Figure 6). Therefore, at the beginning of the period of greater estimated BTV transmission, few farms were infected, but they increased progressively through the months of greater risk of transmission. R0 shows the secondary cases derived from a primary case, and in October the number of cases is higher, showing that midge abundance and climatic conditions are still favorable for BTV transmission, in particular for areas where C. imicola is more abundant (Figure 5). Our study considered all susceptible host populations as naïve and showed at-risk areas without taking into account infected or recovered hosts, either naturally or artificially immunized. Although the model was not designed for an epidemic wave nor an endemic scenario, in which the same strain has been circulating several years, as had happened in Spain several times [7], it could be adapted into a susceptible-infected-recovered model. In addition, our model could be combined with atmospheric dispersion models specifically designed for Culicoides spp. [87], to simulate the arrival of infected midges from north Africa and simulate BTV spread thereafter, being able to take into account the seasonality of vector populations. However, even as it is, it is useful to highlight areas of higher transmission regardless of which strain/s might be circulating, and therefore can be useful to improve surveillance and design control and eradication programs more accurately.
In this study, we have identified a natural barrier that hampers the spread of BTV between northern and central-southern at-risk areas of BTV transmission in mainland Spain. This barrier occurs as a consequence of different temperatures in between both at-risk areas (Figure S1). These low mean temperatures prevent the distribution of C. imicola (Figure 2) and limit the distribution of the Obsoletus complex species during the majority of months (Figure 3). The lower mij, along with the influence on temperature-dependent variables, significantly restrain BTV transmission in the R0 models for this area. Changes in climatic conditions —i.e., increase of the mean temperature— due to climate change may alter, and even erase this natural barrier. Future studies could be conducted to simulate possible modifications due to the increase in temperature. Only in June is this barrier less clear. According to both R0 (Figure 6) and the estimated date of infection of notified outbreaks (Table 2), BTV transmission is beginning to increase but is still lower during this month in comparison with the subsequent month. Therefore, it is unlikely that transmission can occur between these two well-defined risk areas.
Historically, the majority of strains that have circulated in Spain were introduced through the south [7], and that is why the northern at-risk area has been less affected than the southern one. However, in November 2007, outbreaks of BTV-1 were reported in the northern province of the Basque Country [108], separated by hundreds of kilometers from the nearest BTV-1 reported outbreaks in central Spain [26]. After ruling out animal movement from BTV-1 affected areas, the possible long-distance wind-borne transportation of infected midges was pointed out as the possible means of introduction into the region [108]. The possibility of transmission due to short-range dispersal, which can reach a maximum of 5 km [109], of infected Culicoides spp. is very unlikely since it was a novel strain in Spain that produced clinical signs and it was not detected in between [108]. This event showed the implication of the Obsoletus complex species as competent vectors in Spain [8], as it is for northern Europe [17,18], and reinforces our results. However, it also raises the concern that strains of BTV-4 and other serotypes could circulate in northern Spanish areas as observed in countries further north [110]. More studies are needed to determine if the scarce abundance of C. imicola in northern areas of Spain could play a role in the management of the control and eradication of the disease.

5. Conclusions

In this study we have identified areas of greater risk of BTV transmission during April-October in Spain, with a formulation that enables the consideration of the dissimilarity in vector capacity of C. imicola and the Obsoletus complex species [31], although, more field or laboratory studies are required to better address those differences. We have also identified two large areas at risk of BTV circulation; the northern area, where the predominant vectors are the Obsoletus complex species, and the central-southern area, where C. imicola is more abundant. Both areas are separated by a natural barrier determined by temperature in which transmission is predicted to be low. Climate change could alter this barrier and/or its seasonality. The external validation performed shows that our models have correctly identified areas at risk of BTV transmission and that our results can certainly be of significance to better focus resources of BTV control and surveillance programs during the months of April-October in Spain. Our methodology can be extrapolated to other regions of the Mediterranean Basin where C. imicola and the Obsoletus complex species are major BTV vectors. To apply it to a larger scale, the harmonization of midge catches should be achieved so the standardization of abundances obtained with different trap types can be avoided [111]. In addition, the methodology described here could be applied to ecological studies and studies of arbovirus whose biological vector are insects of the Culicoides genus, namely African horse sickness virus, Schmallenberg virus and epizootic hemorrhagic disease virus, among others.

Supplementary Materials

The following are available online at https://www.mdpi.com/1999-4915/12/10/1158/s1, Table S1: Monthly numbers and percentages of Culicoides spp. positive catches (presence) in the entire dataset and in the occurrence models training dataset after the application of the Synthetic Minority Over-sampling Technique (SMOTE) algorithm, Table S2: Culicoides spp. occurrence and abundance models performance, Table S3: Monthly variable importance of the Culicoides spp. occurrence models through the mean decrease Gini (MDG), and abundance models through the increase in node purity (INP), Figure S1: WorldClim monthly mean temperatures for mainland Spain and the Balearic Islands. The climatic data presented here is available online: https://worldclim.org/. Administrative boundaries provided by Instituto Geográfico Nacional (ign.es); BDDAE CC-BY 4.0.

Author Contributions

Conceptualization, C.A.-V. and J.M.S.-V.; methodology, C.A.-V., J.B. and E.F.-C.; software, C.A.-V.; validation, C.A.-V. and J.B.; formal analysis, C.A.-V.; investigation, C.A.-V., J.L. and J.M.S.-V.; resources, E.F.-C., J.L. and J.M.S.-V.; data curation, C.A.-V. and J.B.; writing—original draft preparation, C.A.-V. and J.B.; writing—review and editing, E.F.-C., J.L. and J.M.S.-V.; visualization, C.A.-V.; supervision, J.M.S.-V.; project administration, J.M.S.-V.; funding acquisition, J.M.S.-V. All authors have read and agreed to the published version of the manuscript.

Funding

This research was funded by the Horizon 2020 program of the European Union through the project ‘Understanding pathogen, livestock, environment interactions involving bluetongue’ (PALE-Blu; project No: 727393-2). C.A.-V. is the recipient of a Spanish Government-funded PhD fellowship for the Training of Future Scholars (FPU) given by the Spanish Ministry of Science, Innovation and Universities (Ministerio de Ciencia, Innovación y Universidades).

Acknowledgments

The authors would like to thank the Spanish Ministry of Agriculture, Fishery and Food (MAPA) for providing data of the Spanish BTV outbreaks.

Conflicts of Interest

The authors declare no conflict of interest.

References

  1. Sperlova, A.; Zendulkova, D. Bluetongue: A review. Vet. Med. 2011, 56, 430–452. [Google Scholar] [CrossRef] [Green Version]
  2. Walker, P.J.; Siddell, S.G.; Lefkowitz, E.J.; Mushegian, A.R.; Dempsey, D.M.; Dutilh, B.E.; Harrach, B.; Harrison, R.L.; Hendrickson, R.C.; Junglen, S.; et al. Changes to virus taxonomy and the International Code of Virus Classification and Nomenclature ratified by the International Committee on Taxonomy of Viruses (2019). Arch. Virol. 2019, 164, 2417–2429. [Google Scholar] [CrossRef] [PubMed] [Green Version]
  3. Marcacci, M.; Sant, S.; Mangone, I.; Goria, M.; Dondo, A.; Zoppi, S.; van Gennip, R.G.P.; Radaelli, M.C.; Cammà, C.; van Rijn, P.A.; et al. One after the other: A novel Bluetongue virus strain related to Toggenburg virus detected in the Piedmont region (North-western Italy), extends the panel of novel atypical BTV strains. Transbound Emerg. Dis. 2018, 65, 370–374. [Google Scholar] [CrossRef]
  4. EFSA Panel on Animal Health and Welfare (AHAW). Scientific Opinion on bluetongue serotype 8. EFSA J. 2011, 9, 2189. [Google Scholar] [CrossRef]
  5. Wilson, A.J.; Mellor, P.S. Bluetongue in Europe: Vectors, epidemiology and climate change. Parasitol. Res. 2008, 103 (Suppl. 1), S69–S77. [Google Scholar] [CrossRef] [PubMed]
  6. MARM. Lengua Azul: Situación de la Enfermedad en España y Europa; Ministerio de Medio Ambiente, Medio Rural y Marino: Madrid, Spain, 2008.
  7. de Diego, A.C.; Sánchez-Cordón, P.J.; Sánchez-Vizcaíno, J.M. Bluetongue in Spain: From the first outbreak to 2012. Transbound Emerg. Dis. 2014, 61, e1–e11. [Google Scholar] [CrossRef] [PubMed]
  8. MAGRAMA. Informe sobre la declaración de libre del serotipo 1 del virus de la lengua azul en el norte y este peninsular español); Ministerio de Agricultura, Alimentación y Medio Ambiente: Madrid, Spain, 2015.
  9. MAGRAMA. Informe de Situación del Virus de la Lengua Azul en España (19/1/2015); Ministerio de Agricultura, Alimentación y Medio Ambiente: Madrid, Spain, 2015.
  10. Wilson, A.J.; Mellor, P.S. Bluetongue in Europe: Past, present and future. Philos Trans. R Soc. Lond. B Biol. Sci. 2009, 364, 2669–2681. [Google Scholar] [CrossRef]
  11. Clercq, K.; Vandenbussche, F.; Vandemeulebroucke, E.; Vanbinst, T.; Leeuw, I.; Verheyden, B.; Goris, N.; Mintiens, K.; Méroc, E.; Herr, C.; et al. Transplacental Bluetongue infection in cattle. Vet. Rec. 2008, 162, 564. [Google Scholar] [CrossRef] [PubMed]
  12. Backx, A.; Heutink, R.; van Rooij, E.; van Rijn, P. Transplacental and oral transmission of wild-type bluetongue virus serotype 8 in cattle after experimental infection. Vet. Microbiol. 2009, 138, 235–243. [Google Scholar] [CrossRef] [Green Version]
  13. Darpel, K.E.; Barber, J.; Hope, A.; Wilson, A.J.; Gubbins, S.; Henstock, M.; Frost, L.; Batten, C.; Veronesi, E.; Moffat, K.; et al. Using shared needles for subcutaneous inoculation can transmit bluetongue virus mechanically between ruminant hosts. Sci. Rep. 2016, 6, 20627. [Google Scholar] [CrossRef] [Green Version]
  14. Bouwknegt, C.; van Rijn, P.A.; Schipper, J.J.M.; Hölzel, D.; Boonstra, J.; Nijhof, A.M.; van Rooij, E.M.A.; Jongejan, F. Potential role of ticks as vectors of bluetongue virus. Exp. Appl. Acarol. 2010, 52, 183–192. [Google Scholar] [CrossRef] [PubMed] [Green Version]
  15. Brown, S.E.; Gorman, B.M.; Tesh, R.B.; Knudson, D.L. Isolation of bluetongue and epizootic hemorrhagic disease viruses from mosquitoes collected in Indonesia. Vet. Microbiol. 1992, 32, 241–252. [Google Scholar] [CrossRef]
  16. Luedke, A.J.; Jochim, M.M.; Bowne, J.G. Preliminary bluetongue Transmission with the sheep ked Melophagus ovinus (L.). Can. J. Comp. Med. Vet. Sci. 1965, 29, 229–231. [Google Scholar] [CrossRef] [PubMed] [Green Version]
  17. Mehlhorn, H.; Walldorf, V.; Klimpel, S.; Jahn, B.; Jaeger, F.; Eschweiler, J.; Hoffmann, B.; Beer, M. First occurrence of Culicoides obsoletus-transmitted Bluetongue virus epidemic in Central Europe. Parasitol. Res. 2007, 101, 219–228. [Google Scholar] [CrossRef]
  18. Meiswinkel, R.; Baldet, T.; de Deken, R.; Takken, W.; Delécolle, J.C.; Mellor, P.S. The 2006 outbreak of bluetongue in northern Europe—The entomological perspective. Prev. Vet. Med. 2008, 87, 55–63. [Google Scholar] [CrossRef]
  19. Dijkstra, E.; van der Ven, I.J.; Meiswinkel, R.; Holzel, D.R.; Van Rijn, P.A.; Meiswinkel, R. Culicoides chiopterus as a potential vector of bluetongue virus in Europe. Vet. Rec. 2008, 162, 422. [Google Scholar] [CrossRef]
  20. Foxi, C.; Meloni, G.; Puggioni, G.; Manunta, D.; Rocchigiani, A.; Vento, L.; Cabras, P.; Satta, G. Bluetongue virus detection in new Culicoides species in Sardinia, Italy. Vet. Rec. 2019, 184, 621. [Google Scholar] [CrossRef]
  21. Lucientes, J.; Alarcón-Elbal, P.M. Culicoides biting midges in Spain: A brief overview. Small Rumin. Res. 2016, 142, 69–71. [Google Scholar] [CrossRef]
  22. Calvete, C.; Estrada, R.; Miranda, M.A.; Borrás, D.; Calvo, J.H.; Lucientes, J. Modelling the distributions and spatial coincidence of bluetongue vectors Culicoides imicola and the Culicoides obsoletus group throughout the Iberian peninsula. Med. Vet. Entomol. 2008, 22, 124–134. [Google Scholar] [CrossRef]
  23. Cuéllar, A.C.; Jung Kjær, L.; Baum, A.; Stockmarr, A.; Skovgard, H.; Nielsen, S.A.; Andersson, M.G.; Lindström, A.; Chirico, J.; Lühken, R.; et al. Monthly variation in the probability of presence of adult Culicoides populations in nine European countries and the implications for targeted surveillance. Parasit Vectors 2018, 11, 608. [Google Scholar] [CrossRef]
  24. Ducheyne, E.; Miranda Chueca, M.A.; Lucientes, J.; Calvete, C.; Estrada, R.; Boender, G.J.; Goossens, E.; De Clercq, E.M.; Hendrickx, G. Abundance modelling of invasive and indigenous Culicoides species in Spain. Geospat Health 2013, 8, 241–254. [Google Scholar] [CrossRef] [PubMed] [Green Version]
  25. Conte, A.; Goffredo, M.; Ippoliti, C.; Meiswinkel, R. Influence of biotic and abiotic factors on the distribution and abundance of culicoides imicola and the obsoletus complex in Italy. Vet. Parasitol. 2007, 150. [Google Scholar] [CrossRef] [PubMed]
  26. Aguilar-Vega, C.; Fernández-Carrión, E.; Lucientes, J.; Sánchez-Vizcaíno, J.M. A model for the assessment of bluetongue virus serotype 1 persistence in Spain. PLoS ONE 2020, 15, e0232534. [Google Scholar] [CrossRef] [PubMed]
  27. Dye, C. The analysis of parasite transmission by bloodsucking insects. Annu. Rev. Entomol. 1992, 37, 1–19. [Google Scholar] [CrossRef] [PubMed]
  28. Choisy, M.; Guégan, J.F.; Rohani, P. Mathematical Modeling of Infectious Diseases Dynamics. In Encyclopedia of Infectious Diseases; Tibayrenc, M., Ed.; John Wiley & Sons, Inc.: Hoboken, NJ, USA, 2006; pp. 379–404. [Google Scholar] [CrossRef]
  29. Li, J.; Blakeley, D.; Smith, R.J. The failure of R0. Comput. Math. Methods Med. 2011, 2011, 527610. [Google Scholar] [CrossRef] [PubMed] [Green Version]
  30. Lopez, L.F.; Coutinho, F.A.B.; Burattini, M.N.; Massad, E. Threshold conditions for infection persistence in complex host-vectors interactions. C R Biol. 2002, 325, 1073–1084. [Google Scholar] [CrossRef]
  31. Turner, J.; Bowers, R.G.; Baylis, M. Two-Host, Two-Vector Basic Reproduction Ratio (R0) for Bluetongue. PLoS ONE 2013, 8, e53128. [Google Scholar] [CrossRef] [Green Version]
  32. Hartemink, N.A.; Purse, B.V.; Meiswinkel, R.; Brown, H.E.; de Koeijer, A.; Elbers, A.R.W.; Boender, G.J.; Rogers, D.J.; Heesterbeek, J.A.P. Mapping the basic reproduction number (R0) for vector-borne diseases: A case study on bluetongue virus. Epidemics 2009, 1, 153–161. [Google Scholar] [CrossRef]
  33. Calistri, P.; Savini, L.; Candeloro, L.; Di Sabatino, D.; Cito, F.; Bruno, R.; Danzetta, M.L. A Transitional Model for the Evaluation of West Nile Virus Transmission in Italy. Transbound Emerg. Dis. 2016, 63, 485–496. [Google Scholar] [CrossRef]
  34. Ogden, N.H.; Radojevic, M.; Wu, X.; Duvvuri, V.R.; Leighton, P.A.; Wu, J. Estimated effects of projected climate change on the basic reproductive number of the Lyme disease vector Ixodes scapularis. Environ. Health Perspect 2014, 122, 631–638. [Google Scholar] [CrossRef] [Green Version]
  35. Rocklov, J.; Quam, M.B.; Sudre, B.; German, M.; Kraemer, M.U.G.; Brady, O.; Bogoch, I.I.; Liu-Helmersson, J.; Wilder-Smith, A.; Semenza, J.C.; et al. Assessing Seasonal Risks for the Introduction and Mosquito-borne Spread of Zika Virus in Europe. EBioMedicine 2016, 9, 250–256. [Google Scholar] [CrossRef] [PubMed] [Green Version]
  36. Guis, H.; Caminade, C.; Calvete, C.; Morse, A.P.; Tran, A.; Baylis, M. Modelling the effects of past and future climate on the risk of bluetongue emergence in Europe. J. R Soc. Interface 2012, 9, 339–350. [Google Scholar] [CrossRef] [PubMed] [Green Version]
  37. Racloz, V.; Venter, G.; Griot, C.; Stärk, K.D.C. Estimating the temporal and spatial risk of bluetongue related to the incursion of infected vectors into Switzerland. BMC Vet. Res. 2008, 4, 42. [Google Scholar] [CrossRef] [Green Version]
  38. Brugger, K.; Rubel, F. Bluetongue Disease Risk Assessment Based on Observed and Projected Culicoides obsoletus spp. Vector Densities. PLoS ONE 2013, 8, e60330. [Google Scholar] [CrossRef] [PubMed] [Green Version]
  39. Mayo, C.; Shelley, C.; MacLachlan, N.J.; Gardner, I.; Hartley, D.; Barker, C. A Deterministic Model to Quantify Risk and Guide Mitigation Strategies to Reduce Bluetongue Virus Transmission in California Dairy Cattle. PLoS ONE 2016, 11, e0165806. [Google Scholar] [CrossRef] [PubMed] [Green Version]
  40. MAPA. Red de Alerta Sanitaria Veterinaria (RASVE); Ministerio de Agricultura, Alimentación y Medio Ambiente: Madrid, Spain, 2020.
  41. Calvete, C.; Estrada, R.; Miranda, M.A.; Del Río, R.; Borrás, D.; Garrido, L.; Muñoz, B.; Romero, L.J.; Lucientes, J. Evaluación de la eficacia del programa de monitorización de las poblaciones de vectores de lengua azul, Culicoides imicola Kieffer, 1913 y el complejo Culicoides obsoletus Meigen, 1818 (Diptera: Ceratopogonidae), en España. ITEA 2009, 105, 147–160. [Google Scholar]
  42. Baylis, M.; El Hasnaoui, H.; Bouayoune, H.; Touti, J.; Mellor, P.S. The spatial and seasonal distribution of African horse sickness and its potential Culicoides vectors in Morocco. Med. Vet. Entomol. 1997, 11, 203–212. [Google Scholar] [CrossRef]
  43. Rigot, T.; Conte, A.; Goffredo, M.; Ducheyne, E.; Hendrickx, G.; Gilbert, M. Predicting the spatio-temporal distribution of Culicoides imicola in Sardinia using a discrete-time population model. Parasit Vectors 2012, 5, 270. [Google Scholar] [CrossRef] [Green Version]
  44. Acevedo, P.; Ruiz-Fons, F.; Estrada, R.; Márquez, A.L.; Miranda, M.A.; Gortázar, C.; Lucientes, J. A Broad Assessment of Factors Determining Culicoides imicola Abundance: Modelling the Present and Forecasting Its Future in Climate Change Scenarios. PLoS ONE 2010, 5, e14236. [Google Scholar] [CrossRef] [Green Version]
  45. Peters, J.; De Baets, B.; Van Doninck, J.; Calvete, C.; Lucientes, J.; De Clercq, E.M.; Ducheyne, E.; Verhoest, N. Absence reduction in entomological surveillance data to improve niche-based distribution models for Culicoides imicola. Prev. Vet. Med. 2011, 100, 15–28. [Google Scholar] [CrossRef]
  46. Searle, K.R.; Blackwell, A.; Falconer, D.; Sullivan, M.; Butler, A.; Purse, B.V. Identifying environmental drivers of insect phenology across space and time: Culicoides in Scotland as a case study. Bull. Entomol. Res. 2013, 103, 155–170. [Google Scholar] [CrossRef] [PubMed]
  47. Purse, B.V.; Falconer, D.; Sullivan, M.J.; Carpenter, S.; Mellor, P.S.; Piertney, S.B.; Mordue, A.J.; Albon, S.; Gunn, G.J.; Blackwell, A. Impacts of climate, host and landscape factors on Culicoides species in Scotland. Med. Vet. Entomol. 2012, 26, 168–177. [Google Scholar] [CrossRef]
  48. Wan, Z.; Hook, S.; Hulley, G. MOD11A2 MODIS/Terra Land Surface Temperature/Emissivity 8-Day L3 Global 1km SIN Grid V006, V006 [Data set] ed.; NASA: Washington, DC, USA, 2015. [CrossRef]
  49. Wan, Z. New refinements and validation of the collection-6 MODIS land-surface temperature/emissivity product. Remote Sens. Environ. 2014, 140, 36–45. [Google Scholar] [CrossRef]
  50. Fick, S.E.; Hijmans, R.J. WorldClim 2: New 1-km spatial resolution climate surfaces for global land areas. Int. J. Clim. 2017. [Google Scholar] [CrossRef]
  51. Campbell, J.B.; Wynne, R.H. Introduction to Remote Sensing; Guilford Press: New York, NY, USA, 2011. [Google Scholar]
  52. Didan, K. MOD13Q1 MODIS/Terra Vegetation Indices 16-Day L3 Global 250m SIN Grid V006, V006 [Data set] ed.; NASA: Washington, DC, USA, 2015. [CrossRef]
  53. Calvete, C.; Estrada, R.; Miranda, M.A.; Borrás, D.; Calvo, J.H.; Lucientes, J. Ecological correlates of bluetongue virus in Spain: Predicted spatial occurrence and its relationship with the observed abundance of the potential Culicoides spp. vector. Vet. J. 2009, 182, 235–243. [Google Scholar] [CrossRef] [PubMed]
  54. Chanda, M.M.; Carpenter, S.; Prasad, G.; Sedda, L.; Henrys, P.A.; Gajendragad, M.R.; Purse, B.V. Livestock host composition rather than land use or climate explains spatial patterns in bluetongue disease in South India. Sci. Rep. 2019, 9, 4229. [Google Scholar] [CrossRef] [Green Version]
  55. Robinson, T.P.; Wint, G.R.W.; Conchedda, G.; Van Boeckel, T.P.; Ercoli, V.; Palamara, E.; Cinardi, G.; D’Aietti, L.; Hay, S.I.; Gilbert, M. Mapping the Global Distribution of Livestock. PLoS ONE 2014, 9, e96084. [Google Scholar] [CrossRef] [PubMed] [Green Version]
  56. Wint, W.; Morley, D.; Medlock, J.; Alexander, N. A First Attempt at Modelling Red Deer (Cervus elaphus) Distributions Over Europe. Open Health Data 2014, 2, e1. [Google Scholar] [CrossRef] [Green Version]
  57. USGS. Global 30 Arc-Second Elevation (GTOPO30); United States Geological Survey: Reston, VA, USA, 1996. [CrossRef]
  58. Scolamacchia, F.; Van Den Broek, J.; Meiswinkel, R.; Heesterbeek, J.A.P.; Elbers, A.R.W. Principal climatic and edaphic determinants of Culicoides biting midge abundance during the 2007–2008 bluetongue epidemic in the Netherlands, based on OVI light trap data. Med. Vet. Entomol. 2014, 28, 143–156. [Google Scholar] [CrossRef]
  59. ESA. Land Cover CCI Product User Guide Version 2.0. Available online: http://maps.elie.ucl.ac.be/CCI/viewer/download/ESACCI-LC-Ph2-PUGv2_2.0.pdf (accessed on 12 September 2017).
  60. Ippoliti, C.; Gilbert, M.; Vanhuysse, S.; Goffredo, M.; Satta, G.; Wolff, E.; Conte, A. Can landscape metrics help determine the Culicoides imicola distribution in Italy? Geospat. Health 2013, 8, 267–277. [Google Scholar] [CrossRef] [Green Version]
  61. Ballabio, C.; Panagos, P.; Monatanarella, L. Mapping topsoil physical properties at European scale using the LUCAS database. Geoderma 2016, 261, 110–123. [Google Scholar] [CrossRef]
  62. Jones, R.J.A.; Hiederer, R.; Rusco, E.; Montanarella, L. Estimating organic carbon in the soils of Europe for policy support. Eur. J. Soil Sci. 2005, 56, 655–671. [Google Scholar] [CrossRef] [Green Version]
  63. Breiman, L. Random Forests. Mach. Learn. 2001, 45, 5–32. [Google Scholar] [CrossRef] [Green Version]
  64. Liaw, A.; Wiener, M. Classification and Regression by randomForest. R News 2002, 2, 18–22. [Google Scholar]
  65. Archer, K.J.; Kimes, R.V. Empirical characterization of random forest variable importance measures. Comput. Stat. Data Anal. 2008, 52, 2249–2260. [Google Scholar] [CrossRef]
  66. Chawla, N.V.; Bowyer, K.W.; Hall, L.O.; Kegelmeyer, W.P. SMOTE: Synthetic minority over-sampling technique. J. Artif. Int. Res. 2002, 16, 321–357. [Google Scholar] [CrossRef]
  67. Hosmer, D.W.; Lemeshow, S.; Sturdivant, R.X. Assessing the Fit of the Model. In Applied Logistic Regression; Balding, D.J., Cressie, N.A.C., Fitzmaurice, G.M., Goldstein, H., Johnstone, I.M., Molenberghs, G., Scott, D.W., Smith, A.F.M., Tsay, R.S., Weisberg, S., Eds.; John Wiley & Sons, Inc.: Hoboken, NJ, USA, 2013; pp. 153–225. [Google Scholar] [CrossRef]
  68. Aggarwal, C.C. Data Mining: The Textbook; Springer International Publishing: Dordrecht, The Netherlands, 2015. [Google Scholar] [CrossRef]
  69. Saito, T.; Rehmsmeier, M. The Precision-Recall Plot Is More Informative than the ROC Plot When Evaluating Binary Classifiers on Imbalanced Datasets. PLoS ONE 2015, 10, e0118432. [Google Scholar] [CrossRef] [Green Version]
  70. R Core Team. R: A Language and Environment for Statistical Computing; R Foundation for Statistical Computing: Vienna, Austria, 2020. [Google Scholar]
  71. Torgo, L. Data Mining with R, Learning with Case Studies; Chapman and Hall/CRC: New York, NY, USA, 2010. [Google Scholar] [CrossRef]
  72. Kuhn, M. Caret: Classification and Regression Training. R package version 6.0-86. Available online: https://CRAN.R-project.org/package=caret (accessed on 13 October 2020).
  73. Hijmans, R.J. Raster: Geographic Data Analysis and Modeling. R package version 3.3-13. Available online: https://CRAN.R-project.org/package=raster (accessed on 13 October 2020).
  74. Robin, X.; Turck, N.; Hainard, A.; Tiberti, N.; Lisacek, F.; Sanchez, J.-C.; Müller, M. pROC: An open-source package for R and S+ to analyze and compare ROC curves. BMC Bioinform. 2011, 12, 77. [Google Scholar] [CrossRef]
  75. Gubbins, S.; Carpenter, S.; Baylis, M.; Wood, J.L.N.; Mellor, P.S. Assessing the risk of bluetongue to UK livestock: Uncertainty and sensitivity analyses of a temperature-dependent model for the basic reproduction number. J. R Soc. Interface 2008, 5, 363–371. [Google Scholar] [CrossRef] [Green Version]
  76. Federici, V.; Goffredo, M.; Mancini, G.; Quaglia, M.; Santilli, A.; Di Nicola, F.; De Ascentis, M.; Cabras, P.; Volpicelli, C.; De Liberato, C.; et al. Vector Competence of Italian Populations of Culicoides for Some Bluetongue Virus Strains Responsible for Recent Northern African and European Outbreaks. Viruses 2019, 11. [Google Scholar] [CrossRef] [Green Version]
  77. MAPA. Encuestas Ganaderas, Análisis del Número de Animales Por Tipos. Available online: https://www.mapa.gob.es/es/estadistica/temas/estadisticas-agrarias/ganaderia/encuestas-ganaderas/ (accessed on 29 April 2020).
  78. Baylis, M.; O’Connell, L.; Mellor, P.S. Rates of bluetongue virus transmission between Culicoides sonorensis and sheep. Med. Vet. Entomol. 2008, 22, 228–237. [Google Scholar] [CrossRef] [PubMed]
  79. EFSA. Panel on Animal Health Welfare. Bluetongue: Control, surveillance and safe movement of animals. EFSA J. 2017, 15, e04698. [Google Scholar] [CrossRef] [Green Version]
  80. Melville, L.F.; Weir, R.; Harmsen, M.; Walsh, S.; Hunt, N.T.; Daniels, P.W. Characteristics of naturally-occurring bluetongue viral infections of cattle. In Proceedings of Bluetongue disease in Southeast Asia and the Pacific. In Proceedings of the First Southeast Asia and Pacific Bluetongue symposium, Greenlake Hotel, Kunming, China, 22–24 August 1995; pp. 245–250. [Google Scholar]
  81. Goldsmit, L.; Barzilai, E.; Tadmor, A. The comparative sensitivity of sheep and chicken embryos to bluetongue virus and observations of viraemia in experimentally infected sheep. Aust. Vet. J. 1975, 51, 190–196. [Google Scholar] [CrossRef]
  82. Veronesi, E.; Hamblin, C.; Mellor, P.S. Live attenuated bluetongue vaccine viruses in Dorset Poll sheep, before and after passage in vector midges (Diptera: Ceratopogonidae). Vaccine 2005, 23, 5509–5516. [Google Scholar] [CrossRef]
  83. Batten, C.; Darpel, K.; Henstock, M.; Fay, P.; Veronesi, E.; Gubbins, S.; Graves, S.; Frost, L.; Oura, C. Evidence for transmission of bluetongue virus serotype 26 through direct contact. PLoS ONE 2014, 9, e96049. [Google Scholar] [CrossRef] [Green Version]
  84. Mullens, B.A.; Gerry, A.C.; Lysyk, T.J.; Schmidtmann, E.T. Environmental effects on vector competence and virogenesis of bluetongue virus in Culicoides: Interpreting laboratory data in a field context. Vet. Ital. 2004, 40, 160–166. [Google Scholar]
  85. Verhoef, F.A.; Venter, G.J.; Weldon, C.W. Thermal limits of two biting midges, Culicoides imicola Kieffer and C. bolitinos Meiswinkel (Diptera: Ceratopogonidae). Parasit Vectors 2014, 7, 384. [Google Scholar] [CrossRef] [PubMed] [Green Version]
  86. Wittmann, E.J.; Mellor, P.S.; Baylis, M. Effect of temperature on the transmission of orbiviruses by the biting midge, Culicoides sonorensis. Med. Vet. Entomol. 2002, 16, 147–156. [Google Scholar] [CrossRef] [PubMed]
  87. Fernández-Carrión, E.; Ivorra, B.; Ramos, A.M.; Martínez-López, B.; Aguilar-Vega, C.; Sánchez-Vizcaíno, J.M. An advection-deposition-survival model to assess the risk of introduction of vector-borne diseases through the wind: Application to bluetongue outbreaks in Spain. PLoS ONE 2018, 13, e0194573. [Google Scholar] [CrossRef] [Green Version]
  88. Braverman, Y.; Frish, K.; Reis, M.; Mumcuoglu, K.Y. Host Preference of Culicoides spp from Israel Based on Sensory Organs and Morphometry (Diptera: Ceratopogonidae). Entomol. Gen. 2012, 34, 97–110. [Google Scholar] [CrossRef]
  89. Carpenter, S.; Szmaragd, C.; Barber, J.; Labuschagne, K.; Gubbins, S.; Mellor, P. An assessment of Culicoides surveillance techniques in northern Europe: Have we underestimated a potential bluetongue virus vector? J. Appl. Ecol. 2008, 45, 1237–1245. [Google Scholar] [CrossRef]
  90. Gerry, A.C.; Sarto i Monteys, V.; Moreno Vidal, J.O.; Francino, O.; Mullens, B.A. Biting rates of Culicoides midges (Diptera: Ceratopogonidae) on sheep in northeastern Spain in relation to midge capture using UV light and carbon dioxide-baited traps. J. Med. Entomol. 2009, 46, 615–624. [Google Scholar] [CrossRef] [PubMed]
  91. Scheffer, E.G.; Venter, G.J.; Labuschagne, K.; Page, P.C.; Mullens, B.A.; MacLachlan, N.J.; Osterrieder, N.; Guthrie, A.J. Comparison of two trapping methods for Culicoides biting midges and determination of African horse sickness virus prevalence in midge populations at Onderstepoort, South Africa. Vet. Parasitol 2012, 185, 265–273. [Google Scholar] [CrossRef]
  92. Viennet, E.; Garros, C.; Lancelot, R.; Allène, X.; Gardès, L.; Rakotoarivony, I.; Crochet, D.; Delécolle, J.-C.; Moulia, C.; Baldet, T.; et al. Assessment of vector/host contact: Comparison of animal-baited traps and UV-light/suction trap for collecting Culicoides biting midges (Diptera: Ceratopogonidae), vectors of Orbiviruses. Parasit Vectors 2011, 4, 119. [Google Scholar] [CrossRef] [PubMed] [Green Version]
  93. Viennet, E.; Garros, C.; Gardès, L.; Rakotoarivony, I.; Allène, X.; Lancelot, R.; Crochet, D.; Moulia, C.; Baldet, T.; Balenghien, T. Host preferences of Palaearctic Culicoides biting midges: Implications for transmission of orbiviruses. Med. Vet. Entomol. 2013, 27, 255–266. [Google Scholar] [CrossRef]
  94. Mellor, P.S.; Boorman, J.; Baylis, M. Culicoides biting midges: Their role as arbovirus vectors. Annu. Rev. Entomol. 2000, 45, 307–340. [Google Scholar] [CrossRef]
  95. MATLAB. Version 9.8.0.1323502 (R2020a); The MathWorks Inc.: Natick, MA, USA, 2020. [Google Scholar]
  96. Jenks, G. The Data Model Concept in Statistical Mapping. Int. J. Cart. 1967, 7, 186–190. [Google Scholar]
  97. ADNS. Animal Disease Notification System Database. Available online: https://ec.europa.eu/food/animals/animal-diseases/not-system_en (accessed on 11 December 2019).
  98. Napp, S.; Allepuz, A.; Purse, B.V.; Casal, J.; Garcia-Bocanegra, I.; Burgin, L.E.; Searle, K.R. Understanding Spatio-Temporal Variability in the Reproduction Ratio of the Bluetongue (BTV-1) Epidemic in Southern Spain (Andalusia) in 2007 Using Epidemic Trees. PLoS ONE 2016, 11, e0151151. [Google Scholar] [CrossRef] [Green Version]
  99. Fernandez-Delgado, M.; Cernadas, E.; Barro, S.; Amorim, D. Do we Need Hundreds of Classifiers to Solve Real World Classification Problems? J. Mach. Learn. Res. 2014, 15, 3133–3181. [Google Scholar]
  100. Gerry, A.C.; Mullens, B.A. Seasonal Abundance and Survivorship of Culicoides sonorensis (Diptera: Ceratopogonidae) at a Southern California Dairy, with Reference to Potential Bluetongue Virus Transmission and Persistence. J. Med. Entomol. 2000, 37, 675–688. [Google Scholar] [CrossRef]
  101. Caracappa, S.; Torina, A.; Guercio, A.; Vitale, F.; Calabro, A.; Purpari, G.; Ferrantelli, V.; Vitale, M.; Mellor, P.S. Identification of a novel bluetongue virus vector species of Culicoides in Sicily. Vet. Rec. 2003, 153, 71–74. [Google Scholar] [CrossRef] [PubMed]
  102. Meiswinkel, R.; van Rijn, P.; Leijs, P.; Goffredo, M. Potential new Culicoides vector of bluetongue virus in northern Europe. Vet. Rec. 2007, 161, 564–565. [Google Scholar] [CrossRef] [Green Version]
  103. López-Olvera, J.R.; Falconi, C.; Fernández-Pacheco, P.; Fernández-Pinero, J.; Sánchez, M.A.; Palma, A.; Herruzo, I.; Vicente, J.; Jiménez-Clavero, M.A.; Arias, M.; et al. Experimental infection of European red deer (Cervus elaphus) with bluetongue virus serotypes 1 and 8. Vet. Microbiol. 2010, 145, 148–152. [Google Scholar] [CrossRef] [PubMed] [Green Version]
  104. Rossi, S.; Balenghien, T.; Viarouge, C.; Faure, E.; Zanella, G.; Sailleau, C.; Mathieu, B.; Delécolle, J.-C.; Ninio, C.; Garros, C.; et al. Red deer (Cervus elaphus) Did Not Play the Role of Maintenance Host for Bluetongue Virus in France: The Burden of Proof by Long-Term Wildlife Monitoring and Culicoides Snapshots. Viruses 2019, 11, 903. [Google Scholar] [CrossRef] [PubMed] [Green Version]
  105. Lorca-Oró, C.; López-Olvera, J.R.; Ruiz-Fons, F.; Acevedo, P.; García-Bocanegra, I.; Oleaga, Á.; Gortázar, C.; Pujols, J. Long-Term Dynamics of Bluetongue Virus in Wild Ruminants: Relationship with Outbreaks in Livestock in Spain, 2006–2011. PLoS ONE 2014, 9, e100027. [Google Scholar] [CrossRef] [Green Version]
  106. Martínez-de la Puente, J.; Figuerola, J.; Soriguer, R. Fur or feather? Feeding preferences of species of Culicoides biting midges in Europe. Trends Parasitol. 2015, 31, 16–22. [Google Scholar] [CrossRef] [Green Version]
  107. Lassen, S.B.; Nielsen, S.A.; Kristensen, M. Identity and diversity of blood meal hosts of biting midges (Diptera: Ceratopogonidae: Culicoides Latreille) in Denmark. Parasit Vectors 2012, 5, 143. [Google Scholar] [CrossRef] [Green Version]
  108. García-Lastra, R.; Leginagoikoa, I.; Plazaola, J.M.; Ocabo, B.; Aduriz, G.; Nunes, T.; Juste, R.A. Bluetongue Virus Serotype 1 Outbreak in the Basque Country (Northern Spain) 2007–2008. Data Support a Primary Vector Windborne Transport. PLoS ONE 2012, 7, e34421. [Google Scholar] [CrossRef] [Green Version]
  109. Elbers, A.R.W.; Koenraadt, C.J.M.; Meiswinkel, R. Mosquitoes and Culicoides biting midges: Vector range and the influence of climate change. Rev. Sci. Tech. 2015, 34, 123–137. [Google Scholar] [CrossRef] [Green Version]
  110. Sailleau, C.; Breard, E.; Viarouge, C.; Gorlier, A.; Leroux, A.; Hirchaud, E.; Lucas, P.; Blanchard, Y.; Vitour, D.; Grandcollot-Chabot, M.; et al. Emergence of bluetongue virus serotype 4 in mainland France in November 2017. Transbound Emerg. Dis. 2018, 65, 1158–1162. [Google Scholar] [CrossRef]
  111. European Centre for Disease Prevention and Control and European Food Safety Authority. The Importance of Vector Abundance and Seasonality–Results from an Expert Consultation; ECDC: Stockholm, Sweden; EFSA: Parma, Italy, 2018; p. 50.
Figure 1. Mean abundance of Culicoides spp. in positive sampling sites and the number of positive catches for the 331 sampling site observations for each month of the study period. The abundance of Culicoides spp. was transformed to log10(C+1), C being the number of Culicoides spp. Vertical lines show the standard deviation of the mean for each month.
Viruses 12 01158 g001
Figure 2. Monthly C. imicola’s: (a) abundance in sampling sites, (b) occurrence model, (c) abundance model. Administrative boundaries provided by Instituto Geográfico Nacional (ign.es); BDDAE CC-BY 4.0.
Viruses 12 01158 g002
Figure 3. Monthly Obsoletus complex’s: (a) abundance in sampling sites, (b) occurrence model, (c) abundance model. Administrative boundaries provided by Instituto Geográfico Nacional (ign.es); BDDAE CC-BY 4.0.
Viruses 12 01158 g003
Figure 4. Performance of Culicoides spp. occurrence and abundance models. For occurrence models, the F1 score and area under the receiver operating characteristic curve (AUC) are shown, while for abundance models mean absolute error (MAE) and root mean square error (RMSE) are shown.
Viruses 12 01158 g004
Figure 5. Monthly BTV transmission risk maps in Spain. There are represented three risk categories: low (1), medium (2) and high (3). These categories were defined for each monthly map according to the natural break classification criteria [96] in ArcMapTM. Gray areas show areas where the mean maximal temperature is less than 13 °C. Administrative boundaries provided by Instituto Geográfico Nacional (ign.es); BDDAE CC-BY 4.0.
Viruses 12 01158 g005
Figure 6. Monthly R0 values for (a) the two-vector formulation, (b) one-vector formulation for C. imicola and (c) one-vector formulation for the Obsoletus complex species.
Viruses 12 01158 g006
Table 1. Parameters for R0 equations.
Non-Temperature Dependent Variables
VariableVariable DescriptionSelected Value (Range) or FormulaReference
bProbability of transmission from vector to host0.9 (0.8–1.0)[78]
βjProbability of transmission from host to vector type j0.02[31,75,79]
mijRatio of vectors (Nj) to hosts (Hi) N j H i (0–5000)[31]
φCjProportion of vectors type j attracted to cattle φ C = m s m s   +   σ m c [31]
φSjProportion of vectors type j attracted to small ruminants φ S = 1     φ C [31]
σVector preference for host0.15 (0–1)[31,75,79]
rCRecovery rate of cattle (1/duration of viremia)0.0485Duration of viremia (20.6) estimated by fitting a gamma distribution to data presented in [80], by [75]
rSRecovery rate of sheep (1/duration of viremia)0.0610Duration of viremia (16.4) estimated by fitting a gamma distribution to data presented in [81] and [82], by [75]
dCMortality rate of cattle0[83]
dSMortality rate of sheep0.0078 (0.001–0.01)[79,83]
Temperature (θ) dependent variables
VariableVariable DescriptionFormulaReference
a1Biting rate for C. imicola a ( θ ) = 0.00014   θ   ( θ 3.6966 )   ( 41.8699   θ ) 1 2.7056 [79]
a2Biting rate for the Obsoletus complex species a ( θ ) = 0.000171   θ   ( θ 3.6966 )   ( 41.8699     θ ) 1 2.7056 [84]
μjNatural mortality rate of vector type jestimated by the Hermite cubic interpolation of temperature values of [85,86][87]
vjVirogenesis rate in the vector type j (1/EIP) v ( θ ) = 0.0003   θ   ( θ     10.4057 ) [84]
Table 2. External assessment of the bluetongue virus (BTV) transmission risk maps using BTV-1 (2007–2017) and BTV-4 (2010–2018) historical data from the European Animal Disease Notification System (ADNS) database according to the estimated date of infection. The number and decimal fraction of the outbreaks that fall into the different risk categories is shown.
BTV-1
Risk CategoryAprilMayJuneJulyAugustSeptemberOctober
11 (0.5)0 (0)5 (0.03)33 (0.03)78 (0.05)458 (0.12)448 (0.10)
21 (0.5)3 (0.33)129 (0.72)125 (0.13)552 (0.34)2084 (0.56)2455 (0.56)
30 (0)6 (0.67)44 (0.25)833 (0.84)1017 (0.62)1147 (0.31)1477 (0.34)
Total number of outbreaks29178991164736894380
BTV-4
Risk categoryAprilMayJuneJulyAugustSeptemberOctober
10 (0)0 (0)--0 (0)8 (0.05)15 (0.06)
20 (0)0 (0)--2 (0.50)70 (0.44)157 (0.62)
31 (1)1 (1)--2 (0.50)80 (0.51)83 (0.33)
Total number of outbreaks11004158255
Table 3. Statistical analysis of the difference between the observed BTV outbreaks and the number of expected BTV outbreaks calculated from the expected probability, which is based on the number of cells per each risk category.
BTV-1
MonthRisk CategoryExpected ProbabilityObserved OutbreaksExpected OutbreaksResidualsΧ2 *
June10.4571.2−7.85112.02
20.4912987.224.47
30.114419.585.52
July10.4533445.95−19.552740.5
20.36125356.76−12.27
30.19833188.2946.98
August10.5278856.44−26.63107.3
20.33552543.510.36
30.151017247.0548.99
September10.574582102.73−35.873331.9
20.3220841180.4826.3
30.111147405.7936.8
October10.654482847−44.967012.7
20.2724551182.637
30.081477350.460.18
BTV-4
MonthRisk categoryExpected probabilityObserved outbreaksExpected outbreaksResidualsΧ2 *
September10.57890.06−8.65307.86
20.327050.562.73
30.118017.3815.02
October10.6515165.75−11.71442.06
20.2715768.8510.62
30.088320.413.86
* df 2; p < 0.001.

