Article

Long-Term Wastewater Surveillance for SARS-CoV-2: One-Year Study in Brazil

by
Renan Moura Martins
1,†,
Tamara Carvalho
1,†,
Cintia Bittar
1,
Daniela Muller Quevedo
2,
Rafael Nava Miceli
3,
Mauricio Lacerda Nogueira
4,
Helena Lage Ferreira
5,
Paulo Inácio Costa
6,
João Pessoa Araújo, Jr.
7,
Fernando Rosado Spilki
8,
Paula Rahal
1 and
Marilia Freitas Calmon
1,*
1
Laboratory of Genomic Studies, Institute of Biosciences, Letters and Exact Sciences (IBILCE), São Paulo State University (UNESP), São José do Rio Preto 15054-000, SP, Brazil
2
Institute of Exact and Technological Sciences (ICET), University Feevale, Novo Hamburgo 93525-075, RS, Brazil
3
SeMAE-Autonomous Municipal Water and Sewage Service, São José do Rio Preto 15048-000, SP, Brazil
4
Virology Research Laboratory (LPV), Faculty of Medicine of São José do Rio Preto (FAMERP), São José do Rio Preto 15090-000, SP, Brazil
5
Applied Preventive Veterinary Medicine Laboratory, Department of Veterinary Medicine, Faculty of Animal Science and Food Engineering (FZEA), University of São Paulo (USP), Pirassununga 13635-900, SP, Brazil
6
Department of Clinical Analysis, School of Pharmaceutical Sciences, São Paulo State University (UNESP), Araraquara 14801-360, SP, Brazil
7
Biotechnology Institute, São Paulo State University (UNESP), Botucatu 18607-440, SP, Brazil
8
Molecular Microbiology Laboratory, University Feevale, Novo Hamburgo 93525-075, RS, Brazil
*
Author to whom correspondence should be addressed.
The authors contributed equally to this work.
Viruses 2022, 14(11), 2333; https://doi.org/10.3390/v14112333
Submission received: 26 July 2022 / Revised: 26 September 2022 / Accepted: 5 October 2022 / Published: 25 October 2022
(This article belongs to the Section SARS-CoV-2 and COVID-19)

Abstract

:
Wastewater-based epidemiology (WBE) is a tool involving the analysis of wastewater for chemicals and pathogens at the community level. WBE has been shown to be an effective surveillance system for SARS-CoV-2, providing an early-warning-detection system for disease prevalence in the community via the detection of genetic materials in the wastewater. In numerous nation-states, studies have indicated the presence of SARS-CoV-2 in wastewater. Herein, we report the primary time-course monitoring of SARS-CoV-2 RNA in wastewater samples in São José do Rio Preto-SP/Brazil in order to explain the dynamics of the presence of SARS-CoV-2 RNA during one year of the SARS-CoV-2 pandemic and analyze possible relationships with other environmental parameters. We performed RNA quantification of SARS-CoV-2 by RT-qPCR using N1 and N2 targets. The proportion of positive samples for every target resulted in 100% and 96.6% for N1 and N2, respectively. A mean lag of -5 days is observed between the wastewater signal and the new SARS-CoV-2-positive cases reported. A correlation was found between the air and wastewater temperatures and therefore between the SARS-CoV-2 viral titers for N1 and N2 targets. We also observed a correlation between SARS-CoV-2 viral titers and media wastewater flow for the N1 target. In addition, we observed higher viral genome copies within the wastewater samples collected on non-rainy days for the N1 target. Thus, we propose that, based on our results, monitoring raw wastewater may be a broadly applicable strategy that might contribute to resolving the pressing problem of insufficient diagnostic testing; it may represent an inexpensive and early-warning method for future COVID-19 outbreaks, mainly in lower- and middle-income countries.

Graphical Abstract

1. Introduction

The SARS-CoV-2 pandemic has global consequences on public health, the economy, and society. The first confirmed SARS-CoV-2 case in the São José do Rio Preto metropolitan area occurred on March 13, 2020, when the country had counted only 34 confirmed cases. This means that this city was among the first in the national territory to identify the transmission of the virus [1]. Peaks in SARS-CoV-2-positive cases in São José do Rio Preto were seen in July and August 2020, November 2020, and January 2021, with the highest peaks in March and April 2021. The prevalent variant diversified over time, with seven lineages detected in January and February 2021. An increase in the prevalence of the Gamma lineage was observed from January 2021, replacing Zeta and other lineages [2].
Despite COVID-19 being a respiratory disease, SARS-CoV-2-viable virus and viral RNA are present in bodily excreta such as saliva, sputum, and feces, which are discarded in wastewater [3]; the viral shedding can vary among individuals, with means of 14–21 days [4,5]. The main route of SARS-CoV-2 transmission is inhalation via person-to-person aerosols/droplets [6]. However, evidence indicates the need for deeper comprehension of the wastewater as a possible source of virus in epidemiological studies [7].
Wastewater monitoring has been used as a strategy of viral disease surveillance through the detection of genetic material in wastewater [8,9,10]. Hence, monitoring of SARS-CoV-2 in sewage is considered a sensitive method to analyze the dissemination of the virus in the population and provide early detection of the virus in the community [11].
Recent reports indicated the presence of SARS-CoV-2 in wastewater in several nation-states [12,13,14,15]. These reports highlight the requirement for effective environmental surveillance. Wastewater-based epidemiology (WBE) as a public health surveillance tool involves the screening of wastewater at the community level and serves as an early-warning system [16]. This methodology is a cost-effective way to assess the dissemination of the infection by monitoring the viral load in the wastewater that contains feces excreted from both symptomatic and asymptomatic individuals, and, therefore, reduces the time and resources spent on clinical surveillance [13,17].
Herein, we report the first time-course monitoring of SARS-CoV-2 RNA in wastewater samples in São José do Rio Preto-SP/Brazil in order to describe the dynamics of the presence of SARS-CoV-2 RNA during one year of the SARS-CoV-2 pandemic and to analyze a possible relationship with several environmental parameters.

2. Methodology

2.1. Sampling

Twenty-four-hour composite samples of raw wastewater were collected three times per week for one year (from 15 July 2020 to 15 July 2021) from the Preliminary Treatment unit of the Sewage Treatment Plant (STP) Rio Preto. This plant processes 98–99% of all sewage generated in the municipality, with a total flow of approximately 100,826 m3/day and serving approximately 470,000 inhabitants. The samples were collected in a HACH Sigma SD900 AWRS refrigerated automatic sampler (HACH, Loveland, CO, USA), with a sampling program adjusted to the input flow, with the collection of 1 sample for every 3000 m3 processed by the plant (equivalent to approx. 36 sampling events/day). Once collected, the samples were kept at below 4 °C and sent to STP Rio Preto Laboratories for decantation for 10 min, followed by vacuum filtration on 47 mm glass fiber membranes with a 1 µm pore size (PALL CORPORATION, Ann Harbor, MI, USA). After filtration, on the day following sampling, 200 mL of each sample was transported to the São Paulo State University Laboratory in glass flasks on ice. Upon receipt, the samples were concentrated by high-speed centrifugation at 40,000× g for 3 h at 4 °C using the ultracentrifuge (Beckman Coulter, Indianapolis, IN, USA). Viral pellets were resuspended in 1 mL of DEPC-treated water (Sigma-Aldrich, Saint Louis, MI, USA) and stored at −150 °C. Samples were processed using Class II biological safety cabinets, and standard precautions were applied.

2.2. RNA Extraction and Quantitative PCR

RNA extraction of 200 μL of each sample was performed using Trizol reagent (Thermo Fisher Scientific, Waltham, MA, USA), according to the manufacturer’s instructions. RNA was eluted in 30 µL of DEPC water (Sigma-Aldrich, Saint Louis, MI, USA) and stored at −80 °C.
SARS-CoV-2 RNA was detected and quantified using qPCRBIO 1-step Go (PCR Biosystems, London, UK) and the RT-qPCR diagnostic-panel assays were validated by the US Centers for Disease Control and Prevention [18]. The version of the kit with two sets of oligonucleotide primers and probes was used to target two different SARS-CoV-2 regions of the nucleocapsid (N) gene (N1 and N2). The sets of primers and probe (2019-nCoV RUO Kit) (Integrated DNA Technologies, Leuven, Belgium) as well as the positive control (2019-nCoV_N_Positive Control, 2 × 10⁵ genome copies/μL (gc/μL)) were provided by IDT (Integrated DNA Technologies, Leuven, Belgium). A measure of 5 µL of RNA was added to the Reaction mix (15 μL), consisting of 7.5 μL 2X qPCRBIO 1-step Go mix, 0.15 μL RTase Go (PCR Biosystems, London, UK), and 1.13 μL for each set of primers and probe. The thermal cycling conditions were as RT at 50 °C for 10 min, preheating at 95 °C for 2 min and 40 cycles of amplification at 95 °C for 5 s and 60 °C for 30 s. All amplifications were conducted on a QuantStudio 12 K Flex instrument (Applied Biosystems, Foster City, CA, USA). Each RNA was analyzed in triplicate for each primer set and every RT-qPCR assay included negative (nuclease-free water) and positive controls.
Serial tenfold dilutions of the standard plasmid of SARS-CoV-2, obtained from IDT (Integrated DNA Technologies, Leuven, Belgium), were used to produce standard curves. Molecular-biology-grade water was used as a non-template control. The amplification efficiencies (E) were calculated based on the equation: E = 10(−1/slope) − 1. Negative and positive controls were included in each RT-qPCR run and all RT-qPCR assays were performed in triplicate. Samples were discarded if they did not meet the following conditions: (i) standard curves with R2 ≥ 0.95; (ii) copies/reaction in linear dynamic range of the curve; (iii) primer efficiency between 90% and 130% [19].

2.3. Detection Limit and qPCR Inhibition Control

The detection limit for the assay was estimated by spiking serial 10-fold dilutions of SARS-CoV-2 synthetic plasmid in wastewater samples (n = 5). After the addition of known concentrations of the virus, the spiked water samples were analyzed by real-time RT-qPCR. The lowest concentration of the viruses in the spiked water samples that gave a positive result in the RT-qPCR was taken as an estimate of the detection limit. Thus, the limit of detection of the RT-qPCR assay was determined for N1 and N2 gene regions by determining the number of copies per reaction, which corresponds to a detection rate of ≥ 95% (<5% false negatives), as recommended by the MIQE guidelines [19].
To check for the presence of inhibitors in our samples, all samples testing SARS-CoV-2 N2 negative (n = 5), twenty samples testing SARS-CoV-2 N1- and N2-positive, as well as sterile water controls (in triplicate), were inoculated in parallel with a known amount (105 Genome Copies) of SARS-CoV-2 synthetic plasmid containing N region of SARS-CoV-2 (Integrated DNA Technologies, Leuven, Belgium) and tested using a previously described RT-qPCR assay targeting the N region. The SARS-CoV-2 plasmid was also analyzed by PCR, without prior mixing with RNA from the samples. An increase in the threshold cycles (Ct), after addition of the nucleic acid extracts by more than 1 cycle, was considered to indicate inhibition. All qPCR reactions were carried out in triplicate on a QuantStudio 12 K Flex instrument (Applied Biosystems, Foster City, CA, USA) [20].

2.4. Data Analysis

Data were analyzed using descriptive statistics through measures of central tendency (mean and median) and measures of dispersion (standard deviation). To test the distribution of variables, the Kolmogorov–Smirnov test was applied. The data did not show normal distribution, so non-parametric tests were applied for statistical inference. Variables N1 and N2 were normalized with reference to flow, as suggested by Nagarkar et al. (2022) [21]. To identify the correlation between N1 and N2, SARS-CoV-2-positive clinical cases, and hydrological and meteorological data, the instantaneous correlation was initially evaluated (lag = 0). The cross-correlation function was also used to assess the correlation between N1 and N2 with positive clinical SARS-CoV-2 cases for various lags; each lag represents two/three days, since the wastewater sample was collected every two/three days (three times per week).
To compare N1 and N2 between rainy and non-rainy days, the Mann–Whitney test was applied. Statistical inference was applied considering a significance level of 5%. The software used for statistical analysis was SPSS V24.

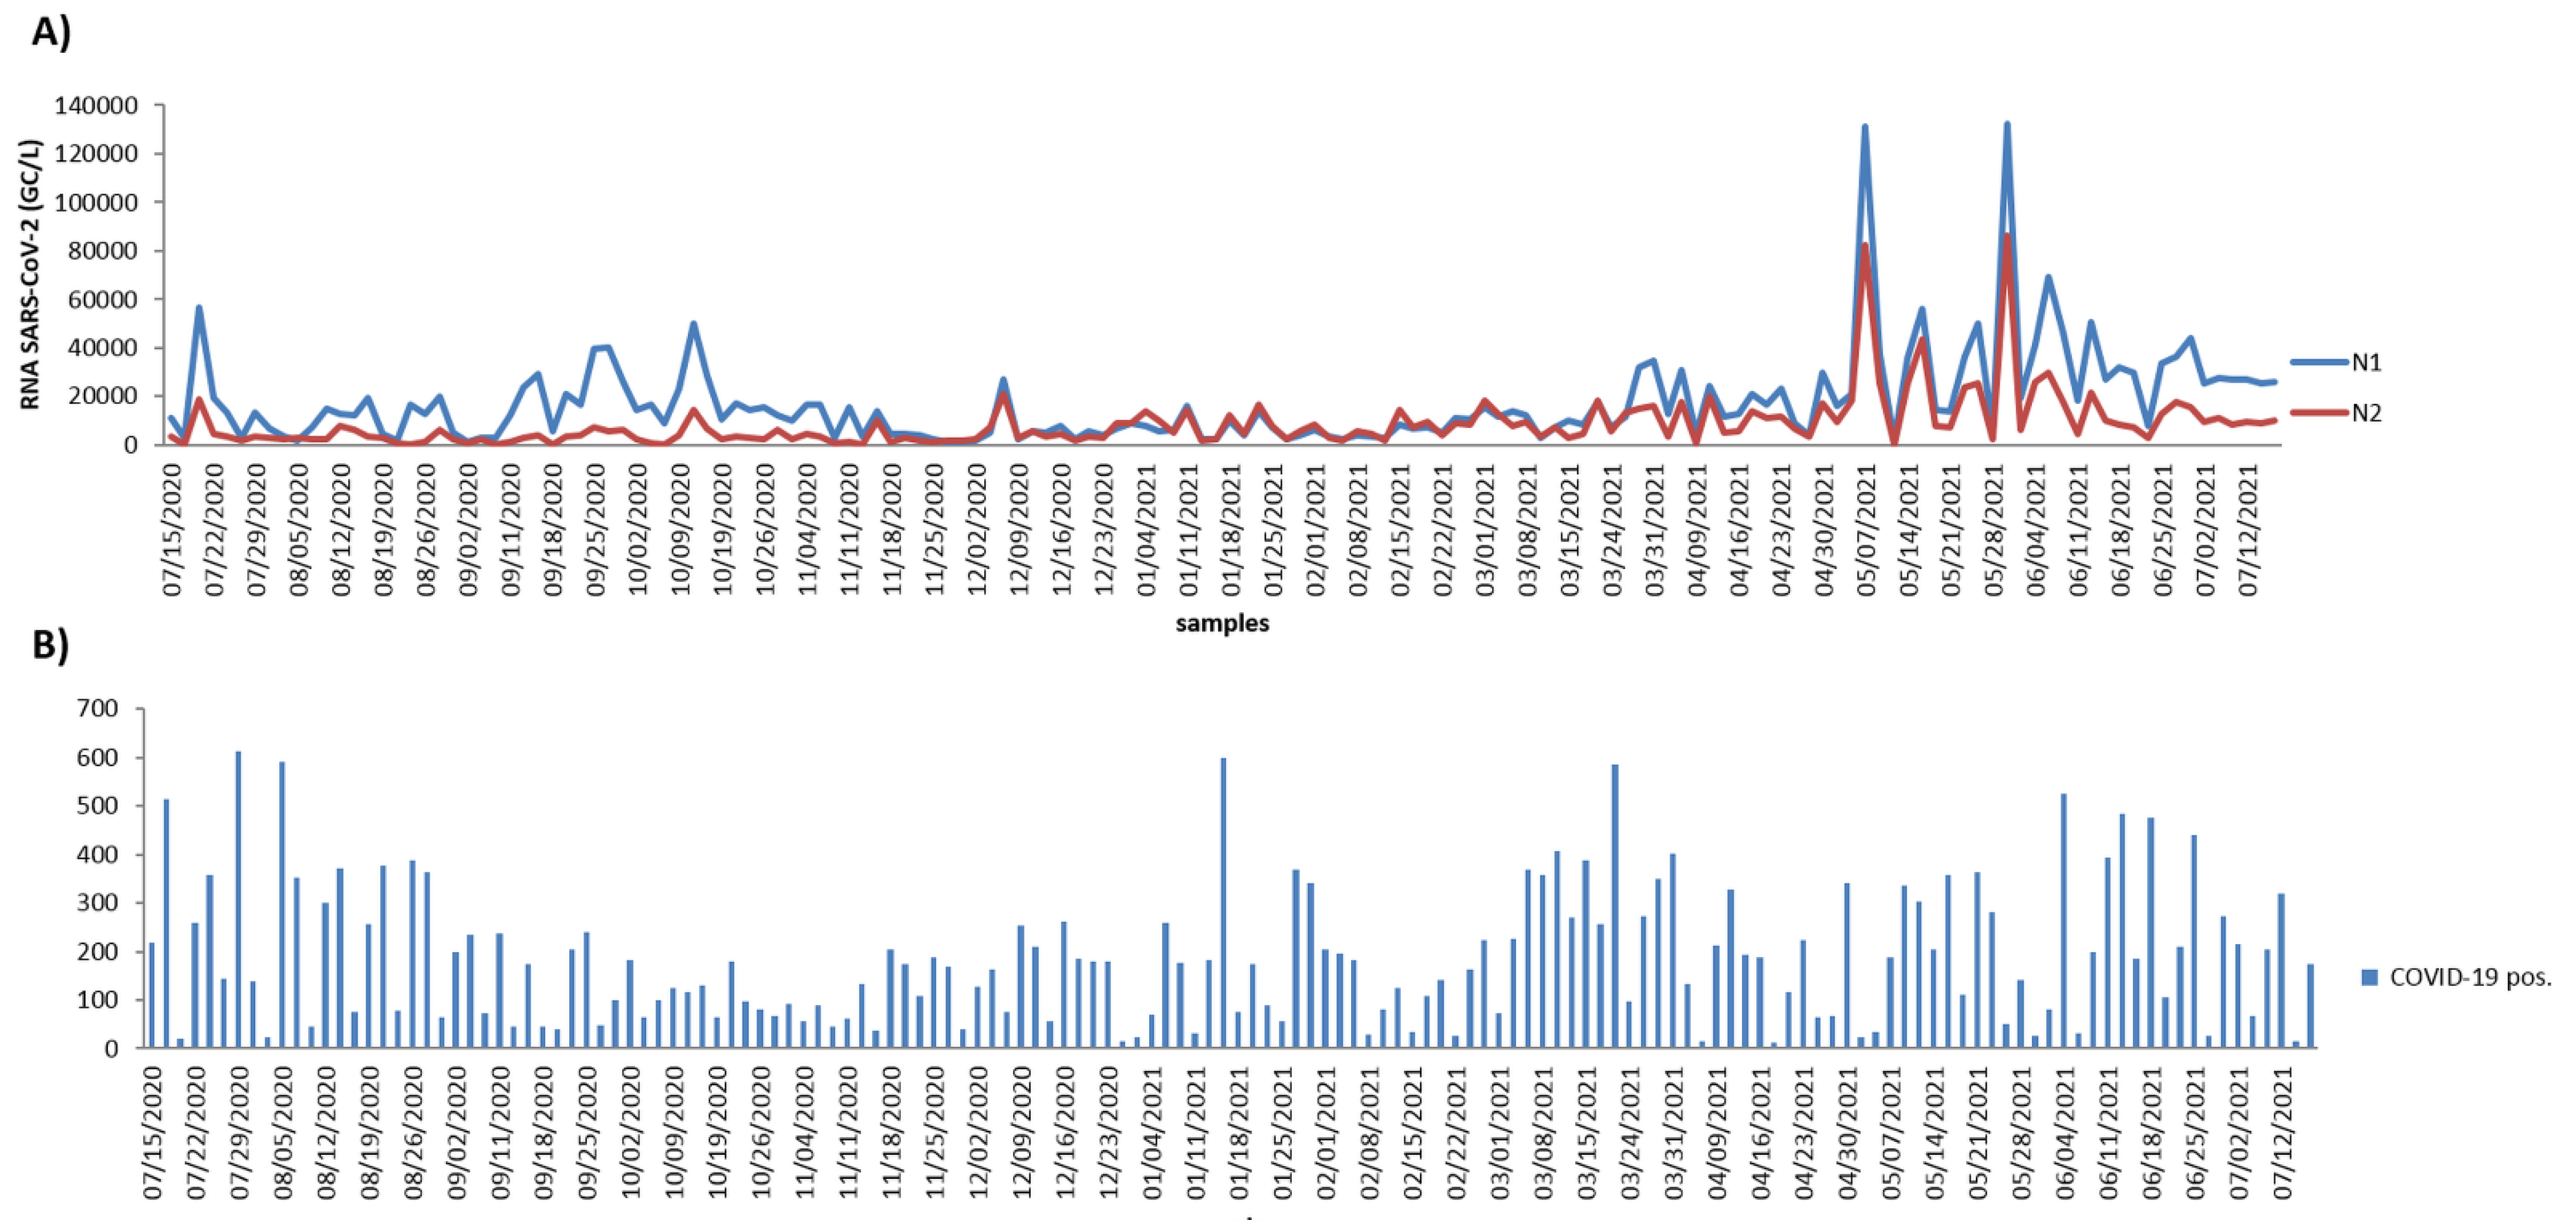
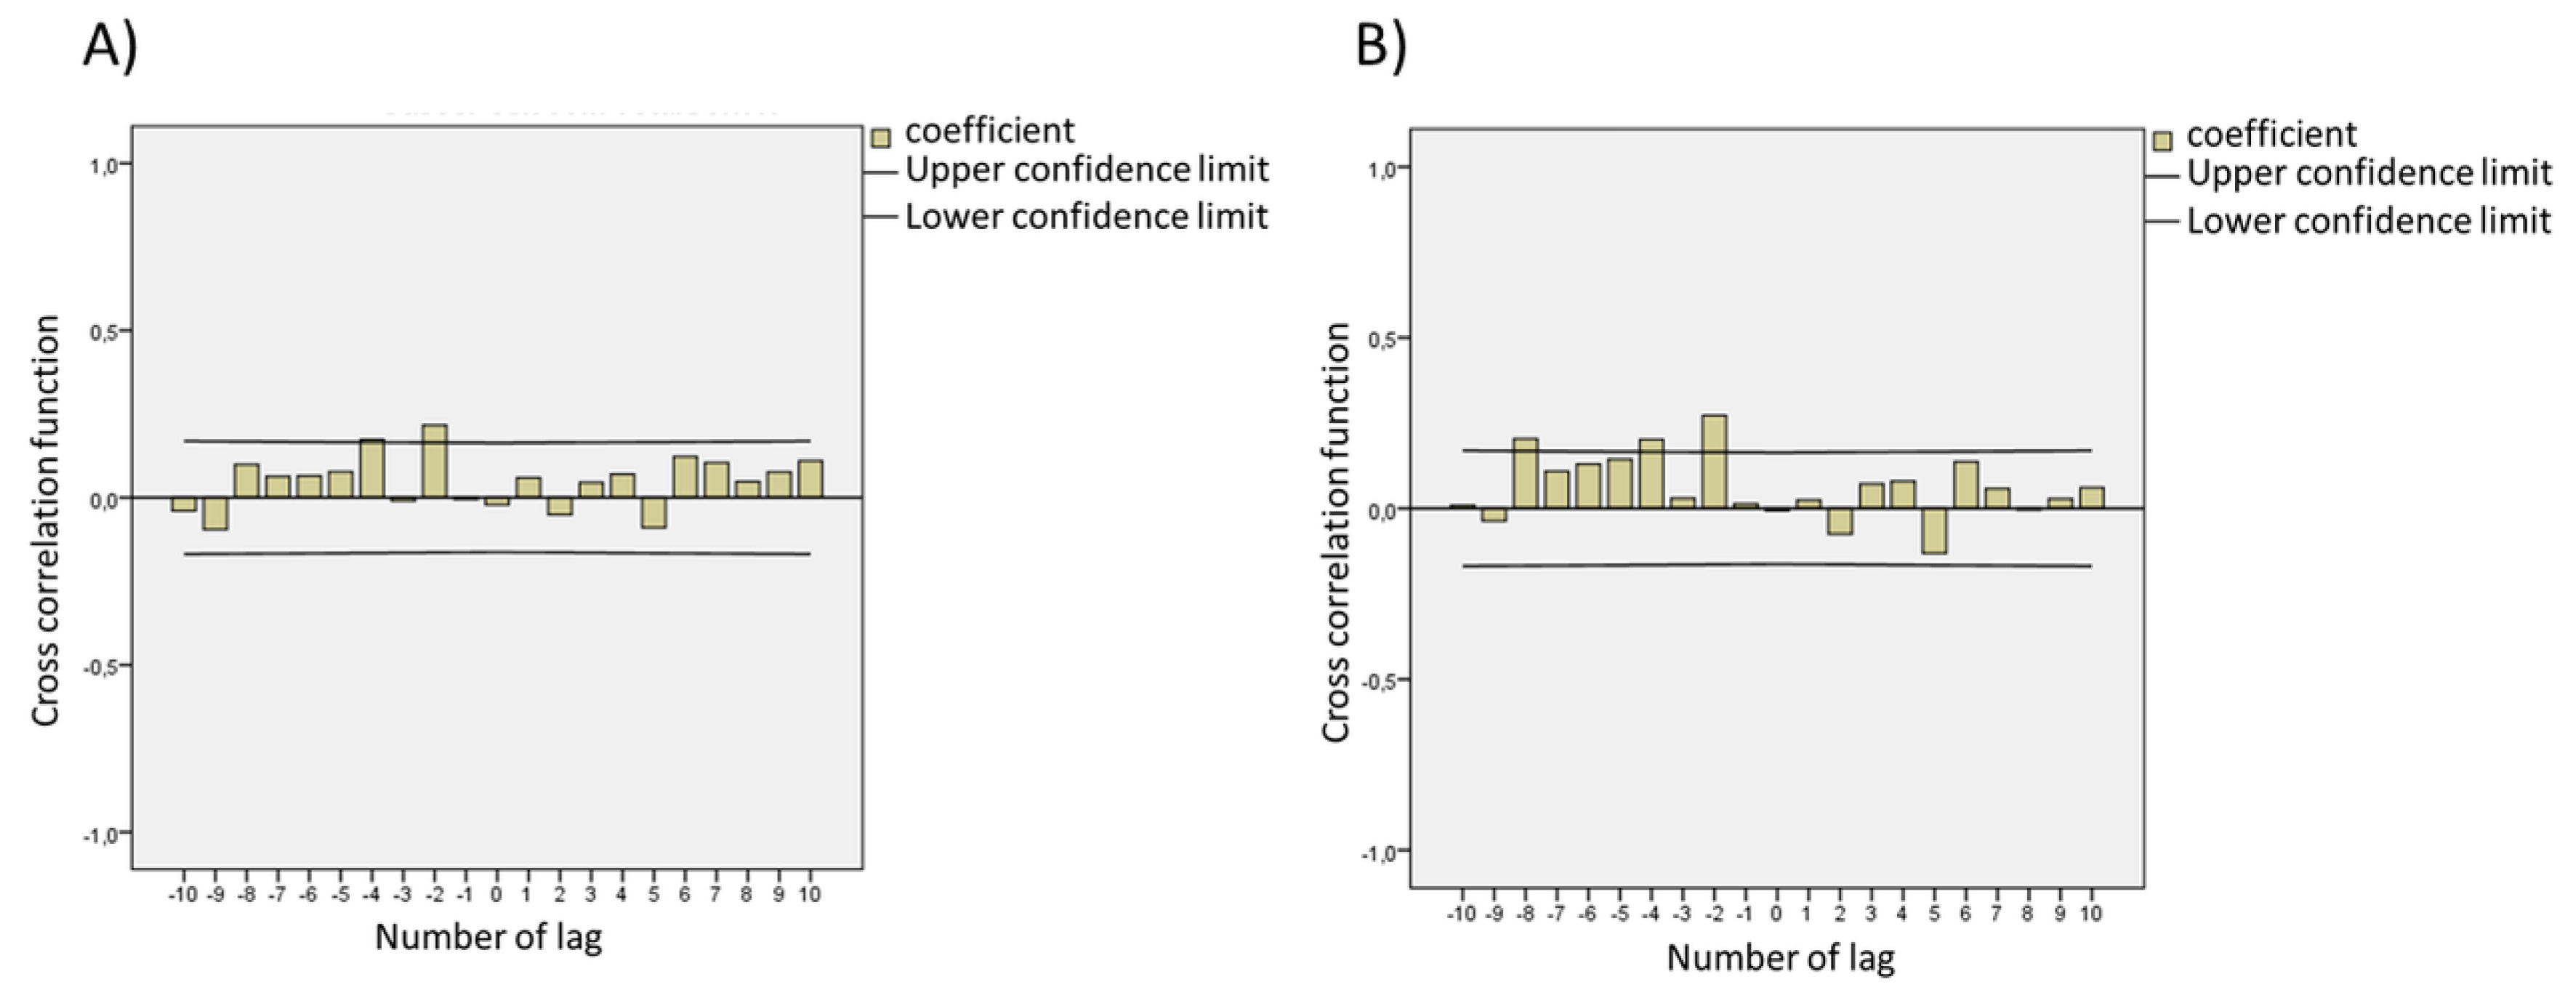
3. Results and Discussion

SARS-CoV-2 virus RNA was measured by RT–qPCR using the same N1 and N2 primer sets. The percentage of positive samples for each target resulted in 100% and 96.6%, for N1 and N2, respectively. Virus RNA copies ranged from 1 × 10³ copies/L to 1.3 × 10⁵ copies/L for N1 target of raw sewage and from 0 to 8.6 × 10⁴ copies/L for the N2 target of raw sewage (Table 1). All qRT–PCR concentration threshold (Ct) values were below 40, and 97% of all samples had a Ct value less than 38 for the N1 primer and 97.3% for the N2 primer. It is interesting to observe that N1 and N2 signals present a similar tendency in wastewater samples (Figure 1), as also observed by long-term surveillance of wastewater in France [22]. The concentrations of SARS-CoV-2 RNA (1 × 10³ – 1.3 × 10⁵ copies/L) in wastewater samples in this study are in agreement with studies from the USA [23,24,25], South Africa [26], and India [27]. Interestingly, the concentration of SARS-CoV-2 RNA in this study was higher than that reported in Haramoto et al. in Japan [28], Hasan et al. in Saudi Arabia [29], and Ahmed et al. in Australia [13], but lower than those reported by Balboa et al. in Spain [30]. This could be attributable to differences in abundance of SARS-CoV-2 in wastewater due to the pandemic level in the population; the number of SARS-CoV-2 RNA gene copies in wastewater is correlated with the total number of SARS-CoV-2-positive cases in a community, providing an indication of the total burden of disease on that population beyond merely those individuals identified through SARS-CoV-2 testing. In addition, different sampling methodologies for viral RNA detection and viral quantification analysis may result in variation in the amount of SARS-CoV-2 detected in wastewater.
The in vitro-transcribed viral RNA was detected to a limit of detection (LOD) of 1000 copies/L in both the N1 and N2 RT-qPCR assays and the standard curves demonstrate good linearity for RT-qPCR in a range from 1000 to 108 copies/L for N1 and N2 primers. The LOD in this study was similar to that observed by Ahmed et al. [31]. The linearity and LOD are important parameters according to MIQE guidelines [19] and, although RT-qPCR is a sensitive and specific technique for viral quantification, the reproducibility and reliability of the assay are important parameters.
All 150 measures traced the increase and decrease in SARS-CoV-2 infections during the 52-week period studied and we analyzed the instant correlation between SARS-CoV-2 and environmental parameters as well as SARS-CoV-2-positive clinical cases. The time-course monitoring of viral load in wastewater displayed two peaks: one on 7 May 2021 and one on 31 May 2021 for both primers. These were followed by a slight decrease (1-log reduction in average). The peaks of the SARS-CoV-2-positive clinical cases on these days were not observed, presenting some peaks on different days such as, for example, one on 29 July 2020 and another on 15 January 2021. A significant relation of viral titers with SARS-CoV-2-positive clinical cases was not observed when instant correlation was applied (Figure 2, Lag 0). We also analyzed the correlation of viral titers with SARS-CoV-2-positive clinical cases; applying a cross correlation of 20 lags allowed an estimation of relationships between viral time-series results and the reported population-testing data. We used the wastewater sample date as a reference and determined the lag time of clinical cases in relation to the wastewater’s SARS-CoV-2 RNA concentration. A negative lag means that the detection of SARS-CoV-2 RNA in the wastewater was observed before the SARS-CoV-2-positive cases, and a positive number indicates that wastewater follows the incidence rate (i.e., changed after). An average lag of −5 days was observed between the detection of SARS-CoV-2 RNA in the wastewater and the new SARS-CoV-2-positive cases reported (Figure 2). This result corroborates a study from the USA that observed a lag of 7–9 days between SARS-CoV-2 RNA concentration and SARS-CoV-2-positive cases reported [32]. In addition, there are reports that SARS-CoV-2 was detected in wastewater earlier than medical reporting by 2 days in Canada [33] and by 2–4 days in the USA [34]. Interestingly, based on clinical tests, Kumar et al. realized the seriousness of the pandemic situation in India 1–2 weeks before the official reports [35]; these time lags between the wastewater signal and the SARS-CoV-2-positive reported cases is coherent with the average 4–5 day incubation period from SARS-CoV-2 infection to symptom onset. On the other hand, a study from Greece applied several statistical models to determine the association between SARS-CoV-2 RNA concentrations in sewage and data for 7 days of cumulative cases and observed no clear evidence that wastewater measurements can anticipate SARS-CoV-2-positive reported cases [36]. These differences in results are observed because wastewater-based epidemiology depends on the viral shedding dynamics relative to symptom onset and the divergence between detection of SARS-CoV-2 RNA in the wastewater and clinical data reporting [37]. The majority of methods for tracking SARS-CoV-2 infection primarily rely on clinical test results, but this process involves intrinsic delays that preclude real-time tracking of the outbreak; to overcome this issue, we compared our wastewater surveillance data with SARS-CoV-2 clinical positive cases collected from the same day.
Alterations in the environment can influence the viral viability and temperature was identified as a significant variable controlling microbial decay and the persistence of viruses in environmental systems. Seasonal variations in wastewater temperature during a year differ around the world. In addition, seasonal changes in air and soil temperature influence the transference of heat between wastewater and the surrounding environment [38]. A negative correlation was found between the air and wastewater temperatures and the SARS-CoV-2 viral titers for N1 (air: R = −0.361, p < 0.01; wastewater: R = −0.375, p < 0.01) and N2 (air: R = −0.3000, p < 0.01; wastewater: R = −0.185, p < 0.05) primers (Table 2). Our results corroborate a mixed-model effect, which showed that temperature levels were significantly correlated with SARS-CoV-2 gene recovery [39]. It was reported that with increasing temperature, the incidence of the disease decreased in most of the cities analyzed [40]. One study reported that, frequently, SARS-CoV-2 tends to be rapidly inactivated at high temperatures instead of at low temperatures [41]. Kampf et al. conducted a study in which it was observed that for a 1 °C increase in the minimum ambient air temperature, the cumulative number of cases decreased by almost 1%. However, at ambient temperatures higher than 30 °C, the duration of SARS-CoV-2 detection is reduced [42]. Henwood et al. (2020) suggested that a temperature of 56 °C for 90 min or a temperature of 67 °C for 60 min can inactivate SARS-CoV-2 [43]. Therefore, the persistence of the virus is insignificant and mostly gets destroyed in high ambient and water temperatures.
We also observed a negative correlation between SARS-CoV-2 viral titers and media wastewater flow for the N1 primer (R = −0.298; p < 0.01). The SARS-CoV-2 RNA can be influenced by sample location and type, as well as the time of collection. This may change depending on where and when the sample is collected in the wastewater treatment facility because of the differences in the sewage compositions and dilutions. The SARS-CoV-2 RNA detection may also be influenced by sampling type (grab versus composite), and the time of day when it is collected [44]. Thus, it is suggested that a time composite sampling mode may under- or overestimate viral quantification when the flow varies, and when flow and viral titers are positively or negatively correlated [45].
In addition, there is a significant difference in the SARS-CoV-2 viral titers when comparing rainy days (n = 40) with non-rainy days (n = 110) (U = 1595.00; p = 0.010), i.e., there are more viral genome copies in the wastewater samples collected on non-rainy days for the N1 primer (Mdrain=5855.00; Mdnon-rain=13,603.00) (Table 3). Lazuka et al. observed that SARS-CoV-2 RNA quantification appeared to be strongly influenced by rainfall events as SARS-CoV-2 RNA quantification decreased on rainy days. However, we need to consider that the virus keeps circulating in the population on rainy days and a decrease in concentration or the absence of SARS-CoV-2 RNA detection must be considered with caution when rain events occur [22].

4. Conclusions

In conclusion, SARS-CoV-2 RNA concentrations in wastewater treatment plant influent (raw sewage) were analyzed over one year and compared with environmental and populational parameters. Monitoring raw sewage is a broadly applicable strategy that can contribute to the problem of insufficient diagnostic testing and provide an early-warning tool for future SARS-CoV-2 outbreaks, mainly in lower- and middle-income countries. In addition, wastewater-based epidemiology can be used as a tool to aid decision making in the SARS-CoV-2 post-isolation phase and reinstatement of isolation facing a seasonal re-emergence.

Author Contributions

Conceptualization, C.B., M.F.C. and P.R.; Methodology, C.B., M.F.C. and P.R.; Validation, R.M.M. and T.C.; Formal Analysis, D.M.Q.; Investigation, R.M.M. and T.C.; Resources, R.N.M., H.L.F., P.I.C., J.P.A.J. and P.R; Data Curation, M.F.C.; Writing–Original Draft Preparation, M.F.C., M.L.N. and F.R.S.; Writing–Review & Editing, M.F.C., D.M.Q., P.R., M.L.N. and F.R.S.; Supervision, M.F.C.; Project Administration, M.F.C.; Funding Acquisition, P.I.C., J.P.A.J., P.R. and M.F.C. All authors have read and agreed to the published version of the manuscript.

Funding

This work was supported by the Fundação de Amparo à Pesquisa do Estado de São Paulo-Brazil (FAPESP grant number: 2019/07784-3), Coordenação de Aperfeiçoamento de Pessoal de Nível Superior—Brazil (CAPES)—Finance codes: 88887.487494/2020-00 and 8887.505878/2020-00.

Acknowledgments

We would like to thank the team from the Laboratory of the Autonomous Municipal Water and Sewage Service, São José do Rio Preto, Brazil.

Conflicts of Interest

The authors declare that they have no known competing financial interests or personal relationships that could have appeared to influence the work reported in this paper.

References

  1. Pacca, C.C.; Zini, N.; Versiani, A.F.; Edoardo, E.D.O.; Milhim, B.H.G.A.; Campos, G.R.F.; Moraes, M.M.; dos Santos, T.M.I.L.; Dourado, F.S.; Marques, B.C.; et al. Follow-up of a hospital cohort during the first 3530 suspected cases of COVID-19 in Sao Jose do Rio Preto, Sao Paulo, Brazil. bioRxiv 2021. [Google Scholar] [CrossRef]
  2. Banho, C.A.; Sacchetto, L.; Campos, G.R.F.; Bittar, C.; Possebon, F.S.; Ullmann, L.S.; Marques, B.D.C.; da Silva, G.C.D.; Moraes, M.M.; Parra, M.C.P.; et al. Impact of SARS-CoV-2 Gamma lineage introduction and COVID-19 vaccination on the epidemiological landscape of a Brazilian city. Commun. Med. 2022, 2, 1–11. [Google Scholar] [CrossRef]
  3. Cheung, K.S.; Hung, I.F.N.; Chan, P.P.Y.; Lung, K.C.; Tso, E.; Liu, R.; Ng, Y.Y.; Chu, M.Y.; Chung, T.W.H.; Tam, A.R.; et al. Gastrointestinal Manifestations of SARS-CoV-2 Infection and Virus Load in Fecal Samples From a Hong Kong Cohort: Systematic Review and Meta-analysis. Gastroenterology 2020, 159, 81–95. [Google Scholar] [CrossRef]
  4. Wu, Y.; Guo, C.; Tang, L.; Hong, Z.; Zhou, J.; Dong, X.; Yin, H.; Xiao, Q.; Tang, Y.; Qu, X.; et al. Prolonged presence of SARS-CoV-2 viral RNA in faecal samples. Lancet Gastroenterol. Hepatol. 2020, 5, 434–435. [Google Scholar] [CrossRef]
  5. Xu, Y.; Li, X.; Zhu, B.; Liang, H.; Fang, C.; Gong, Y.; Guo, Q.; Sun, X.; Zhao, D.; Shen, J.; et al. Characteristics of pediatric SARS-CoV-2 infection and potential evidence for persistent fecal viral shedding. Nat. Med. 2020, 26, 502–505. [Google Scholar] [CrossRef] [PubMed] [Green Version]
  6. Li, H.J.; Wang, Y.Y.; Ji, M.Y.; Pei, F.Y.; Zhao, Q.Q.; Zhou, Y.Y.; Hong, Y.T.; Han, S.Y.; Wang, J.; Wang, Q.X.; et al. Transmission Routes Analysis of SARS-CoV-2: A Systematic Review and Case Report. Front. Cell Dev. Biol. 2020, 8, 1–11. [Google Scholar] [CrossRef] [PubMed]
  7. Westhaus, S.; Weber, F.A.; Schiwy, S.; Linnemann, V.; Brinkmann, M.; Widera, M.; Greve, C.; Janke, A.; Hollert, H.; Wintgens, T.; et al. Detection of SARS-CoV-2 in raw and treated wastewater in Germany—Suitability for COVID-19 surveillance and potential transmission risks. Sci. Total Environ. 2021, 751, 141750. [Google Scholar] [CrossRef]
  8. Santiso-Bellon, C.; Randazzo, W.; Perez-Cataluna, A.; Vila-Vicent, S.; Gozalbo-Rovira, R.; Munoz, C.; Buesa, J.; Sanchez, G.; Rodriguez Diaz, J. Epidemiological Surveillance of Norovirus and Rotavirus in Sewage (2016–2017) in Valencia (Spain). Microorganisms 2020, 8, 458. [Google Scholar] [CrossRef] [Green Version]
  9. Cuevas-Ferrando, E.; Randazzo, W.; Perez-Cataluna, A.; Sanchez, G. HEV Occurrence in Waste and Drinking Water Treatment Plants. Front. Microbiol. 2019, 10, 2937. [Google Scholar] [CrossRef]
  10. Asghar, H.; Diop, O.M.; Weldegebriel, G.; Malik, F.; Shetty, S.; El Bassioni, L.; Akande, A.O.; Al Maamoun, E.; Zaidi, S.; Adeniji, A.J.; et al. Environmental surveillance for polioviruses in the Global Polio Eradication Initiative. J. Infect. Dis. 2014, 210 (Suppl. S1), S294–S303. [Google Scholar] [CrossRef] [PubMed]
  11. Zahedi, A.; Monis, P.; Deere, D.; Ryan, U. Wastewater-based epidemiology-surveillance and early detection of waterborne pathogens with a focus on SARS-CoV-2, Cryptosporidium and Giardia. Parasitol. Res. 2021, 120, 4167–4188. [Google Scholar] [CrossRef]
  12. Randazzo, W.; Truchado, P.; Cuevas-Ferrando, E.; Simon, P.; Allende, A.; Sanchez, G. SARS-CoV-2 RNA in wastewater anticipated COVID-19 occurrence in a low prevalence area. Water Res. 2020, 181, 115942. [Google Scholar] [CrossRef] [PubMed]
  13. Ahmed, W.; Angel, N.; Edson, J.; Bibby, K.; Bivins, A.; O’Brien, J.W.; Choi, P.M.; Kitajima, M.; Simpson, S.L.; Li, J.; et al. First confirmed detection of SARS-CoV-2 in untreated wastewater in Australia: A proof of concept for the wastewater surveillance of COVID-19 in the community. Sci. Total Environ. 2020, 728, 138764. [Google Scholar] [CrossRef] [PubMed]
  14. Coronado, Y.; Navarro, R.; Mosqueda, C.; Valenzuela, V.; Prez, J.P.; Gonzlez-Mendoza, V.; de la Torre, M.; Rocha, J. SARS-CoV-2 in wastewater from Mexico City used for irrigation in the Mezquital Valley: Quantification and modeling of geographic dispersion. Environ. Manag. 2021, 68, 580–590. [Google Scholar] [CrossRef] [PubMed]
  15. Hata, A.; Hara-Yamamura, H.; Meuchi, Y.; Imai, S.; Honda, R. Detection of SARS-CoV-2 in wastewater in Japan during a COVID-19 outbreak. Sci. Total Environ. 2021, 758, 143578. [Google Scholar] [CrossRef] [PubMed]
  16. Mao, K.; Zhang, K.; Du, W.; Ali, W.; Feng, X.; Zhang, H. The potential of wastewater-based epidemiology as surveillance and early warning of infectious disease outbreaks. Curr. Opin. Environ. Sci. Health 2020, 17, 7. [Google Scholar] [CrossRef] [PubMed]
  17. Kumar, M.; Patel, A.K.; Shah, A.V.; Raval, J.; Rajpara, N.; Joshi, M.; Joshi, C.G. First proof of the capability of wastewater surveillance for COVID-19 in India through detection of genetic material of SARS-CoV-2. Sci. Total Environ. 2020, 746, 141326. [Google Scholar] [CrossRef] [PubMed]
  18. CDC. Research Use Only 2019-Novel Coronavirus (2019-nCoV) Real-Time RT-PCR Primers and Probes. 2020. Available online: https://www.cdc.gov/coronavirus/2019-ncov/lab/virus-requests.html (accessed on 22 August 2020).
  19. Bustin, S.A.; Benes, V.; Garson, J.A.; Hellemans, J.; Huggett, J.; Kubista, M.; Mueller, R.; Nolan, T.; Pfaffl, M.W.; Shipley, G.L.; et al. The MIQE guidelines: Minimum information for publication of quantitative real-time PCR experiments. Clin. Chem. 2009, 55, 611–622. [Google Scholar] [CrossRef] [PubMed] [Green Version]
  20. Hamza, I.A.; Jurzik, L.; Stang, A.; Sure, K.; Uberla, K.; Wilhelm, M. Detection of human viruses in rivers of a densly-populated area in Germany using a virus adsorption elution method optimized for PCR analyses. Water Res. 2009, 43, 2657–2668. [Google Scholar] [CrossRef] [PubMed]
  21. Nagarkar, M.; Keely, S.P.; Jahne, M.; Wheaton, E.; Hart, C.; Smith, B.; Garland, J.; Varughese, E.A.; Braam, A.; Wiechman, B.; et al. SARS-CoV-2 monitoring at three sewersheds of different scales and complexity demonstrates distinctive relationships between wastewater measurements and COVID-19 case data. Sci. Total Environ. 2022, 816, 151534. [Google Scholar] [CrossRef] [PubMed]
  22. Lazuka, A.; Arnal, C.; Soyeux, E.; Sampson, M.; Lepeuple, A.S.; Deleuze, Y.; Pouradier Duteil, S.; Lacroix, S. COVID-19 wastewater based epidemiology: Long-term monitoring of 10 WWTP in France reveals the importance of the sampling context. Water Sci. Technol. 2021, 84, 1997–2013. [Google Scholar] [CrossRef] [PubMed]
  23. Wu, F.; Xiao, A.; Zhang, J.; Moniz, K.; Endo, N.; Armas, F.; Bushman, M.; Chai, P.R.; Duvallet, C.; Erickson, T.B.; et al. Wastewater surveillance of SARS-CoV-2 across 40 U.S. states from February to June 2020. Water Res. 2021, 202, 117400. [Google Scholar] [CrossRef]
  24. Weidhaas, J.; Aanderud, Z.T.; Roper, D.K.; VanDerslice, J.; Gaddis, E.B.; Ostermiller, J.; Hoffman, K.; Jamal, R.; Heck, P.; Zhang, Y.; et al. Correlation of SARS-CoV-2 RNA in wastewater with COVID-19 disease burden in sewersheds. Sci. Total Environ. 2021, 775, 145790. [Google Scholar] [CrossRef]
  25. Melvin, R.G.; Chaudhry, N.; Georgewill, O.; Freese, R.; Simmons, G.E. Predictive power of SARS-CoV-2 wastewater surveillance for diverse populations across a large geographical range. medRxiv 2021. [Google Scholar] [CrossRef]
  26. Johnson, R.; Muller, C.J.F.; Ghoor, S.; Louw, J.; Archer, E.; Surujlal-Naicker, S.; Berkowitz, N.; Volschenk, M.; Brocker, L.H.L.; Wolfaardt, G.; et al. Qualitative and quantitative detection of SARS-CoV-2 RNA in untreated wastewater in Western Cape Province, South Africa. S. Afr. Med. J. 2021, 111, 198–202. [Google Scholar] [CrossRef]
  27. Kopperi, H.; Tharak, A.; Hemalatha, M.; Kiran, U.; Gokulan, C.G.; Mishra, R.K.; Mohan, S.V. Defining the methodological approach for wastewater-based epidemiological studies-Surveillance of SARS-CoV-2. Environ. Technol. Innov. 2021, 23, 101696. [Google Scholar] [CrossRef]
  28. Haramoto, E.; Malla, B.; Thakali, O.; Kitajima, M. First environmental surveillance for the presence of SARS-CoV-2 RNA in wastewater and river water in Japan. Sci. Total Environ. 2020, 737, 140405. [Google Scholar] [CrossRef]
  29. Hasan, S.W.; Ibrahim, Y.; Daou, M.; Kannout, H.; Jan, N.; Lopes, A.; Alsafar, H.; Yousef, A.F. Detection and quantification of SARS-CoV-2 RNA in wastewater and treated effluents: Surveillance of COVID-19 epidemic in the United Arab Emirates. Sci. Total Environ. 2021, 764, 142929. [Google Scholar] [CrossRef] [PubMed]
  30. Balboa, S.; Mauricio-Iglesias, M.; Rodriguez, S.; Martinez-Lamas, L.; Vasallo, F.J.; Regueiro, B.; Lema, J.M. The fate of SARS-COV-2 in WWTPS points out the sludge line as a suitable spot for detection of COVID-19. Sci. Total Environ. 2021, 772, 145268. [Google Scholar] [CrossRef] [PubMed]
  31. Ahmed, W.; Bertsch, P.M.; Angel, N.; Bibby, K.; Bivins, A.; Dierens, L.; Edson, J.; Ehret, J.; Gyawali, P.; Hamilton, K.A.; et al. Detection of SARS-CoV-2 RNA in commercial passenger aircraft and cruise ship wastewater: A surveillance tool for assessing the presence of COVID-19 infected travellers. J. Travel Med. 2020, 27, 1–11. [Google Scholar] [CrossRef]
  32. Cavany, S.; Bivins, A.; Wu, Z.; North, D.; Bibby, K.; Perkins, T.A. Inferring SARS-CoV-2 RNA shedding into wastewater relative to the time of infection. Epidemiol. Infect. 2022, 150, 1–23. [Google Scholar] [CrossRef]
  33. D’Aoust, P.M.; Mercier, E.; Montpetit, D.; Jia, J.J.; Alexandrov, I.; Neault, N.; Baig, A.T.; Mayne, J.; Zhang, X.; Alain, T.; et al. Quantitative analysis of SARS-CoV-2 RNA from wastewater solids in communities with low COVID-19 incidence and prevalence. Water Res. 2021, 188, 116560. [Google Scholar] [CrossRef] [PubMed]
  34. Nemudryi, A.; Nemudraia, A.; Wiegand, T.; Surya, K.; Buyukyoruk, M.; Cicha, C.; Vanderwood, K.K.; Wilkinson, R.; Wiedenheft, B. Temporal Detection and Phylogenetic Assessment of SARS-CoV-2 in Municipal Wastewater. Cell Rep. Med. 2020, 1, 100098. [Google Scholar] [CrossRef] [PubMed]
  35. Kumar, M.; Joshi, M.; Patel, A.K.; Joshi, C.G. Unravelling the early warning capability of wastewater surveillance for COVID-19: A temporal study on SARS-CoV-2 RNA detection and need for the escalation. Environ. Res. 2021, 196, 110946. [Google Scholar] [CrossRef]
  36. Koureas, M.; Amoutzias, G.D.; Vontas, A.; Kyritsi, M.; Pinaka, O.; Papakonstantinou, A.; Dadouli, K.; Hatzinikou, M.; Koutsolioutsou, A.; Mouchtouri, V.A.; et al. Wastewater monitoring as a supplementary surveillance tool for capturing SARS-CoV-2 community spread. A case study in two Greek municipalities. Environ. Res. 2021, 200, 111749. [Google Scholar] [CrossRef]
  37. Petala, M.; Kostoglou, M.; Karapantsios, T.; Dovas, C.I.; Lytras, T.; Paraskevis, D.; Roilides, E.; Koutsolioutsou-Benaki, A.; Panagiotakopoulos, G.; Sypsa, V.; et al. Relating SARS-CoV-2 shedding rate in wastewater to daily positive tests data: A consistent model based approach. Sci. Total Environ. 2022, 807 Pt 2, 150838. [Google Scholar] [CrossRef]
  38. Hart, O.E.; Halden, R.U. Modeling wastewater temperature and attenuation of sewage-borne biomarkers globally. Water Res. 2020, 172, 115473. [Google Scholar] [CrossRef]
  39. Kevill, J.L.; Pellett, C.; Farkas, K.; Brown, M.R.; Bassano, I.; Denise, H.; McDonald, J.E.; Malham, S.K.; Porter, J.; Warren, J.; et al. A comparison of precipitation and filtration-based SARS-CoV-2 recovery methods and the influence of temperature, turbidity, and surfactant load in urban wastewater. Sci. Total Environ. 2022, 808, 151916. [Google Scholar] [CrossRef]
  40. Burra, P.; Soto-Diaz, K.; Chalen, I.; Gonzalez-Ricon, R.J.; Istanto, D.; Caetano-Anolles, G. Temperature and Latitude Correlate with SARS-CoV-2 Epidemiological Variables but not with Genomic Change Worldwide. Evol. Bioinform. 2021, 17, 1176934321989695. [Google Scholar] [CrossRef]
  41. Tran, H.N.; Le, G.T.; Nguyen, D.T.; Juang, R.S.; Rinklebe, J.; Bhatnagar, A.; Lima, E.C.; Iqbal, H.M.N.; Sarmah, A.K.; Chao, H.P. SARS-CoV-2 coronavirus in water and wastewater: A critical review about presence and concern. Environ. Res. 2021, 193, 110265. [Google Scholar] [CrossRef]
  42. Kampf, G.; Todt, D.; Pfaender, S.; Steinmann, E. Persistence of coronaviruses on inanimate surfaces and their inactivation with biocidal agents. J. Hosp. Infect. 2020, 104, 246–251. [Google Scholar] [CrossRef] [PubMed] [Green Version]
  43. Henwood, A.F. Coronavirus disinfection in histopathology. J. Histotechnol. 2020, 43, 102–104. [Google Scholar] [CrossRef] [PubMed] [Green Version]
  44. Ort, C.; Lawrence, M.G.; Rieckermann, J.; Joss, A. Sampling for pharmaceuticals and personal care products (PPCPs) and illicit drugs in wastewater systems: Are your conclusions valid? A critical review. Environ. Sci. Technol. 2010, 44, 6024–6035. [Google Scholar] [CrossRef] [PubMed]
  45. Ort, C.; Lawrence, M.G.; Reungoat, J.; Mueller, J.F. Sampling for PPCPs in wastewater systems: Comparison of different sampling modes and optimization strategies. Environ. Sci. Technol. 2010, 44, 6289–6296. [Google Scholar] [CrossRef]
  46. Urdan, T.C. Statistics in Plain English, 4th ed.; Routledge: London, UK, 2016; p. 286. [Google Scholar]
  47. Hair, J.F.B., Jr.; Black, W.C.; Babin, B.J.; Anderson, R.E. Multivariate Data Analysis, 7th ed.; Pearson: London, UK, 2009; p. 816. [Google Scholar]
Figure 1. SARS-CoV-2 RNA quantification of the wastewater from São José do Rio Preto and SARS-CoV-2-positive cases in São José do Rio Preto. (A) SARS-CoV-2 RNA quantification in the wastewater samples in São José do Rio Preto during one year using the N1 target (blue line) and the N2 target (red line) and (B) SARS-CoV-2-positive cases in São José do Rio Preto diagnosed during one year.
Viruses 14 02333 g001
Figure 2. Modeling reveals that the time delay between clinical case reporting and wastewater data changes over the course of the pandemic using (A) SARS-CoV-2 N1 target and (B) SARS-CoV-2 N2 target. The confidence limit applied was 95%.
Viruses 14 02333 g002
Table 1. Parameters of wastewater samples collected and SARS-CoV-2 RNA quantification using N1 and N2 targets.
ParametersMinimumMaximumAverageStandard DeviationMedian (Md)
N1 RNA copies: normalized to flow10.7 × 10101333.2 × 1010169.6 × 1010183.7 × 1010125.9 × 1010
N2 RNA copies: normalized to flow0.00837.4 × 101085.7 × 1010110.6 × 101054.4 × 1010
SARS-CoV-2-positive cases12.00613.00188.34140.11174
Air temperature (°C)0.0034.3024.413.7024.5
Average flow (L/s)1019.001394.001169.5571.621162
Total flow (m3/day)87,876.00121,542.00100,826.416150.29100,067
pH7.047.817.510.117.5
Wastewater temperature (°C)18.0030.8026.032.3726.4
Chemical oxygen demand (mg/L)411.002039.00725.60283.56622.5
Table 2. Spearman non-parametric correlation of environmental and wastewater parameters and SARS-CoV-2 N1 and N2 targets. Correlation coefficients: high—R > = 0.6; modest—0.3 < R < 0.6; low—R < 0.3 [46,47].
N1N2
SARS-CoV-2-Positive casesCorrelation Coefficient−0.0330.000
Sig. (bilateral)0.690.999
N150150
Air Temperature (°C)Correlation Coefficient−0.361 **−0.300 **
Sig. (bilateral)>0.001>0.001
N150150
pHCorrelation Coefficient0.215 **0.281 **
Sig. (bilateral)0.008>0.001
N150150
Wastewater Temperature (°C)Correlation Coefficient−0.375 **−0.185 *
Sig. (bilateral)>0.0010.024
N150150
Average Flow (L/s)Correlation Coefficient−0.298 **0.063
Sig. (bilateral)>0.0010.447
N150150
* 5% significance; ** 1% significance.
Table 3. Descriptive analysis of the parameters (Flow, N1 and N2 copies) related to periods with and without rainfall.
Descriptive Statistics
RainfallNMeanStandard
Deviation
MinimumMaximumPercentiles
25thg.50th (Median)75th
0Total Flow11099,792.75139.187,876.0120,384.096,797.799,877.5102,610.7
CopiesN111019,518.221,077.71076.0132,348.06112.013,603.026,180.5
CopiesN21109283.912,740.1086,292.02422.85855.011,384.5
1Total Flow40103,668.97707.191,892.0121,542.098,543.7101,957.0109,617.5
CopiesN14010,719.98621.51400.036,542.04246.57990.015,051.0
CopiesN2406653.45646.21352.023,572.02756.04482.08792.5
Publisher’s Note: MDPI stays neutral with regard to jurisdictional claims in published maps and institutional affiliations.

