
Comparative Proteomic Analysis of Huh7 Cells Transfected with Sub-Saharan African Hepatitis B Virus (Sub)genotypes Reveals Potential Oncogenic Factors
 , , , and
Abstract
:
1. Introduction
2. Materials and Methods
2.1. Plasmid Constructs
2.2. Cell Line and Transfections
2.3. Mass Spectrometry Analysis
2.3.1. Cell Lysis and Protein Preparation
2.3.2. Sample Clean-Up and Digestion
2.3.3. LC–MS Data Acquisition
2.3.4. SWATH–MS Data Processing
2.3.5. Mass Spectrometry Bioinformatics
Data Visualisation
Pathway Analysis
Gene-Set Enrichment Analysis (GSEA)
STRING Analysis
2.4. RNA Expression Levels
2.5. Viral Loads
2.6. ELISA
- MMP9—Human MMP-9 ELISA Kit (RK00217) (ABclonal, Woburn, MA, USA) https://abclonal.com/elisa-kits/HumanMMP-9ELISAKit/RK00217, accessed on 12 December 2023
- MMP2—Human Matrix Metalloproteinase 2 ELISA Kit (MMP2) (RK00309) (ABclonal, Woburn, MA, USA) https://abclonal.com/elisa-kits/HumanMMP-2ELISAKit/RK00309, accessed on 12 December 2023
- RHOC—Human Rho-related GTP-binding protein RhoC (RHOC) ELISA Kit (RK11965) (ABclonal, Woburn, MA, USA) https://ap.abclonal.com/elisa-kits/HumanRhorelatedGTPbindingproteinRhoCRHOCELISAKit/RK11965, accessed on 12 December 2023.
2.7. Immunofluorescence
2.8. Microscopy and Image Analysis
2.9. Data Statistical Analysis
3. Results
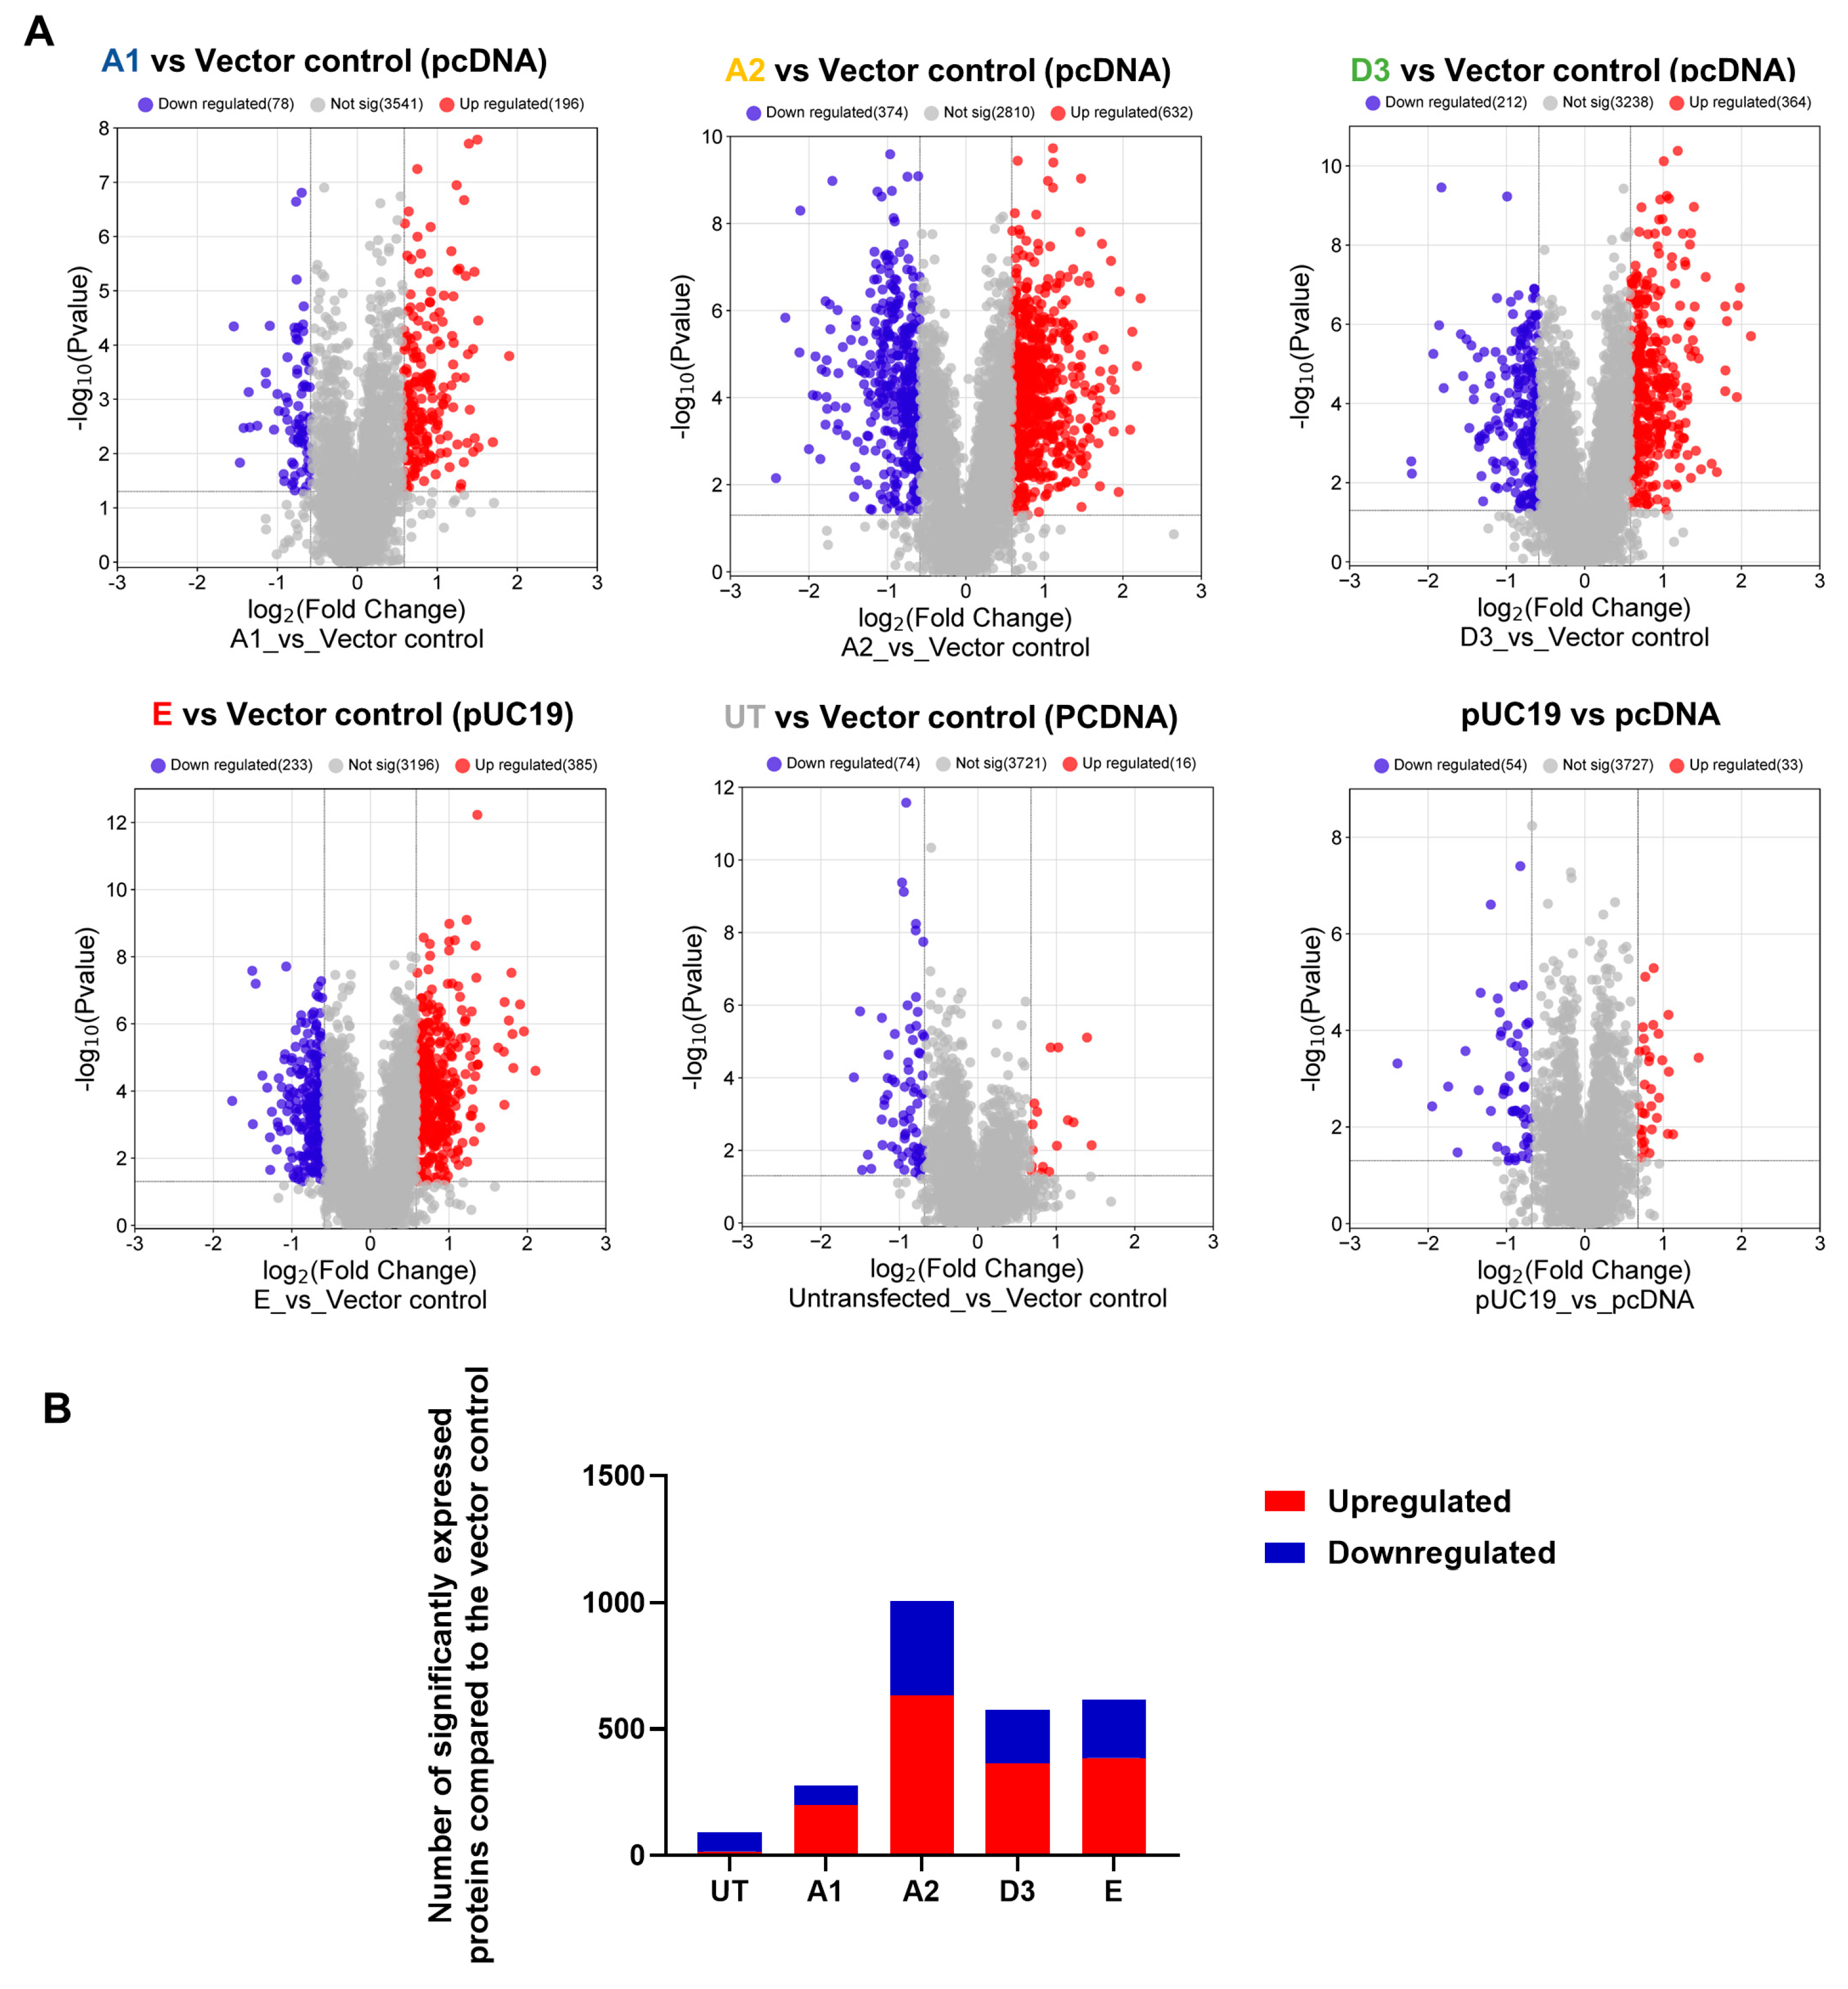
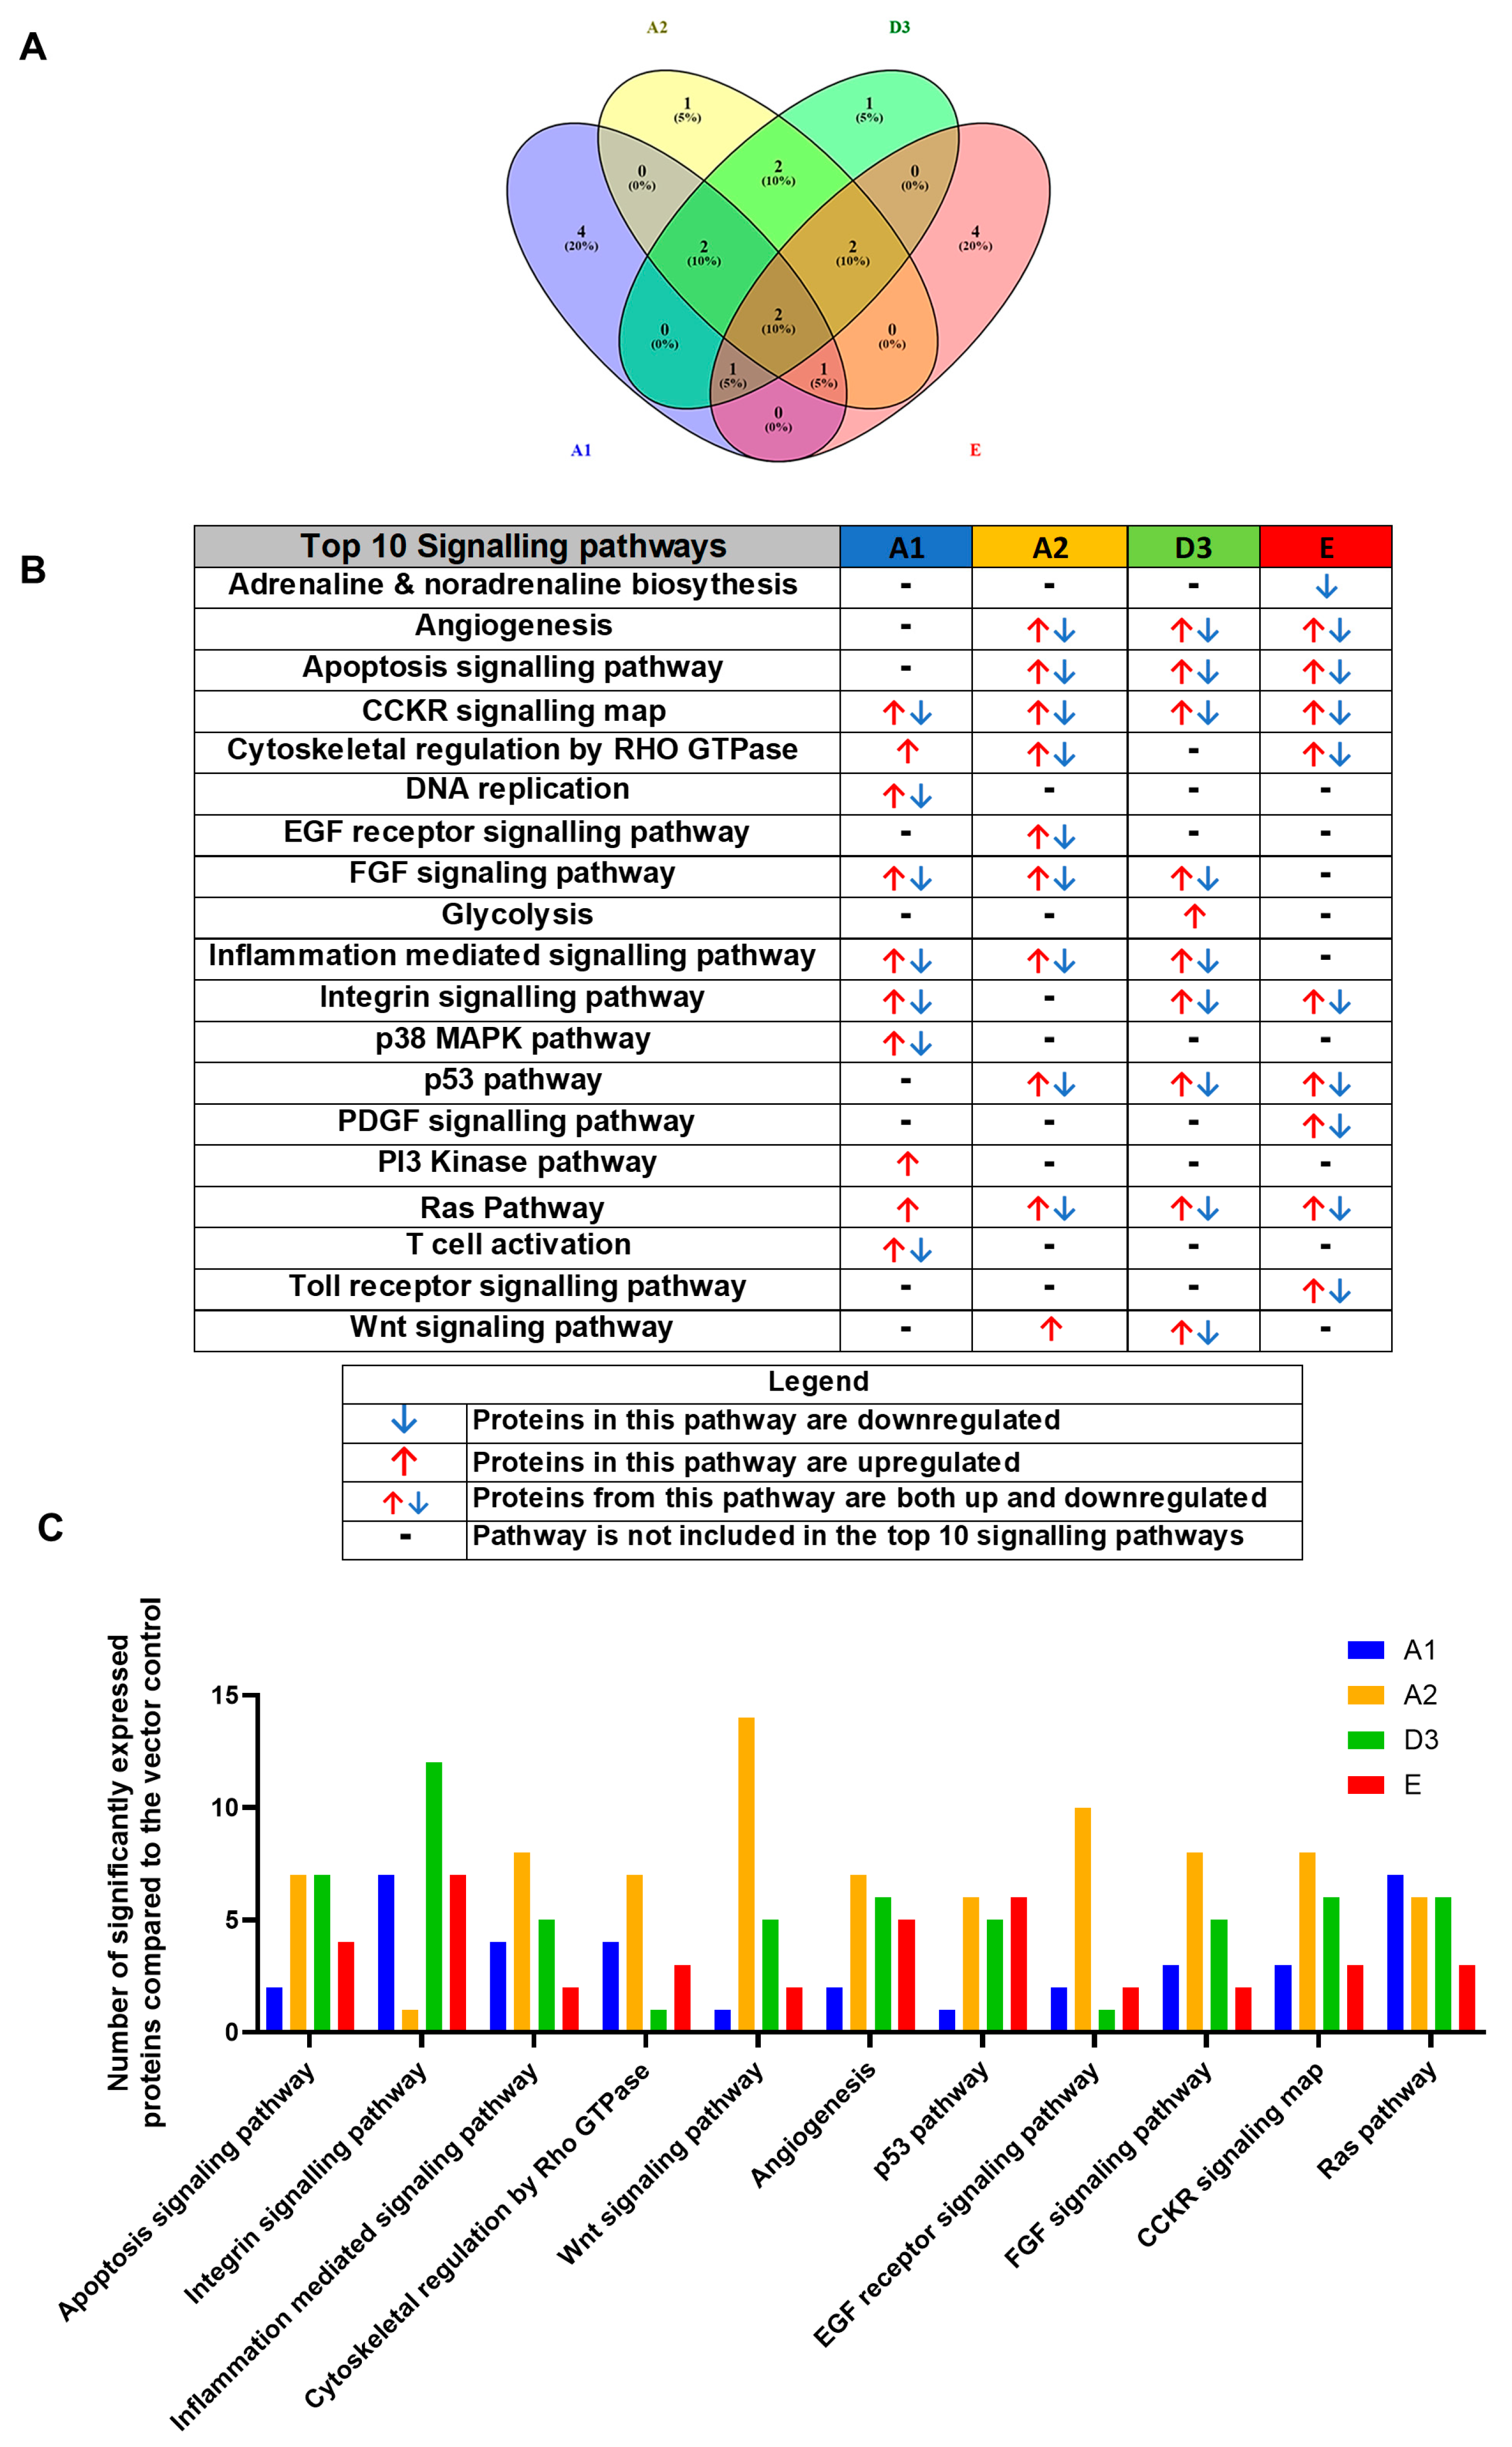
3.1. Comparison of the Proteome of Huh7 Cells Transfected with the SSA HBV Genotypes
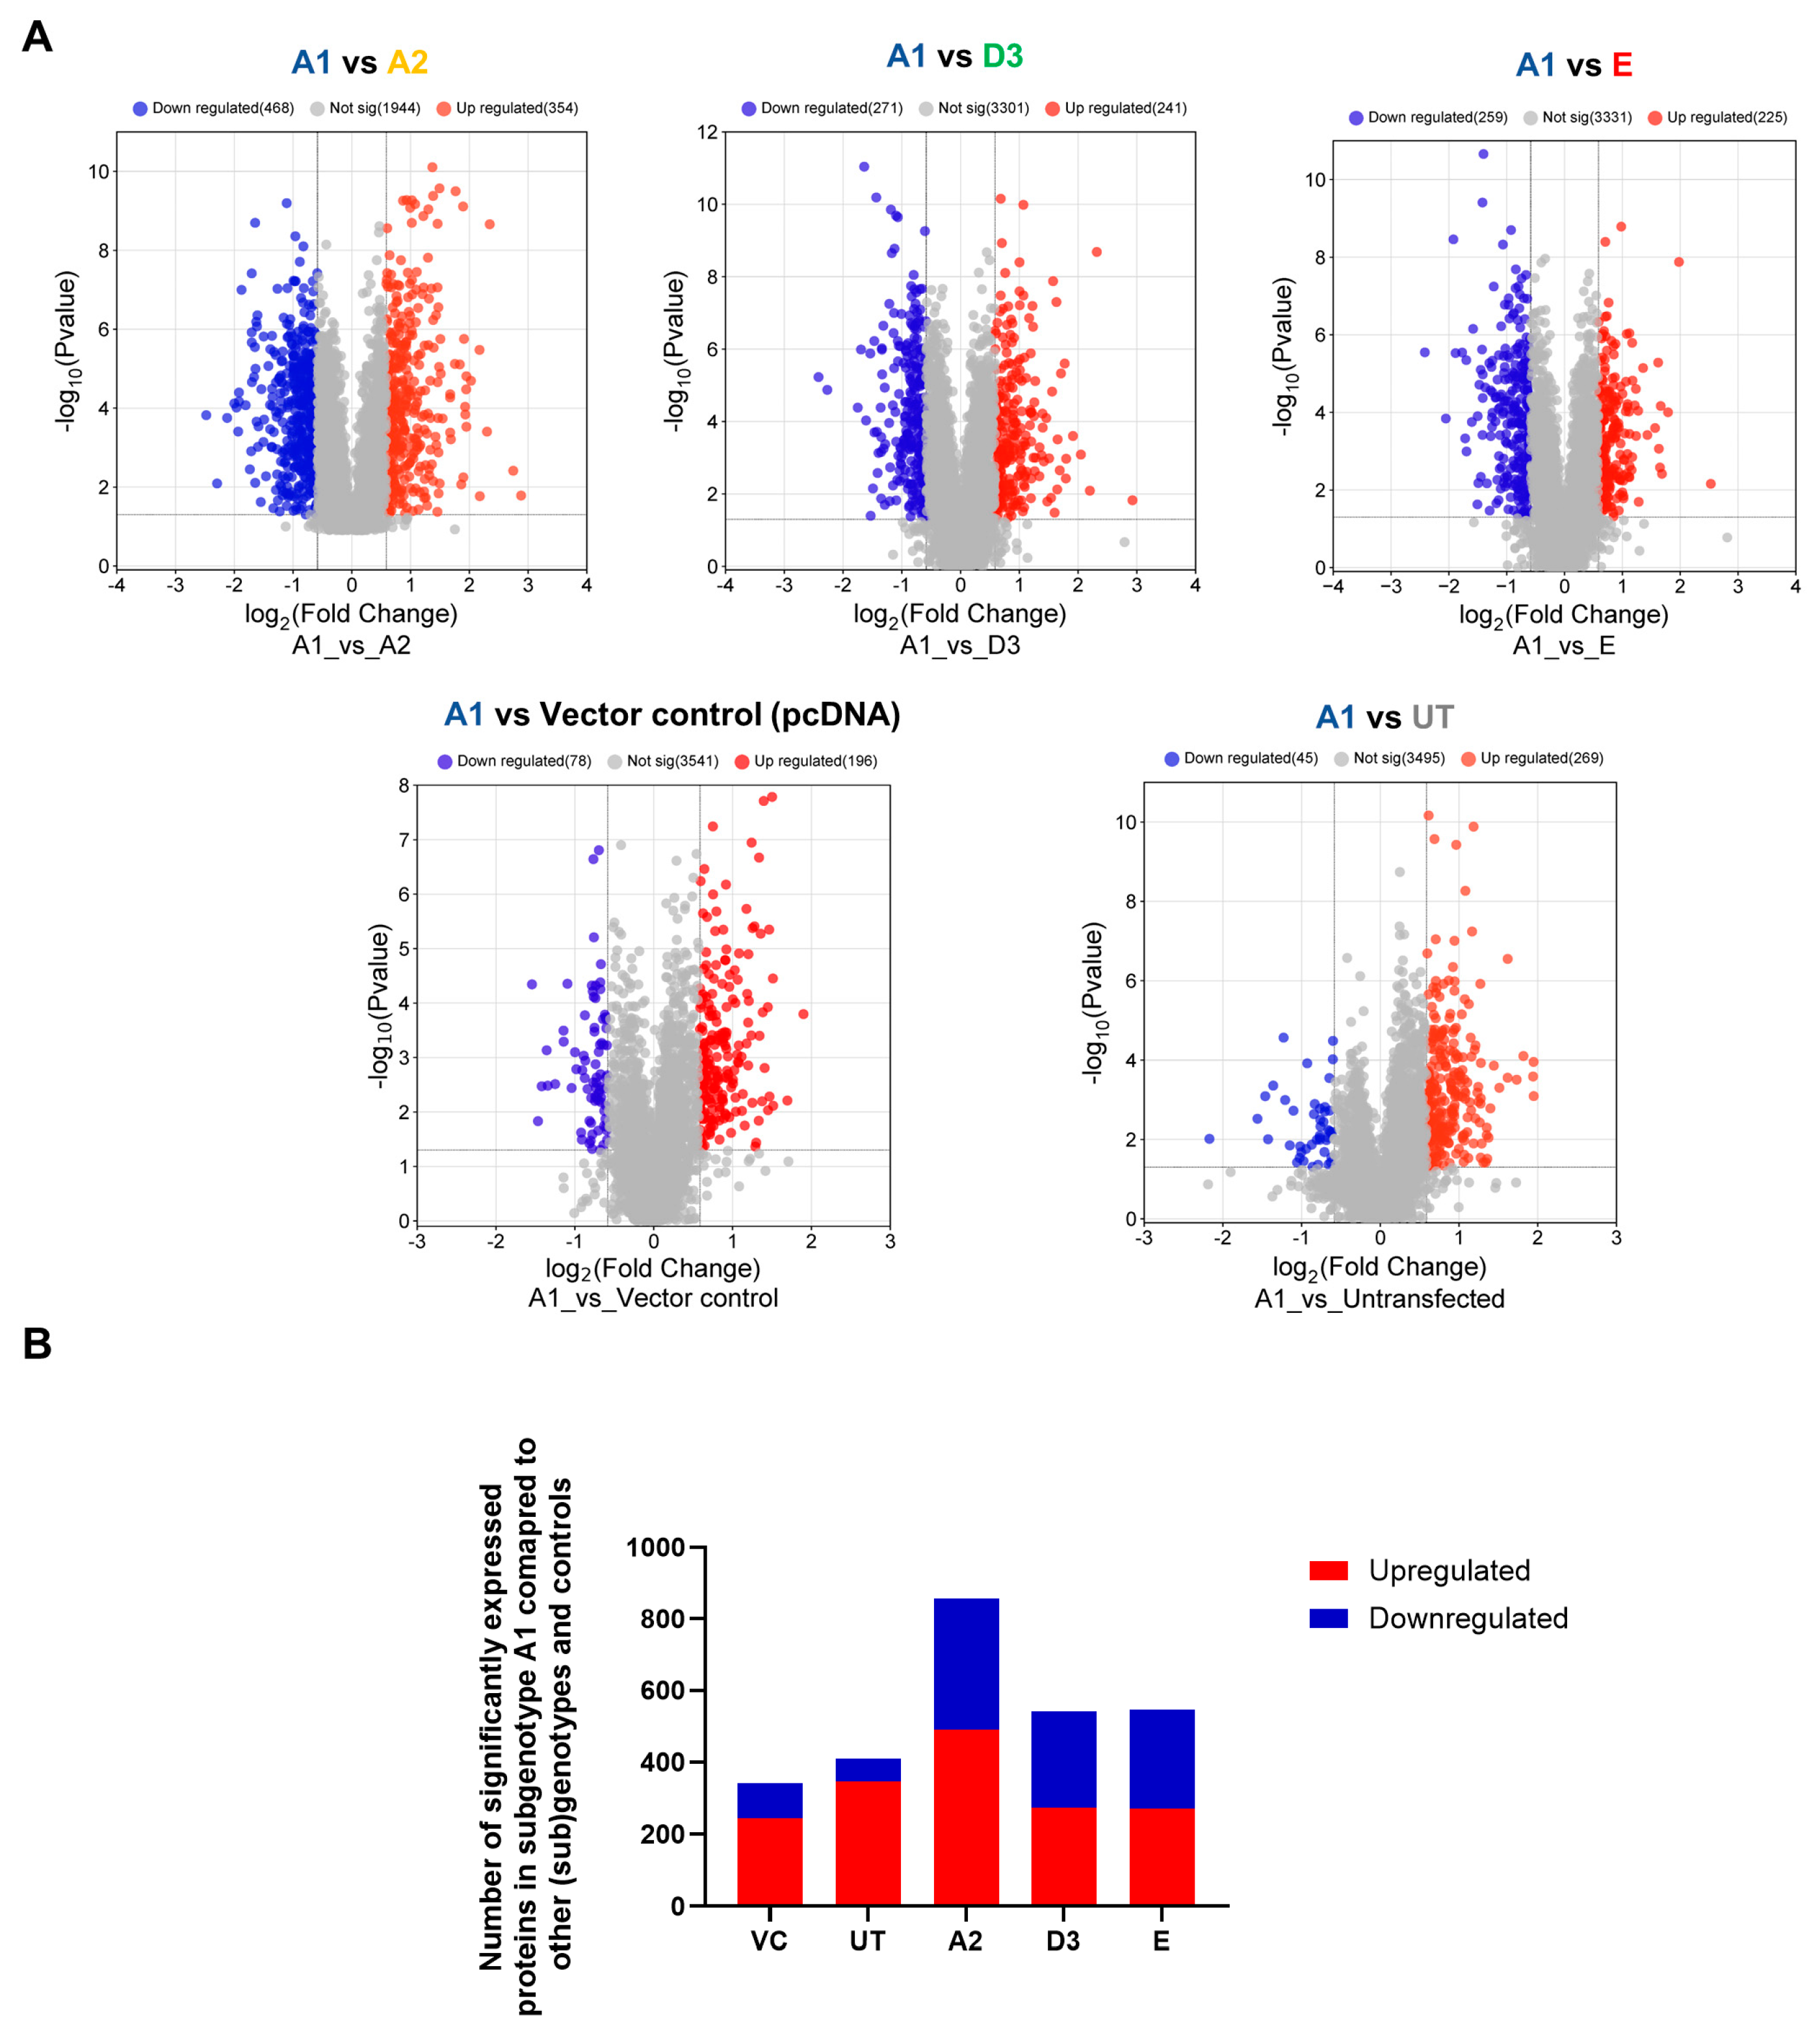
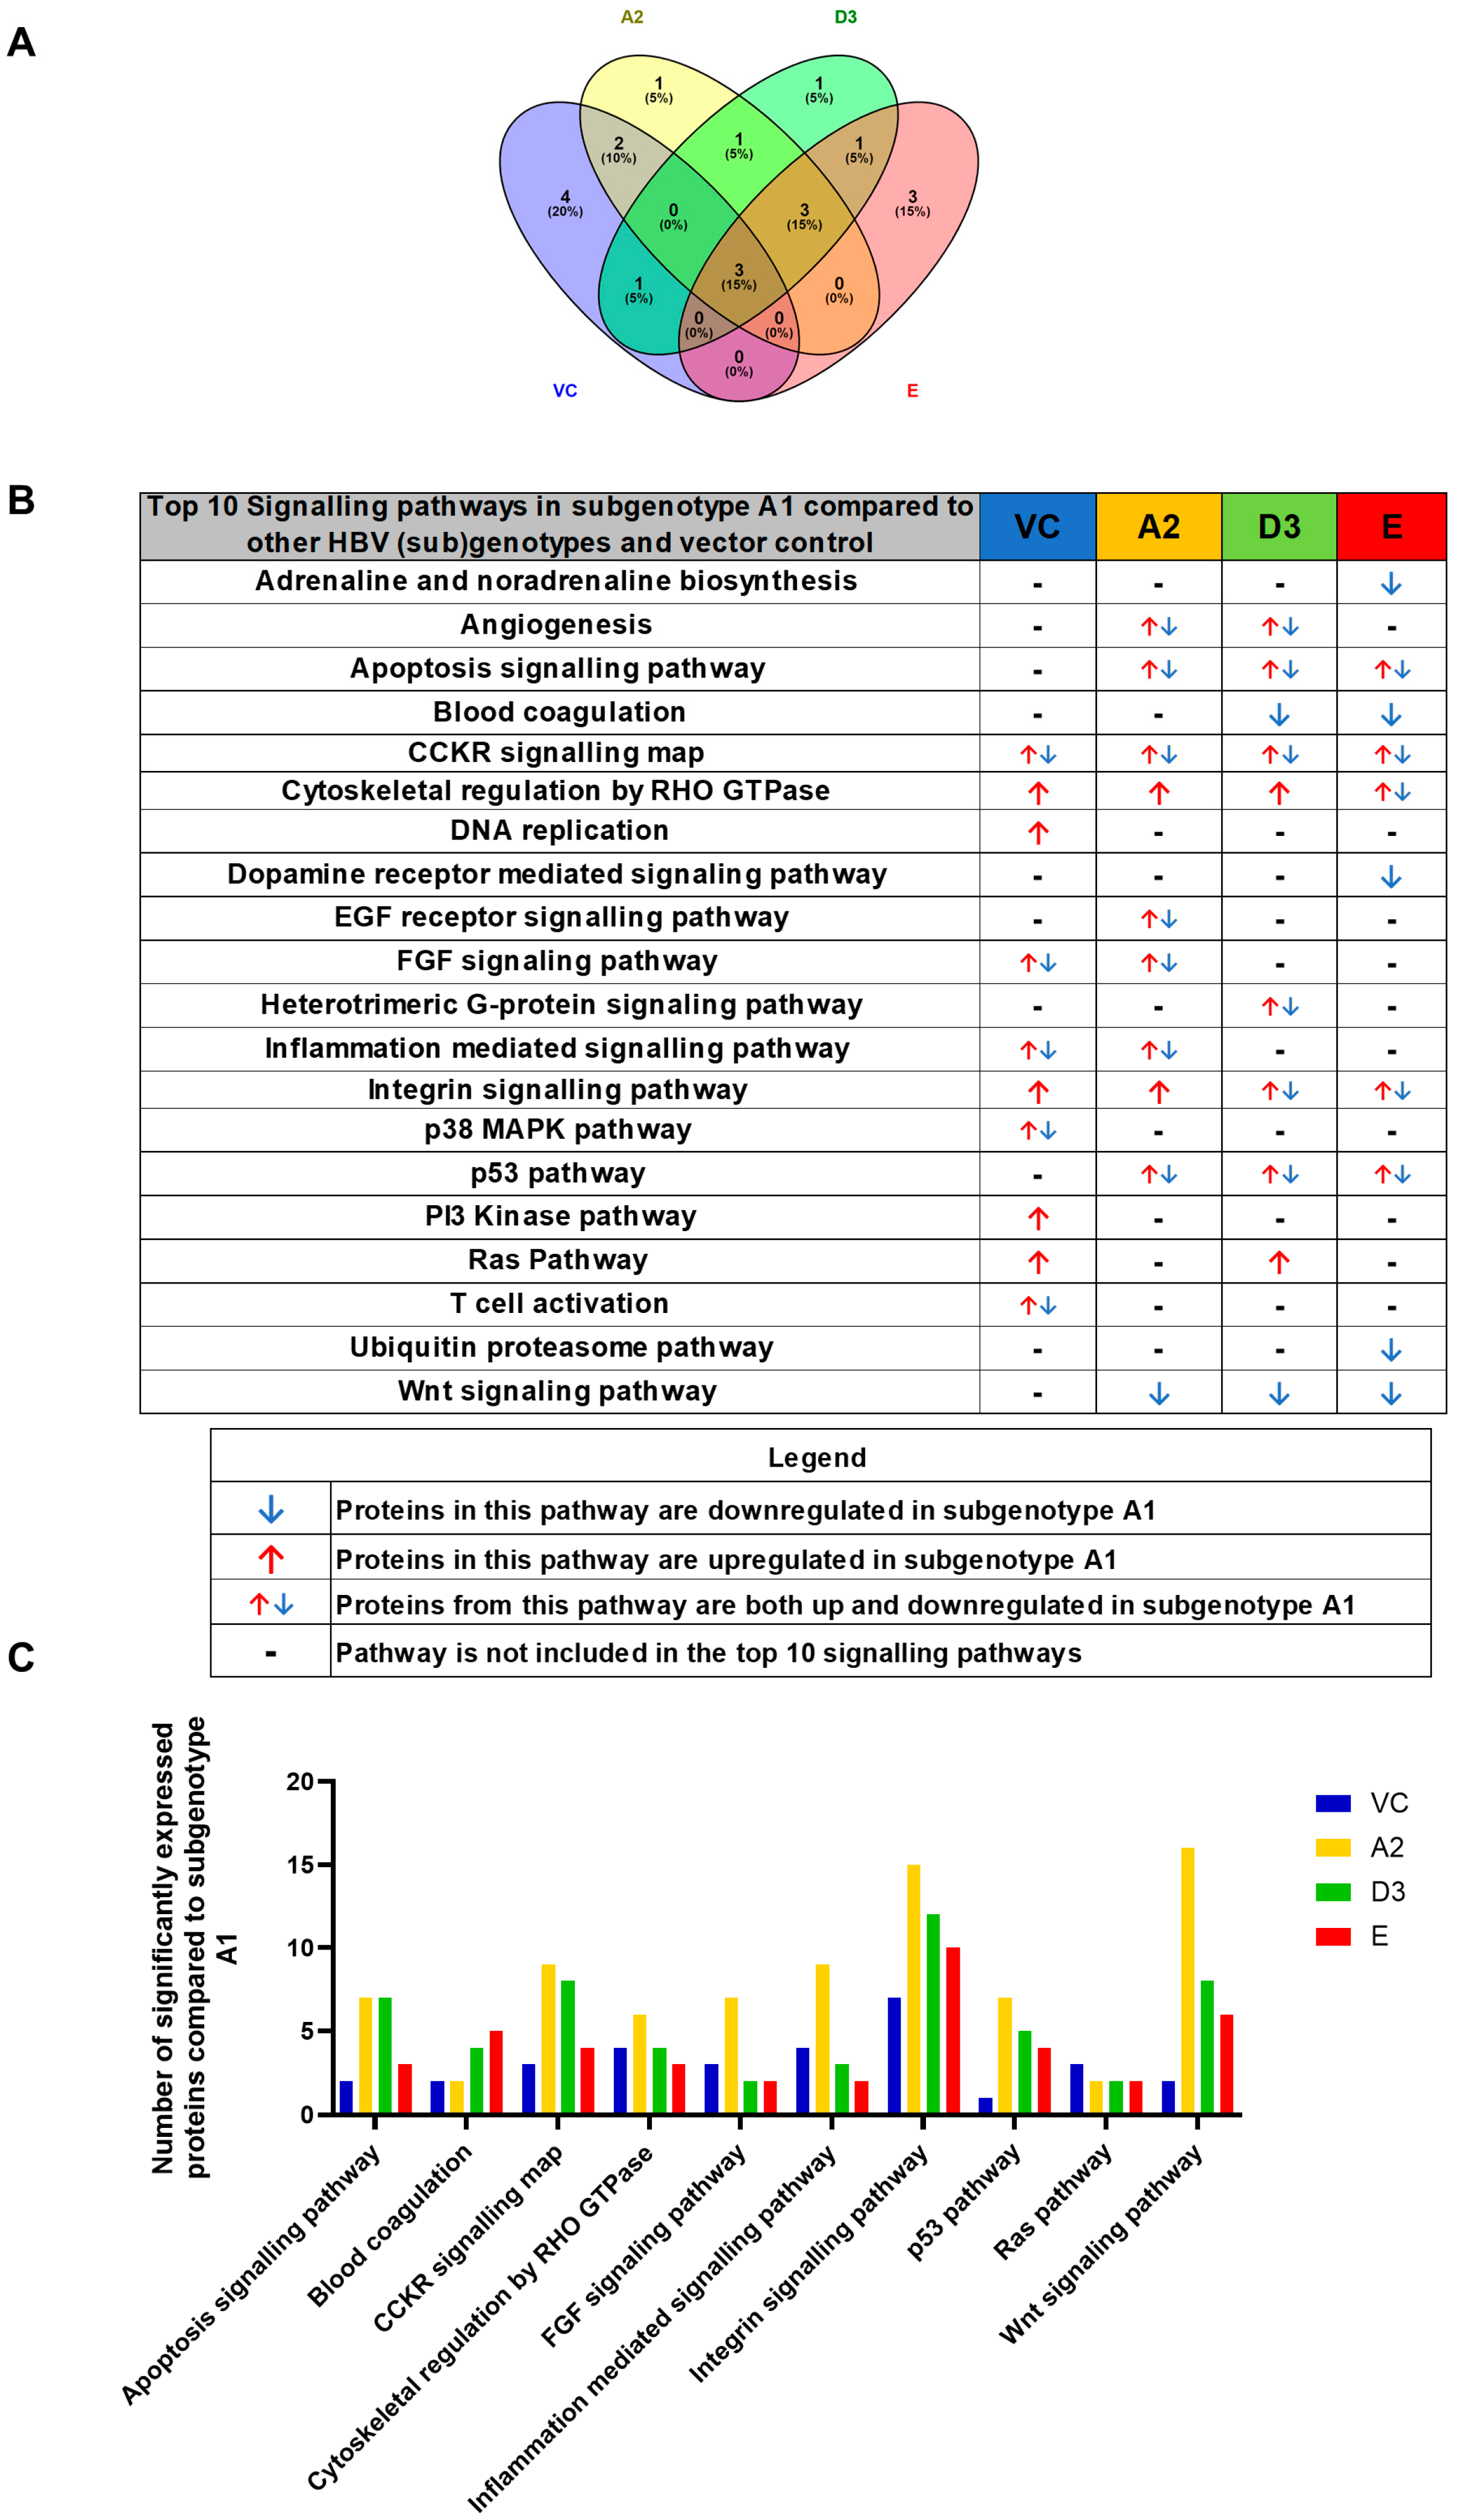
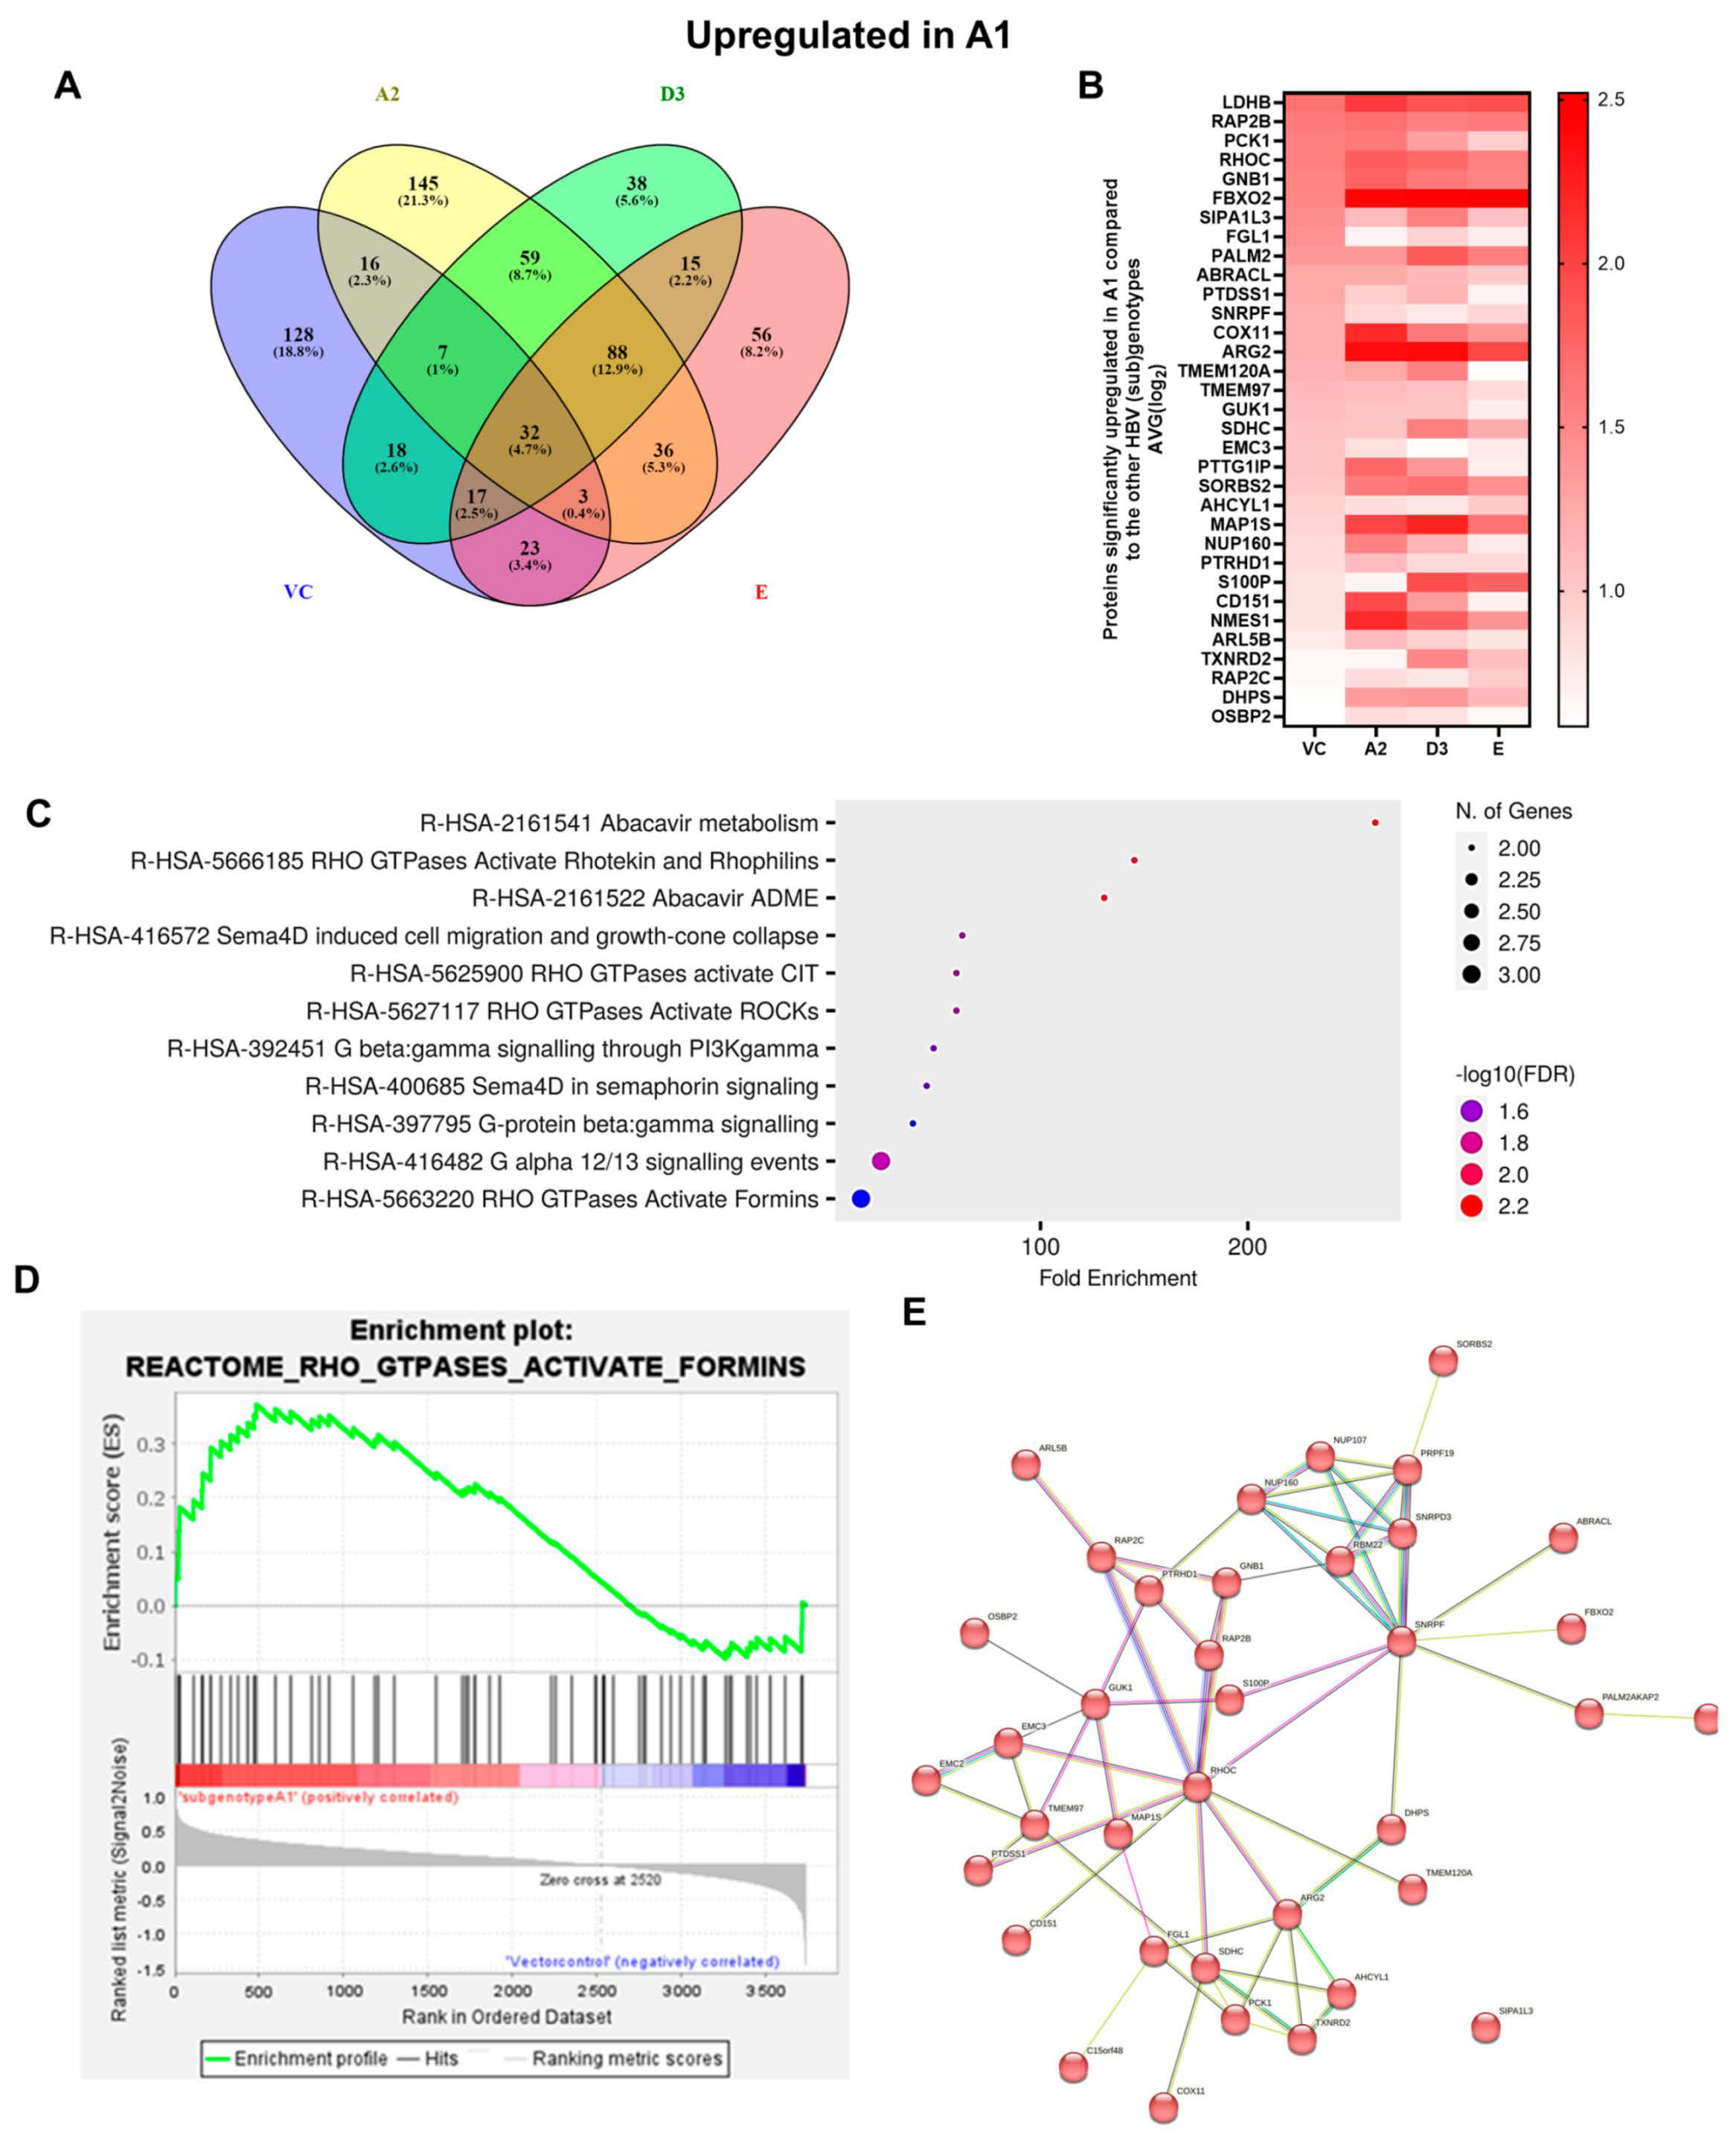
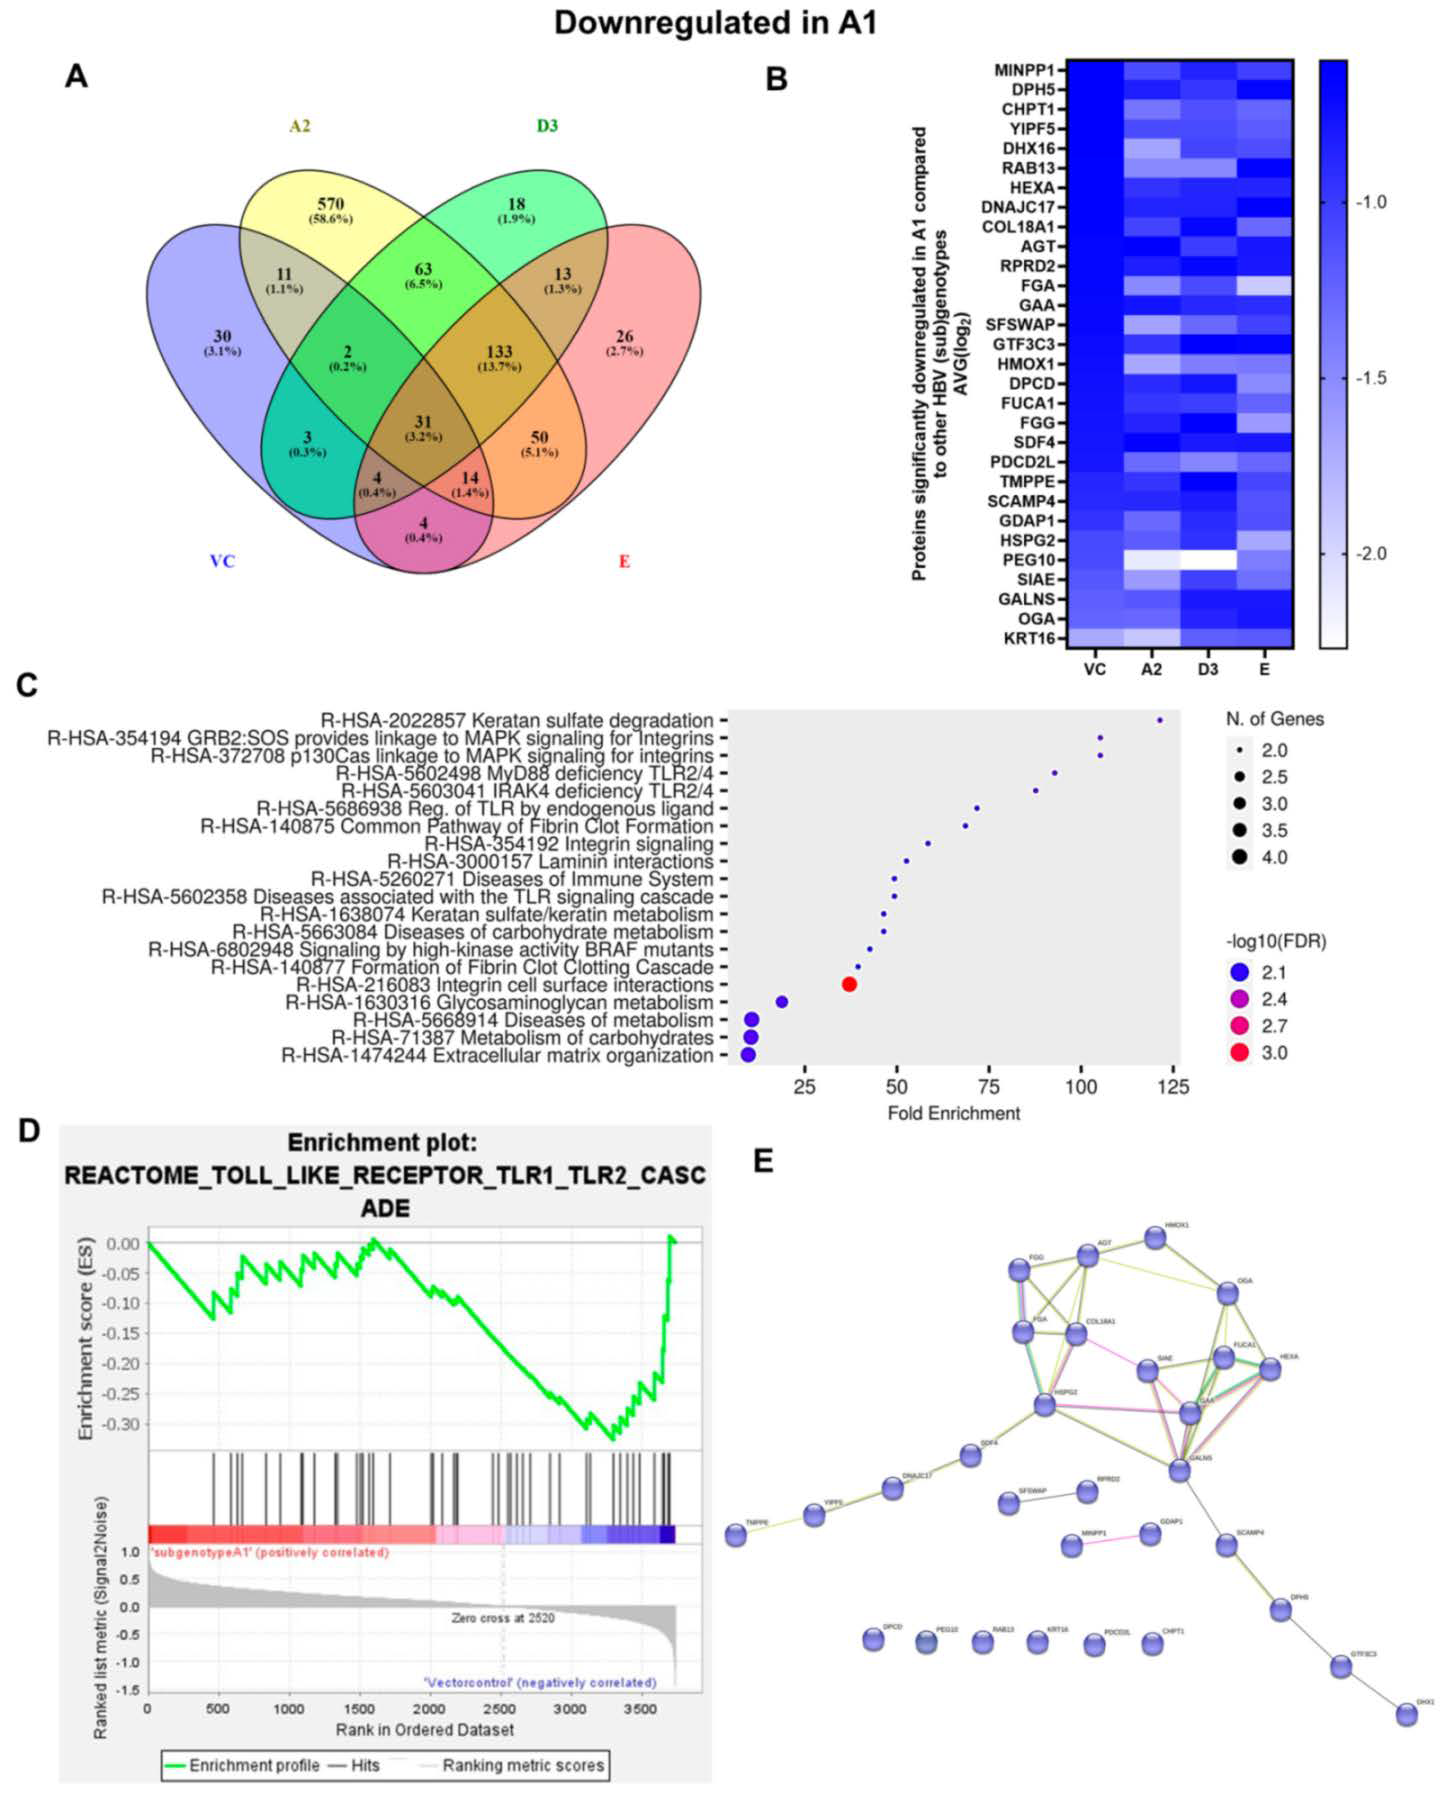
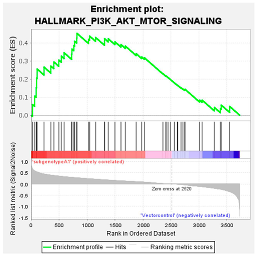
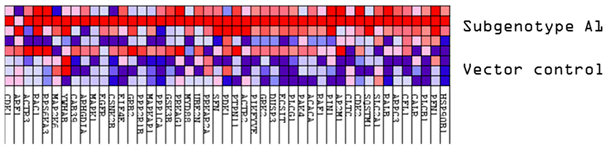
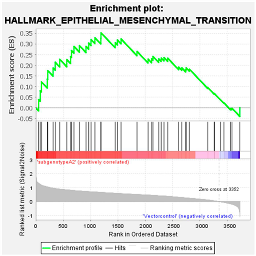
3.2. Hepatocarcinogenic Potential of Subgenotype A1 May Be Attributed to the Dysregulation of Ras-Associated Proteins
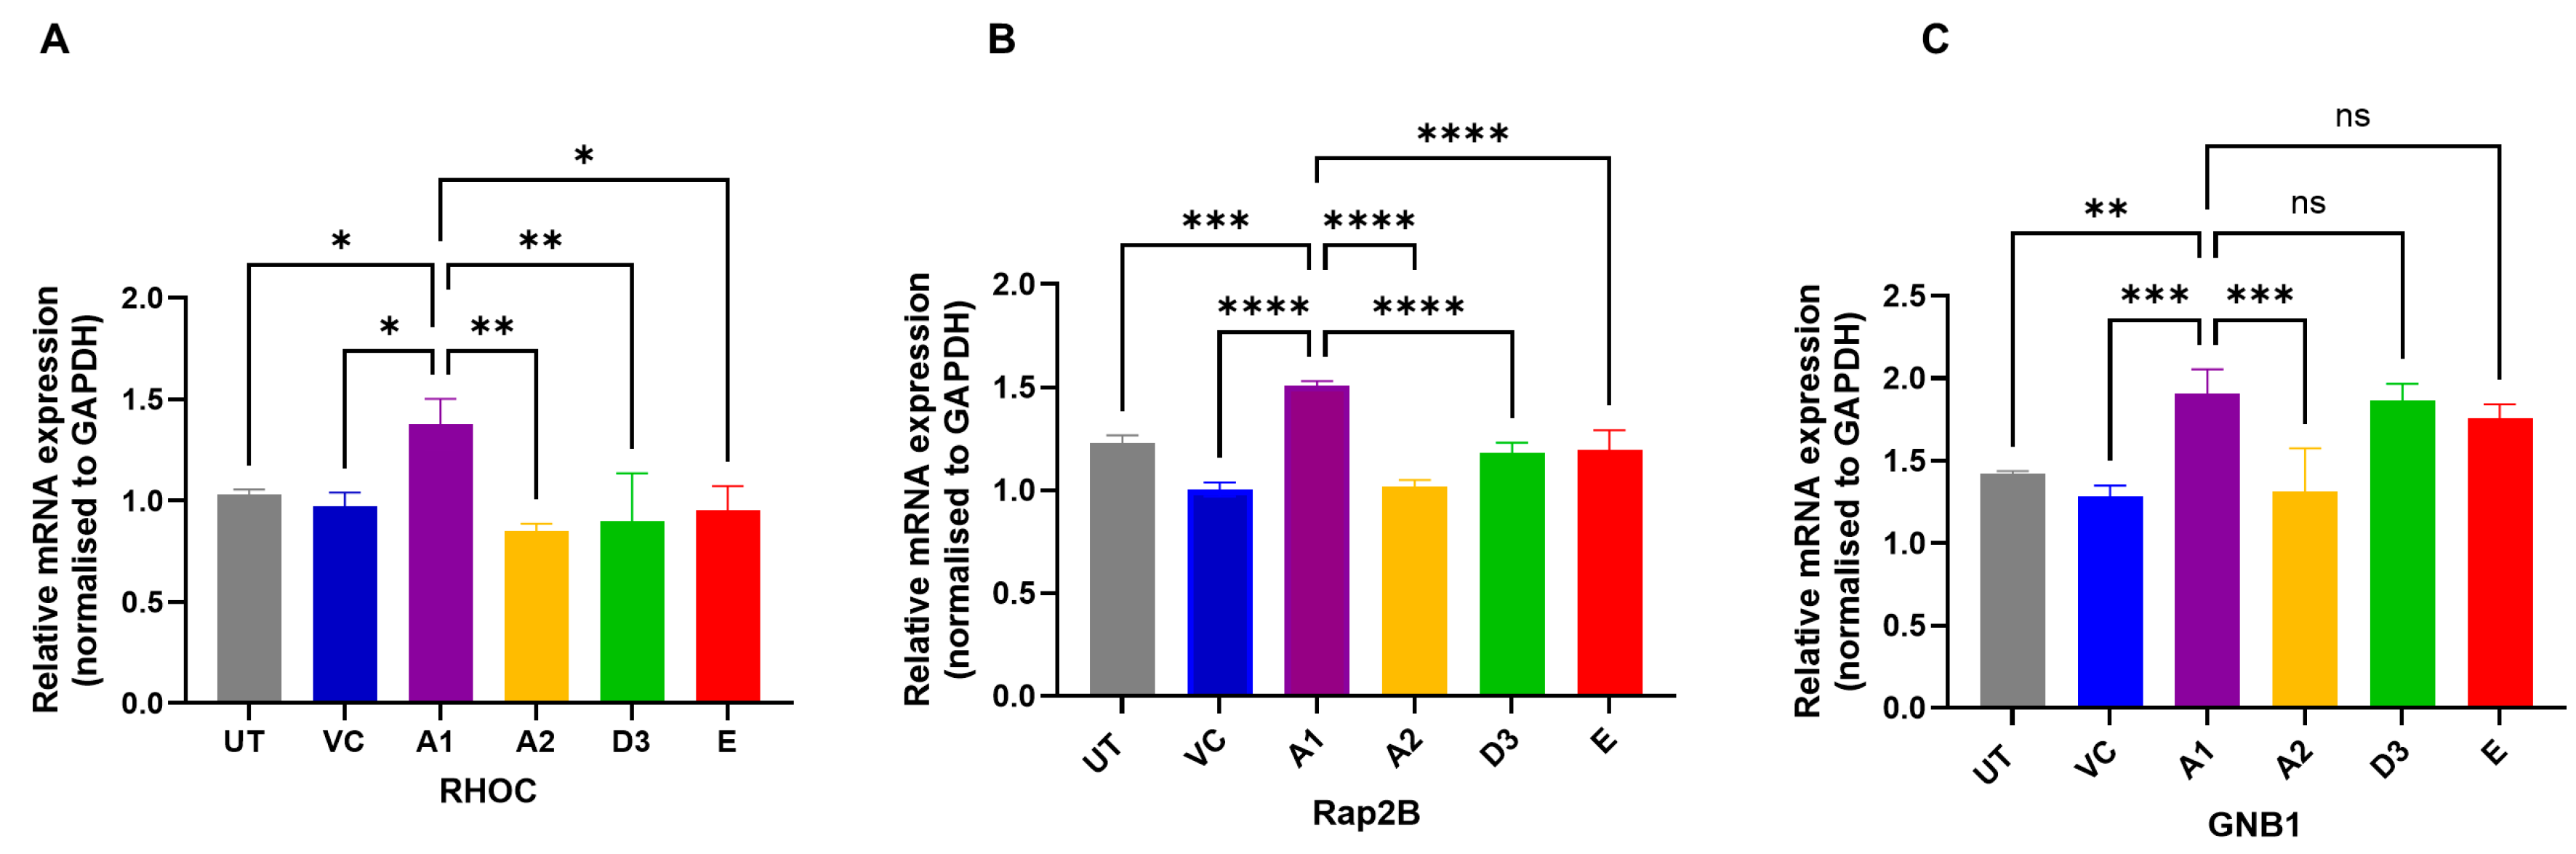
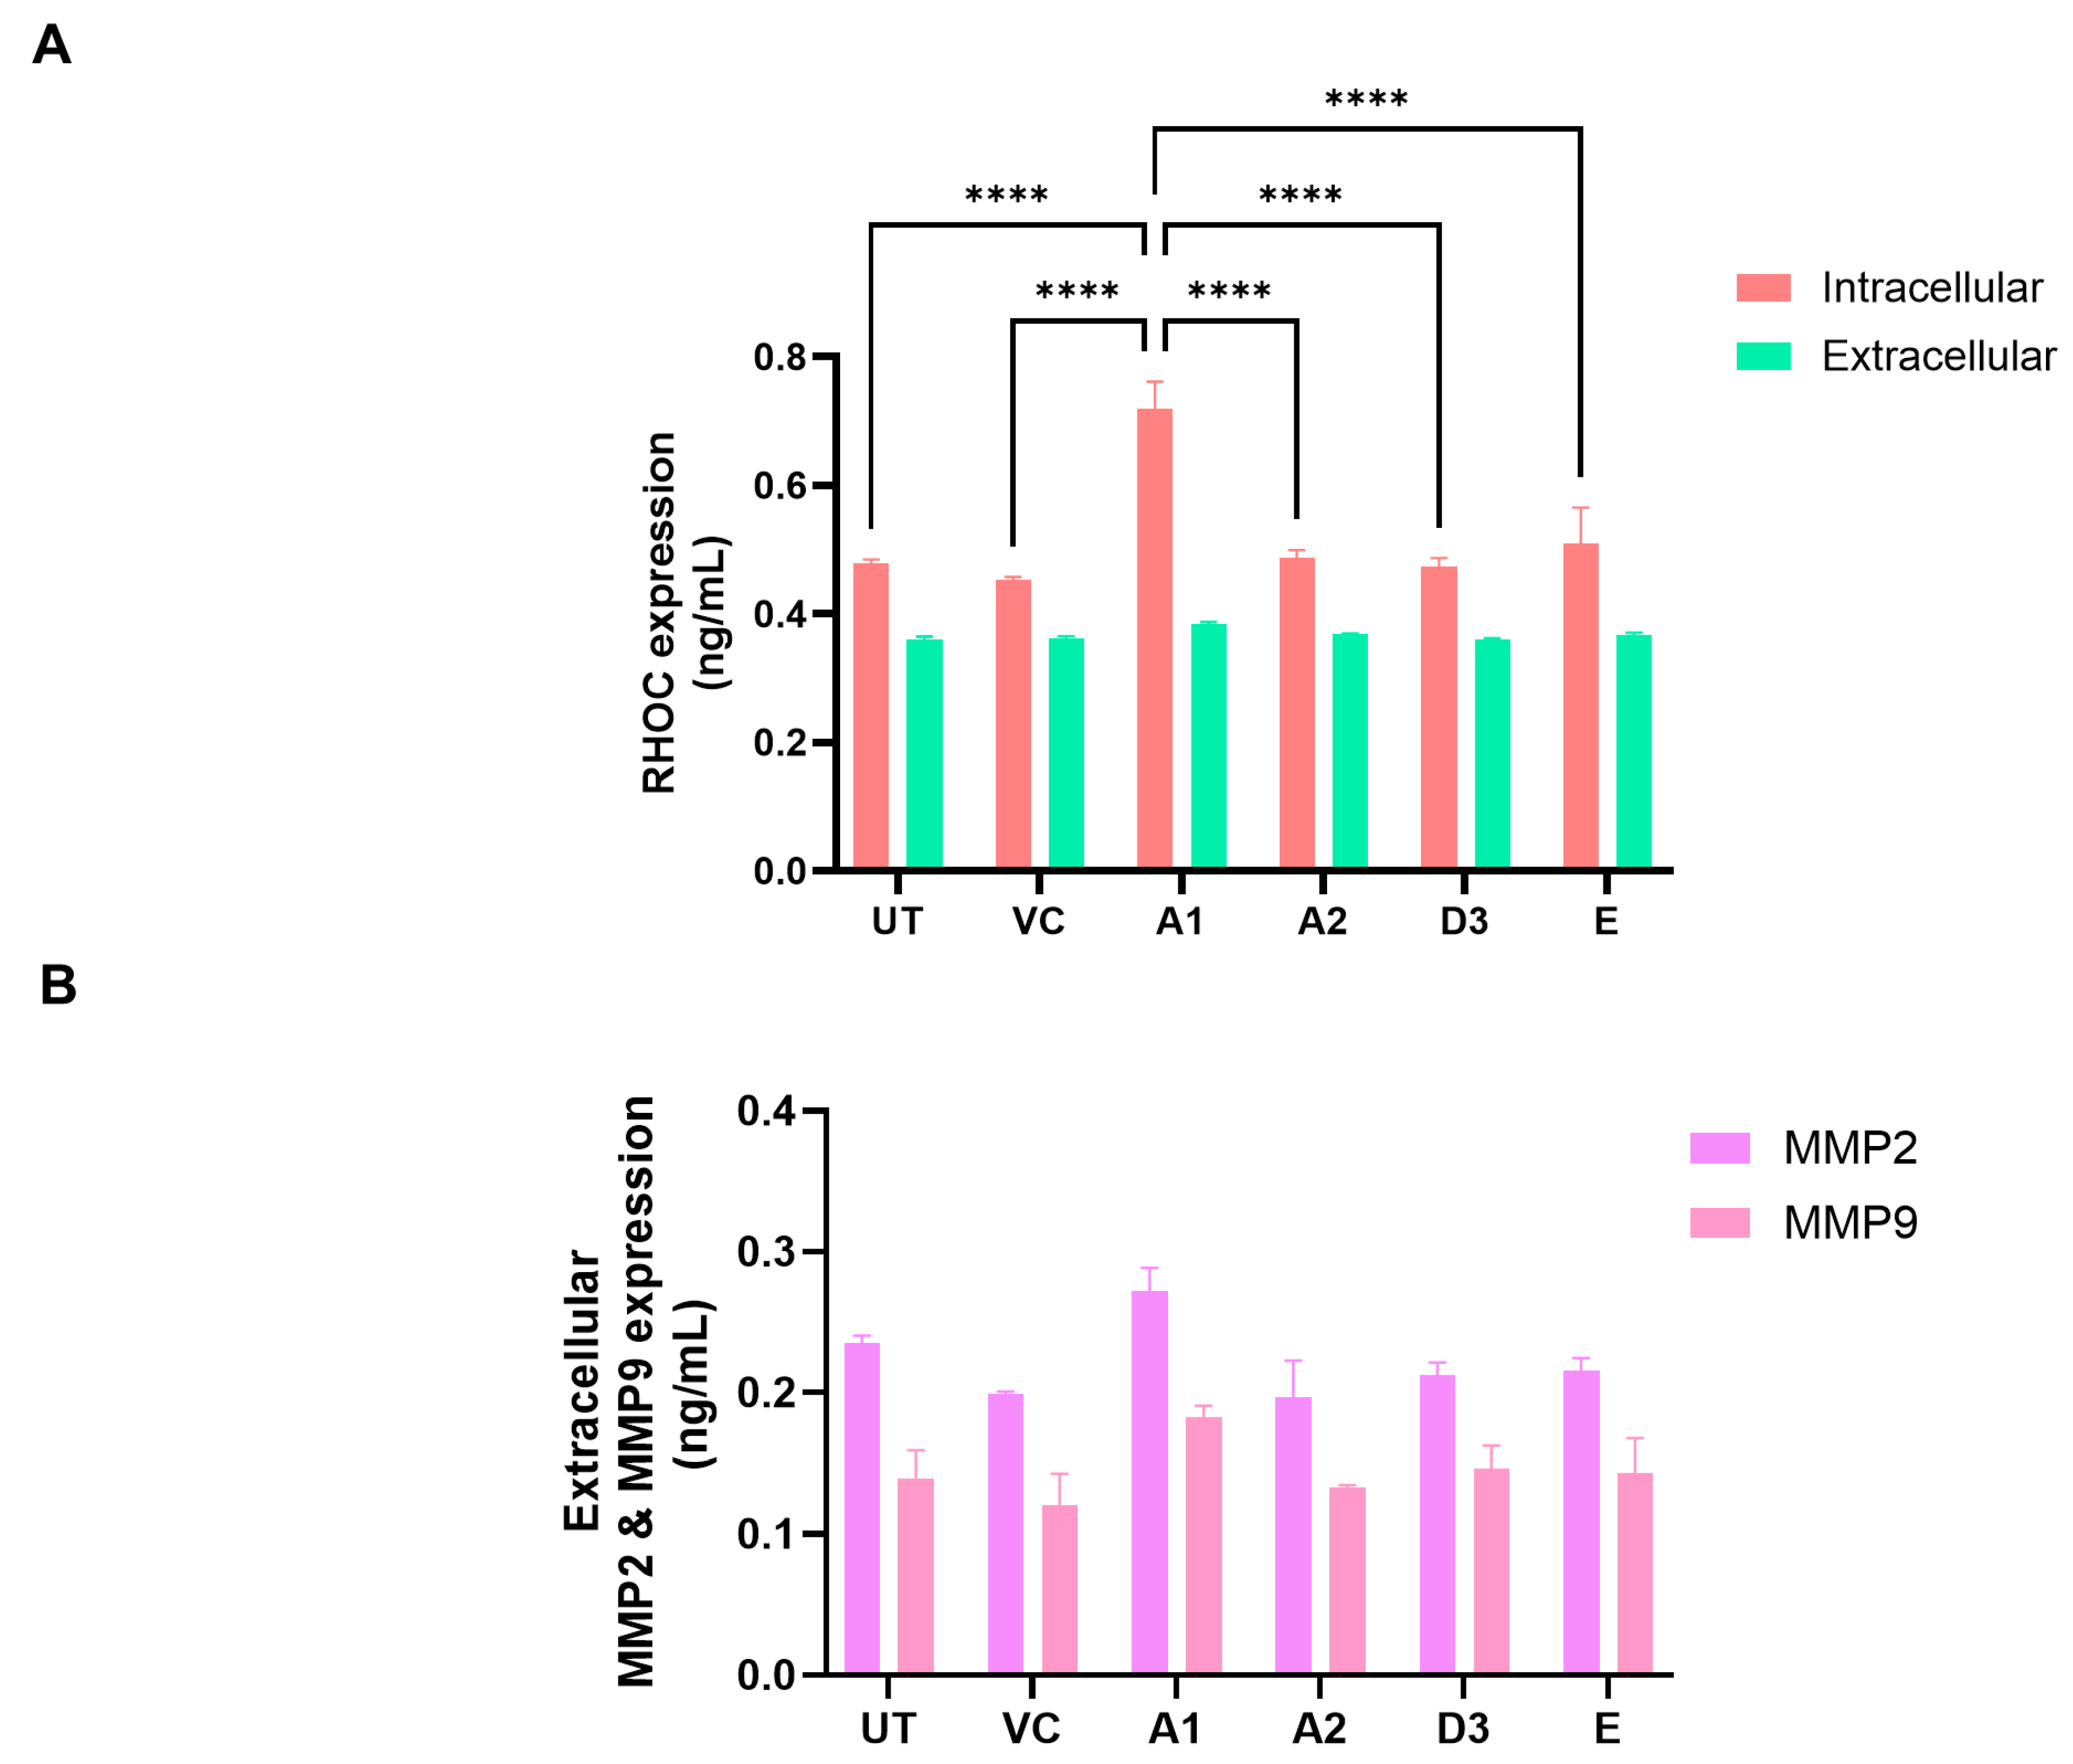
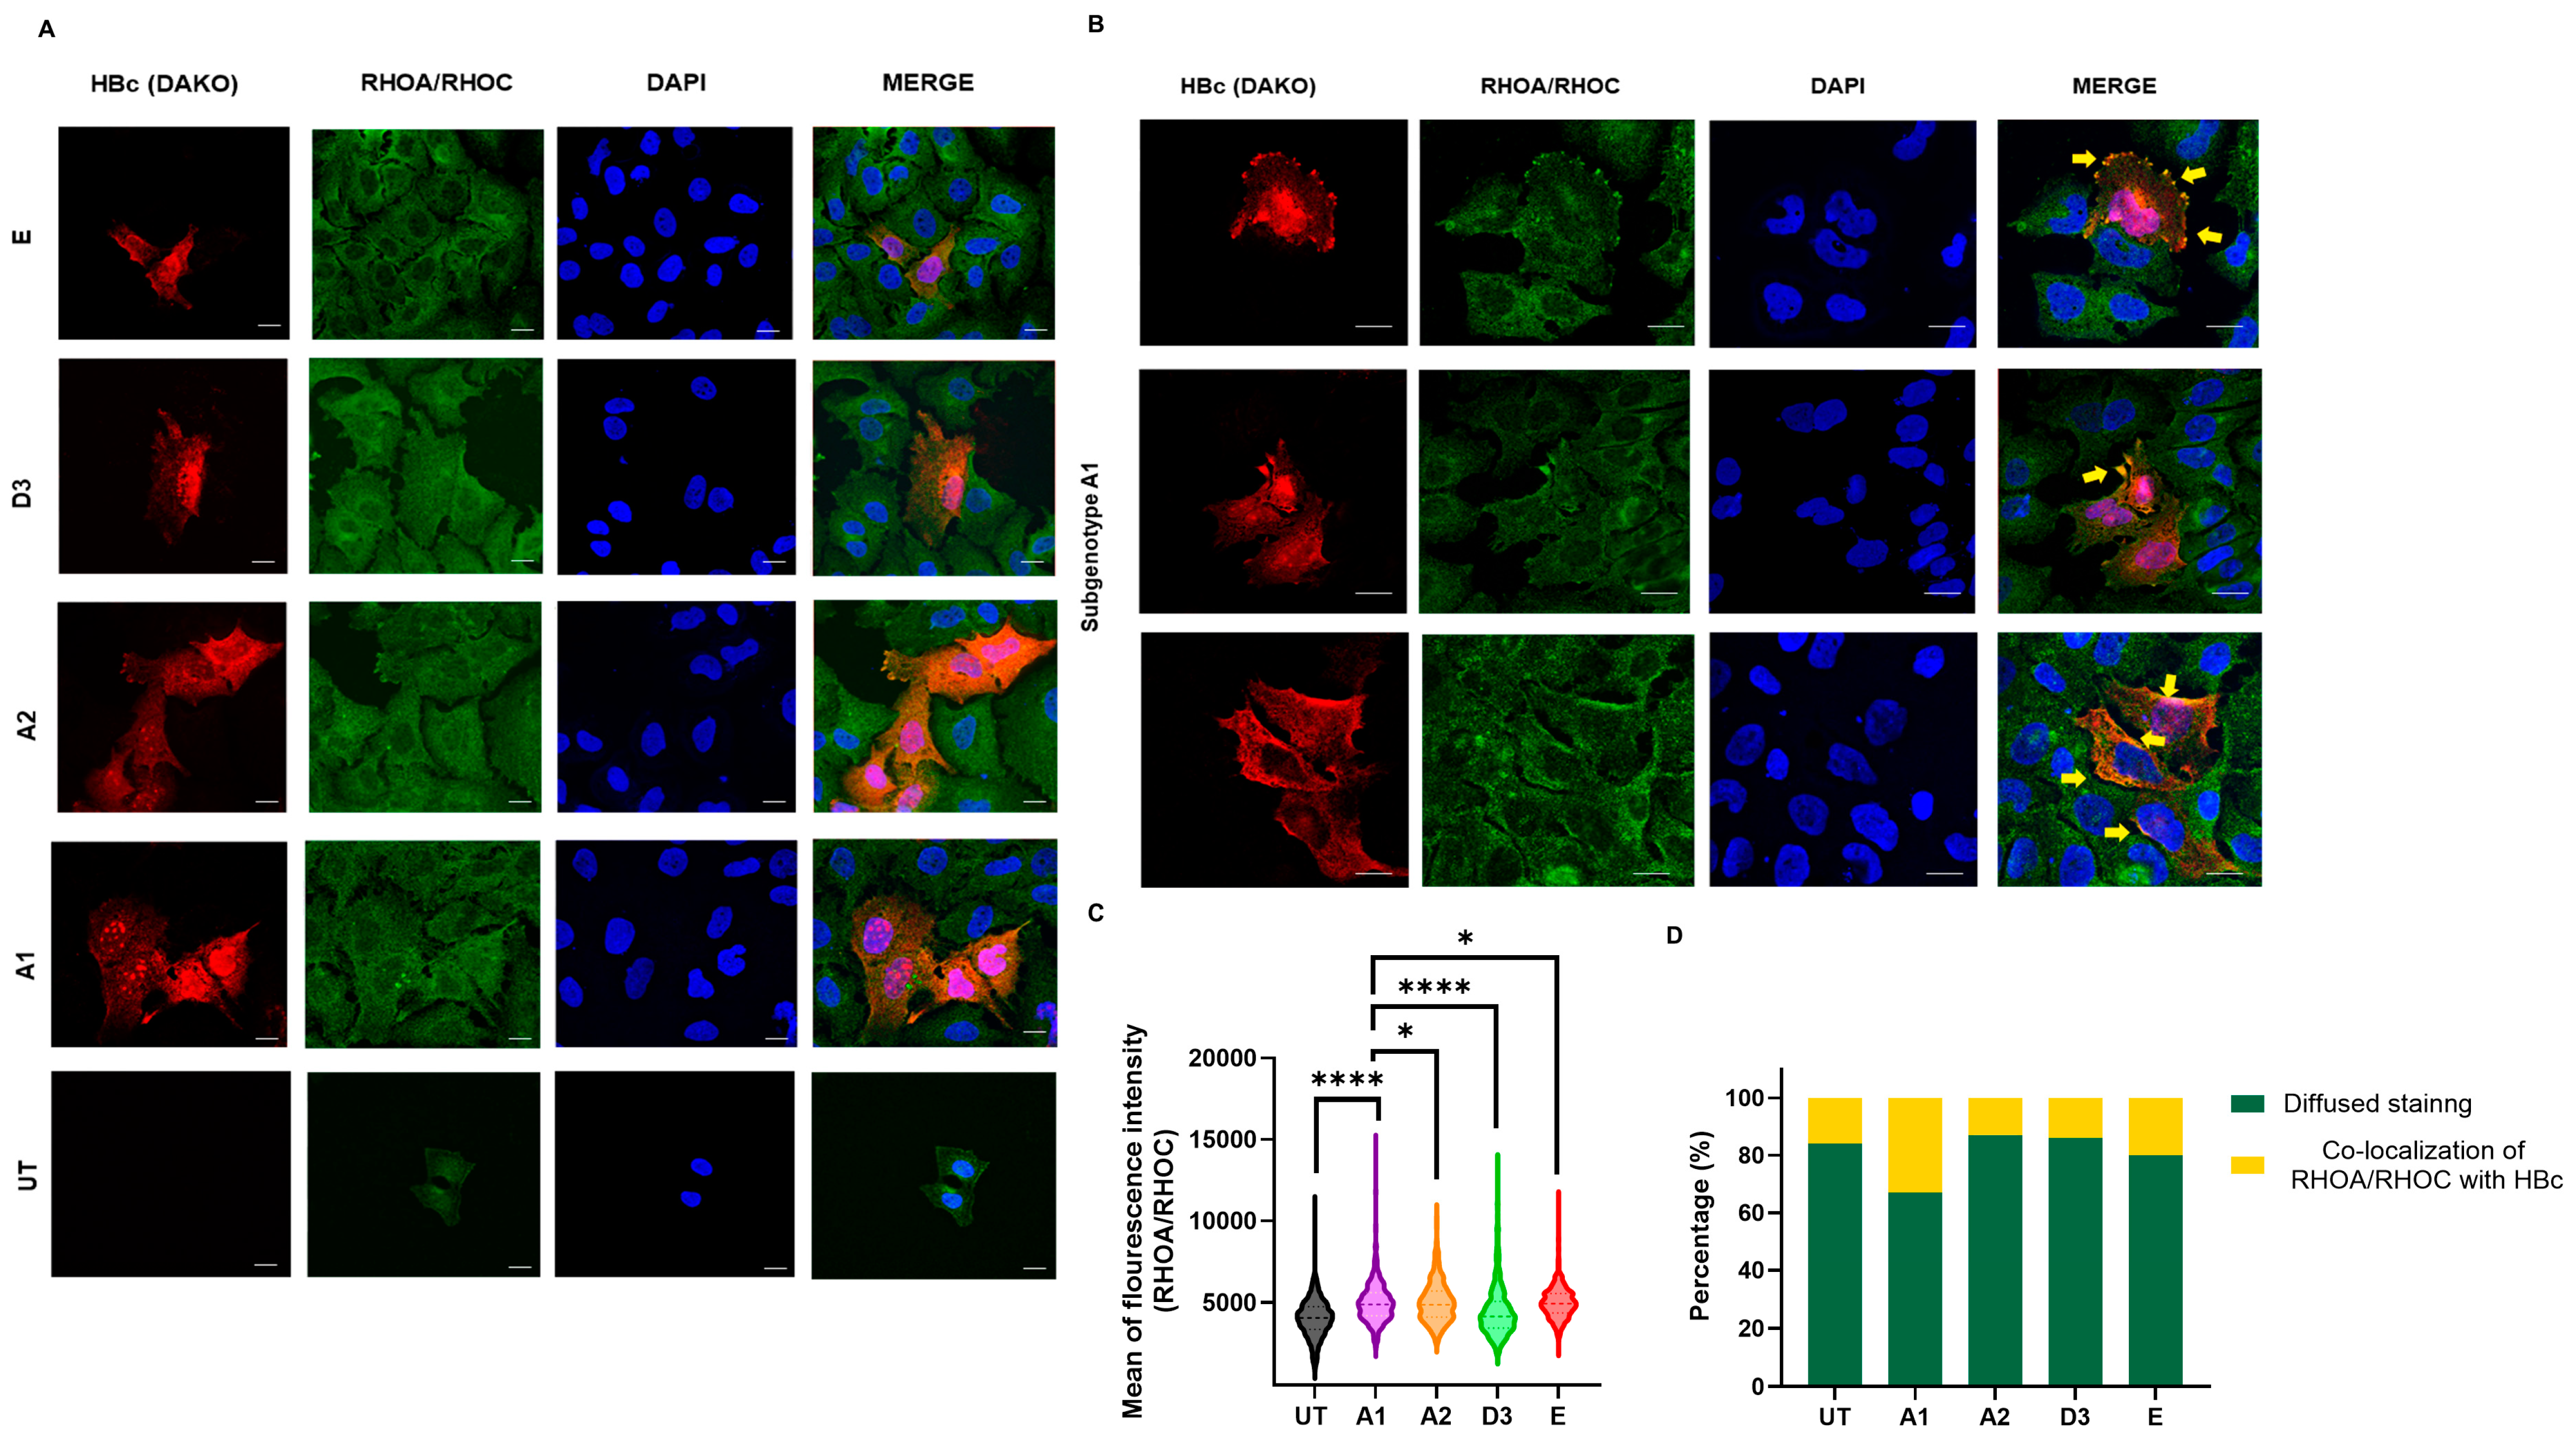
3.3. Subgenotype A1 Influence on RHOC and Its Downstream Signalling Products
4. Discussion
4.1. Dysregulated Signalling Pathways
4.1.1. p53 Pathway
4.1.2. MAPK Pathway
4.1.3. Wnt/β-Catenin Pathway
4.1.4. PI3K/Akt/mTOR Pathway
4.2. Dysregulated Proteins
5. Conclusions
Supplementary Materials
Author Contributions
Funding
Institutional Review Board Statement
Informed Consent Statement
Data Availability Statement
Acknowledgments
Conflicts of Interest
References
- Ferlay, J.; Colombet, M.; Soerjomataram, I.; Parkin, D.M.; Piñeros, M.; Znaor, A.; Bray, F. Cancer statistics for the year 2020: An overview. Int. J. Cancer 2021, 149, 778–789. [Google Scholar] [CrossRef] [PubMed]
- Sung, H.; Ferlay, J.; Siegel, R.L.; Laversanne, M.; Soerjomataram, I.; Jemal, A.; Bray, F.; Bsc, M.F.B.; Me, J.F.; Soerjomataram, M.I.; et al. Global Cancer Statistics 2020: GLOBOCAN Estimates of Incidence and Mortality Worldwide for 36 Cancers in 185 Countries. CA Cancer J. Clin. 2021, 71, 209–249. [Google Scholar] [CrossRef] [PubMed]
- WHO. Global Hepatitis Report 2024: Action for Access in Low- and Middle-Income Countries; World Health Organization: Geneva, Switzerland, 2024. [Google Scholar]
- Llovet, J.M.; Kelley, R.K.; Villanueva, A.; Singal, A.G.; Pikarsky, E.; Roayaie, S.; Lencioni, R.; Koike, K.; Zucman-Rossi, J.; Finn, R.S. Hepatocellular carcinoma. Nat. Rev. Dis. Primers 2021, 7, 6. [Google Scholar] [CrossRef] [PubMed]
- Kew, M.C. Hepatocellular carcinoma with and without cirrhosis. A comparison in southern African blacks. Gastroenterology 1989, 97, 136–139. [Google Scholar] [CrossRef] [PubMed]
- Chayanupatkul, M.; Omino, R.; Mittal, S.; Kramer, J.R.; Richardson, P.; Thrift, A.P.; El-Serag, H.B.; Kanwal, F. Hepatocellular carcinoma in the absence of cirrhosis in patients with chronic hepatitis B virus infection. J. Hepatol. 2017, 66, 355–362. [Google Scholar] [CrossRef] [PubMed]
- Kay, A.; Zoulim, F. Hepatitis B virus genetic variability and evolution. Virus Res. 2007, 127, 164–176. [Google Scholar] [CrossRef] [PubMed]
- Norder, H.; Couroucé, A.-M.; Coursaget, P.; Echevarria, J.M.; Lee, S.-D.; Mushahwar, I.K.; Robertson, B.H.; Locarnini, S.; Magnius, L.O. Genetic diversity of hepatitis B virus strains derived worldwide: Genotypes, subgenotypes, and HBsAg subtypes. Intervirology 2004, 47, 289–309. [Google Scholar] [CrossRef] [PubMed]
- Summers, J.; Smith, P.M.; Horwich, A.L. Hepadnavirus envelope proteins regulate covalently closed circular DNA amplification. J. Virol. 1990, 64, 2819–2824. [Google Scholar] [CrossRef] [PubMed]
- Wang, G.H.; Seeger, C. Novel mechanism for reverse transcription in hepatitis B viruses. J. Virol. 1993, 67, 6507–6512. [Google Scholar] [CrossRef]
- Kramvis, A. Genotypes and Genetic Variability of Hepatitis B Virus. Intervirology 2014, 57, 141–150. [Google Scholar] [CrossRef]
- Kramvis, A.; Kew, M.; François, G. Hepatitis B virus genotypes. Vaccine 2005, 23, 2409–2423. [Google Scholar] [CrossRef] [PubMed]
- Tatematsu, K.; Tanaka, Y.; Kurbanov, F.; Sugauchi, F.; Mano, S.; Maeshiro, T.; Nakayoshi, T.; Wakuta, M.; Miyakawa, Y.; Mizokami, M. A genetic variant of hepatitis B virus divergent from known human and ape genotypes isolated from a Japanese patient and provisionally assigned to new genotype J. J. Virol. 2009, 83, 10538–10547. [Google Scholar] [CrossRef] [PubMed]
- Norder, H.; Couroucé, A.M.; Magnius, L.O. Molecular basis of hepatitis B virus serotype variations within the four major subtypes. J. Gen. Virol. 1992, 73, 3141–3145. [Google Scholar] [CrossRef] [PubMed]
- Okamoto, H.; Tsuda, F.; Sakugawa, H.; Sastrosoewignjo, R.I.; Imai, M.; Miyakawa, Y.; Mayumi, M. Typing hepatitis B virus by homology in nucleotide sequence: Comparison of surface antigen subtypes. J. Gen. Virol. 1988, 69, 2575–2583. [Google Scholar] [CrossRef] [PubMed]
- Yu, H.; Yuan, Q.; Ge, S.-X.; Wang, H.-Y.; Zhang, Y.-L.; Chen, Q.-R.; Zhang, J.; Chen, P.-J.; Xia, N.-S. Molecular and phylogenetic analyses suggest an additional hepatitis B virus genotype “I”. PLoS ONE 2010, 5, e9297. [Google Scholar] [CrossRef]
- Pourkarim, M.R.; Amini-Bavil-Olyaee, S.; Kurbanov, F.; Van Ranst, M.; Tacke, F. Molecular identification of hepatitis B virus genotypes/subgenotypes: Revised classification hurdles and updated resolutions. World J. Gastroenterol. WJG 2014, 20, 7152. [Google Scholar] [CrossRef] [PubMed]
- Shi, W.; Zhang, Z.; Ling, C.; Zheng, W.; Zhu, C.; Carr, M.J.; Higgins, D.G. Hepatitis B virus subgenotyping: History, effects of recombination, misclassifications, and corrections. Infect. Genet. Evol. 2013, 16, 355–361. [Google Scholar] [CrossRef] [PubMed]
- Yousif, M.; Kramvis, A. Genotype D of hepatitis B virus and its subgenotypes: An update. Hepatol. Res. 2013, 43, 355–364. [Google Scholar] [CrossRef] [PubMed]
- Kramvis, A. Molecular characteristics and clinical relevance of African genotypes and subgenotypes of hepatitis B virus. S. Afr. Med. J. 2018, 108, 17–21. [Google Scholar]
- Kramvis, A. Molecular characterisation of the genotypes and mutants of hepatitis B virus from South Africa. S. Afr. J. Epidemiol. Infect. 2008, 23, 29–31. [Google Scholar] [CrossRef]
- Kramvis, A.; Kew, M.C. Epidemiology of hepatitis B virus in Africa, its genotypes and clinical associations of genotypes. Hepatol. Res. Off. J. Jpn. Soc. Hepatol. 2007, 37, S9–S19. [Google Scholar] [CrossRef] [PubMed]
- Sant’Anna, T.B.; Araujo, N.M. Hepatitis B Virus Genotype D: An Overview of Molecular Epidemiology, Evolutionary History, and Clinical Characteristics. Microorganisms 2023, 11, 1101. [Google Scholar] [CrossRef] [PubMed]
- Kobayashi, M.; Suzuki, F.; Arase, Y.; Akuta, N.; Suzuki, Y.; Hosaka, T.; Saitoh, S.; Kobayashi, M.; Tsubota, A.; Someya, T.; et al. Infection with hepatitis B virus genotype A in Tokyo, Japan during 1976 through 2001. J. Gastroenterol. 2004, 39, 844–850. [Google Scholar] [CrossRef] [PubMed]
- McMahon, B.J. Epidemiology and natural history of hepatitis B. Semin. Liver Dis. 2005, 25 (Suppl. S1), 3–8. [Google Scholar] [CrossRef] [PubMed]
- Yousif, M.; Mudawi, H.; Hussein, W.; Mukhtar, M.; Nemeri, O.; Glebe, D.; Kramvis, A. Genotyping and virological characteristics of hepatitis B virus in HIV-infected individuals in Sudan. Int. J. Infect. Dis. 2014, 29, 125–132. [Google Scholar] [CrossRef] [PubMed]
- Kramvis, A. The clinical implications of hepatitis B virus genotypes and HBeAg in pediatrics. Rev. Med. Virol. 2016, 26, 285–303. [Google Scholar] [CrossRef] [PubMed]
- Tanaka, Y.; Hasegawa, I.; Kato, T.; Orito, E.; Hirashima, N.; Acharya, S.K.; Gish, R.G.; Kramvis, A.; Kew, M.C.; Yoshihara, N.; et al. A case-control study for differences among hepatitis B virus infections of genotypes A (subtypes Aa and Ae) and D. Hepatology 2004, 40, 747–755. [Google Scholar] [CrossRef] [PubMed]
- Buckwold, V.E.; Xu, Z.; Chen, M.; Yen, T.; Ou, J.-H. Effects of a naturally occurring mutation in the hepatitis B virus basal core promoter on precore gene expression and viral replication. J. Virol. 1996, 70, 5845–5851. [Google Scholar] [CrossRef] [PubMed]
- Ahn, S.H.; Kramvis, A.; Kawai, S.; Spangenberg, H.C.; Li, J.; Kimbi, G.; Kew, M.; Wands, J.; Tong, S. Sequence variation upstream of precore translation initiation codon reduces hepatitis B virus e antigen production. Gastroenterology 2003, 125, 1370–1378. [Google Scholar] [CrossRef]
- Bhoola, N.H.; Kramvis, A. Hepatitis B e Antigen Expression by Hepatitis B Virus Subgenotype A1 Relative to Subgenotypes A2 and D3 in Cultured Hepatocellular Carcinoma (Huh7) Cells. Intervirology 2016, 59, 48–59. [Google Scholar] [CrossRef]
- Chen, C.Y.; Crowther, C.; Kew, M.C.; Kramvis, A. A valine to phenylalanine mutation in the precore region of hepatitis B virus causes intracellular retention and impaired secretion of HBe-antigen. Hepatol. Res. Off. J. Jpn. Soc. Hepatol. 2008, 38, 580–592. [Google Scholar] [CrossRef] [PubMed]
- Carman, W.F.; Jacyna, M.R.; Hadziyannis, S.; Karayiannis, P.; McGarvey, M.J.; Makris, A.; Thomas, H.C. Mutation preventing formation of hepatitis B e antigen in patients with chronic hepatitis B infection. Lancet 1989, 2, 588–591. [Google Scholar] [CrossRef] [PubMed]
- Gao, Q.; Zhu, H.; Dong, L.; Shi, W.; Chen, R.; Song, Z.; Huang, C.; Li, J.; Dong, X.; Zhou, Y.; et al. Integrated Proteogenomic Characterization of HBV-Related Hepatocellular Carcinoma. Cell 2019, 179, 561–577.e22. [Google Scholar] [CrossRef] [PubMed]
- Hannivoort, R.; Hernandez-Gea, V.; Friedman, S. Genomics and proteomics in liver fibrosis and cirrhosis. Fibrogenes. Tissue Repair 2012, 5, 1. [Google Scholar] [CrossRef] [PubMed]
- Kim, K.H.; Seong, B.L. Pro-apoptotic function of HBV X protein is mediated by interaction with c-FLIP and enhancement of death-inducing signal. EMBO J. 2003, 22, 2104–2116. [Google Scholar] [CrossRef] [PubMed]
- Wei, D.; Zeng, Y.; Xing, X.; Liu, H.; Lin, M.; Han, X.; Liu, X.; Liu, J. Proteome differences between hepatitis B virus genotype-B-and genotype-C-induced hepatocellular carcinoma revealed by iTRAQ-based quantitative proteomics. J. Proteome Res. 2016, 15, 487–498. [Google Scholar] [CrossRef] [PubMed]
- Chen, Y.; Wei, D.; Deng, M. Comparative Analysis of Serum Proteins Between Hepatitis B Virus Genotypes B and C Infection by DIA-Based Quantitative Proteomics. Infect. Drug Resist. 2021, 14, 4701–4715. [Google Scholar] [CrossRef] [PubMed]
- Bhoola, N.H.; Reumann, K.; Kew, M.C.; Will, H.; Kramvis, A.; Tabak, F. Construction of replication competent plasmids of hepatitis B virus subgenotypes A1, A2 and D3 with authentic endogenous promoters. J. Virol. Methods 2014, 203, 54–64. [Google Scholar] [CrossRef]
- Olubayo, L.A.I. Construction and Functional Characterization of Genotype E of Hepatitis B Virus Replication Competent Plasmids with Endogenous Promoters. Ph.D. Thesis, Department of Internal Medicine, University of Witwatersrand Wits WIReDspace, Johannesburg, South Africa, 2022. [Google Scholar]
- Nweke, E.E.; Naicker, P.; Aron, S.; Stoychev, S.; Devar, J.; Tabb, D.L.; Omoshoro-Jones, J.; Smith, M.; Candy, G. SWATH-MS based proteomic profiling of pancreatic ductal adenocarcinoma tumours reveals the interplay between the extracellular matrix and related intracellular pathways. PLoS ONE 2020, 15, e0240453. [Google Scholar] [CrossRef]
- Mi, H.; Huang, X.; Muruganujan, A.; Tang, H.; Mills, C.; Kang, D.; Thomas, P.D. PANTHER version 11: Expanded annotation data from Gene Ontology and Reactome pathways, and data analysis tool enhancements. Nucleic Acids Res. 2017, 45, D183–D189. [Google Scholar] [CrossRef]
- Mi, H.; Muruganujan, A.; Casagrande, J.T.; Thomas, P.D. Large-scale gene function analysis with the PANTHER classification system. Nat. Protoc. 2013, 8, 1551–1566. [Google Scholar] [CrossRef] [PubMed]
- Viana, R.; Wang, R.; Yu, M.C.; Welschinger, R.; Chen, C.-Y.; Kew, M.C. Hepatitis B viral loads in southern African Blacks with hepatocellular carcinoma. J. Med. Virol. 2009, 81, 1525–1530. [Google Scholar] [CrossRef] [PubMed]
- Deroubaix, A.; Moahla, B.; Penny, C. Monitoring of intracellular localization of Hepatitis B virus P22 protein using Laser Scanning Confocal Microscopy and Airyscan. Microsc. Res. Tech. 2020, 83, 499–506. [Google Scholar] [CrossRef] [PubMed]
- Duriez, M.; Rossignol, J.M.; Sitterlin, D. The hepatitis B virus precore protein is retrotransported from endoplasmic reticulum (ER) to cytosol through the ER-associated degradation pathway. J. Biol. Chem. 2008, 283, 32352–32360. [Google Scholar] [CrossRef] [PubMed]
- Subramanian, A.; Tamayo, P.; Mootha, V.K.; Mukherjee, S.; Ebert, B.L.; Gillette, M.A.; Paulovich, A.; Pomeroy, S.L.; Golub, T.R.; Lander, E.S.; et al. Gene set enrichment analysis: A knowledge-based approach for interpreting genome-wide expression profiles. Proc. Natl. Acad. Sci. USA 2005, 102, 15545–15550. [Google Scholar] [CrossRef] [PubMed]
- Ge, S.X.; Jung, D.; Yao, R. ShinyGO: A graphical gene-set enrichment tool for animals and plants. Bioinformatics 2019, 36, 2628–2629. [Google Scholar] [CrossRef] [PubMed]
- Wong, C.C.L.; Wong, C.M.; Au, S.L.K.; Ng, I.O.L. RhoGTPases and Rho-effectors in hepatocellular carcinoma metastasis: ROCK N’Rho move it. Liver Int. 2010, 30, 642–656. [Google Scholar] [CrossRef] [PubMed]
- Wang, W.; Yang, L.-Y.; Yang, Z.-L.; Huang, G.-W.; Lu, W.-Q. Expression and significance of RhoC gene in hepatocellular carcinoma. World J. Gastroenterol. 2003, 9, 1950–1953. [Google Scholar] [CrossRef] [PubMed]
- Lou, Y.; Jiang, Y.; Liang, Z.; Liu, B.; Li, T.; Zhang, D. Role of RhoC in cancer cell migration. Cancer Cell Int. 2021, 21, 527. [Google Scholar] [CrossRef]
- Jiang, Y.; Han, Q.; Zhao, H.; Zhang, J. The Mechanisms of HBV-Induced Hepatocellular Carcinoma. J. Hepatocell. Carcinoma 2021, 8, 435–450. [Google Scholar] [CrossRef]
- Ascione, A.; Fontanella, L.; Imparato, M.; Rinaldi, L.; De Luca, M. Mortality from cirrhosis and hepatocellular carcinoma in Western Europe over the last 40 years. Liver Int. 2017, 37, 1193–1201. [Google Scholar] [CrossRef] [PubMed]
- Seto, W.K.; Lo, Y.R.; Pawlotsky, J.M.; Yuen, M.F. Chronic hepatitis B virus infection. Lancet 2018, 392, 2313–2324. [Google Scholar] [CrossRef] [PubMed]
- Berger, E.; Vega, N.; Weiss-Gayet, M.; Géloën, A. Gene Network Analysis of Glucose Linked Signaling Pathways and Their Role in Human Hepatocellular Carcinoma Cell Growth and Survival in HuH7 and HepG2 Cell Lines. BioMed Res. Int. 2015, 2015, 821761. [Google Scholar] [CrossRef] [PubMed]
- Chen, X.; Shi, C.; He, M.; Xiong, S.; Xia, X. Endoplasmic reticulum stress: Molecular mechanism and therapeutic targets. Signal Transduct. Target. Ther. 2023, 8, 352. [Google Scholar] [CrossRef] [PubMed]
- Wang, X.; Wei, Z.; Cheng, B.; Li, J.; He, Y.; Lan, T.; Kemper, T.; Lin, Y.; Jiang, B.; Jiang, Y.; et al. Endoplasmic reticulum stress promotes HBV production by enhancing use of the autophagosome/multivesicular body axis. Hepatology 2022, 75, 438–454. [Google Scholar] [CrossRef] [PubMed]
- Levrero, M.; Zucman-Rossi, J. Mechanisms of HBV-induced hepatocellular carcinoma. J. Hepatol. 2016, 64, S84–S101. [Google Scholar] [CrossRef] [PubMed]
- Scheuner, D.; Song, B.; McEwen, E.; Liu, C.; Laybutt, R.; Gillespie, P.; Saunders, T.; Bonner-Weir, S.; Kaufman, R.J. Translational control is required for the unfolded protein response and in vivo glucose homeostasis. Mol. Cell 2001, 7, 1165–1176. [Google Scholar] [CrossRef]
- Harris, S.L.; Levine, A.J. The p53 pathway: Positive and negative feedback loops. Oncogene 2005, 24, 2899–2908. [Google Scholar] [CrossRef] [PubMed]
- Guichard, C.; Amaddeo, G.; Imbeaud, S.; Ladeiro, Y.; Pelletier, L.; Maad, I.B.; Calderaro, J.; Bioulac-Sage, P.; Letexier, M.; Degos, F.; et al. Integrated analysis of somatic mutations and focal copy-number changes identifies key genes and pathways in hepatocellular carcinoma. Nat. Genet. 2012, 44, 694–698. [Google Scholar] [CrossRef]
- Schulze, K.; Imbeaud, S.; Letouzé, E.; Alexandrov, L.B.; Calderaro, J.; Rebouissou, S.; Couchy, G.; Meiller, C.; Shinde, J.; Soysouvanh, F.; et al. Exome sequencing of hepatocellular carcinomas identifies new mutational signatures and potential therapeutic targets. Nat. Genet. 2015, 47, 505–511. [Google Scholar] [CrossRef]
- Bressac, B.; Kew, M.; Wands, J.; Ozturk, M. Selective G to T mutations of p53 gene in hepatocellular carcinoma from southern Africa. Nature 1991, 350, 429–431. [Google Scholar] [CrossRef] [PubMed]
- Hsu, I.C.; Metcalf, R.A.; Sun, T.; Welsh, J.A.; Wang, N.J.; Harris, C.C. Mutational hotspot in the p53 gene in human hepatocellular carcinomas. Nature 1991, 350, 427–428. [Google Scholar] [CrossRef]
- Chang, W.W.; Su, I.J.; Chang, W.T.; Huang, W.; Lei, H.Y. Suppression of p38 mitogen-activated protein kinase inhibits hepatitis B virus replication in human hepatoma cell: The antiviral role of nitric oxide. J. Viral Hepat. 2008, 15, 490–497. [Google Scholar] [CrossRef] [PubMed]
- Kim, S.Y.; Kim, H.; Kim, S.W.; Lee, N.R.; Yi, C.M.; Heo, J.; Kim, B.J.; Kim, N.J.; Inn, K.S. An Effective Antiviral Approach Targeting Hepatitis B Virus with NJK14047, a Novel and Selective Biphenyl Amide p38 Mitogen-Activated Protein Kinase Inhibitor. Antimicrob. Agents Chemother. 2017, 61, e00214-17. [Google Scholar] [CrossRef] [PubMed]
- Sonderup, M.W.; Spearman, C.W. Global Disparities in Hepatitis B Elimination—A Focus on Africa. Viruses 2022, 14, 82. [Google Scholar] [CrossRef] [PubMed]
- Spearman, C.W.; Sonderup, M.W. Preventing hepatitis B and hepatocellular carcinoma in South Africa: The case for a birth-dose vaccine. S. Afr. Med. J. 2014, 104, 610–612. [Google Scholar] [CrossRef]
- Mellors, J.; Tipton, T.; Longet, S.; Carroll, M. Viral Evasion of the Complement System and Its Importance for Vaccines and Therapeutics. Front. Immunol. 2020, 11, 1450. [Google Scholar] [CrossRef]
- Totoki, Y.; Tatsuno, K.; Covington, K.R.; Ueda, H.; Creighton, C.J.; Kato, M.; Tsuji, S.; Donehower, L.A.; Slagle, B.L.; Nakamura, H.; et al. Trans-ancestry mutational landscape of hepatocellular carcinoma genomes. Nat. Genet. 2014, 46, 1267–1273. [Google Scholar] [CrossRef]
- Aicher, S.; Kakkanas, A.; Cohen, L.; Blumen, B.; Oprisan, G.; Njouom, R.; Meurs, E.F.; Mavromara, P.; Martin, A. Differential regulation of the Wnt/β-catenin pathway by hepatitis C virus recombinants expressing core from various genotypes. Sci. Rep. 2018, 8, 11185. [Google Scholar] [CrossRef]
- Daud, M.; Rana, M.A.; Husnain, T.; Ijaz, B. Modulation of Wnt signaling pathway by hepatitis B virus. Arch. Virol. 2017, 162, 2937–2947. [Google Scholar] [CrossRef]
- Kramvis, A.; Arakawa, K.; Yu, M.C.; Nogueira, R.; Stram, D.O.; Kew, M.C. Relationship of serological subtype, basic core promoter and precore mutations to genotypes/subgenotypes of hepatitis B virus. J. Med. Virol. 2008, 80, 27–46. [Google Scholar] [CrossRef]
- Tian, X.; Li, J.; Ma, Z.-M.; Zhao, C.; Wan, D.-F.; Wen, Y.-M. Role of hepatitis B surface antigen in the development of hepatocellular carcinoma: Regulation of lymphoid enhancer-binding factor 1. J. Exp. Clin. Cancer Res. 2009, 28, 58. [Google Scholar] [CrossRef]
- Elizalde, M.M.; Tadey, L.; Mammana, L.; Quarleri, J.F.; Campos, R.H.; Flichman, D.M. Biological Characterization of Hepatitis B virus Genotypes: Their Role in Viral Replication and Antigen Expression. Front. Microbiol. 2021, 12, 758613. [Google Scholar] [CrossRef]
- Sugiyama, M.; Tanaka, Y.; Kato, T.; Orito, E.; Ito, K.; Acharya, S.K.; Gish, R.G.; Kramvis, A.; Shimada, T.; Izumi, N. Influence of hepatitis B virus genotypes on the intra- and extracellular expression of viral DNA and antigens. J. Hepatol. 2006, 44, 915–924. [Google Scholar] [CrossRef]
- Porta, C.; Paglino, C.; Mosca, A. Targeting PI3K/Akt/mTOR Signaling in Cancer. Front. Oncol. 2014, 4, 64. [Google Scholar] [CrossRef]
- Matter, M.S.; Decaens, T.; Andersen, J.B.; Thorgeirsson, S.S. Targeting the mTOR pathway in hepatocellular carcinoma: Current state and future trends. J. Hepatol. 2014, 60, 855–865. [Google Scholar] [CrossRef]
- Guo, H.; Zhou, T.; Jiang, D.; Cuconati, A.; Xiao, G.H.; Block, T.M.; Guo, J.T. Regulation of hepatitis B virus replication by the phosphatidylinositol 3-kinase-akt signal transduction pathway. J. Virol. 2007, 81, 10072–10080. [Google Scholar] [CrossRef]
- Lin, Y.; Deng, W.; Pang, J.; Kemper, T.; Hu, J.; Yin, J.; Zhang, J.; Lu, M. The microRNA-99 family modulates hepatitis B virus replication by promoting IGF-1R/PI3K/Akt/mTOR/ULK1 signaling-induced autophagy. Cell. Microbiol. 2017, 19, e12709. [Google Scholar] [CrossRef]
- Wang, X.; Lin, Y.; Kemper, T.; Chen, J.; Yuan, Z.; Liu, S.; Zhu, Y.; Broering, R.; Lu, M. AMPK and Akt/mTOR signalling pathways participate in glucose-mediated regulation of hepatitis B virus replication and cellular autophagy. Cell. Microbiol. 2020, 22, e13131. [Google Scholar] [CrossRef]
- Choi, Y.M.; Lee, S.Y.; Kim, B.J. Naturally Occurring Hepatitis B Virus Mutations Leading to Endoplasmic Reticulum Stress and Their Contribution to the Progression of Hepatocellular Carcinoma. Int. J. Mol. Sci. 2019, 20, 597. [Google Scholar] [CrossRef]
- Qu, J.-L.; Qu, X.-J.; Zhao, M.-F.; Teng, Y.-E.; Zhang, Y.; Hou, K.-Z.; Jiang, Y.-H.; Yang, X.-H.; Liu, Y.-P. Gastric cancer exosomes promote tumour cell proliferation through PI3K/Akt and MAPK/ERK activation. J. Dig. Liver Dis. 2009, 41, 875–880. [Google Scholar] [CrossRef]
- Saini, K.S.; Loi, S.; de Azambuja, E.; Metzger-Filho, O.; Saini, M.L.; Ignatiadis, M.; Dancey, J.E.; Piccart-Gebhart, M.J. Targeting the PI3K/AKT/mTOR and Raf/MEK/ERK pathways in the treatment of breast cancer. Cancer Treat. Rev. 2013, 39, 935–946. [Google Scholar] [CrossRef]
- Setia, S.; Nehru, B.; Sanyal, S.N. Upregulation of MAPK/Erk and PI3K/Akt pathways in ulcerative colitis-associated colon cancer. J. Biomed. Pharmacother. 2014, 68, 1023–1029. [Google Scholar] [CrossRef]
- Stefani, C.; Miricescu, D.; Stanescu-Spinu, I.-I.; Nica, R.I.; Greabu, M.; Totan, A.R.; Jinga, M. Growth Factors, PI3K/AKT/mTOR and MAPK Signaling Pathways in Colorectal Cancer Pathogenesis: Where Are We Now? Int. J. Mol. Sci. 2021, 22, 10260. [Google Scholar] [CrossRef]
- Nürnberg, B.; Harhammer, R.; Exner, T.; Schulze, R.A.; Wieland, T. Species- and tissue-dependent diversity of G-protein beta subunit phosphorylation: Evidence for a cofactor. Biochem. J. 1996, 318 Pt 2, 717–722. [Google Scholar] [CrossRef]
- Clack, J.W.; Juhl, M.; Rice, C.A.; Li, J.; Witzmann, F.A. Proteomic analysis of transducin β-subunit structural heterogeneity. Electrophoresis 2003, 24, 3493–3499. [Google Scholar] [CrossRef]
- Thomas, P.; Pranatharthi, A.; Ross, C.; Srivastava, S. RhoC: A fascinating journey from a cytoskeletal organizer to a Cancer stem cell therapeutic target. J. Exp. Clin. Cancer Res. 2019, 38, 328. [Google Scholar] [CrossRef]
- Yonemura, S.; Hirao-Minakuchi, K.; Nishimura, Y. Rho localization in cells and tissues. Exp. Cell Res. 2004, 295, 300–314. [Google Scholar] [CrossRef]
- Wheeler, A.P.; Ridley, A.J. Why three Rho proteins? RhoA, RhoB, RhoC, and cell motility. Exp. Cell Res. 2004, 301, 43–49. [Google Scholar] [CrossRef]
- Xie, S.; Zhu, M.; Lv, G.; Geng, Y.; Chen, G.; Ma, J.; Wang, G. Overexpression of Ras Homologous C (RhoC) Induces Malignant Transformation of Hepatocytes In Vitro and in Nude Mouse Xenografts. PLoS ONE 2013, 8, e54493. [Google Scholar] [CrossRef]
- Chen, R.; Cui, J.; Xu, C.; Xue, T.; Guo, K.; Gao, D.; Liu, Y.; Ye, S.; Ren, Z. The significance of MMP-9 over MMP-2 in HCC invasiveness and recurrence of hepatocellular carcinoma after curative resection. Ann. Surg. Oncol. 2012, 19, 375–384. [Google Scholar] [CrossRef] [PubMed]
- Dou, C.-Y.; Cao, C.-J.; Wang, Z.; Zhang, R.-H.; Huang, L.L.; Lian, J.-Y.; Xie, W.-L.; Wang, L.-T. EFEMP1 inhibits migration of hepatocellular carcinoma by regulating MMP2 and MMP9 via ERK1/2 activity. Oncol. Rep. 2016, 35, 3489–3495. [Google Scholar] [CrossRef]
- Wang, L.; Zhang, Z.G.; Zhang, R.L.; Gregg, S.R.; Hozeska-Solgot, A.; LeTourneau, Y.; Wang, Y.; Chopp, M. Matrix metalloproteinase 2 (MMP2) and MMP9 secreted by erythropoietin-activated endothelial cells promote neural progenitor cell migration. J. Neurosci. Off. J. Soc. Neurosci. 2006, 26, 5996–6003. [Google Scholar] [CrossRef]
- Yang, H.; Liang, J.; Zhou, J.; Mi, J.; Ma, K.; Fan, Y.; Ning, J.; Wang, C.; Wei, X.; Li, E. Knockdown of RHOC by shRNA suppresses invasion and migration of cholangiocellular carcinoma cells via inhibition of MMP2, MMP3, MMP9 and epithelial-mesenchymal transition. Mol. Med. Rep. 2016, 13, 5255–5261. [Google Scholar] [CrossRef]
- Liao, C.-G.; Kong, L.-M.; Zhou, P.; Yang, X.-L.; Huang, J.-G.; Zhang, H.-L.; Lu, N. miR-10b is overexpressed in hepatocellular carcinoma and promotes cell proliferation, migration and invasion through RhoC, uPAR and MMPs. J. Transl. Med. 2014, 12, 234. [Google Scholar] [CrossRef]
- Wose Kinge, C.N.; Bhoola, N.H.; Kramvis, A. In Vitro Systems for Studying Different Genotypes/Sub-Genotypes of Hepatitis B Virus: Strengths and Limitations. Viruses 2020, 12, 353. [Google Scholar] [CrossRef]


| Gene | Direction | Sequence |
|---|---|---|
| RHOC | F | 5′-TCCTCATCGTCTTCAGCAAG-3 |
| R | 5′-CTGCAATCCGAAAGAAGCTG-3′ | |
| Rap2B | F | 5′-TTACCGCAAGGAGATTGAG-3′ |
| R | 5′-GGCTGTAGACCAGGATGAAG-3′ | |
| GNB1 | F | 5′-TGCTTGGAGAGTGTGGGCTTCT-3′ |
| R | 5′-TGGAGGGCATCTCCAGAATCTG-3′ | |
| GAPDH | F | 5′-GAAGGTGAAGGTCGGAGT-3′ |
| R | 5′-GAAGATGGTGATGGGATTTC-3′ |
| Expression | (Sub)genotype | Mean AVG log2 Expression | AVG log2 Range | Mean p-Value | % of DEPs |
|---|---|---|---|---|---|
| Upregulated | A1 | 0.90 | 0.58–1.98 | 0.0073764 | 72 |
| A2 | 0.91 | 0.58–2.26 | 0.0027466 | 63 | |
| D3 | 0.85 | 0.58–2.11 | 0.0032396 | 63 | |
| E | 0.87 | 0.58–2.71 | 0.0030094 | 62 | |
| Downregulated | A1 | −0.89 | −0.58–−2.18 | 0.0150298 | 28 |
| A2 | −0.92 | −0.58–−2.30 | 0.0040270 | 37 | |
| D3 | −0.84 | −0.58–−2.21 | 0.0070993 | 37 | |
| E | −0.86 | −0.58–−2.45 | 0.0099477 | 38 |
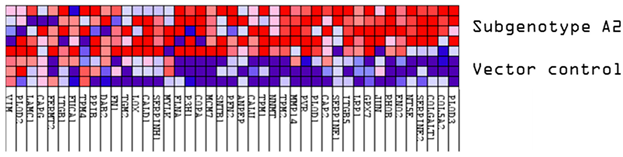
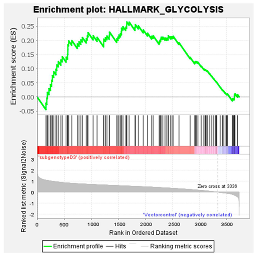
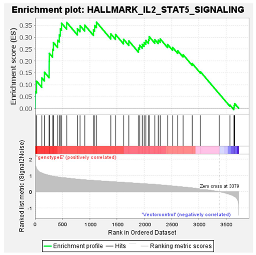
| (Sub)genotypes | Top Exclusive Dysregulated Oncogenic Pathway Compared to the Vector Control | |
|---|---|---|
 |  |  |
 |  |  |
 |  |  |
 |  | 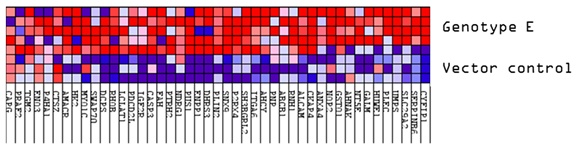 |
| Expression | (Sub)genotype/Control | Mean AVG log2 Expression | Mean AVG log2 Range | Mean p-Value |
|---|---|---|---|---|
| Upregulated | VC | 1.10 | 0.59–1.66 | 0.0074896 |
| A2 | 1.40 | 0.64–2.92 | 0.0038629 | |
| D3 | 1.40 | 0.61–2.45 | 0.0045624 | |
| E | 1.73 | 0.60–2.77 | 0.0083334 | |
| Downregulated | VC | −0.82 | −0.60–−1.62 | 0.0159729 |
| A2 | −1.18 | −0.59–−2.12 | 0.0044853 | |
| D3 | −1.00 | −0.61–−2.26 | 0.0042862 | |
| E | −1.11 | −0.60–−1.92 | 0.0066141 |
Disclaimer/Publisher’s Note: The statements, opinions and data contained in all publications are solely those of the individual author(s) and contributor(s) and not of MDPI and/or the editor(s). MDPI and/or the editor(s) disclaim responsibility for any injury to people or property resulting from any ideas, methods, instructions or products referred to in the content. |
© 2024 by the authors. Licensee MDPI, Basel, Switzerland. This article is an open access article distributed under the terms and conditions of the Creative Commons Attribution (CC BY) license (https://creativecommons.org/licenses/by/4.0/).
Share and Cite
Padarath, K.; Deroubaix, A.; Naicker, P.; Stoychev, S.; Kramvis, A. Comparative Proteomic Analysis of Huh7 Cells Transfected with Sub-Saharan African Hepatitis B Virus (Sub)genotypes Reveals Potential Oncogenic Factors. Viruses 2024, 16, 1052. https://doi.org/10.3390/v16071052
Padarath K, Deroubaix A, Naicker P, Stoychev S, Kramvis A. Comparative Proteomic Analysis of Huh7 Cells Transfected with Sub-Saharan African Hepatitis B Virus (Sub)genotypes Reveals Potential Oncogenic Factors. Viruses. 2024; 16(7):1052. https://doi.org/10.3390/v16071052
Chicago/Turabian StylePadarath, Kiyasha, Aurélie Deroubaix, Previn Naicker, Stoyan Stoychev, and Anna Kramvis. 2024. "Comparative Proteomic Analysis of Huh7 Cells Transfected with Sub-Saharan African Hepatitis B Virus (Sub)genotypes Reveals Potential Oncogenic Factors" Viruses 16, no. 7: 1052. https://doi.org/10.3390/v16071052