
A Marek’s Disease Virus Messenger RNA-Based Vaccine Modulates Local and Systemic Immune Responses in Chickens
 , , ,
, , ,
Abstract
:1. Introduction
2. Materials and Methods
2.1. Plasmids and Cloning
2.2. mRNA Synthesis and Purification
2.3. Lipid Nanoparticle Preparation and Characterization
2.4. Cell Culture
2.5. Experimental Animals
2.6. Experimental Design
2.7. RNA Extraction and cDNA Synthesis
2.8. Real-Time PCR
2.9. Statistical Analysis
3. Results
3.1. Detection of mRNA Molecules Encoding gB and pp38 in DF1 Cells
3.2. Detection of mRNA Molecules Encoding gB and pp38 at the Site of Injection
3.3. Expression of Cytokine Genes and Interferon-Stimulated Genes (ISGs) after Administration of mRNA Molecules Encoding MDV gB and pp38 Proteins
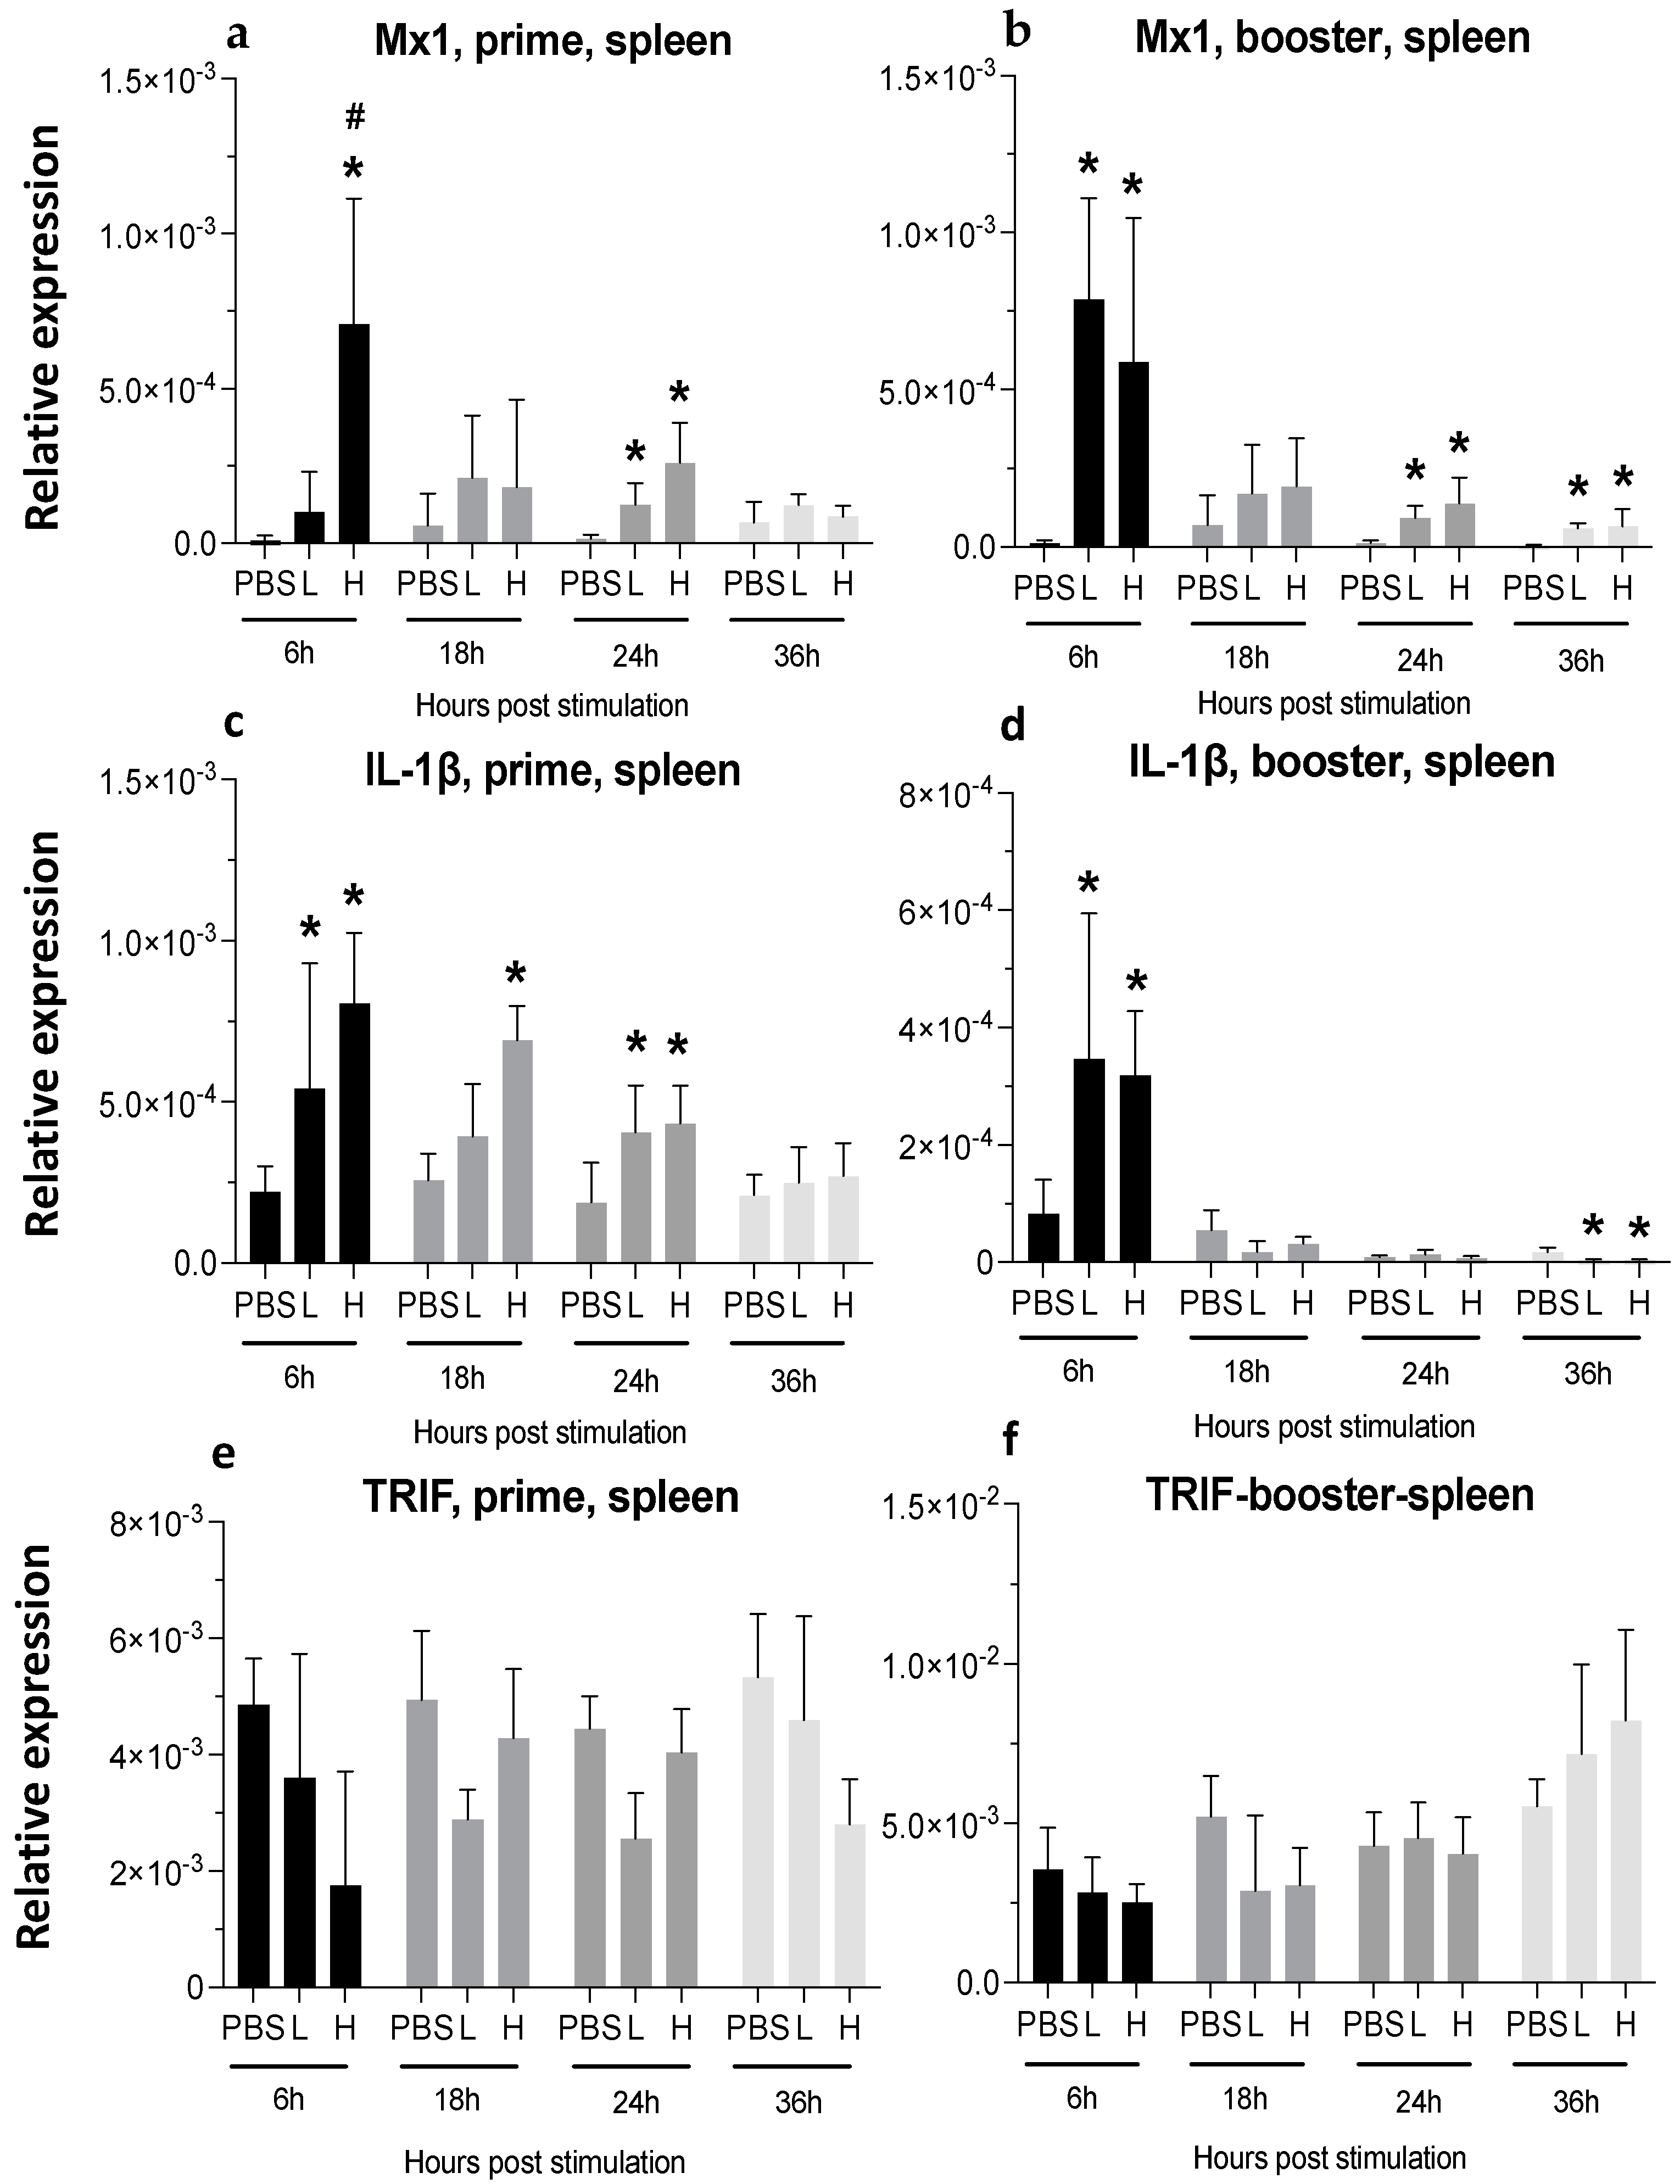
3.3.1. Spleen
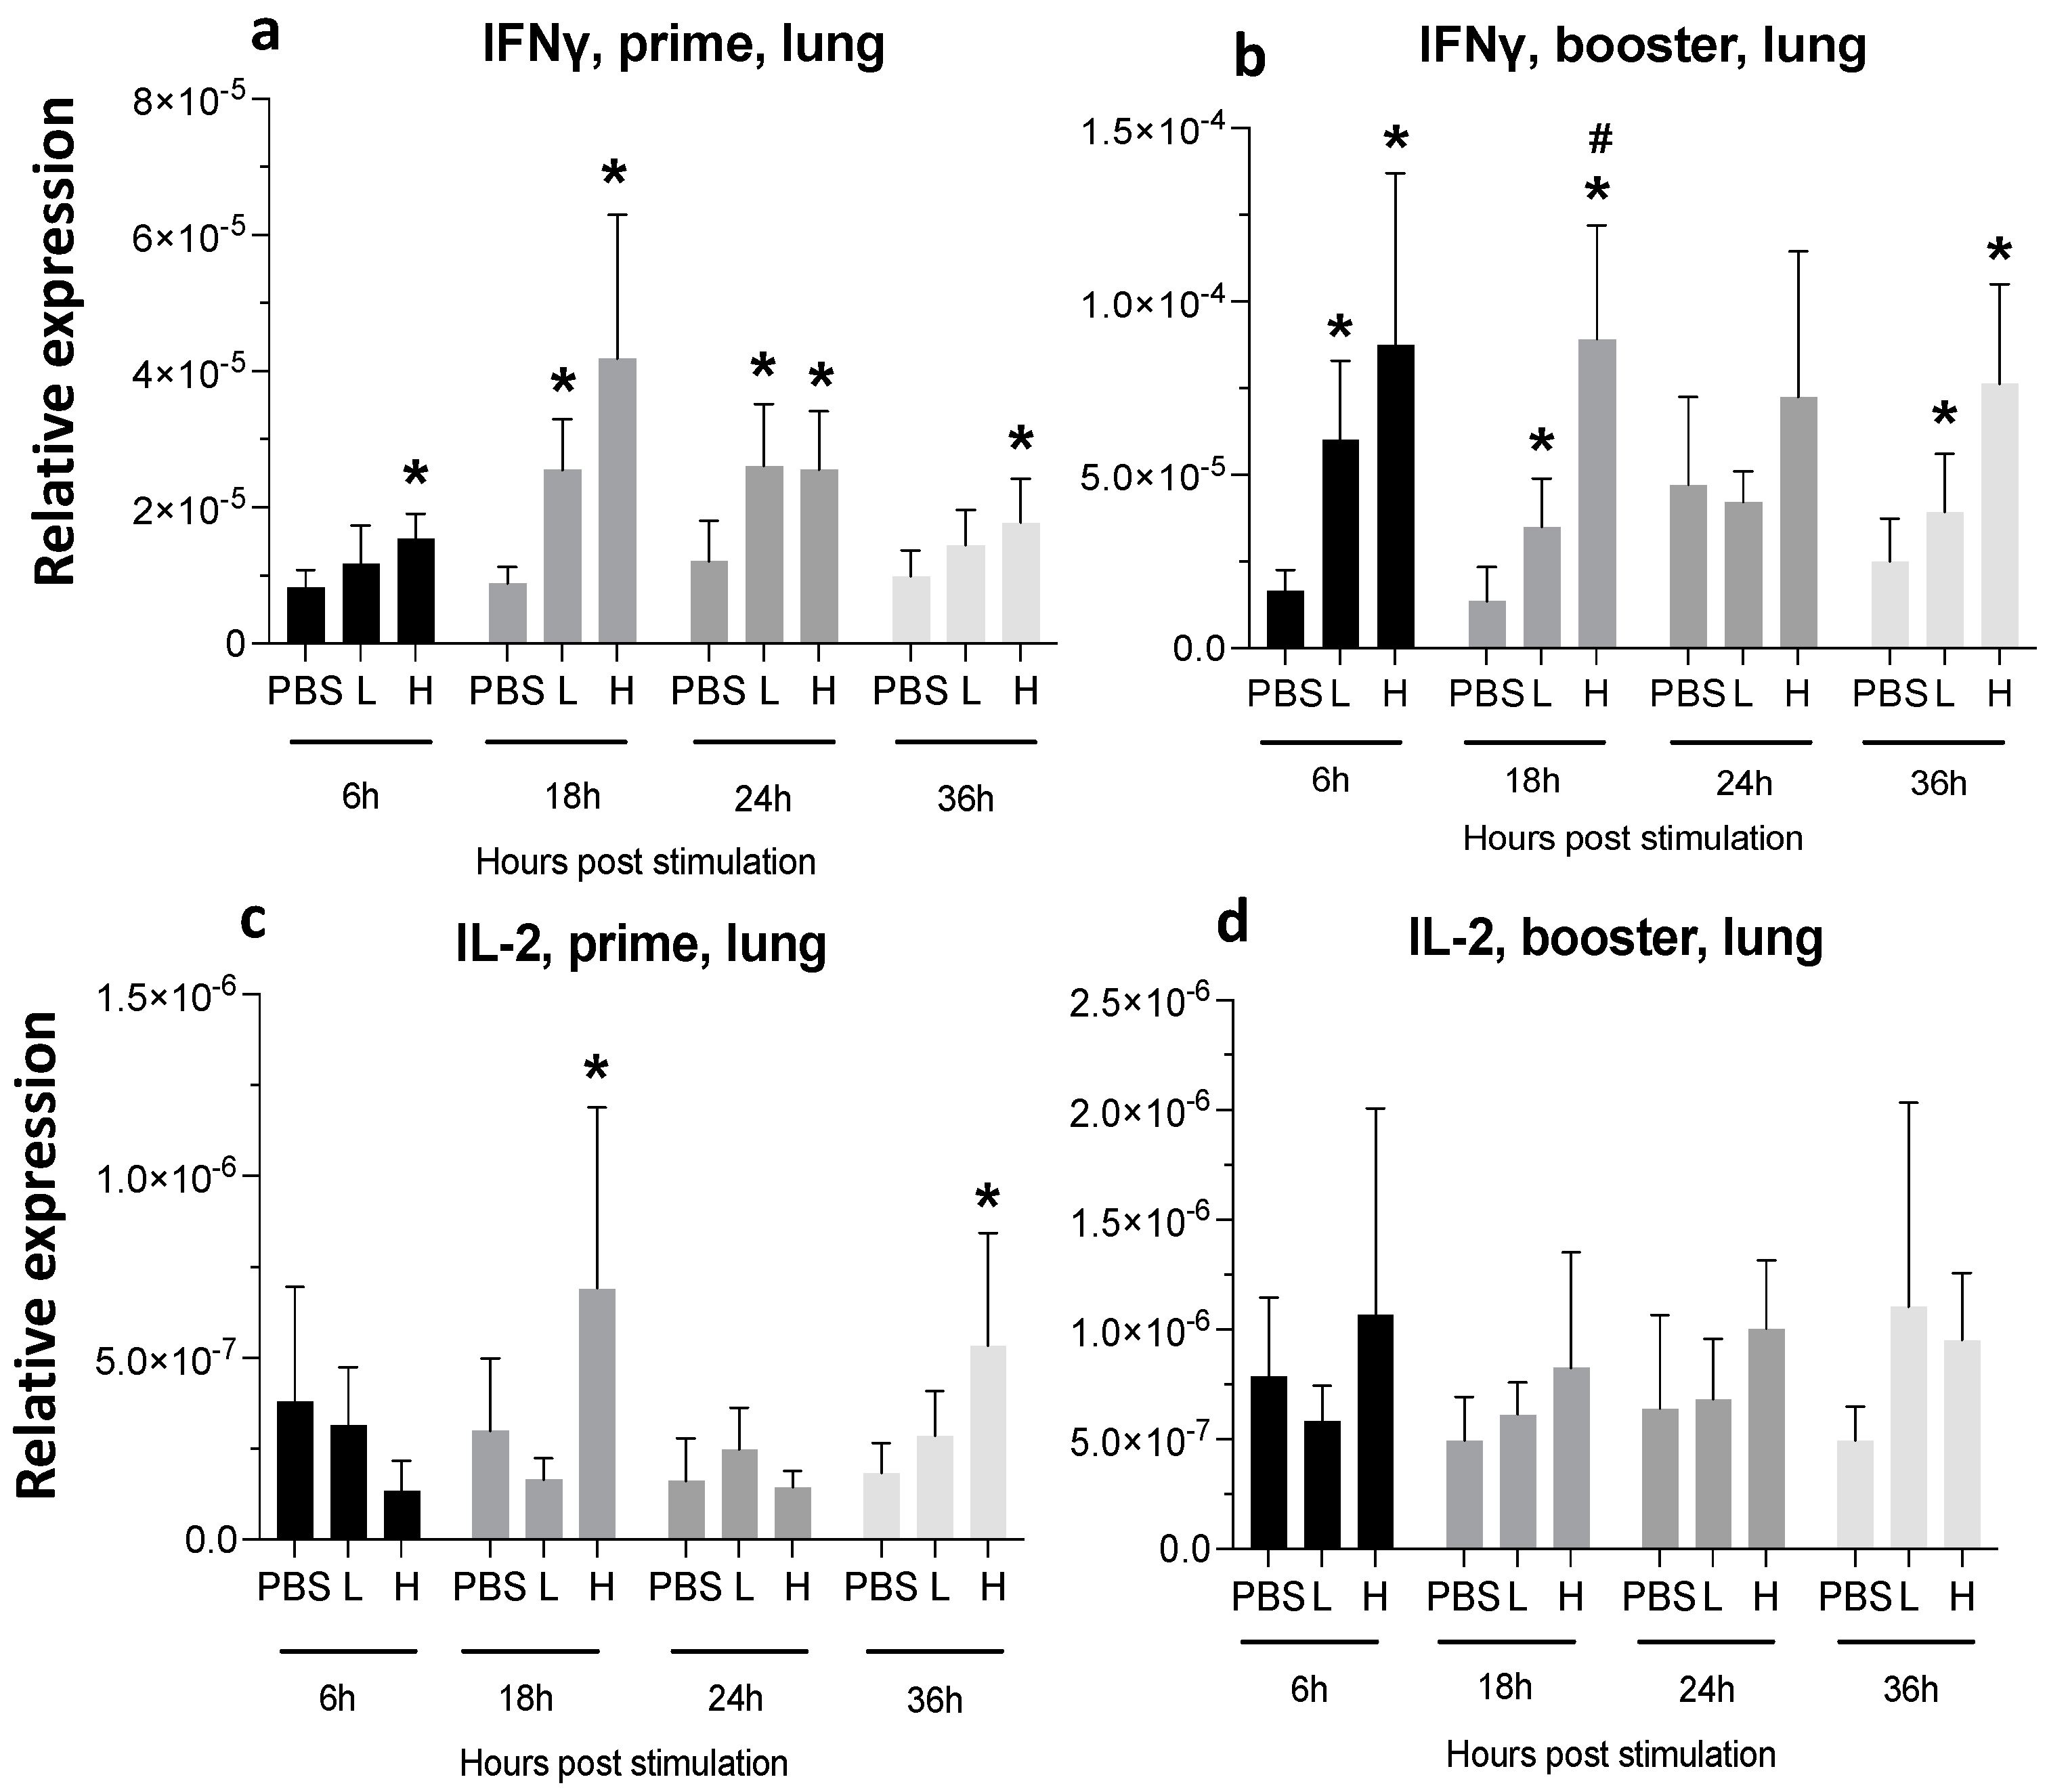
3.3.2. Lungs
4. Discussion
Author Contributions
Funding
Institutional Review Board Statement
Informed Consent Statement
Data Availability Statement
Acknowledgments
Conflicts of Interest
References
- Boodhoo, N.; Gurung, A.; Sharif, S.; Behboudi, S. Marek’s Disease in Chickens: A Review with Focus on Immunology. Vet. Res. 2016, 47, 119. [Google Scholar] [CrossRef] [PubMed]
- Bertzbach, L.D.; Conradie, A.M.; You, Y.; Kaufer, B.B. Latest Insights into Marek’s Disease Virus Pathogenesis and Tumorigenesis. Cancers 2020, 12, 647. [Google Scholar] [CrossRef] [PubMed]
- Schat, K.A. History of the First-Generation Marek’s Disease Vaccines the Science and Little-Known. Avian Dis. 2016, 60, 715–724. [Google Scholar] [CrossRef] [PubMed]
- Witter, R.L.; Lee, L.F. Polyvalent Maker’s Disease Vaccines: Safety, Efficacy and Protective Synergism in Chickens with Maternal Antibodies. Avian Pathol. 1984, 13, 75–92. [Google Scholar] [CrossRef] [PubMed]
- Rispens, B.H.; Vloten, H.V.; Mastenbroek, N.; Maas, H.J.L.; Schat, K.A.; Diseases, S.A.; Apr, D. Control of Marek’s Disease in the Netherlands. I. Isolation of an Avirulent Marek’s Disease Virus (Strain CVI 988) and Its Use in Laboratory Vaccination Trials. Avian Dis. 1972, 16, 108–125. [Google Scholar] [CrossRef] [PubMed]
- Omar, A.R.; Schat, K.A. Syngeneic Marek’s Disease Virus (MDV) -Specific Cell-Mediated Immune Responses against Immediate Early, Late, and Unique MDV Proteins. Virology 1996, 222, 87–99. [Google Scholar] [CrossRef] [PubMed]
- Cui, Z.; Lucy, F.L.; Liu, J.-L.; Hsing-Jien, A. Structural Analysis and Transcriptional Mapping of the Marek’s Disease Virus Gene Encoding Pp38, an Antigen Associated with Transformed Cells. J. Virol. 1991, 65, 6509–6515. [Google Scholar] [CrossRef] [PubMed]
- Markowski-grimsrud, C.J.; Schat, K.A. Cytotoxic T Lymphocyte Responses to Marek’s Disease Herpesvirus-Encoded Glycoproteins. Vet. Immunol. Immunopathol. 2002, 90, 133–144. [Google Scholar] [CrossRef]
- Boodhoo, N.; Behboudi, S. Differential Virus-Specific IFN-Gamma Producing T Cell Responses to Marek’s Disease Virus in Chickens with B19 and B21 MHC Haplotypes. Front. Immunol. 2022, 12, 784359. [Google Scholar] [CrossRef]
- Jiang, Z.; Zhu, L.; Cai, Y.; Yan, J.; Fan, Y.; Lv, W.; Gong, S.; Yin, X.; Yang, X.; Sun, X.; et al. Immunogenicity and Protective Efficacy Induced by an mRNA Vaccine Encoding gD Antigen against Pseudorabies Virus Infection. Vet. Microbiol. 2020, 251, 108886. [Google Scholar] [CrossRef]
- Hajam, I.A.; Senevirathne, A.; Hewawaduge, C.; Kim, J.; Lee, J.H. Intranasally Administered Protein Coated Chitosan Nanoparticles Encapsulating Influenza H9N2 HA2 and M2e mRNA Molecules Elicit Protective Immunity against Avian Influenza Viruses in Chickens. Vet. Res. 2020, 51, 37. [Google Scholar] [CrossRef] [PubMed]
- Pulido, M.R.; Sobrino, F.; Sa, M. Attenuated Foot-and-Mouth Disease Virus RNA Carrying a Deletion in the 3′ Noncoding Region Can Elicit Immunity in Swine. J. Virol. 2009, 83, 3475–3485. [Google Scholar] [CrossRef] [PubMed]
- Nelson, C.S.; Jenks, J.A.; Pardi, N.; Goodwin, M.; Roark, H.; Edwards, W.; McLellan, J.S.; Pollara, J.; Weissman, D.; Permar, S.R. HCMV Glycoprotein B Nucleoside-Modified mRNA Vaccine Elicits Antibody Responses with Greater Durability and Breadth than MF59-Adjuvanted gB Protein Immunization. bioRxiv 2019, 94, 797894. [Google Scholar] [CrossRef]
- Awasthi, S.; Friedman, H.M. An mRNA Vaccine to Prevent Genital Herpes. Transl. Res. 2022, 242, 56–65. [Google Scholar] [CrossRef] [PubMed]
- Egan, K.P.; Hook, L.M.; Naughton, A.; Pardi, N.; Awasthi, S.; Cohen, G.H.; Weissman, D.; Friedman, H.M. An HSV-2 Nucleoside-Modified mRNA Genital Herpes Vaccine Containing Glycoproteins gC, gD, and gE Protects Mice against HSV-1 Genital Lesions and Latent Infection. PLoS Pathog. 2020, 16, e1008795. [Google Scholar] [CrossRef] [PubMed]
- Xu, S.; Zhang, B.; Yao, J.; Ruan, W. A New H9 Influenza Virus mRNA Vaccine Elicits Robust Protective Immunity against Infection. Vaccine 2023, 41, 2905–2913. [Google Scholar] [CrossRef] [PubMed]
- Fazel, F.; Matsuyama-Kato, A.; Alizadeh, M.; Boodhoo, N.; Sharif, S. Efficacy and Tolerability of an mRNA Vaccine Expressing gB and Pp38 Antigens of Marek’s Disease Virus in Chickens. Virology 2024, 590, 109970. [Google Scholar] [CrossRef] [PubMed]
- Fazel, F. Efficacy and Tolerability of an mRNA Vaccine Expressing gB and Pp38 Antigens of Marek’s Disease Virus in Chickens. Master’s Thesis, University of Guelph, Guelph, ON, Canada, 2023. [Google Scholar]
- Gautam, A.; Kumar, R.; Dimitrov, G.; Hoke, A.; Hammamieh, R.; Jett, M. Identification of Extracellular miRNA in Archived Serum Samples by Next-Generation Sequencing from RNA Extracted Using Multiple Methods. Mol. Biol. Rep. 2016, 43, 1165–1178. [Google Scholar] [CrossRef]
- Cheng, X.; Lee, R.J. The Role of Helper Lipids in Lipid Nanoparticles (LNPs) Designed for Oligonucleotide Delivery. Adv. Drug Deliv. Rev. 2016, 99, 129–137. [Google Scholar] [CrossRef]
- Abdul-Careem, M.F.; Hunter, B.D.; Sarson, A.J.; Mayameei, A.; Zhou, H.; Sharif, S. Marek’s Disease Virus-Induced Transient Paralysis Is Associated with Cytokine Gene Expression in the Nervous System. Viral Immunol. 2006, 9, 167–176. [Google Scholar] [CrossRef]
- Barjesteh, N.; Behboudi, S.; Brisbin, J.T.; Villanueva, A.I.; Nagy, É.; Sharif, S. TLR Ligands Induce Antiviral Responses in Chicken Macrophages. PLoS ONE 2014, 9, e105713. [Google Scholar] [CrossRef] [PubMed]
- Villanueva, E.; Yalavarthi, S.; Berthier, C.C.; Hodgin, J.B.; Khandpur, R.; Lin, A.M.; Rubin, C.J.; Zhao, W.; Olsen, S.H.; Klinker, M.; et al. Netting Neutrophils Induce Endothelial Damage, Infiltrate Tissues, and Expose Immunostimulatory Molecules in Systemic Lupus Erythematosus. J. Immunol. 2011, 187, 538–552. [Google Scholar] [CrossRef] [PubMed]
- Bavananthasivam, J.; Kulkarni, R.R.; Read, L.; Sharif, S. Reduction of Marek’s Disease Virus Infection by Toll-Like Receptor Ligands in Chicken Embryo Fibroblast Cells. Viral Immunol. 2018, 31, 389–396. [Google Scholar] [CrossRef] [PubMed]
- Barjesteh, N.; Shojadoost, B.; Brisbin, J.T.; Emam, M.; Hodgins, D.C.; Nagy, É.; Sharif, S. Reduction of Avian Influenza Virus Shedding by Administration of Toll-like Receptor Ligands to Chickens. Vaccine 2015, 33, 4843–4849. [Google Scholar] [CrossRef] [PubMed]
- Villanueva, A.I.; Kulkarni, R.R.; Sharif, S. Synthetic Double-Stranded RNA Oligonucleotides Are Immunostimulatory for Chicken Spleen Cells. Dev. Comp. Immunol. 2011, 35, 28–34. [Google Scholar] [CrossRef] [PubMed]
- Hghihghi, H.R.; Read, L.R.; Mohammadi, H.; Pei, Y.; Ursprung, C.; Nagy, É.; Behboudi, S.; Haeryfar, S.M.M.; Sharif, S. Characterization of Host Responses against a Recombinant Fowlpox Virus-Vectored Vaccine Expressing the Hemagglutinin Antigen of an Avian Influenza Virus. Clin. Vaccine Immunol. 2010, 17, 454–463. [Google Scholar] [CrossRef] [PubMed]
- Heidari, M.; Zhang, H.M.; Sharif, S. Marek’s Disease Virus Induces Th-2 Activity during Cytolytic Infection. Viral Immunol. 2008, 21, 203–213. [Google Scholar] [CrossRef]
- Wang, Y.; Zhang, Z.; Luo, J.; Han, X.; Wei, Y.; Wei, X. mRNA Vaccine: A Potential Therapeutic Strategy. Mol. Cancer 2021, 20, 33. [Google Scholar] [CrossRef] [PubMed]
- Bahl, K.; Senn, J.J.; Yuzhakov, O.; Bulychev, A.; Brito, L.A.; Hassett, K.J.; Laska, M.E.; Smith, M.; Almarsson, Ö.; Thompson, J.; et al. Preclinical and Clinical Demonstration of Immunogenicity by mRNA Vaccines against H10N8 and H7N9 Influenza Viruses. Mol. Ther. 2017, 25, 1316–1327. [Google Scholar] [CrossRef]
- Edwards, D.K.; Jasny, E.; Yoon, H.; Horscroft, N.; Schanen, B.; Geter, T.; Fotin-Mleczek, M.; Petsch, B.; Wittman, V. Adjuvant Effects of a Sequence-Engineered mRNA Vaccine: Translational Profiling Demonstrates Similar Human and Murine Innate Response. J. Transl. Med. 2017, 15, 1. [Google Scholar] [CrossRef]
- Dias Junior, A.G.; Sampaio, N.G.; Rehwinkel, J. A Balancing Act: MDA5 in Antiviral Immunity and Autoinflammation. Trends Microbiol. 2019, 27, 75–85. [Google Scholar] [CrossRef] [PubMed]
- Kato, H.; Takeuchi, O.; Sato, S.; Yoneyama, M.; Yamamoto, M.; Matsui, K.; Uematsu, S.; Jung, A.; Kawai, T.; Ishii, K.J.; et al. Differential Roles of MDA5 and RIG-I Helicases in the Recognition of RNA Viruses. Nature 2006, 441, 101–105. [Google Scholar] [CrossRef]
- Tahtinen, S.; Tong, A.J.; Himmels, P.; Oh, J.; Paler-Martinez, A.; Kim, L.; Wichner, S.; Oei, Y.; McCarron, M.J.; Freund, E.C.; et al. IL-1 and IL-1ra Are Key Regulators of the Inflammatory Response to RNA Vaccines. Nat. Immunol. 2022, 23, 532–542. [Google Scholar] [CrossRef]
- Conroy, H.; Marshall, N.A.; Mills, K.H.G. TLR Ligand Suppression or Enhancement of Treg Cells? A Double-Edged Sword in Immunity to Tumours. Oncogene 2008, 27, 168–180. [Google Scholar] [CrossRef] [PubMed]
- Haq, K.; Elawadli, I.; Parvizi, P.; Mallick, A.I.; Behboudi, S.; Sharif, S. Interferon-γ Influences Immunity Elicited by Vaccines against Very Virulent Marek’s Disease Virus. Antivir. Res. 2011, 90, 218–226. [Google Scholar] [CrossRef] [PubMed]
- Bachmann, M.F.; Oxenius, A. Interleukin 2: From Immunostimulation to Immunoregulation and Back Again. EMBO Rep. 2007, 8, 1142–1148. [Google Scholar] [CrossRef]
- Ghiasi, H.; Osorio, Y.; Perng, G.-C.; Nesburn, A.B.; Wechsler, S.L. Overexpression of Interleukin-2 by a Recombinant Herpes Simplex Virus Type 1 Attenuates Pathogenicity and Enhances Antiviral Immunity. J. Virol. 2002, 76, 9069–9078. [Google Scholar] [CrossRef]
- Stepaniak, J.A.; Shuster, J.E.; Hu, W.; Sundick, R.S. Production and In Vitro Characterization of Recombinant Chicken Interleukin-2. J. Interferon Cytokine Res. 1999, 19, 515–526. [Google Scholar] [CrossRef] [PubMed]
- Staeheli, P.; Puehler, F.; Schneider, K.; Göbel, T.W.; Kaspers, B. Cytokines of Birds: Conserved Functions—A Largely Different Look. J. Interferon Cytokine Res. 2001, 21, 993–1010. [Google Scholar] [CrossRef]
- Susta, L.; Diel, D.G.; Courtney, S.; Cardenas-Garcia, S.; Sundick, R.S.; Miller, P.J.; Brown, C.C.; Afonso, C.L. Expression of Chicken Interleukin-2 by a Highly Virulent Strain of Newcastle Disease Virus Leads to Decreased Systemic Viral Load but Does Not Significantly Affect Mortality in Chickens. Virol. J. 2015, 12, 122. [Google Scholar] [CrossRef]
- Zang, J.; Yin, Y.; Xu, S.; Qiao, W.; Liu, Q.; Lavillette, D.; Zhang, C.; Wang, H.; Huang, Z. Neutralizing Potency of Prototype and Omicron RBD mRNA Vaccines against Omicron Variant. Front. Immunol. 2022, 13, 908478. [Google Scholar] [CrossRef] [PubMed]
- Somroop, S.; Tongtawe, P.; Chaisri, U.; Tapchaisri, P.; Chongsa-nguan, M.; Srimanote, P.; Chaicumpa, W. Traffic of Antibody-Secreting Cells after Immunization with a Liposome-Associated, CpG-ODN-Adjuvanted Oral Cholera Vaccine. Asian Pac. J. Allergy Immunol. 2006, 24, 229. [Google Scholar] [PubMed]
- Sebastiani, F.; Arteta, M.Y.; Lerche, M.; Porcar, L.; Lang, C.; Bragg, R.A.; Elmore, C.S.; Krishnamurthy, V.R.; Russell, R.A.; Darwish, T.; et al. Apolipoprotein E Binding Drives Structural and Compositional Rearrangement of mRNA-Containing Lipid Nanoparticles. ACS Nano 2021, 15, 6709–6722. [Google Scholar] [CrossRef] [PubMed]
- Reese, S.; Dalamani, G.; Kaspers, B. The Avian Lung-Associated Immune System: A Review. Vet. Res. 2006, 37, 311–324. [Google Scholar] [CrossRef] [PubMed]
- Gordon, E.M.; Yao, X.; Xu, H.; Karkowsky, W.; Kaler, M.; Kalchiem-Dekel, O.; Barochia, A.V.; Gao, M.; Keeran, K.J.; Jeffries, K.R.; et al. Apolipoprotein E Is a Concentration-Dependent Pulmonary Danger Signal That Activates the NLRP3 Inflammasome and IL-1β Secretion by Bronchoalveolar Fluid Macrophages from Asthmatic Subjects. J. Allergy Clin. Immunol. 2019, 144, 426–441.e3. [Google Scholar] [CrossRef] [PubMed]
- Sun, G.; Zhou, L.; Zhang, Y.; Zhang, F.; Yu, Z.; Pan, Q.; Gao, L.; Li, K.; Wang, Y.; Cui, H.; et al. Differential Expression of Type I Interferon mRNA and Protein Levels Induced by Virulent Marek’s Disease Virus Infection in Chickens. Vet. Immunol. Immunopathol. 2019, 212, 15–22. [Google Scholar] [CrossRef]
- Haq, K.; Wooton, S.K.; Barjesteh, N.; Golovan, S.; Bendall, A.; Sharif, S. Effects of Interferon-γ Knockdown on Vaccine-Induced Immunity against Marek’s Disease in Chickens. Can. J. Vet. Res. 2015, 79, 1–7. [Google Scholar]


| Gene | Primer Sequence | Accession Number/ Reference |
|---|---|---|
| ß-actin | F:5′-CAACACAGTGCTGTCTGGTGGTA-3′ R: 5′-ATCGTACTCCTGCTTGCTGATCC-3′ | X00182 |
| IFN-γ | F: 5′-ACACTGACAAGTCAAAGCCGCACA-3′ R: 5′-AGTCGTTCATCGGGAGCTTGGC-3′ | X99774 |
| IFN-α | F: 5′-ATCCTGCTGCTCACGCTCCTTCT-3′ R: 5′-GGTGTTGCTGGTGTCCAGGATG-3′ | [22] |
| IFN-β | F: 5′-GCCTCCAGCTCCTTCAGAATACG-3′ R: 5′-CTGGATCTGGTTGAGGAGGCTGT-3′ | [23] |
| IL-2 | F: 5′-TGC AGT GTT ACC TGG GAG AAG TGG T-3′ R: 5′-ACT TCC GGT GTG ATT TAG ACC CGT-3′ | NM_204153.1 |
| IL-1β | F: 5′-GTGAGGCTCAACATTGCGCTGTA-3′ R: 5′-TGTCCAGGCGGTAGAAGATGAAG-3′ | [24] |
| MDA-5 | F: 5′-GCAAAACCAGCACTGAATGGG-3′ R: 5′-CGTAAATGCTGTTCCACTAACGG-3′ | [25] |
| MyD88 | F: 5′-AGCGTGGAGGAGGACTGCAAGAAG-3′ R: 5′-CCGATCAAACACACACAGCTTCAG-3′ | [26] |
| OAS | F:5′-AGAACTGCAGAAGAACTTTGTC-3′ R:5′-GCTTCAACATCTCCTTGTACC-3′ | [25] |
| PKR | F: 5′-TGGTACAGGCGTTGGTAAGAG-3′ R: 5′-GAGCACATCCGCAGGTAGAG-3′ | [25] |
| Mx1 | F: 5′-GGACTTCTGCAACGAATTG-3′ F: 5′-TCCCACAAGTTCATCTGTAAG-3′ | [24] |
| IFIT5 | F: 5′-CAGAATTTAATGCCGGCTATGC-3′ R: 5′-TGCAAGTAAAGCCAAAAGATAAGTGT-3′ | [24] |
| IRF7 | F: 5′-CTCCCCTCCTCCAAAAGCTG-3′ R: 5′-CTGGGAGCGAAGGAGGAATG-3′ | [24] |
| TRIF | F: 5′-GCTGACCAAGAACTTCCTGTGC-3′ R: 5′-AGAGTTCTCATCCA AGGCCACC-3′ | [27] |
| gB | F: 5′-CGGTGGCTTTTCTAGGTTCG-3′ R: 5′-CCAGTGGGTTCAACCGTGA-3′ | [28] |
| pp38 | F: 5′-AAGGGTGATGGGAAGGCGATAG-3′ R: 5′-GCATACCGACTTTCGTCAAGATG-3′ | [28] |
Disclaimer/Publisher’s Note: The statements, opinions and data contained in all publications are solely those of the individual author(s) and contributor(s) and not of MDPI and/or the editor(s). MDPI and/or the editor(s) disclaim responsibility for any injury to people or property resulting from any ideas, methods, instructions or products referred to in the content. |
© 2024 by the authors. Licensee MDPI, Basel, Switzerland. This article is an open access article distributed under the terms and conditions of the Creative Commons Attribution (CC BY) license (https://creativecommons.org/licenses/by/4.0/).
Share and Cite
Fazel, F.; Matsuyama-Kato, A.; Alizadeh, M.; Zheng, J.; Fletcher, C.; Gupta, B.; St-Denis, M.; Boodhoo, N.; Sharif, S. A Marek’s Disease Virus Messenger RNA-Based Vaccine Modulates Local and Systemic Immune Responses in Chickens. Viruses 2024, 16, 1156. https://doi.org/10.3390/v16071156
Fazel F, Matsuyama-Kato A, Alizadeh M, Zheng J, Fletcher C, Gupta B, St-Denis M, Boodhoo N, Sharif S. A Marek’s Disease Virus Messenger RNA-Based Vaccine Modulates Local and Systemic Immune Responses in Chickens. Viruses. 2024; 16(7):1156. https://doi.org/10.3390/v16071156
Chicago/Turabian StyleFazel, Fatemeh, Ayumi Matsuyama-Kato, Mohammadali Alizadeh, Jiayu Zheng, Charlotte Fletcher, Bhavya Gupta, Myles St-Denis, Nitish Boodhoo, and Shayan Sharif. 2024. "A Marek’s Disease Virus Messenger RNA-Based Vaccine Modulates Local and Systemic Immune Responses in Chickens" Viruses 16, no. 7: 1156. https://doi.org/10.3390/v16071156
APA StyleFazel, F., Matsuyama-Kato, A., Alizadeh, M., Zheng, J., Fletcher, C., Gupta, B., St-Denis, M., Boodhoo, N., & Sharif, S. (2024). A Marek’s Disease Virus Messenger RNA-Based Vaccine Modulates Local and Systemic Immune Responses in Chickens. Viruses, 16(7), 1156. https://doi.org/10.3390/v16071156