1. Introduction
This article is based on a paper that was presented at the 32nd Electric Vehicle Symposium in May 2019 in Lyon [
1].
There are three types of electrified vehicles, Battery electric vehicles (BEVs), running entirely on electricity, Plug in Hybrid vehicles (PHEVs) running partially on electricity and partially on fossil fuel or biofuel, and Hydrogen Fuel Cell Electric Vehicles (FCEVs), converting hydrogen to electricity in the vehicle. PHEV owners do not need fast chargers. They can continue driving using the Internal Combustion Engine when the battery is empty, and has thus no range limitations on long-distance trips. FCEVs also have somewhat limited range, but filling hydrogen is almost as fast as filling fossil fuel so that long-distance trips can be done without long stops to fill energy. This article is therefore entirely about BEVs and the use of and utility of fast chargers.
The term “relative advantage” is used in Rogers Theory of the diffusion of innovations [
2], as the sum of consumers perceived advantages and disadvantage of a new technology compared to the current technology. It is the most important factor in the diffusion of innovations according to this theory. Innovations spread when users see a relative advantage over the existing technology. User surveys of Norwegian BEV owners show that BEVs can have relative advantages over fossil fueled vehicles in areas such as acceleration, comfort, home charging and reduced energy cost, and disadvantages related to limited range and long charge times [
3,
4,
5], and a lack of sufficient charging infrastructure. There is also a trade-off between long range, cost and charge times [
4]. The cost of purchase for BEVs has been turned from a disadvantage in term of higher production cost, into an advantage in Norway due to BEVs exemption from purchase taxes, i.e., the registration tax and the Value Added Tax (VAT). The advantage increases further for the Total Cost of Ownership (TCO) due to the low cost of electricity and high cost of fossil fuel [
4], which in fact leads to a situation where Norway has the largest energy cost advantage of BEVs compared with ICEVs in Europe. The purchase taxes levied on Internal Combustion Engine Vehicles consists of a registration tax which varies with the weight of the vehicle and the CO
2- and NO
X-emissions, and a 25% VAT. Fossil fuels are levied both a road use tax element and a CO
2-tax. The overall result of this situation is that BEVs purchase price are at least on par with ICEVs and the TCO is lower [
4] in Norway. It is therefore not difficult to understand that BEVs are more popular in Norway than elsewhere in Europe where the incentives are less. The share of BEV owners that state in the user surveys that they will buy a BEV again has gone up from 88% in 2016 to 94% in 2018 [
5]. The remaining 6% in 2018 are mainly undecided. Only 15 of the 3659 respondents in 2018 said that they would not buy a BEV again [
5]. This situation is very different from that of other countries and research done elsewhere may not be relevant towards understanding the situation in Norway. Although countries such as France, Sweden, Germany and the UK, have introduced purchase bonuses for buying a BEV, the overall value of the incentives is much lower than in Norway.
Charging access and behavior are important parameters in understanding how BEVs functions in practice for BEV owners, and how these parameters influence the diffusion of BEVs. Fast chargers can make the use of BEVs easier and more flexible and can support users on long-distance trips [
3,
4,
6]. The purpose of the article is therefore to do an in-depth analysis of the use of fast chargers in Norway, based on datasets covering the majority of fast charge sessions conducted over a period of about two years in the networks of two large nationwide operators. The articles contribution to the research literature will be an enhanced understanding of the fundamental factors that influence the utility of and the demand for fast chargers, and the corresponding variability over years, weeks, days, seasons, climatic conditions and road types. This new knowledge will be useful for researchers developing models of fast charger usage and needs, and those researching the user perception of fast charging.
The article starts off in
Section 3 with a literature review of factors that can influence fast charging. Followed by an introduction to the BEV fleet and fast charger infrastructure in Norway in
Section 3.
Section 4 presents the method and datasets used in the analysis. The results of the analysis of the use of fast chargers is presented in
Section 5, followed by a discussion of the results in
Section 6. The conclusion with recommendations is in
Section 7.
2. Literature Review
BEV owners tend to charge at four locations [
3,
4,
5,
6], (1) at or near home, usually overnight, (2) at workplace or commuting locations supporting longer distance commutes, (3) at public locations, i.e., stores, shopping centers, transport terminals, parking, and (4) during stops in travel corridors, while travelling longer distances. Low cost home charging is seen as a major advantage of BEVs [
3,
5], and 93% of Norwegian BEV owners could charge at home in 2018 [
5]. The combination of limited range and long charge time is on the other hand seen as a major drawback that have limited the use of BEVs for long-distance trips [
3,
4], and given rise to the term “range anxiety”, which can be reduced by the deployment of fast chargers and other public infrastructure [
5]. Fast chargers positively influence the user perception of the relative advantage/disadvantage of BEVs compared to Internal Combustion Engine Vehicles (ICEVs), and thus support the diffusion of BEVs according to Rogers’ theory on the diffusion of innovations [
3,
7].
Fast chargers installed in areas where BEV owners live and work complement home-charging, allowing users to expand their driving range, and act as a safety net when users run out of electricity [
4,
6]. BEV owners can fill energy from fast chargers during long-distance driving and thus increase the overall radius of action. Fast charging takes more time than filling fossil fuel, and is more expensive than home charging [
4,
6,
7].
There are four technical standards for fast charging; 1) Chademo (DC), 2) CCS (DC), 3) Tesla Supercharger (DC) and 4) 43 kW AC (with the charger is in the vehicle). The characteristics of the different standards is summarized in
Table 1.
The research on fast chargers have mainly focused on the technical design of the vehicle and the integration with and interface to the electricity network [
8,
9], the needs of users [
6,
10,
11,
12], the optimum positioning and number of chargers needed to support the flow of vehicle [
6,
10,
13,
14,
15], cold/warm weather effects [
16,
17,
18,
19,
20,
21], and the use of fast chargers [
6,
10,
11]. Few have however analyzed in depth the actual usage of fast chargers at a national scale for longer time periods, based on datasets from the fast charge operators. Earlier analysis of partial datasets found that in the UK the average user charged 9.2 kWh and that the average time spent charging was 27.2 min, and in the USA, 9.3 kWh and 22.3 min [
11] and in Norway and Sweden the average fast charge session took 20.9 and 24.4 min respectively [
10]. In Japan the average fast charge time was normal distributed with a mean of 28 min [
22].
Norway has cold winters and the influence on fast charging of the ambient temperature is therefore of particular interest. The vehicle limits the power level of the fast chargers to make sure that the battery is not damaged, and to elongate the battery life [
4]. The allowed power varies with the actual battery temperature and the battery state of charge (SOC). Fast charging is slower in low ambient temperatures, as the battery’s chemical properties limits the speed of movement of ions through the battery materials [
16,
21]. The battery charge power is also limited to preserve battery life when the batteries are overheated [
17,
19], for instance due to high-speed driving in warm weather. Charging can also be slower when the SOC is very low in cold climates, due to an increase in the battery internal resistance under such conditions [
20]. Several subsequent fast charges combined with high-speed driving on a warm summer day may lead to reduced charge power in some BEV models with passive battery climate control systems, due to the battery gradually heating up [
19,
23]. A gradual heating of the battery can on the other hand at low ambient temperatures lead to an increase in the power the battery can accept during the charge session [
18]. The vehicles ability to accept fast charging while limiting battery life impact depends on the type of cooling and heating system used for the batteries [
17]. Some vehicle manufacturers do not install active thermal management systems for the batteries to reduce the cost of the total system [
4]. In these vehicles, cooling is passive, and heating may not be possible, leading to battery temperatures that are not optimum for fast charging. This may lead to slower fast charging and higher cost for using the charger, as well as increased time costs due to the charge session taking longer time. The average user experienced fast charge power can for these reasons be considerably less than the maximum rated power of the charger.
Other effects of the tough winter conditions are a 2–3% increase in driving resistance due to the use of winter tires [
24], an increased energy consumption when driving on snow or ice covered roads and in low temperature [
25], and the need to heat the cabin [
3,
4,
5,
6,
25]. The overall effect of these factors in Norway is an increase in the energy consumption in the winter of about 25% compared with the WLTP test results (up to 50% compared with NEDC test cycle), based on user assessments of the range reduction in the winter [
3,
4].
In addition to the influence of the vehicle characteristics on fast charging, comes the user influence on the fast charging process. If users charge beyond the 80% SOC limit, the charge power will be reduced rapidly as the SOC increases towards 100% [
26], which also is a strategy to preserve battery life, and keep the charging process safe. The gross battery capacity is in most cases published in the vehicle specifications, but about 5–15% of that gross will not be made available to users (author’s estimate based on test drives published on
www.elbil.no and other literature). The allowed range of Battery State of Charge for the customer, which is what is displayed in the instrument panel in the vehicle, is thus 5–15% less than the real Battery State of Charge. This customer displayed value is often called the Customer State of Charge (CSOC). This derating of the battery capacity elongate battery life by eliminating harmful overcharge and undercharge events. Fast charging at high power is possible up to 60–85% Customer State of Charge (CSOC) of the batteries, depending on vehicle model [
26]. Above that CSOC level, charging slows down towards the normal charging level of 3.6–7 kW [
26].
Fastned in the Netherlands has presented fast charging power curves of some popular BEVs, as seen in
Figure 1 [
26]. These curves are for summer temperatures, and shows at which SOC the vehicles start limiting the charge power, and how much and how fast the power is limited. In cold climates, less charge power will be available than shown in
Figure 1.
For a Leaf of the first generation with a 24-kWh battery starting to charge at 20% SOC, the average summer fast charge power could according to the Fastned charge curve be about 35 kW. It will be considerably less in the winter [
18]. A 22–36% decrease in the fast charge power at 0 °C vs 25 °C has been found for Taxis in New York City [
18], and the effect will be even larger at temperatures below 0 °C [
21]. Trentadu et al. [
21] found that the fast charge power for a specific BEV model was reduced to 4.1–4.8 kW at −25 °C and 4.3–17.6 kW at −15 °C, for different fast chargers tested in a laboratory environment when starting from 25% vehicle SOC. Above 25 °C the charge power was stable at the maximum achieved value of 38 and 47 kW depending on the charger they tested. The low power is only for the initial charge period. As the charge progresses the internal resistance of the battery will lead to an internal heating, that will gradually enable the power to increase. The internal resistance is elevated at low SOC and at low temperatures, and will be maximum below about 30% SOC at −15 °C [
20].
In the recent years the risk of charge queues has started to worry consumers [
3,
5], while the range concern has decreased due to the increased range of new BEVs [
4]. The term “charge anxiety” has therefore started to replace “range anxiety” among Norwegian BEV owners and elsewhere [
5,
27]. In a 2018 user survey, a larger share of users stated that they were stressed by charge queues, than those that said they had range anxiety [
5]. There is separate strand of research on charge queues in general [
27,
28,
29,
30,
31], and more specific areas such as how users react or adapt to charge queues [
5,
29], on how to build out fast chargers to avoid queues [
27,
29,
30,
31], and on measures to reduce queues [
27,
30]. There is also research on what users do while fast charging, and in Norway users say the use facilities at the location, they read e-mails and news, use social media, or take a stroll [
5].
3. BEVs and Fast Charging in Norway
Norway is the largest per capita BEV market in the world, with a BEV share of new vehicle sales of 41.3% in 2019 [
32]. When including second-hand vehicle imports, the total number of first time BEV registrations was 67147 in 2019 [
32]. BEVs reached a total passenger vehicle fleet share of 9.4% at the end of 2019, whilst Plug in Hybrid vehicles (PHEVs) reached 4.2%. The total share of Plug in Electric Vehicles (PEVs) thus reached 13.6% at the end of 2019 [
33].
At the end of 2017, 39% of the Norwegian BEV fleet used the Chademo DC fast charge standard, 35% used a combined charging system (CCS) and 16% used the Tesla standard [
7], as seen in
Figure 2 [
7,
34]. Another 5% of the fleet could be semi-fast or fast charged at 22 or 43 kW AC, while the final 5% of the fleet could not be fast charged [
7,
34]. The average BEV in the fleet (of all vehicles apart from Tesla) had a nominal battery size of 26 kWh at the end of 2017 [
7]. The distribution of battery sizes is shown in
Figure 2. The average non-Tesla vehicle could thus fast charge about 15.5 kWh of energy at the end of 2017, assuming a fast-chargeable State of Charge (SOC) window of 60% of the batteries nominal capacity (the lowest 20% SOC is less useful especially in the winter, and above 80% SOC the charge power ramps down fast) [
7]. The majority (88%) of these vehicles can theoretically charge at 50 kW [
7], but Fastned have published data that shows that the fast charge power for some vehicles will be much less than 50 kW, even under optimum conditions [
26], as was shown in
Figure 1. About 64% of the vehicles used a passive battery thermal management system [
7], which will not be able to keep an optimal battery temperature, which likely lead to a large reduction in practical charge power in cold [
7,
16,
17,
18,
19,
20,
21] and hot climates [
23]. In general Norway has cool summers, and temperatures above 30 °C are rare. Winters can however be quite cold, but typically lie in the range of 0 to −10 °C in and around cities where the majority of the BEV fleet is located, but can occasionally reach −20 °C in some places. In rural inland, −30 °C and even colder is possible, but rare [
7], and few people live there.
About 1000 Chademo/CCS 50 kW (Less than 2% of these chargers could deliver more than 50 kW) fast chargers were installed in Norway at the beginning of 2018, in about 500 locations [
7]. Each charger was capable of charging one vehicle at a time, either Chademo or CCS [
7]. The locations could, as shown in
Figure 3, be classified according to their facilities, location and suitability in supporting driving in ‘corridors’ [
7]. Most chargers supported corridor travel, as main roads in Norway’s mountainous landscape often follow valleys, in which where people live and economic activity takes place. The most typical locations for fast chargers are at (or next to) fuel stations and food stores, followed by shopping centers and cafés [
7]. The classifications are not mutually exclusive.
The build out of fast chargers has been supported economically by the government agencies Transnova and Enova, along with some Counties and Municipalities [
4,
35,
36,
37,
38], and led to the installation of at least two fast chargers every 50 km in all major transport corridors (with a couple of exceptions), to support long-distance driving [
4]. Fast chargers in cities are considered by Enova to be a fully commercial market [
4] and no economic support has been made available from them. The use of fast chargers typically cost 2.5–3.0 NOK/min (1 NOK = 0.100 Euro, status 07.10.2019) in 2016–2018 [
4].
5. Analysis of Fast Charger Usage
The datasets of fast charger usage from the two operators provide no information about the individual user’s vehicle type, their household, nor their living conditions or whereabouts. There are thus limits to the extent of which it is possible to investigate in detail how important the four main effects of
Figure 2 are. But by analyzing the variability of the overall use of fast chargers, and the variation in the charge session characteristics over time and space, it should be possible to assess if there is an effect or not, and which of the four effects that are important. In this section, an analysis of charger usage variability is carried out, thus laying the foundation for the overall assessment of the four effects in the discussion section.
5.1. The Overall Network―Fast Chargers in Use per BEV in the Fleet, Geography of Fast Charger Networks
The datasets from operator 1 and operator 2 have a national coverage.
Figure 5 shows the actual available number of fast chargers and locations for operators 1 and 2, based on when they first appear in the datasets, i.e., when the first charge sessions have been carried out with the chargers. Both operators invested heavily during 2017–2018 to build out national charging networks. The number of active locations for these two operators thus increased from about 110 in the start of 2016 to about 440 in the start of 2018, and the number of chargers increased to about 780, up from about 120 in the start of 2016. The number of BEVs per charger and per location of these operators is a metric on the utility for the users of these fast charger networks. The number of BEVs in the Norwegian BEV fleet per fast charger location was reduced from over 600 to about 300, and the number of BEVs per fast charger from about 500 to about 200, for the sum of the two operators during this period of time.
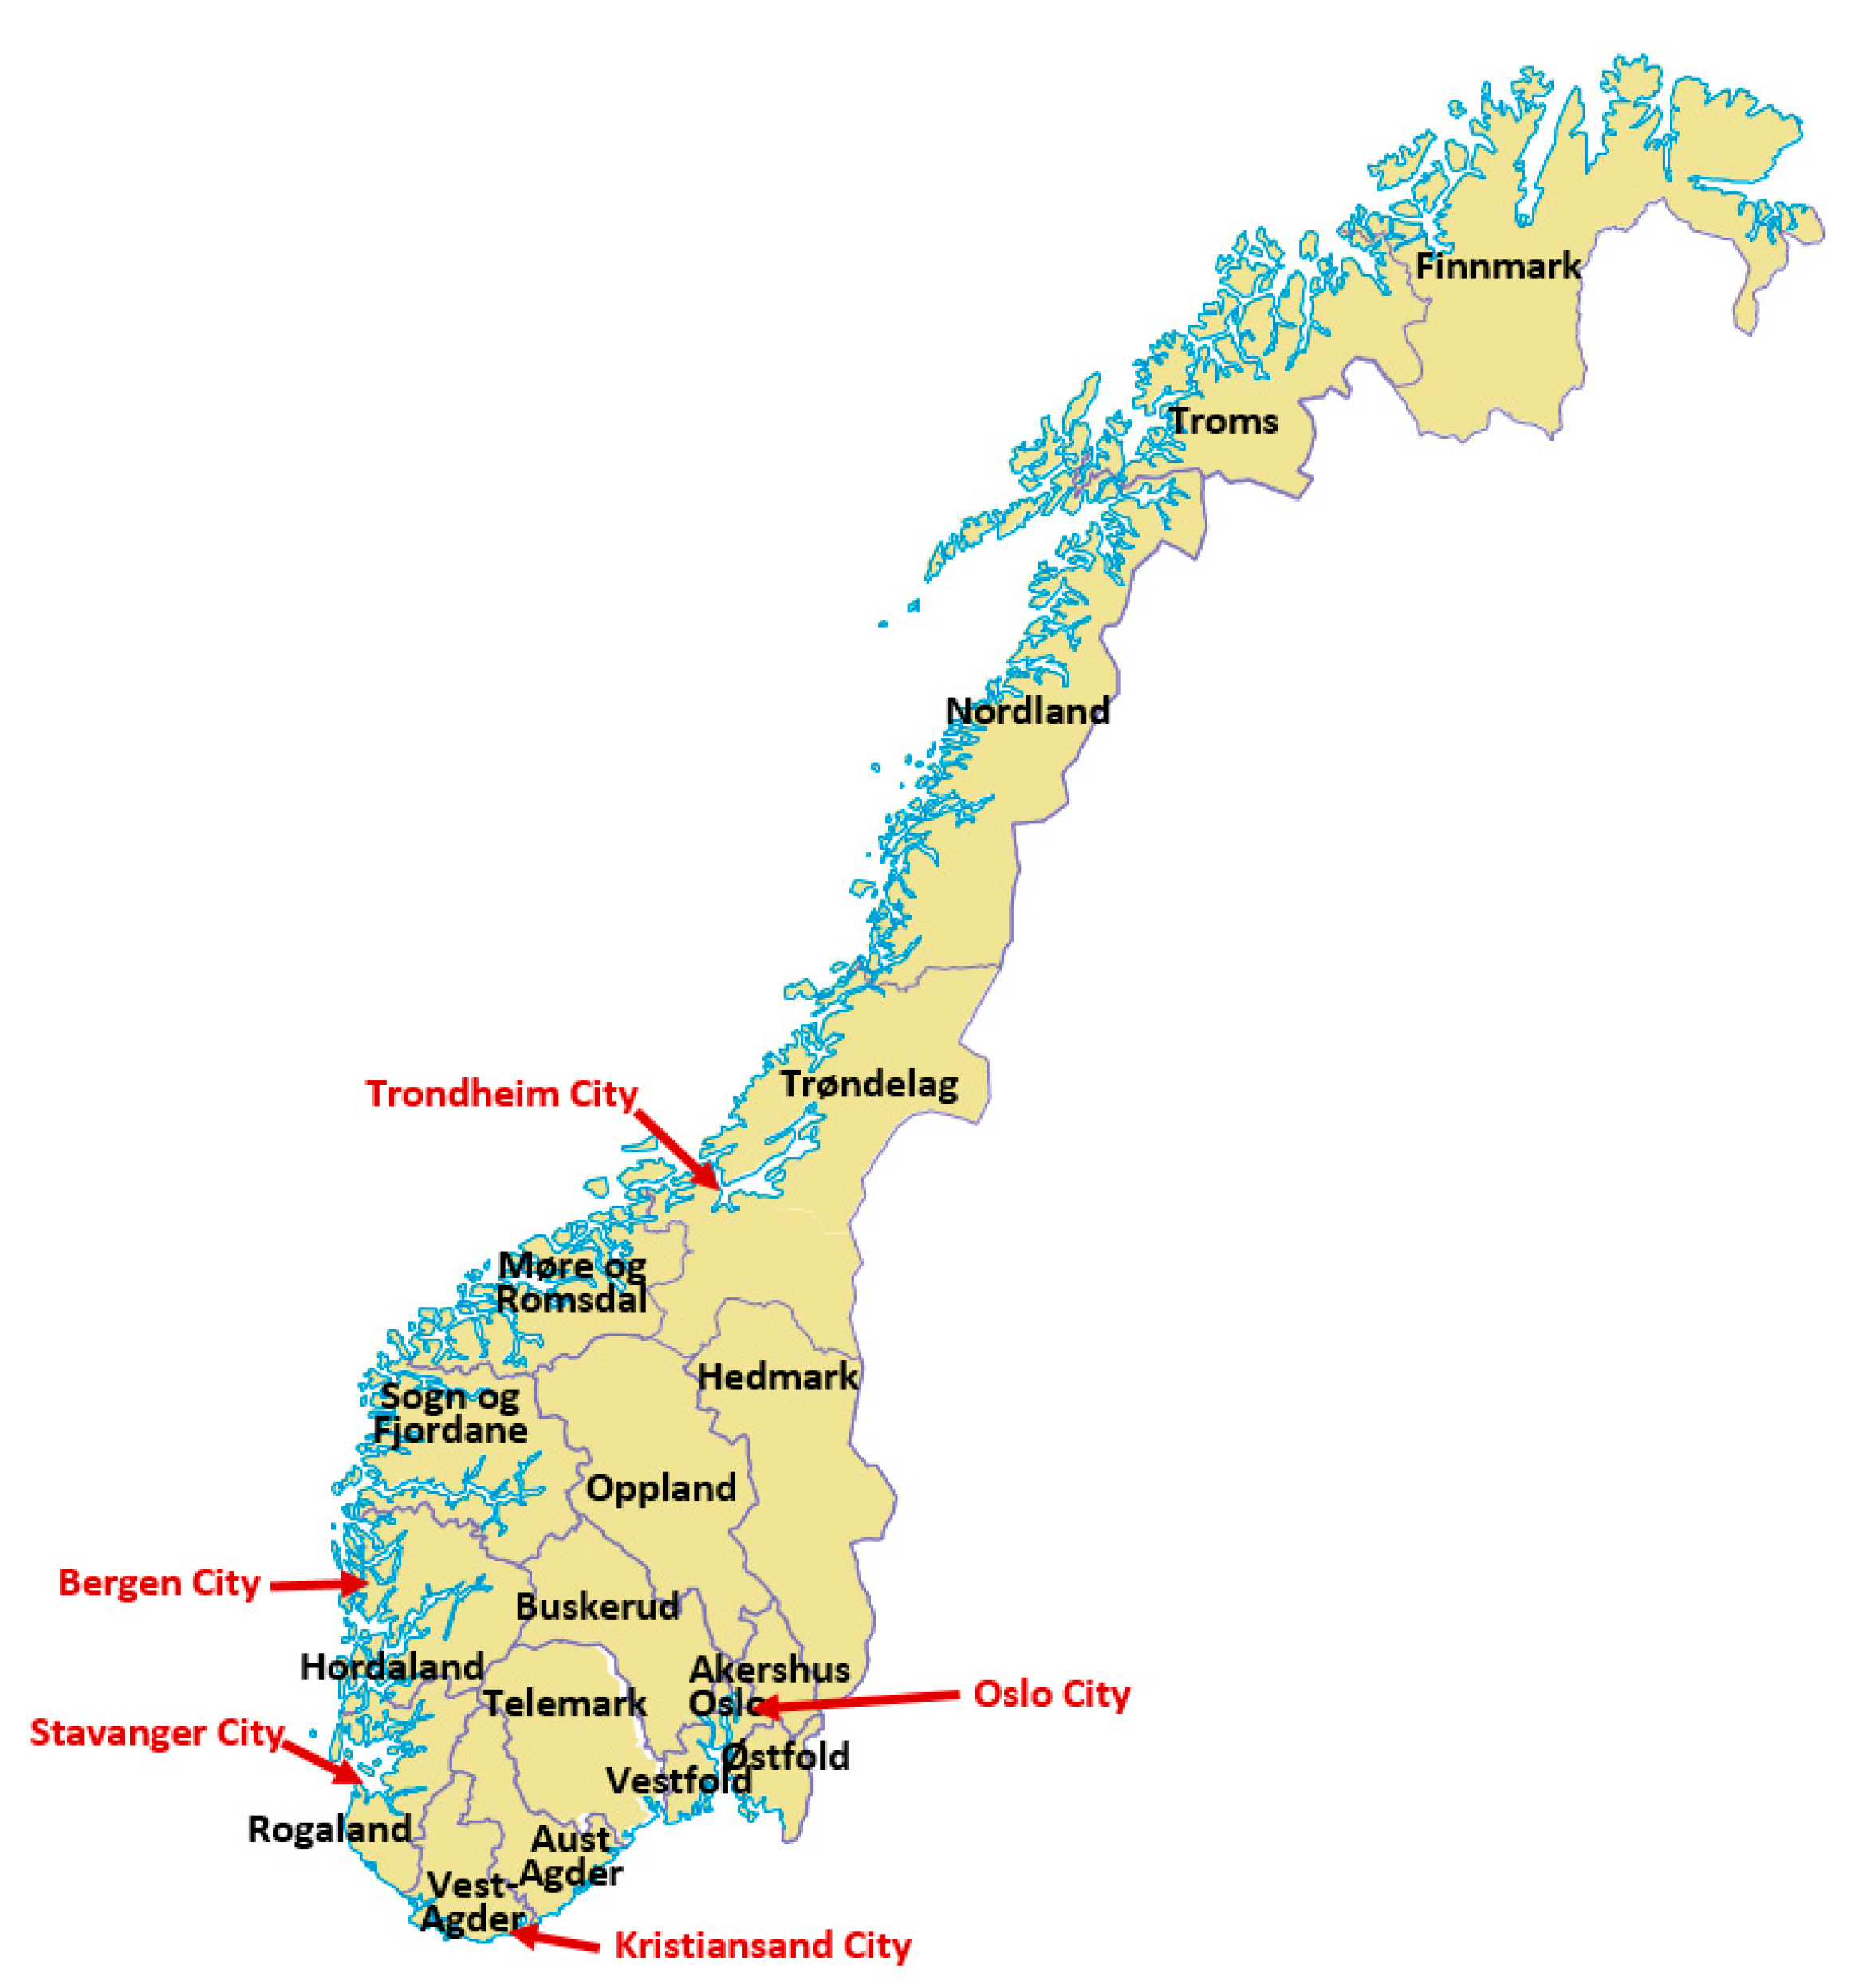
The geographical spread across Norway’s Counties (a map of Norwegian Counties is found in
Appendix A), of the networks of the two national operators and one regional operator (no charging session data was available for this operator which is large in Hordaland and Rogaland) in Q1 2018, is shown in
Figure 6. The number of BEVs per location and charger is much higher in the Oslo (City) and Akershus Counties than elsewhere. Hordaland and Rogaland are other areas with a high number of BEVs per charger and per location. These Counties are home to large cities such as Bergen and Stavanger. Oppland, Sogn og Fjordane, Hedmark and Nordland are examples of rural Counties with many fast chargers along travel corridors, but few BEVs in the fleet. This means that the number of vehicles per charger/location is low, in particular for the first two of these Counties.
5.2. Total Use of Fast Chargers
The total national use of fast chargers could not be calculated from dataset 1 and 2 as it would infringe with the authors confidentiality agreements with these operators. Therefore, the responses to the user survey, i.e., Dataset 3, was used to produce an estimate of the total use of fast chargers in Norway. The user survey data indicates that about 19 fast charges are performed on average per year by non-Tesla BEV owners [
5]. A 2016 survey indicated 13–16 fast charges per year [
3]. Using 13–19 fast charges per year as an uncertainty interval, the mid 2017 number of fast charge capable (non-Tesla) vehicles in the fleet, the average annual km driven by BEVs, and an average energy consumption (16,000 km /year, 0.2 kWh/km for a compact car when taking into account a higher energy consumption in the winter season, and 95,000 BEVs on the road [
34]), it can be calculated that fast chargers in Norway delivered 12–17 GWh of energy to BEVs in use in 2017, which can be estimated to represent about 4–6% of the overall energy consumption of these vehicles.
5.3. Regional Variation in the Use and Availability of Chargers
A relative approach enabled the visualization of the difference between the charging activity and the availability of chargers between Counties, without revealing the total volume of fast charging.
Figure 7 thus shows the distribution between the Counties of the total number of fast chargers and total fast charge sessions carried out (y-axis), for the two national operators and the largest regional operator in 2017 (the regional operator imputed as the lowest of the two other operators for each County). The County share of the total national BEV fleet is on the x-axis and the County share of the total number of fast chargers and the total number of fast charge sessions on the y-axis. If these parameters were distributed evenly as the overall fleet of passenger cars, i.e., the sum of all ICEVs, HEVs, PHEVs and BEVs, the dots would have collapsed on to the green triangles on the mid-line, i.e., Oslo would have 11% of the BEVs, 11% of the fast chargers and 11% of the fast charge sessions. This is clearly not the case.
The Counties of Oslo, Akershus and Hordaland have the largest shares of the total national BEV fleet. Their BEV fleet shares are 1.4–2 times higher than their shares of the overall vehicle fleet. Oslo and Akershus share of the number of fast chargers is however much lower than if everything was evenly distributed (red dots), resulting in a high utilization of each charger (seen by the blue dots being above the red dots). Oslo is the largest city in Norway, while Akershus County surrounds Oslo, and parts of Akershus thus constitutes a greater Oslo region. Hordaland, where Norway’s second largest city Bergen is located, is relatively well equipped with fast chargers, but also has a high demand for fast charging. More chargers are therefore likely needed in these Counties.
The two Counties with Norway’s 3rd and 4th largest cities, Trøndelag with the city of Trondheim, and Rogaland with the city of Stavanger, have a better balance between demand and availability, but Trøndelag has a relatively low utilization rate of its chargers.
Cities are now considered by Norwegian authorities to be fully commercial fast charge markets and support is directed towards rural areas and main roads between cities where commercial build out is not yet possible [
36]. Fast chargers in cities are thus mainly installed without public support. In some cases, Counties may still support the installation of fast chargers, for instance for commercial use, e.g., taxis in Oslo [
38,
39].
On the other end of the scale, Counties such as “Sogn og Fjordane”, Oppland and Nordland have a much higher share of chargers than their share of the national fleet of BEVs, and the use of each fast charger is low, as seen by the rod dots being far below the blue dots. A high share of the chargers in these Counties have been built out with public support programs aimed at establishing national travel corridors between cities. They are underutilized Mondays-Thursdays, but used for long-distance travels in the weekends and vacation periods. The latter cannot compensate for the limited local use on weekdays, and operators struggle to operate these chargers economically. The further away from cities the chargers are, the more variable the demand between weekdays and weekends will be in general [
7]. European main roads (E numbered roads such as the E18) tends however to have substantial traffic most days and times around and between major cities not too far apart [
7]. Corridor chargers in rural areas far from cities are however not yet commercially viable, but are needed to build charging networks that support long-distance travel across Norway.
When longer range BEVs enter the fleets in the coming years, it might be possible to locate fast chargers wider apart, in larger charging stations and in areas with better opportunities for local use (such as closer to cities).
5.4. Variation in Use over the Year
The total volume of minutes and kWh charged increased rapidly over the period Q1 2016-Q4 2017, due growth in the number of chargers and BEVs in each County. Nonetheless, seasonal effects in the demand for fast charging are clearly seen in the lower part of
Figure 8 for the County Oppland. The Easter period during week 15 caused large spikes in the use of fast chargers, due to people going on vacation with their BEVs. The same is true for week 40 which is a week with school vacation in Norway, in which many people travel to the mountain resorts of Oppland. The same effect is seen in the summer vacation period, the weeks 28–32. The pattern in Oppland is consistent with the seasonal variability of toll road data from 2017, which provides data on the overall traffic flow of light vehicles, passing on the E6 main road in the municipality of Øyer.
In Oslo and Akershus, the day to day and week to week variability of the demand is in general small, but the total use increased rapidly during 2017. Akershus completely surrounds Oslo so that and Oslo and Akershus constitutes a common commuting zone. The main roads out of Oslo and into Akershus are also the main roads leading to the other main cities of Norway, i.e., Bergen, Trondheim, Kristiansand and Stavanger, and Gothenburg and Stockholm in Sweden. The traffic is thus large on weekdays due to commuting, and on weekends and vacations due to travels to holiday destinations and vacation homes. Therefore, the business case for fast chargers is much better there than in the rural areas of Oppland with large travel peaks during weekends and vacation periods.
5.5. Intra-Week and Intra-Day Variation in Use
The demand for fast charging is stable Monday-Thursday in most Counties, as seen in
Figure 9. On Fridays and Sundays, weekend traffic causes demand spikes in Counties with high through traffic and a high number of vacation homes and holiday destinations, such as Buskerud, Telemark, Oppland and Hedmark. In Counties with large cities (Oslo and Akershus, Hordaland, Trøndelag) the demand for fast charging is much less influenced by weekend traffic and is fairly stable throughout the week.
The intraday demand follows a steady pattern where the peak demand is in the period 14–16 in the Summer and about an hour later in the Winter, as seen in
Figure 10. These times corresponds well with the peak traffic rush hours, which is 16.00–17.00 in the winter and a little earlier in the summer as many employees quit work earlier during the summer season (summertime).
Counties with through traffic, such as Buskerud have a large variation in the total demand between weekdays and weekends, whereas cities such as Oslo have a more stable demand.
5.6. National Variability in Fast Charge Power (kW), Time (minutes) and Energy (kWh)
The achieved average fast charge power, the average time used, and the average energy charged, was heavily influenced by the fleet mix presented in
Section 2. As 64% of the vehicles in the fleet cannot maintain an optimum battery temperature due to passive battery thermal management systems [
7], the achieved fast charge power drops significantly in the winter season. This issue leads to a large variability between seasons, and to some extent locations, for the average charge power and the minutes of charging the sessions lasts. The use of passive thermal management of the batteries can also impact the summer fast charge power even in Norway’s mild summer weather [
23].
The average fast charge session lasted 20.5 min and provided 9.6 kWh of energy at a power of 30.2 kW in 2017. The energy charged is comparable to what was found earlier for Norway, as well as for Sweden, the UK and the USA (as presented in the introduction chapter). The lowest 10% of the fast charge events had a surprisingly low power, below 15 kW, and only the highest 10% came close to utilizing the full power available from the fast chargers, as seen in
Figure 11 and
Table 2. The average energy and time per session follow a normal distribution skewed to the right whereas the average power per session is not normal distributed. The reason for the low charge power seen for parts of the sessions, could be that some users charged from a 43 kW Type 2 AC plug that some fast chargers are equipped with, although the vehicle charger may not handle that high power. Another explanation can be that some people test out or use fast charge stations starting at a high SOC, resulting in a low power. The seasonal variations in the batteries fast charge capability could also be reason for the problem, for instance users attempting a fast charge in extreme cold weather with a very cold battery.
5.7. Seasonal and Geographical Variability
The charge power, time (minutes), and energy (kWh) charged varies over the year, as seen in
Figure 12. The charge power is significantly reduced in the winter whereas the charge time is increased (inverse of the charge power). There is an overall trend that the energy charged increased slowly from 2016 to 2018. The spread between users is however large, as was shown in
Figure 11.
The fleet is on average, based on the estimated average battery size in the fleet, capable of accepting 15.5 kWh of energy, which is 60% more than the average 9.6 kWh that is charged, indicating that users starts the charge at a higher SOC than 20%, or ends the charge before 80% SOC. A theory is that users starts with a variable SOC and charge until 80% SOC regardless of season, although the range this amount of energy can cover is about 30% less in the winter than in the summer [
4].
The average charge power increases with increasing energy recharged and the difference between summer and winter is reduced the more energy that is recharged, as seen in
Figure 13. The latter indicate a heating up effect of the battery while charging, gradually accepting a higher power. The variation in the share of charging events versus charged kWh varies little between months.
The effects of public holidays can be seen in the weekly plot of power, energy and time in
Figure 14. The charge power is as was shown also in
Figure 12 higher in the summer than in the winter. The energy charged is higher in the summer vacation period (week 28–30), and in the school holidays in weeks 8 and 40 (winter and fall holidays) and in week 15 (Easter), in Oppland and Vestfold Counties. Oppland is a typical winter vacation destination and a summer holiday travel corridor. Vestfold is a typical summer travel corridor. The average power is lower in Oppland in the summer holiday weeks than the weeks before and after, which could be due to a battery heating effect resulting from long-distance high-speed driving.
5.8. Road Type Variability
The charge power should in theory vary less over the year and be higher for fast chargers along high-speed roads than for chargers mainly used by local users. The reason is that the batteries should be warmer in the winter in these locations, due to the higher power required for driving at higher speeds and over longer time periods, and thus be able to accept a higher charge power. There is a small tendency in
Figure 15 that charging stations along motorways (speed limits 100–110 km/h) have less variation in the charge power over the year than other charging stations along main roads with 80 km/h speed limits, but the potential effect is so small that the result is inconclusive. A reason could be that in these locations some users actually charge beyond 80% SOC more often in the winter to be able to get to their destination. If that is the case it would counteract the heating effect. It might also be possible that users on long-distance trips travel at lower speeds than the speed limits of the high-speed roads to elongate the vehicles range. In which case the batteries will be less heated up.
One would also expect the average charged energy per session to be higher on high-speed roads than on low speed roads, due to the higher energy consumption required for high-speed driving. In addition, users are more likely to be on a long-distance trip on these roads. This assumption was also not supported by the data in these datasets. It might be that the distance between fast chargers is shorter along the motorways so that users choose to charge less per charge stop, whereas the distance between chargers is longer on other main roads.
5.9. Type of Charging Location–Variability of Use
Other factors may also influence the fast charger process, such as the trip type, i.e., local or long-distance. Local users only charge enough to get to their home base, whereas long-distance drivers need to charge enough to get to their destination. The latter users are likely to charge more kWh per session than the former. These effects are not possible to investigate with these datasets as it is not known where the users live. The type of facilities at the charge stations also influence how long people stay. There is, for instance, a clear tendency for people to stay longer at shopping centers than other locations, and this also leads to a reduced charge power and more kWh energy charged than in the other locations for most Counties, as seen in
Figure 16.
5.10. Individual Variation in Use, and Typical User Groups
Individual use of fast chargers could be calculated for users of the charging network of operator 1. A user ID was included in each charge session data point for this operator. This ID could be used to track total charging activity over the total period for a subset of the users of this operator. It could, however, not be determined when each of these users had bought their BEV, since they appear in the dataset only from the first time they charge. It was therefore decided to analyze the charging behavior in 2017 of 2017-users that had used fast chargers also in 2016. One cannot know if some of the users sold their BEVs during 2017, but it was assumed that those that charged both in 2016 and 2017, remained BEV owners throughout 2017. This assumption is reasonable. 88% of the BEV owners in a user survey done in Q1 2016 said that they would buy a BEV again. In the mid 2018 survey (dataset 3) the share that said they would buy a BEV again had increased to 94%, with less than 0.4 actively saying they would not [
5]. These users could however be using more than one operator’s network so the use in 2017 calculated with this method represent a lower limit of these users charging activity.
The dataset showed that a large share of the users that charged in 2016 charged infrequently in 2017. A quarter used a fast charger only in one of the months of 2017, with another 16% in two different months. The median was to use a charger in 3 different months, with the average being 4 months. Only 5% of those that had charged in 2016 used fast chargers in more than 10 of the months of 2017.
Figure 17 shows more detailed results with the median and average values and the distribution of the use of fast chargers, number of locations, and geographical spread in terms of the number of Counties and Municipalities these users used chargers in.
The average value of 13 fast charges per year for all these users is heavily influenced by a small share of super users, as seen by the large difference between the median and the average values. The upper 5%, i.e., the 95th percentile of these users charged every month, and at least 48 times per year, from at least 13 locations located in 5 Counties, and 14 municipalities.
These numbers, and data from user surveys about the use of fast charger which indicate that few users only charge locally [
3,
5,
6], suggests that there are three typical fast charge users:
Occasional user: fast charges 1–3 times/year, likely when they have a rare range problem (40% of users);
Variable user: fast charges about 4–23 times/year in several locations likely for local/longer trips (45% of users);
Frequent user: fast charges >2 times/month, users with no home charging/professional user (15% of users).
Occasional users have been defined as those that typically charge 1–4 times per year, in up to two locations, and make up about 45% of the users, as seen in
Figure 11. About 15% are frequent users which are defined as those that typically charge more than 2 times per month, from more than 8 different locations in more than 6 Municipalities in more than 4 Counties. The remaining 40% of users, charge 5–23 times per year from 2–8 different locations in 2–6 different Municipalities in 1–4 Counties. They thus seem to be using fast chargers for a mix of local and longer distance trips. This category cannot be further divided as it is not possible to know if a charger these anonymous users have used is a local charger for this user, or is located on the way to a long-distance location that the user travels frequently to. Results from the user surveys [
3,
5], and dataset 3, indicate however that it is uncommon to only fast charge in the users’ own municipality, which supports the notion that the variable user group use combination of local fast chargers and occasionally fast chargers supporting longer distance driving.
5.11. Charge Queues
Charge queues cannot be seen directly in the dataset and not by the operator. What can be seen and detected are periods with frequent charging activity, which can be an indicator of a potential for charge queues. The periods with tendencies of forming queues has in this analysis been defined as the hours of operation in which when more than one fast charge is initiated from the same charger.
Looking at the variation over the day, it is apparent that fast charger queues mainly occur in the time period of 14–16 in the summer months and 15–17 in the winter months, as seen in
Figure 18. This result is not surprising as these time intervals coincides with the afternoon rush hours of the total traffic. It is not uncommon to have summertime working hours in Norway, where the regular day ends one hour earlier in the summer than in the winter. This could be the major reason for the roughly one-hour differences between the charging peaks of the summer and the winter months in
Figure 18. The peak is wider in the summer than in the winter, likely due to a share of BEV owners being on summer vacation in July and August, so that the traffic is more spread out over the day.
The development of the charge demand per charger is shown for two Counties in
Figure 19. County 1 has a high overall demand for fast charging with a relatively low variation between chargers, and there are many chargers with potential for queues. County 2 has a much more variable demand and most chargers are used considerably less than the most used. Some specific chargers in province 2 have a location that results in a fairly high share of hours with more than one fast charge initiated compared to the total use hours over the year. This situation is typical of Counties with a small fleet of BEVs and substantial through traffic along main roads in weekends and vacation periods. Province 1 is more typical of Counties with large local BEV fleets.
Queues therefore typically arise in areas where the demand for fast charging is not keeping up with the increase in the fleet, which is typically in and around cities where the fleets are the largest, and the growth is the fastest in absolute numbers. The other location with queue potential is chargers located along major roads, where queues occur during peak travel times and during vacation periods.
6. Discussion
The main factors influencing fast charging were in the method section divided into Vehicle Effects, User Effects, Climatic Effects and Network Effects, based on the literature review. These effects can also interact and produce additional compounded effects. The analysis of fast charger usage was based on datasets from two fast charge operators containing data of how much each fast charger is used and the main characteristics of the charge sessions, i.e., the time used, the energy charged, the average charge power, the location, and the date and time of day. No information was available about the user or the vehicle.
The data showed that the overall demand for fast charging was highest in areas with a high share of BEVs in the fleet and high numbers of BEVs overall, i.e., in and around the largest cities. The variation in demand over the year, within a month or a week and intraday was very large in some areas, either due to rush hour peaks or due to weekend and vacation traffic. The data also showed that an average of 9.6 kWh energy was recharged into the vehicles, which was about 40% less than theoretically optimum fast charge window of 20–80% SOC with an average battery size of 26 kWh in the vehicle fleet. The average fast charge power of all users over a complete year was 40% less than the theoretical capability of the 50 kW fast chargers. The reduction was less during the summer and higher during the winter. In the winter there was a reduction of the charge power of 5–6 kW compared to the summer. The time the charge lasted had an inverse relation to the fast charge power variation over the year, whereas the average energy charged was fairly constant over the year. The lowest 10% of charge sessions had an average power of 15 kW or less, and only the 10% of the sessions with the highest average power, 43 kW and higher, were close to utilizing the power capability of the fast 50 kW fast chargers. Three main user types were characterized: Occasional users that charged 1–4 times per year, Variable users charging locally and on long-distance trips 5–23 times per year, and Frequent users charging more often than 2 times per month, constituting 45%, 40% and 15% of the total number of users.
6.1. Vehicle Effects
The role of a vehicle manufacturer is to design a BEV that is attractive to users, i.e., with long range and fast charging, while taking into account the economic, practical and technological constraints of the Li-Ion battery pack. It is the most expensive part of the vehicle, and hardware and software must be designed for protection of the battery pack integrity and lifetime. Li-Ion batteries have an optimum temperature range of operation in which full power and energy is available. The battery pack heating and cooling system works in tandem with sensors that measures the temperature of the battery, and battery management software that control the fast charge power delivered by the off-board fast charger, to enable charging as fast as possible without damaging the battery. How much the fast charge power goes down in cold and warm climates depends on the battery size, the Li-Ion chemistry variant, and the capability of the battery heating and cooling system.
The huge variation in the achieved average power of the charge sessions seems primarily to be the result of limited temperature control of battery packs in some of the popular BEV models, such as the Nissan Leaf which rely on passive cooling, but also that the vehicles have different battery pack sizes. At low and very high ambient temperatures, vehicles with passive thermal battery management systems have to severely limit the fast charge power to protect the battery life. Even under optimum temperature conditions the fast charge capability of different models have a large variability, as seen in the data from Fastned [
26]. Once the vehicle has been bought, these characteristics cannot be influenced other than by adapting driving and charging habits. The user can for instance during the winter fast charge immediately after a trip when the battery is warmer. Vehicles with an active thermal battery management system can use software controls to keep the battery temperature optimum at all times when plugged in, and to initiate preheating of the vehicle battery pack before starting the trip or underway to a fast charger [
42,
43]. The downside of such systems can be a high parasitic energy drain.
6.2. User Effects
The average amount of energy charged did not vary much over the year and was much less than the theoretical optimum 20–80% SOC fast charging window. The reason could be that users tend to end the charge at a set SOC, for instance 80% SOC, and on average start at a higher SOC than 20%. If the charge normally ended at 80% SOC the average start SOC would have been 35–40%, based on the datasets analyzed. If on the other hand a share of users starts the fast charge at a high SOC and continues to charge beyond 80% SOC then the average power will be reduced, which could explain some of the large variation in the average charge power. This effect would be present for all vehicle models. This may not necessarily be in conflict with the fact that the average energy charged varied little between the months of the year, if each user behaved fairly consistently over the year.
Frequent users, although being the smallest group, will be the most profitable for the charge operators. Occasional users charge so infrequently that they will not contribute much to the economics of operating the charging network, as they add to the administrative cost while providing little revenue. They also gain little experience with fast charging and might be inefficient users.
An average BEV user got about 4–6% of the energy the vehicle used per year from fast chargers. This mean that the annual cost of fast charging, although more expensive than home charging is very limited. The average user will thus not have much of an incentive to charge efficiently. Users with small vehicle batteries may also not have the luxury to optimize charging process. They have to use the available chargers, and if they are spaced far apart, it will become difficult to charge within an optimum SOC window.
6.3. Climatic Effects
The harsh Norwegian winter conditions led to a 5–6 kW reduction of the average fast charge power of BEVs. This effect must be attributed mainly to the use of passive battery thermal management systems in the vehicles. The differences in charging power between Summer and Winter months was smaller the longer time the charge took. This is likely due to a heating effect of the battery while charging. The time the charge lasted had an inverse relation to the fast charge power variation over the year, whereas the average energy charged was fairly constant.
The energy consumption of a BEV varies significantly with ambient temperature, due to the use of cabin heaters and winter tires. Winter tires should by itself only reduce range by a few percent but snow- or ice-covered roads will also increase the energy consumption [
25]. Together these factors lead to a much larger winter energy consumption, which should have led to a tendency to charge more kWh per session in the winter season, or more frequently. No such effects were seen in the datasets.
6.4. Network Effects
The overall demand for fast charging was highest in areas with a high share of BEVs in the fleet and high numbers of BEVs overall, whereas the variation in demand was due to rush hour peaks and weekend and vacation traffic. In city locations, peak demand and the potential for charge queues mainly occurred during the afternoon rush hour in the everyday traffic. This is not unexpected as dataset 3 showed that 77% of BEVs are used for commuting to and from work every day and another 11% 1–2 times per week [
5]. The traffic flow over the year is fairly constant in such locations and the fast charge demand is thus rather stable. In rural locations between cities or along roads leading to recreational areas and resorts, the peak demand and risks of charge queues occurred during the peak weekend and vacation traffic periods, following the general variation in the annual traffic flow. The larger the variation over the year, the more difficult will it be to build out fast chargers with enough capacity to avoid charge queues on peak travel days.
The assumption that high-speed roads should have less variation in the charge power per session could not be confirmed or rejected. The reason could be that users on long-distance trips on motorways drive slower than the speed limit to elongate range and avoid lengthy charge stops.
6.5. Compounded Effects
The inability of batteries to accept fast charge outside of an optimum temperature range, combined with the use of passive thermal management systems that cannot keep the battery temperature optimum, and users behaving sub-optimally, led to the low average charge power seen in the datasets. The variability between users and sessions is also large. The variability is partly due to differences in vehicle design and partly due to user behavior, for instance starting a fast charge at a high SOC or charging beyond 80% SOC. The low power will lead to an underutilization of the fast charger’s available power, which again leads to a reduced energy transfer per hour from the chargers. The end result will be longer charge queues and higher user costs than necessary, and a need to build out of more fast chargers. Charging network operators must to take this issue into account when dimensioning their networks. Vehicle manufacturers should design vehicles that charge efficiently.
6.6. The Future of Fast Charging
By introducing more advanced battery thermal management systems and larger battery capacity into new vehicle models, their fast charge capability will increase, and the variability in the charge power between sessions and users should be reduced. The user experience should improve, the cost can be reduced, the infrastructure will be better utilized and there could be less charge queues. A simple calculation shows that if the average fast charge power increases from 30 to 45 kW, the user’s direct cost of fast charging and the time cost will be reduced by a third. The user would save a total of 830 NOK/year, based on the average use of 13–19 fast charges per year, each lasting 20 min on average at 30 kW average power, and a cost of time on long distance trips of 280 NOK/h for the driver, and using the average number of passengers in vehicles in Norway [
4]. This would over the life of the vehicle (14 years), have a discounted value of 8800 NOK at 4% interest rate. This amount is the value to the user of a more advanced battery thermal management system that would support 50% faster charging. This saving is likely to be higher than the manufacturers cost for an upgraded battery thermal management system, which will likely also improve on battery life and thus further increase user benefit. Manufacturers should therefore install advanced battery thermal management systems in new BEVs.
Car manufacturers are likely to install large battery packs in new vehicle models because the marginal cost of a larger battery is now quite low [
4,
44]. These larger packs can be fast charged with higher power as they contain more active material. For larger vehicles battery pack sizes of 75–100 kWh seems to be standard, allowing fast charge rates of 100–150 kW. Porsche and Tesla are so far the only manufacturers pursuing more than 150 kW for a production vehicle. Compact vehicles will likely get battery packs of 40–75 kWh that typically will allow for 50–150 kW charging [
3,
39,
40,
45].
Making charging networks denser will make it easier to charge BEVs of the current generation within an optimum SOC band. The average charge power achieved per charger should then increase and charge queues should be reduced. For longer range vehicles, the need for charging can be met by larger charger parks at locations with stronger grid, thus lowering the grid connection costs. A network of 150–175 kW chargers (some up to 350 kW) has been deployed in Norway since 2019 [
4].
Fast charge power may become as important for users as range. The fast charge speed information is currently not easily available to BEV buyers. Measurement of the fast charge speed at different ambient temperatures should therefore become part of the mandatory type approval tests carried out for new models. Figenbaum [
4] found that a 40–50 kWh battery that can be charged with 100–150 kW power could be a good tradeoff between practicality, economy and ecology. The fast charge time will then be reduced to within a reasonable time for pauses on long-distance trips, and the emissions from the production of battery packs will be lower because the battery can be smaller.
While the use of larger batteries and faster charging is important to user acceptance of BEVs, it increases the heterogeneity of BEVs in terms of charge times and fast charge capability, and thus the complexity of buying BEVs. This complexity already involves three different DC fast charge standards (CCS/Chademo/Tesla), with different levels of availability of chargers, and also different standards and cables for slow charging. This complexity can be an added barrier to adoption [
39,
40]. Also, the fast charger networks themselves becomes more complex, offering fast charge power levels from 50–350 kW, with large variations in the price per kWh charged for vehicles charging at less than 50 kW. Charge queue times will become more and more unpredictable the larger the variety in battery sizes and charge power. Making new BEVs with larger packs charge efficiently is therefore important.
6.7. Fast Charging for Professional Users and Future Heavy Duty Vehicle Applications
The charging process for professional users should be as fast as possible. The datasets of the use of fast chargers contains no information of the user. Some are however professional users such as Craftsmen [
46]. For them, fast charging is downtime in the working day, leading due additional labor costs and potential loss of income. For these users it is therefore particularly important that the charging process is as efficient as possible, and that Charge queues can be avoided. Cities wanting to promote professional use of battery electric vehicles may therefore need to consider supporting a separated charger infrastructure for professional users.
Some manufacturers use the same drive-system and battery in light commercial vehicles as in their passenger cars. VW for instance uses the E-Golf system in the e-Crafter large panel van [
39,
40]. The fast charge process is then likely to be less efficient in the summer, as the battery will be utilized harder and be warmer than in the passenger vehicle. In the winter the effect could be the opposite, as a warmer battery speeds up the charge. These vehicles can use the ordinary CCS and Chademo chargers. The variation in charge power over the year will likely be the same for small vans as for BEVs as they in general have the same battery types and battery management systems.
It will be essential to keep the battery temperature optimum for future battery electric Heavy Duty Vehicles (HDVs) so that they can accept a high fast charge power, and efficiently utilize available charging infrastructure. HDVs are used more intensively over a day than a consumer owned BEV, so that the battery temperature will in the winter be higher on average, and charging more efficient. For the summer season high temperatures could also lead to a reduced charge power, unless managed properly by the battery cooling system.
7. Conclusions
The analysis of fast charge usage data from two large national fast charge operators in 2016 and 2017 has shown that the most important factors that needs to be taken into account when analyzing the user experience of fast charging are: the user needs and habits, the vehicles technical characteristics, the climatic conditions the vehicle operates in, the characteristics of the fast charger location, and the traffic flow variability.
Batteries simply cannot be fast charged at high power levels if they are too cold or too hot. The vehicle characteristics in terms of fast charge capability is therefore the single most important factor in the charging process, and the more so the more severe the climatic conditions. The user habits and competences also impact the fast charge power achieved over a charge cycle, as charging outside of the optimum 20–80% SOC band reduces the efficiency of the charging process.
Three types of users were identified: Frequent, Variable and Occasional. The 15% frequent users drive up the average use substantially as they charge at least 2 timers per month. They are important contributors to the economics of fast charger networks. The 40% variable users charge more or less regularly in different locations. The final 45% use fast chargers 1–4 times per year.
The locations where people stay the longest time has the lowest charge power levels, indicating that some users fast charge beyond 80% SOC in such locations. In locations where it is natural to stay fairly short such as fuel stations and fast food restaurants, the charging process is more efficient.
The large variations in the traffic flows needs to be taken into account when dimensioning charger networks. Charge queues occurs in the rush hour in and around major cities, and during travel peaks on Fridays and Sundays and vacation periods for typical corridor chargers far from cities. The latter can have demand peaks that are many times higher than the everyday traffic which may lead to economic challenges for the operators, and/or large charge queues for the users.


