Article

Electrification of Urban Waste Collection: Introducing a Simulation-Based Methodology for Technical Feasibility, Impact and Cost Analysis

1
Chair of Transport Systems Planning and Transport Telematics, Technische Universität Berlin, Salzufer 17-19, 10587 Berlin, Germany
2
Chair of Methods for Product Development and Mechatronics, Technische Universität Berlin, Straße des 17. Juni 135, 10623 Berlin, Germany
*
Author to whom correspondence should be addressed.
World Electr. Veh. J. 2021, 12(3), 122; https://doi.org/10.3390/wevj12030122
Submission received: 23 June 2021 / Revised: 4 August 2021 / Accepted: 13 August 2021 / Published: 17 August 2021
(This article belongs to the Special Issue Electric Vehicles Integrated with Green Energy Sources)

Abstract

:
Electrification is a potential solution for transport decarbonization and already widely available for individual and public transport. However, the availability of electrified commercial vehicles like waste collection vehicles is still limited, despite their significant contribution to urban emissions. Moreover, there is a lack of clarity whether electric waste collection vehicles can persist in real world conditions and which system design is required. Therefore, we introduce a multi-agent-based simulation methodology to investigate the technical feasibility and evaluate environmental and economic sustainability of an electrified urban waste collection. We present a synthetic model for waste collection demand on a per-link basis, using open available data. The tour planning is solved by an open-source algorithm as a capacitated vehicle routing problem (CVRP). This generates plausible tours which handle the demand. The generated tours are simulated with an open-source transport simulation (MATSim) for both the diesel and the electric waste collection vehicles. To compare the life cycle costs, we analyze the data using total cost of ownership (TCO). Environmental impacts are evaluated based on a Well-to-Wheel approach. We present a comparison of the two propulsion types for the exemplary use case of Berlin. And we are able to generate a suitable planning to handle Berlin’s waste collection demand using battery electric vehicles only. The TCO calculation reveals that the electrification raises the total operator cost by 16–30%, depending on the scenario and the battery size with conservative assumptions. Furthermore, the greenhouse gas emissions (GHG) can be reduced by 60–99%, depending on the carbon footprint of electric power generation.

1. Introduction and Motivation

The European Union and many countries have set ambitious targets for reducing greenhouse gas (GHG) emissions progressively until 2050 [1]. Germany has committed itself to reduce GHG emissions by 55% by 2030 compared to 1990 [2]. To achieve this goal, profound transformation in all sectors is required. The aim for the transportation sector is a reduction of 42% by 2030 compared to 1990 [2]. Besides climate action, the necessity to find alternate solutions for transportation is particularly pronounced in urban areas, due to the harmful effects of air pollution and noise [3].
A mere optimization of the current system almost certainly will not be sufficient to reach these ambitious goals. For example, it is found that solely reducing congestion will not lead to a sufficient reduction of GHG emissions and that a broader variety of strategies needs to be deployed [4]. In contrast, the electrification of the transport system is a promising approach to meet climate goals and reduce pollution simultaneously. Following this widely accepted fact, the project “zeroCUTS” (zero Carbon Urban Transport System: Analysis of strategies to fully de-carbonize urban transport) [5] currently under way at Technische Universität Berlin addresses all segments of the urban transport system. First results are very promising. For example, Bischoff and Maciejewski show that the taxi traffic in Berlin could be electrified without a cost increase [6]. They also show that all private car traffic within the city of Berlin could be serviced by a fleet of autonomous vehicles, implying that they could also be electric and thus addressing motorized individual traffic [7]. Something similar holds for urban bus traffic where field studies are widely under way [8].
In contrast to passenger cars and buses, the prevalence and availability of electrified commercial vehicles is still limited [9]. This is especially true for municipal vehicles such as waste collection vehicles. Despite their small overall quantity, they contribute significantly to the emissions of the urban traffic system [10] and thus offer a great GHG and pollutant emission saving potential. However, the field of waste collections is only sparsely discussed in the scientific community [11]. This research chooses to address the effect of eco-driving on the emissions of waste collection. They conclude that eco-driving has a positive effect. Still, they only focused on diesel fueled trucks [11]. Gräbener et al. analyzed the effects of hybrid electric vehicle concepts for urban municipal applications. However, the sole application of BEV could not be addressed, yet [12].
Until recently, European companies presented only few prototypes for electric municipal vehicles, which do not yet meet market requirements [10]. According to our own market analysis, this is about to change. Chinese manufacturers already produce electric municipal vehicles [13]. European manufacturers such as Volvo, Daimler and MAN plan to introduce suitable heavy duty electric urban trucks, in the near future. Furthermore, specialized manufacturers of municipal vehicles, e.g., Faun (https://www.faun.com/en/products/alternative-drives/ accessed on 16 August 2021), Geesinknorba (https://www.geesinknorba.com/emission-free/ accessed on 16 August 2021), and Zöller (https://www.zoeller-kipper.de/en/produkte/e-delta-2307-premium-electric-24v/ accessed on 16 August 2021) have presented electric prototypes, and the European market launch of these vehicles is imminent.
However, there is still a lack of clarity whether these vehicles can persist in real working conditions, and which system design (battery capacity, battery type, charging technology etc.) is required. Besides the technical feasibility, the changes in operating cost and the environmental impact of electric vehicles (EVs) compared to today’s internal combustion engine vehicles (ICEVs) remains an important issue. Especially the battery capacity is a critical parameter, since larger batteries provide higher ranges but also increase total cost and decrease payload. The technology selection of electric municipal vehicles must take energy consumption into account. While driving consumption can be quantified by standardized driving cycles, the energy consumption of the auxiliaries, which can account for a large proportion of the overall consumption [12], depends on the specific working conditions.
System simulation is required to answer those questions in the early phase of technology planning. Therefore, this paper introduces a multi-agent-based simulation methodology to investigate the technical feasibility as well as the possible economic and environmental consequences of a completely electrified urban waste collection. The presented methodology is applied to the city of Berlin, which serves as a use case.
Since the real-world vehicle trajectories are not available in many cases, we develop a synthetic model for waste collection demand on a per-link basis. Afterwards trajectories from the vehicle depots via collection points and dump back to the depot are generated. This is solved by a tour planning algorithm as a capacitated vehicle routing problem (CVRP). The generated tours are routed and simulated on the network of the MATSim Open Berlin Scenario [14].
The procedure is carried out for both a diesel and an electric waste collection vehicle which are fully specified for example in terms of consumption, gross vehicle weight and payload. To compare the ICEV and the EV in terms of life cycle costs and environmental impact during the use phase, we analyze the data using the total cost of ownership (TOC) and the Well-to-Wheel (WTW) methods.
The paper addresses the following questions:
  • How will fixed and variable costs differ between the fossil and the electric approach?
  • How will tour structure and lengths as well as fleet size change?
  • How can urban waste collection be realistically modelled and simulated in order to assess the costs and environmental impacts of different propulsion types?

2. State of the Art

As stated, in the present study we are interested in the consequences of a full electrification of waste collection in Berlin, while at the same time developing a method that can be used for arbitrary regions. In the following we investigate the state of the art in four different fields:
  • Generation of demand for pickups
  • Generation of pickup tours
  • Cost matrix for the pickup tours
  • Technology and operational parameters of waste collection vehicles

2.1. Demand Generation for Waste Collection

Conventional waste management is a well-researched subject. Typical approaches couple demographic properties to waste generation per person or household, and then use the spatial layout of the region to obtain amounts of waste per road link or block [15,16,17]. Willemse uses GPS tracks to identify the collection area during the tour, but then generates pickup locations from census data [18]. Others rely entirely on GPS tracks, i.e., slowly traversed links indicate pickup locations together with the time to serve them [19,20].

2.2. Tour Generation

Once the demand is known, vehicle tours need to be generated that start at the vehicle depot, iterate between pickups and delivery at the dump, and eventually return to the depot. Since the capacity-limited vehicles need to unload during the tour and resume collecting afterwards, these are capacitated vehicle routing problems (CVRPs). Many algorithms are discussed to solve problems such as CVRPs [21] or arc algorithms [22]. Other approaches use particle swarm optimization [23] or Boolean optimization methods [24]. Ignoring the unload and resume collection capability simplifies the problem, but leads to too many and too short tours with too many vehicles [25].

2.3. Cost Matrix/Road Network

Vehicle routing problems (VRPs) are often defined on cost matrices, which specify the cost between each pair of locations [21]. Clearly, for the waste collection at every street of an area such a matrix would be cumbersome to use, since its size would be the number of pickup locations squared. For a region with, say, 100,000 pickup locations, the matrix would be of size 1010. This implies 40 GB of memory footprint, already too large for typical desktop computers. An alternative is to derive the cost from one location to another by a call to a routing algorithm based on a network graph. As usual, this trades memory for computing time.

2.4. Urban Electric Commercial Vehicles

As stated in section Introduction and Motivation, technology development for electric municipal vehicles is still premature. However, some research concerning the topic has been done. To adequately specify the waste collection EV, the current development state of battery cost and lifetime and driving consumption is reviewed.

2.4.1. Battery Price

A recent publication predicts a price range for passenger car battery packs from 150–180 $/kWh in 2019 [26]. The Bloomberg 2019 EV Outlook identifies the current specific prices for car battery packs at 174 $/kWh in 2018 [27]. With the average exchange rate in 2018 of 1.18 $/€, this is equivalent to about 147 €/kWh. A study from 2015 predicts a specific price range for commercial vehicle battery packs from 378–770 €/kWh in 2020 [28]. The price gap between commercial vehicle and passenger car batteries can be explained with higher lifetime requirements and lower quantities [28]. Nevertheless, the identified price ranges for passenger car batteries point out the future development potential for commercial vehicle battery prices.

2.4.2. Battery Lifetime

The second important parameter is the possible life time of the battery, typically measured in equivalent full charging cycles until a remaining capacity of 80% is reached [29,30,31]. This parameter has a high impact on the TCO since it determines whether a battery replacement is necessary within the lifetime of the vehicle. The possible real-life cycles are strongly influenced by depth of discharge, charging rate and battery temperature. Matadi et al. show that Lithium Nickel Manganese Cobalt Oxide (NMC) cells can perform up to 4000 full cycles at 45 °C before reaching end of life (EOL). This value drops to 50 cycles at 5 °C [32]. In 2018, a study was published which showed that temperature controlled NMC cells can perform up to 4500 full cycles at 0 °C ambient temperature with 3.5 °C [33].

2.4.3. Driving Consumption

Gao et al. use real world driving cycles for a simulation based consumption estimation. For a class eight waste collection vehicle a consumption of 2 kWh/km is calculated (3.2 kWh/mile) [9]. Based on their maximum driving distance and maximum speed, we assume that a rural cycle is used. Sripad and Visvanathan deal with uncertain input parameters by using a Monte Carlo simulation to calculate a consumption in a range from 1.38–1.81 kWh/km (2.2–2.9 kWh/mile) for a 36 t class 8 truck. The underlying driving profile remains unclear but based on the covered range, a highway profile can be assumed [34]. Urban electric buses seem to have a comparable driving profile to the considered urban waste collection vehicles. Kievekas, Vepsalainen et al. use real driving data and a stochastic approach to calculate an average driving consumption of 0.914 kWh/km on a suburban bus route [35]. It must be noted that their empty vehicle mass is about 3 t less compared to the vehicle type considered in this paper.

3. Methods

The presented approach combines three elements: A transport simulation, a TCO analysis and a WTW analysis. The transport simulation in combination with the tour planning algorithm is used to generate a possible solution for waste collection in a given geographical region. Thereby it yields the necessary fleet size, distances driven and energy used for a specific vehicle type. We compare different propulsion systems using the TCO and WTW methods to investigate economic and environmental implications. The entire approach is depicted in Figure 1.

3.1. Transport Simulation: From Demand Generation to Vehicle Trajectories

The Multi-Agent Transport Simulation (MATSim) approach builds microscopic models of the transport phenomena under investigation [36]. “Microscopic” means that the relevant entities of the system are individually resolved. The approach, as in any economic assessment exercise, is:
  • Building a model of the base case (ICEV)
  • Building a model of the policy case
  • Comparing costs and benefits
Here, the model of the base case is a model of urban waste collection with ICEVs. For a microscopic approach, this entails (a) a model of the demand for each day of the week, and (b) a method to generate plausible vehicle tours that serve that demand. The demand contains all information of how much waste should be carried from location A to location B. This generation is done synthetically, based on available average numbers of the waste collection, plausible assumptions and spatial information, in particular locations of vehicle depots, dumps, and the street network. This is similar to the non-GPS based methods described earlier (see Section 2.1), albeit simpler.The detailed steps and related parameters for the demand generation of our case study are presented in Section 4.2.
Afterwards, trajectories from the vehicle depots, iterating between collection points and dump and finally going back to the depot, have to be generated. This is modelled as a shipment problem, where each shipment is from the pickup location to the dump. The vehicles are capacity (here in terms of payload) constrained, leading to multiple trips to the dump during a tour [25]. Also, tours are time constrained, which leads to multiple tours run simultaneously. Our approach uses the software jsprit (https://github.com/graphhopper/jsprit accessed on 16 August 2021), which is already integrated with MATSim, and which is indeed able to provide heuristic solutions for such shipment problems. For this study, vehicle depots are assumed to provide an unconstrained number of identical vehicles.
The policy case is generated similarly. While the same demand is assumed, the EVs have different payloads and a range constraint. Evidently, the resulting tours may be different.
To summarize, the idea is to generate synthetic tours for the waste collection vehicles by combining the following elements: (a) Generate a plausible demand from data and assumptions about the system under consideration. (b) Specify current and future vehicles types that can serve the demand. (c) Run a tour planning and fleet assignment algorithm to plan concrete trajectories that would serve the demand. As a final result, one has a concretely specified vehicle fleet, plus individual tours per vehicle. This information can be used to determine the total cost of ownership as well as the well-to-wheel analysis of the environmental impacts. These will be described in the following.

3.2. Total Cost of Ownership

The TCO analysis is a commonly accepted method in strategic cost management. It is used to calculate the financial impact of procurement decisions regarding not only purchase but also variable costs over the products lifetime [37,38]. This method has proven to be useful to compare different technological options in the early planning phase of electric mobility solutions [39]. Hence this method is suitable for the application in this work. Our approach is based on [8].
We assume a product lifetime of 10 years for vehicles and 20 years for charging infrastructure, and annualize the capital expenditure using an average interest rate of 4% according to [8]. The operational costs are calculated exemplarily for two typical work days based on simulation results.
Research concerning electric passenger cars shows less maintenance effort compared to ICEVs [40]. However, the resulting change in maintenance costs has not yet been quantified reliably for the considered vehicle type. Therefore, we assume the maintenance costs for the EVs using the same costs as for the ICEVs, despite the presumed savings for EVs.

3.3. Well-to-Wheelanalysis

To analyze the environmental impact of the simulated waste collection scenarios, GHG emissions from the production of diesel and electricity as well as from their use in the vehicles are estimated following the WTW methodology [41].
In contrast to a life cycle assessment (LCA) over the whole life cycle of a product [42] including the production and the end-of-life period, the used WTW approach focuses on the comparison of GHG emissions only from the use phase of the ICEV and the EV [41]. Nonetheless, the whole upstream chains of diesel and electricity, including extraction, production and distribution are considered [43].
For the WTW analysis we choose the tool openLCA 1.8.0 (http://www.openlca.org/ accessed on 16 Auguts 2021) with the database Ecoinvent v3.5 [44]. We use the IPCC 2013 method to calculate GHG emissions [45]. For diesel, the calculated GHG emissions are 3139 gCO2eq/ldiesel. As the electricity data in Ecoinvent v3.5 is collected for the year 2014, we will calculate the GHG emissions assuming 473 gCO2eq/kWh for Germany in 2018 [45,46].
Taking German climate goals for the year 2030 into account, we will calculate GHG emissions from electricity production assuming 347 gCO2eq/kWh and assuming only renewable energies for electricity production, resulting in 25 gCO2eq/kWh [47].

4. Case Study

Our case study is carried out for Berlin, the largest city and capital of Germany with currently 3.75 million inhabitants living in an area of 891 km 2 [48]. The following sections explain all necessary steps to generate a demand model which afterwards can be solved by the used transport simulation (see Section 3.1).

4.1. Road Network

For the present investigation, we use a road network model consisting of links and nodes, link-based demands for waste collection, individually modelled synthetic vehicles, and individual vehicle depots and dumps. The road network is the regular network of the public available MATSim Open Berlin Scenario [14], where the network is originally derived from OpenStreetMap (http://www.openstreetmap.org accessed on 16 August 2021).

4.2. Generating a Synthetic Demand for Waste Collection

What now follows is a model to synthetically generate a plausible spatially resolved demand for waste collection. According to the annual report of the Berlin waste management company, the overall amount of waste from households and small businesses in 2018 is 813,495 t/a [49]. With the assumption that all 3.75 million inhabitants generate this amount equally, this results in an average of 217 kg/(a*person). This number, multiplied by the number of inhabitants per district and divided by the number of weeks per year, results in the typical weekly amount per district. Each of the 96 districts has a fixed assignment to one of the four vehicle depots; this effectively decomposes the problem into four independent sub-problems.
Real-world pickup schedules for Berlin are not publicly accessible. Therefore, it is necessary to synthetically generate a plausible collection schedule. In Berlin, some areas are served once per week, some twice. For each vehicle depot sub-problem, the districts with the lowest waste density are identified, and assumed to be served once per week, on Wednesdays. All other districts are assumed to be served twice: on Mondays and Thursdays or on Tuesdays and Fridays. These subgroups are combined such that the waste amounts are approximately equal between depots.
Since we assume an equal generated waste amount per day, Mondays and Tuesdays will have more waste than Thursdays and Fridays. For balancing purposes, some districts were moved into the “low density” group, and then some of the “low density” districts were moved to Thursday or Friday collections while maintaining the once-per-week frequency. The waste is transported to five dumps where the delivered amounts are known [49]; therefore, each district is assigned to a dump for each collection day so that the spatial layout is plausible, and the resulting weekly waste amounts per dump are realistic. The result of this process is a synthetic collection schedule which assigns to each district a depot, one or more collection days, and for each collection day a dump.
The link-based demand for collection is now created at each link of the network depending on the free speed, length and the district where the road is located. In general, all roads with a free speed higher than 50 km/h are excluded, so that no collection will be created on motorways. The demand for collection is then distributed to the remaining links, proportionally to their length, which reflects the assumption that in each district the population is distributed equally along the remaining links. The number of waste bins per link is then obtained by dividing this amount by the bin size. For the VRP, each demand per link is encoded as one shipment, regardless of the length and the amount of waste, which needs to go from the collection point to the disposal station. The number of bins per shipment is only relevant for the necessary time per pickup.
The objective function is to minimize the costs, defined as the sum of fixed costs for each employed vehicle and variable costs per km. The fixed costs include depreciation, insurance and the personnel costs of the crew, where it is assumed that the crew is paid for the full day no matter how long the tour. The variable costs are the costs for the energy (e.g., fuel or electric power). Additionally, there are the following constraints:
  • All collection vehicles have capacity (payload) constraints and thus have to unload at the dumps. Each disposal of a fully loaded vehicle is assumed to take 45 min, which is also assumed to be used as the legally required break of the vehicle crew.
  • All collection vehicles have time constraints. They need to be back at the depot after 8 h and the earliest departure is 6 a.m.
A vehicle tour as a heuristic solution of the VRP thus starts at the depot, then iterates between multiple waste collections and the dump, and returns to the depot. The solution consists of individually specified trajectories for all the vehicles necessary for fulfilling the complete demand of each specific collection day.

4.3. Vehicle Parameters

Realistic parameters for both the diesel and the electric waste collection vehicle are defined in order to quantify the results of the simulation in terms of energy consumption, WTW emissions and TCO.
An ICEV with Euro 6 emission standards is chosen for the base case. It represents the newest vehicle generations currently in service, in order to show the present-day potential of combustion engines. The specifications of the vehicle are received from personal interviews with a large German waste management authority.
For the policy case, a commercially available, small-scale-produced electric waste collection vehicle is chosen to reflect the current market situation and to get reliable price information. While vehicle and battery specifications and driving consumption are available online (E-Force One AG (https://www.eforce.ch/ accessed on 16 August 2021)), price information and consumption for waste collection were received from personal encounter with the vehicle (E-Force One AG) and collector (Geesinknorba Group (https://www.geesinknorba.com accessed on 16 August 2021)) manufacturers.
In electric powertrains, the battery is the main cost driver. Furthermore, the weight of the battery has a considerable impact on the possible payload. Therefore, two different batteries are selected: A large battery which enables longer ranges but also causes a reduced payload and a higher purchase price and a small battery which allows for an equal payload compared to the ICEV but has more significant range restrictions. Further specifications of the ICEV and both EVs are shown in Table 1.
To assess the reliability of the parameters stated by the manufacturer, the specific battery price, the possible charging cycles and the driving consumption are compared to the state of the art (see Section 2.4).
Since the usable capacity is given, the installed capacity has to be calculated. Latest battery technology allows for 80–85% usable SOC [50]. Assuming 80%, the specific prices are 604 €/kWh for the large and 650 €/kWh for the small battery. These values are on the high end of the identified price range (see section Urban Electric Commercial Vehicles) and thus can be considered a conservative choice.
The selected NMC battery is equipped with a water based temperature control system. Consequently the results of [33] can be applied. As the proposed charging rate is significantly lower than 3.5 C (commonly used unit for charging rate which is the unitless ratio between battery capacity and charging power) and 4000 instead of 4500 full cycles are stated, the dimensioning appears viable.
The range for the driving consumption specified by the manufacturer (0.8–1.2 kWh/km) is significantly lower than reported in studies dealing with similar trucks. This could be the result of fundamentally different driving profiles. Nevertheless, the mean of the range given by the manufacturer is chosen: 1 kWh/km. This value is slightly higher than the consumption of the lighter electric bus with a comparable driving profile reported in [35].

4.4. Charging Infrastructure Parameters

In the presented use case, a single shift operation of eight hours daily is assumed. This leads to up to 16 h of dwell time which can be used for charging. Therefore, one 22 kW charger for every vehicle is suitable even for the 310 kWh battery. The cost for hardware, grid connection, approval, and setup for one charger is set to 10,000 € [51].

5. Results

For the case study we investigate two different synthetically generated weekdays for the waste collection in the city of Berlin: Monday as representing the collection days of the districts with higher demand density and Wednesday as the day collecting the waste in the districts with lower demand density. The collection with ICEVs (base case) is compared to the collection with EVs (policy cases).

5.1. Base Case: Collection with Diesel Vehicles

To illustrate the different areas of the synthetic waste collection, these areas for a typical synthetic weekday are depicted in Figure 2. As stated earlier, this is then solved as a pickup-and-delivery VRP, where all vehicles are originally located at their depots. In operation they alternate between waste collection and disposal (dump) until all waste is removed, and then return to their depots. The number of necessary vehicles is an output of the algorithm. For computational reasons, this is solved separately for each district; each district is denoted by a polygon in Figure 2.
Important properties of the problem for a typical synthetic weekday are as follows:
  • Volume of each waste bin: 1.1 m 3
  • Service time per waste bin: 41 s
  • Number of shipments: 12,113 (Monday), 17,808 (Wednesday)
  • Waste to collect: 3123 tons (Monday), 3100 tons (Wednesday)
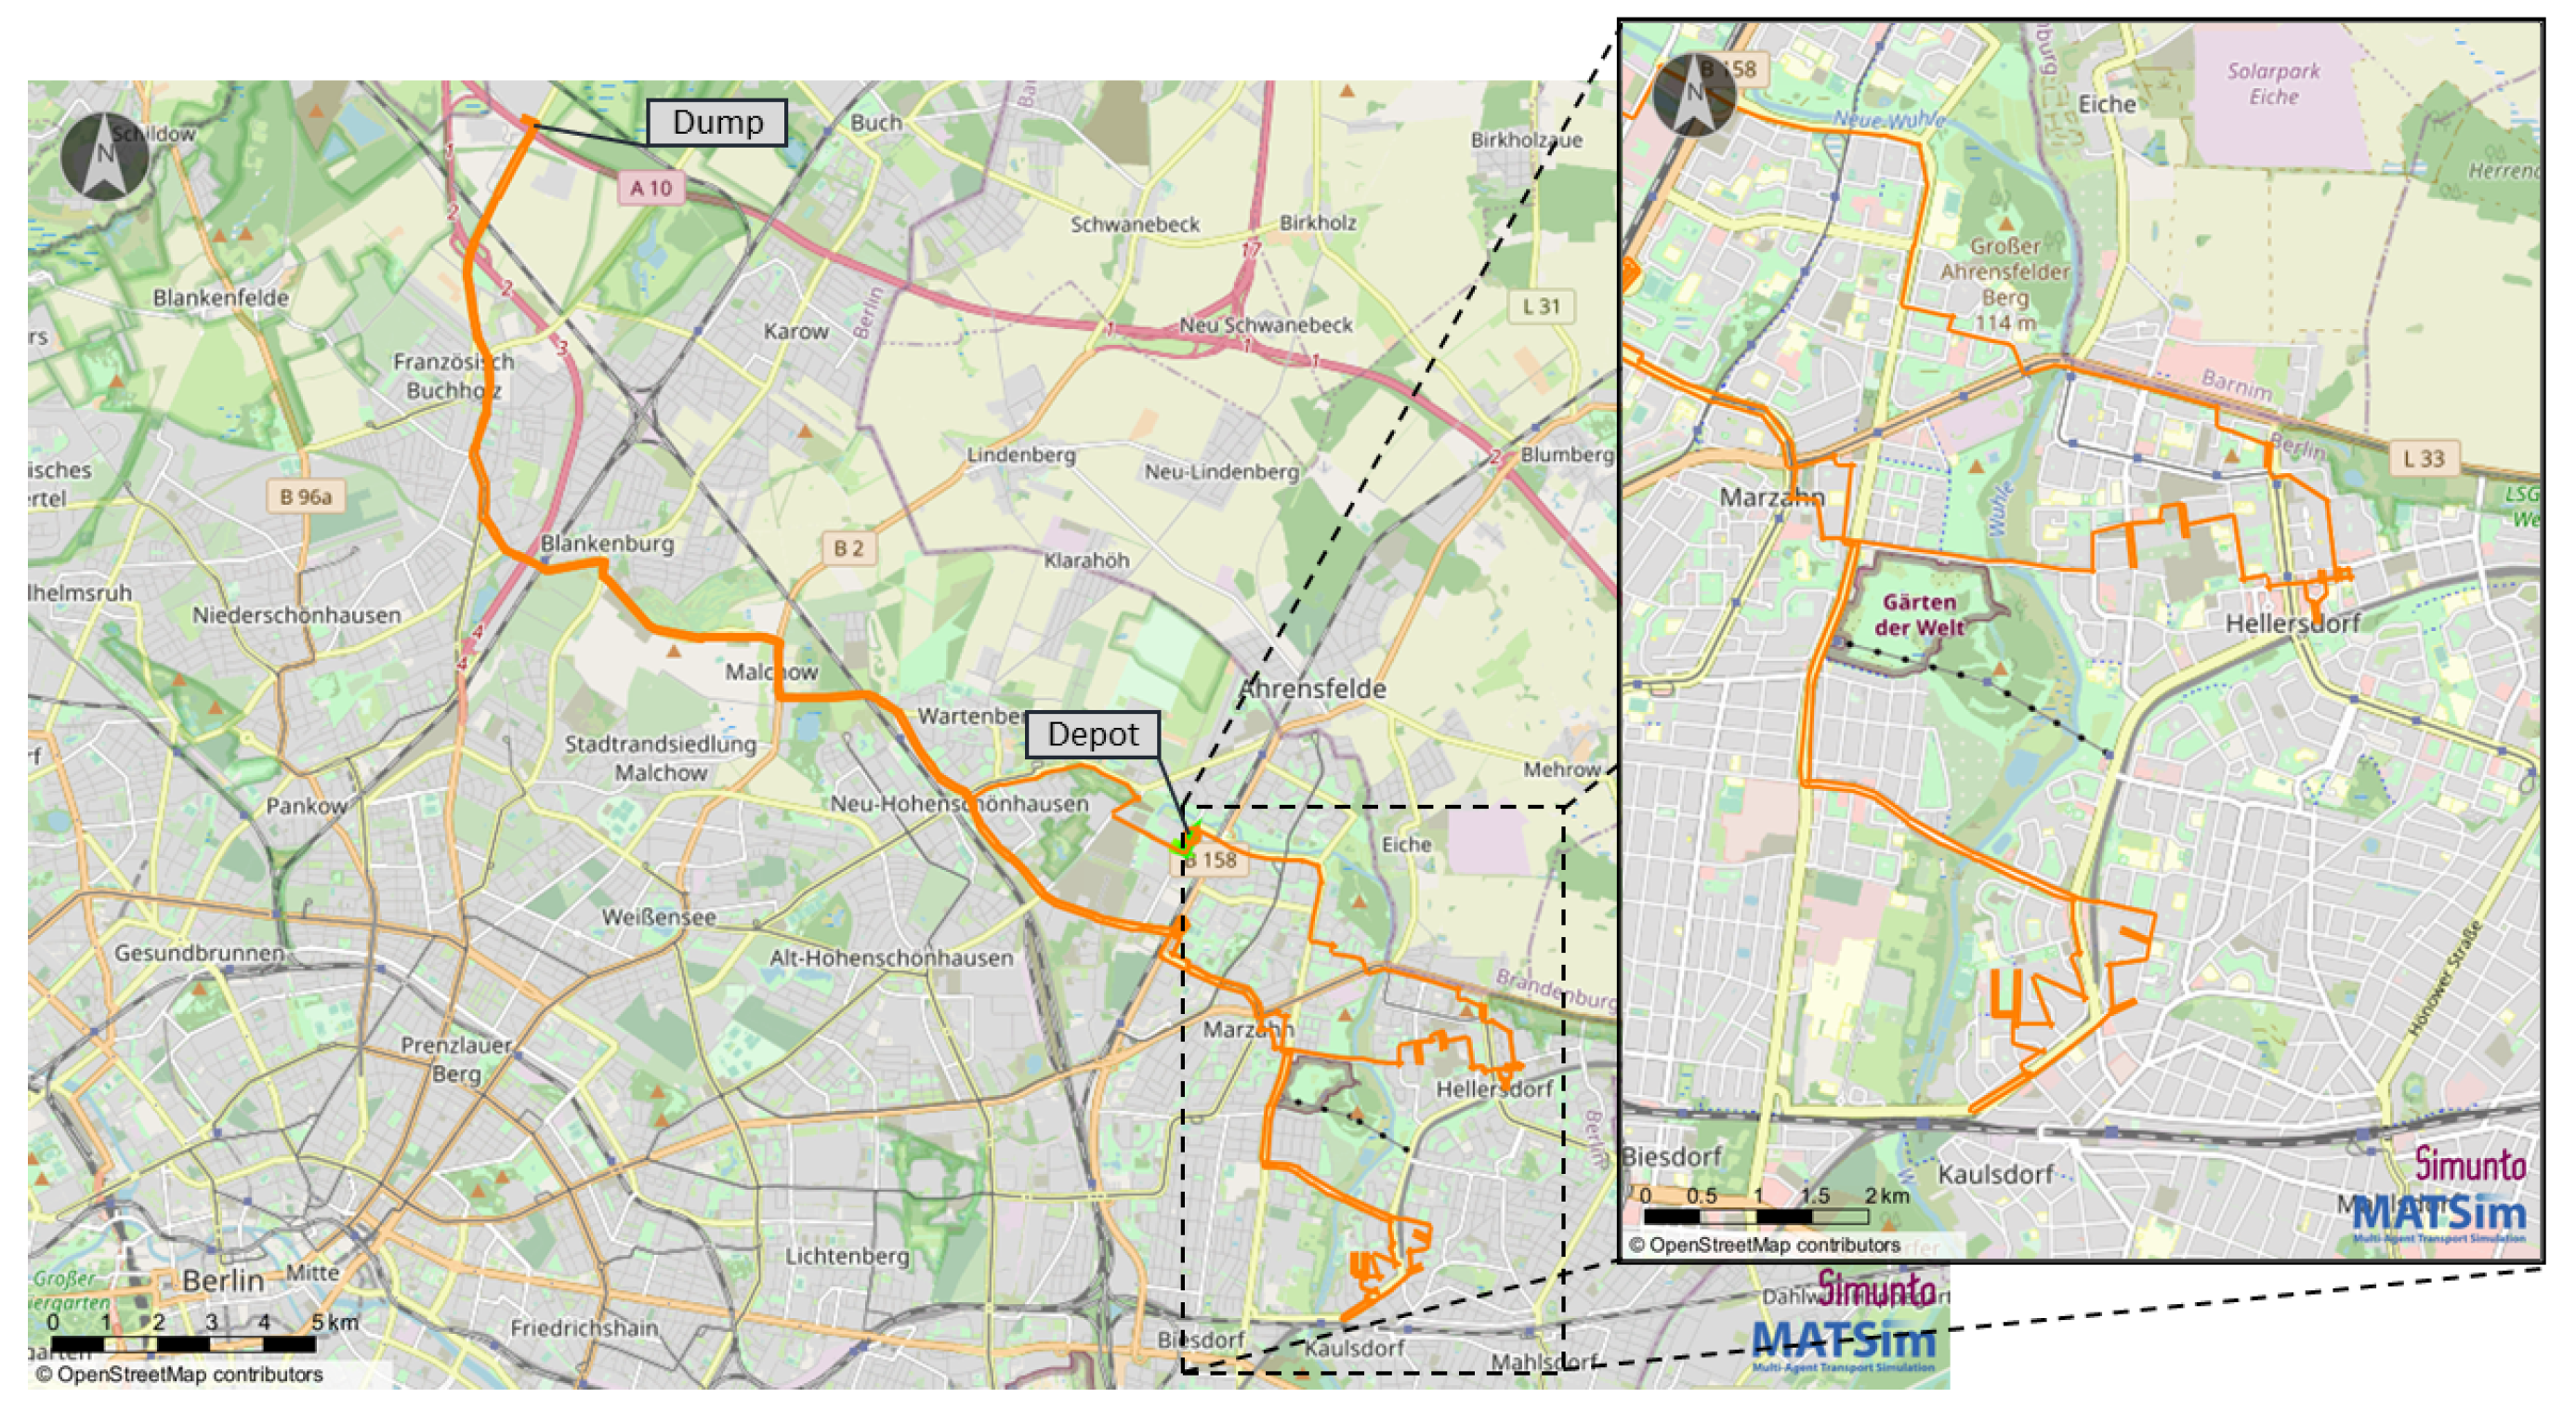
The solution algorithm, jsprit, is run for 100 iterations. A typical route created by the algorithm is shown in Figure 3. This route can be interpreted as realistic, because it contains a typical sequence of a waste collection; e.g., starting at the depot, collecting waste in one area, emptying at the dump, collecting waste in a second area, emptying at the dump and finishing at the depot. Clearly, the result of this will not be optimal; rather, it has to be interpreted as a “feasible solution”. Because the optimization problem is different for each synthetic weekday, the results are also different. The necessary number of vehicles runs between 198 and 218; the total distance is between 10,535 and 14,225 km; the longest tour for a single vehicle is 112 km.
As a sensitivity test, the same optimizations were run with much smaller bin sizes of 240 L, where the service time per bin is 20 s. The necessary number of vehicles runs between 233 and 256; the total distance is between 11,863 and 14,733 km; the longest tour for a single vehicle is 108 km.
Figure 4 shows the distribution of the tour length for the different simulation setups. The collection profile on Wednesday differs from the other weekdays. We will present results for Monday as a typical day and Wednesday as the exceptional day.

5.2. Policy Case: Collection with Electric Vehicles

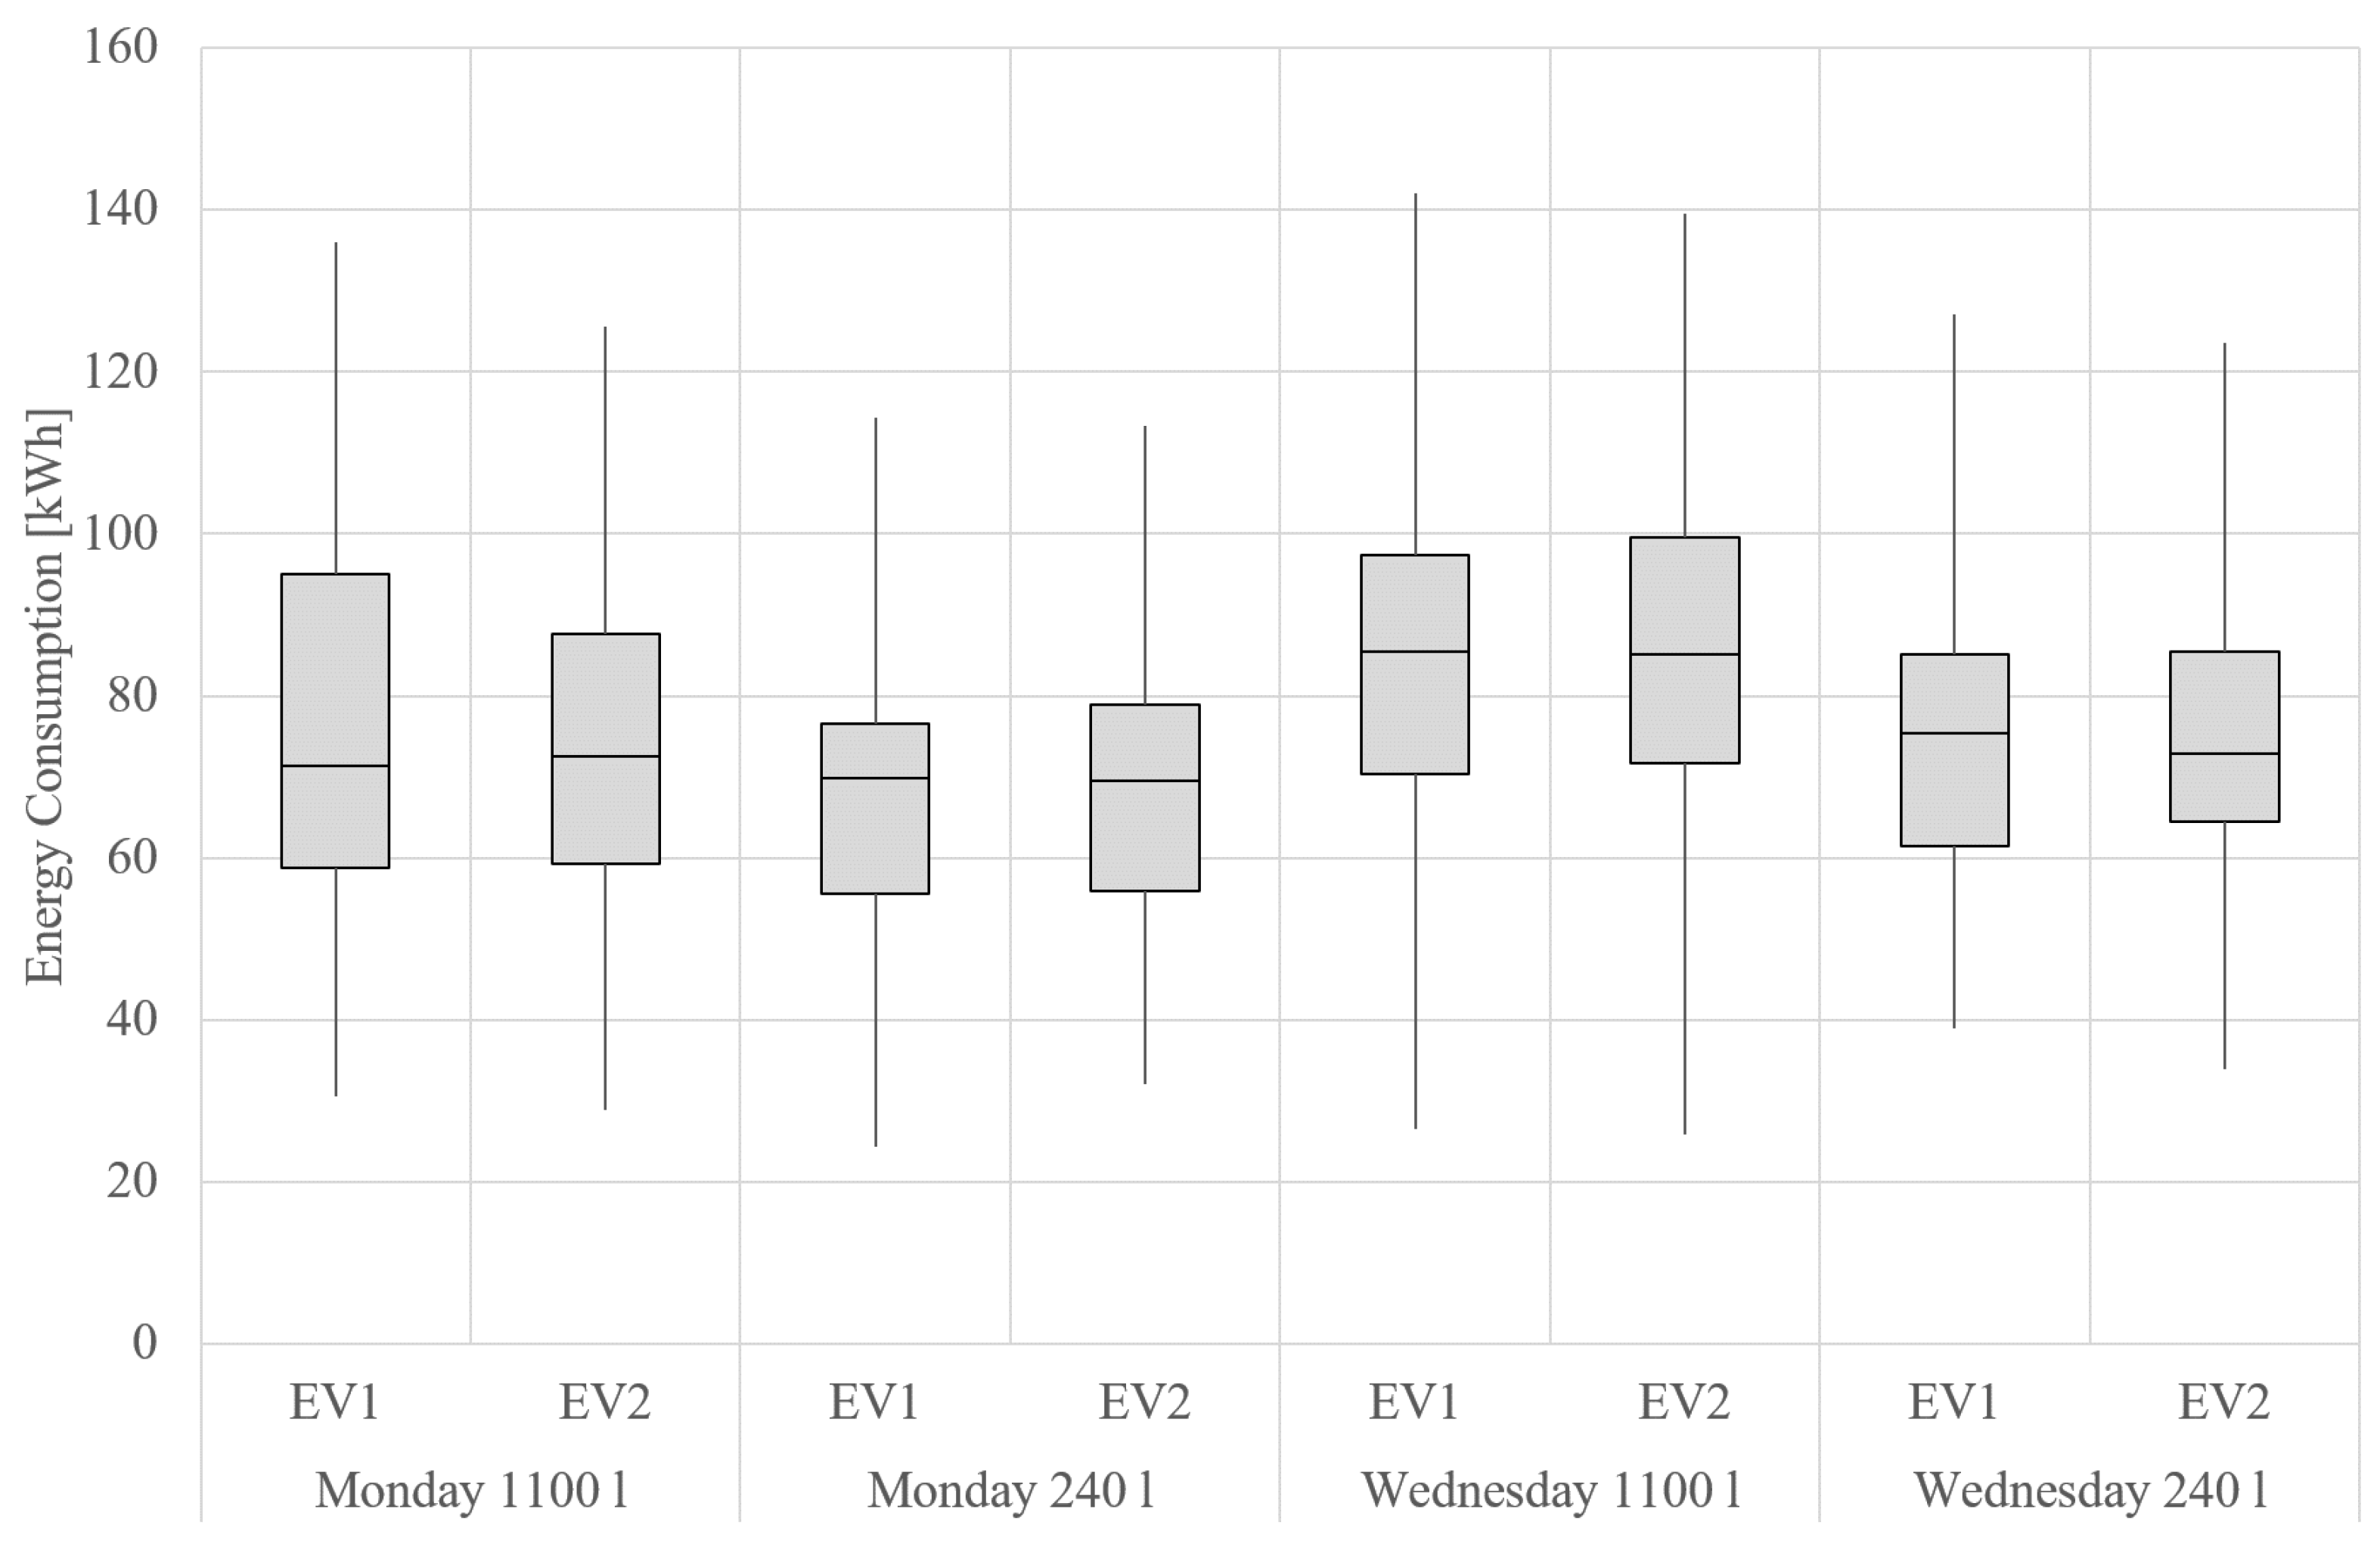
As a first policy case, the above study is re-run with the waste collection EV with a 310 kWh battery and a reduced payload of 10.5 t. Nevertheless, under the same conditions as in section Vehicle Trajectories and Base Case: Collection with Diesel Vehicles, the results end up in the same range, sometimes even with fewer vehicles or kilometers. At the same time, the battery capacity of 310 kWh is by far not exhausted: the most energy-intensive tour demands 142 kWh (Wednesday, large bins).
Because of the large unused battery capacity, a second electric vehicle is considered (cf. Table 1). It has a smaller battery with 155 kWh. Because of the reduced battery weight it has the same payload as the ICEV (11.5 tons). These trucks can replace the ICEVs one by one. The most energy-intensive tour consumes 139 kWh (Wednesday, large bins), which is feasible with this battery. As a result, one overnight charging cycle per day is sufficient for every individual tour. During the assumed 10-year lifetime of the vehicles (250 workdays/a), the 4000 possible cycles are by far not reached. Thus, no battery change is required.
Figure 5 shows the distribution of energy consumption for each tour in the different model setups. The energy consumption for waste lifting and compactification is included and comes out as about 30% of the energy consumption.

5.3. Discussion of Tour Optimization Results

To get insight on the impact of the number of jsprit iterations, the optimizations for one district (644 collections, 1100 L bins, ICEVs) were run for 50, 500, 4000 and 12,000 iterations. Those 12,000 iterations took 15 h of computing time, while 50 iterations took 25 min. The results were as follows (for the iteration runs: 50, 500, 4000 and 12,000):
  • The number of vehicles went down as 14, 14, 13 and 12.
  • The average kilometers per vehicle went as 68, 67, 72 and 81.
  • The maximum number of kilometers of any vehicle went as 101, 99, 99 and 98.
Evidently, the algorithm strives to reduce the number of vehicles because of their high fixed costs. The average number of kilometers in consequence increases. In contrast, the maximum number of kilometers of any vehicle does not increase, which is good news with respect to electrification and specification of battery size.

5.4. Total Cost of Ownership

Figure 6 shows the daily operator cost on fleet level for two synthetic weekdays with different collection profiles and the influence of the two considered bin sizes for both days. The cost is split into its most relevant shares.
The simulation runs with the assumption that staff always works full time. As a result, shortening vehicle tours has no staff cost consequences. When reducing the number of vehicles, we assume that the staff size can be reduced in the long run. With these assumptions we find that the electrification causes an increase in operating cost of 29.4% with the large (EV1) and 17.5% with the small battery (EV2) in the worst case. The high impact of staff cost with up to 71.4% of the base case’s costs is well visible. This value drops slightly for the EVs but with 57.7% and 60.7% still is the main factor. Simultaneously the share of vehicle purchase price increases from 11.8% of the operating cost for the ICEV to 31.5% for EV1 and 27.9% for EV2. This is countered by a reduction of energy cost share by about 3.7% for both EVs. Generally, it is noticeable that energy costs have a minor impact on total costs.
The alteration of cost among the analyzed scenarios (bin size and collection profile) are mainly due to changes in fleet size.

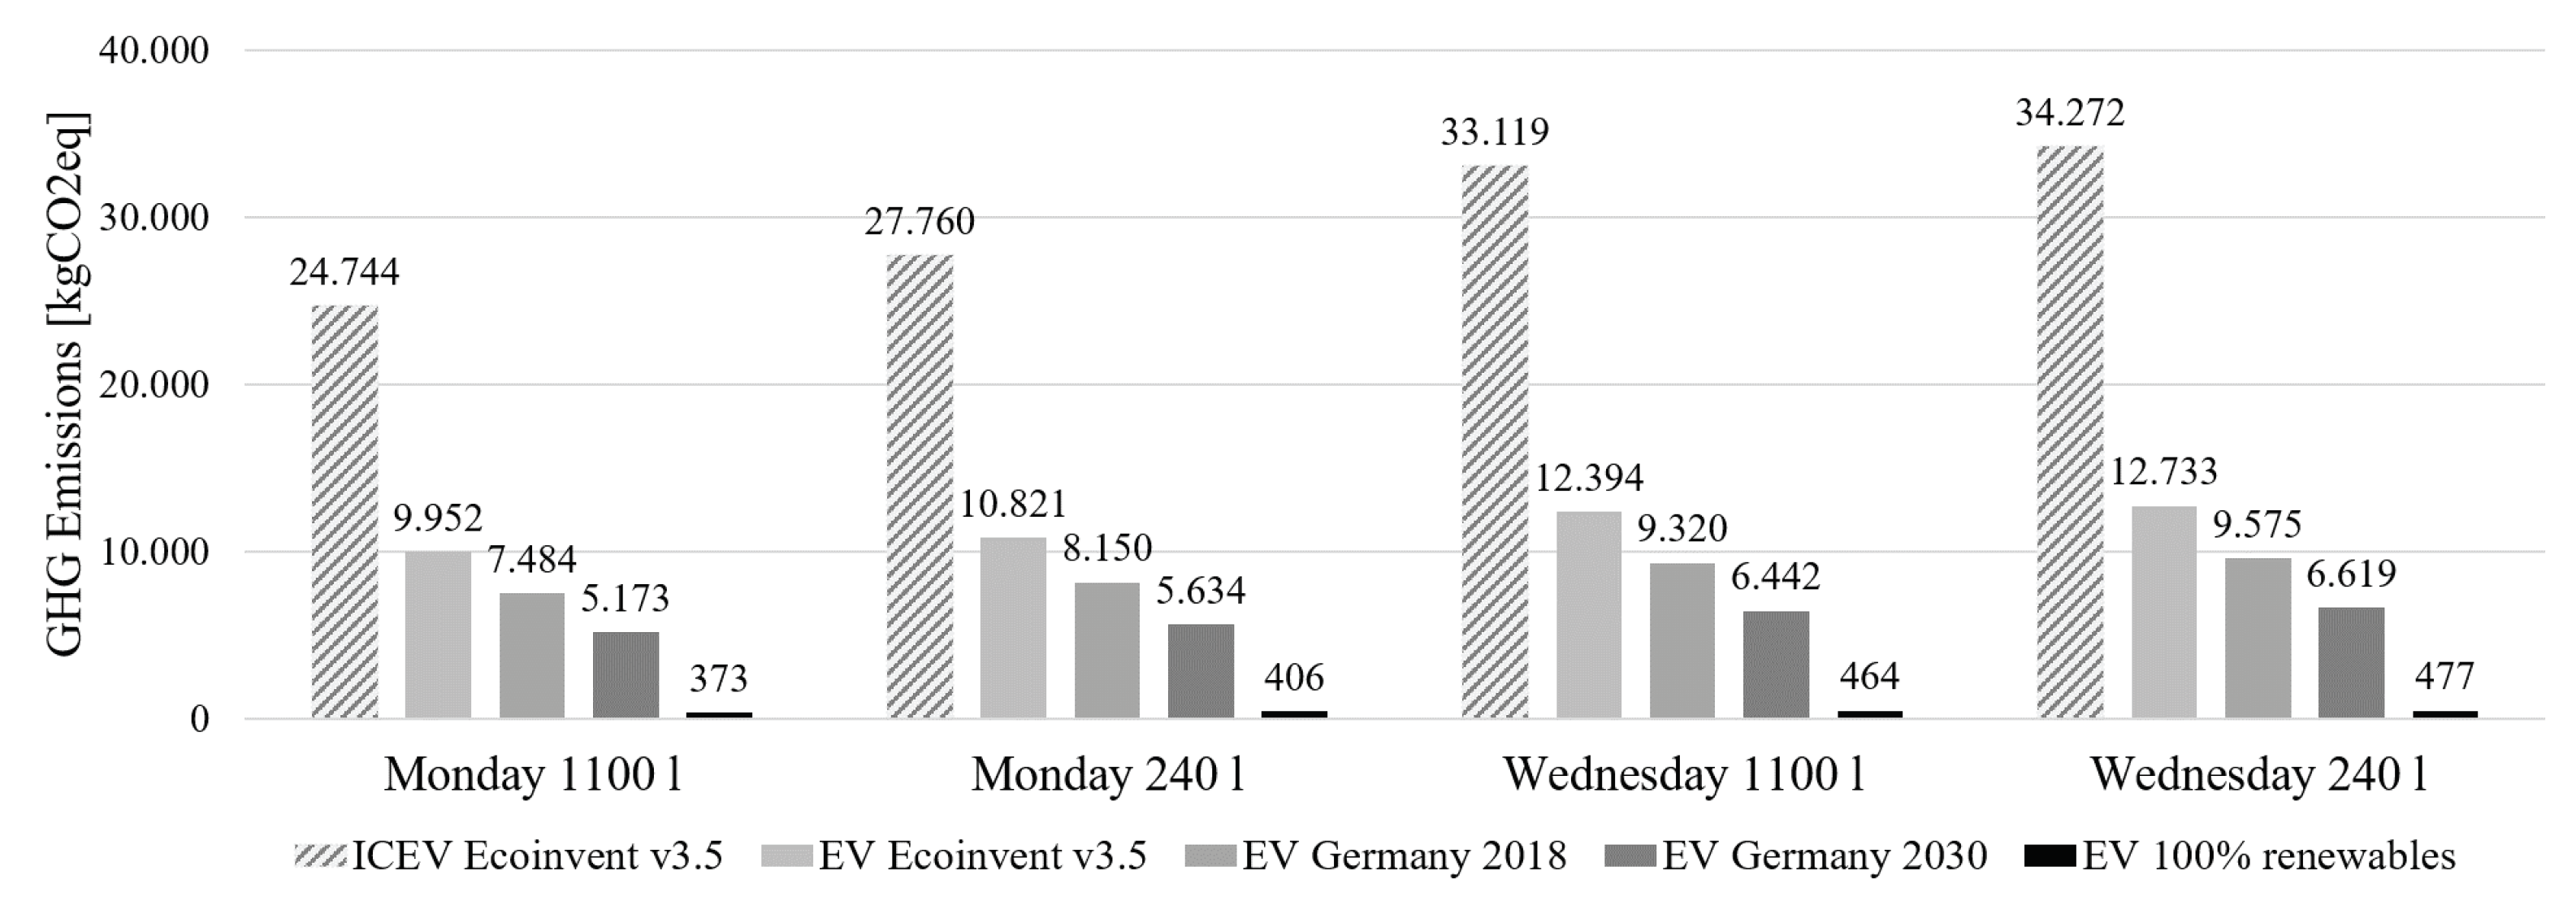
5.5. Well-to-Wheel Analysis

To evaluate the environmental impacts, the cases are analyzed. In order to assume the same conditions in terms of distances travelled and waste collected, EV2 is used (cf. Table 1). Figure 7 displays the GHG emissions of the waste collection for both simulated typical synthetic days. Total CO2eq emissions for the WTW approach of the ICEV and EVs, both with data from Ecoinvent v3.5 are displayed [44]. Additionally, the CO2eq emissions for the EVs using estimations for Germany’s electricity mixes in 2018 and 2030, and using estimations for a fully renewable electricity generation emissions are depicted. Taking a closer look at the results calculated with electricity data from the year 2014 (Ecoinvent v3.5), the GHG emissions caused by the EVs are around 59–63% smaller than the emissions caused by the ICEVs. For Germany’s current electricity mix, EVs’ GHG emissions are around 71–74% smaller compared to the ICEVs’ GHG emissions. Taking projected future electricity mixes into account, the GHG emissions by the EVs are around 79–81% smaller than the GHG emissions caused by ICEVs. If the EVs are powered only by renewable energies, 98–99% of GHG emissions can be saved compared to the ICEVs. Note that even with only renewable energies, there are still GHG emissions, caused by the upstream chains of renewable energy production.

6. Conclusions and Outlook

Our results show that the electrification of the waste collection in urban areas is technically feasible based on current technology. As shown above it is possible to configure a waste collection EV with the same payload as the ICEV together with a sufficient range: The simulated Berlin waste collection vehicles typically perform daily tours of less than 100 km, which can be run by a truck with a fully charged medium sized battery without recharging.
The proposed methodology provides realistic vehicle trajectories for conventional ICEV and BEV. The actual fleet of the Berlin waste operator with approx. 300 vehicles is somewhat larger than our “synthesized fleet” with about 220 vehicles. But firstly we neither consider a vehicle reserve nor extreme waste occurrences (e.g., typically after Christmas). And secondly this difference applies to both the conventional and the electric fleet. Therefore, the relative comparison of life cycle costs and environmental impact of both fleets remains valid.
Our TCO analysis shows a moderate cost increase, between 18 and 30% for the electric fleet, However, it can be expected that this cost disadvantage of an EV fleet will decrease substantially in the near future. Heavy duty EVs are just entering the market and scale effects due to mass production have not been exploited yet. Furthermore, a reduction of battery cost can be expected for commercial vehicles analogously to passenger cars.
Another important aspect is the energy consumption of the EVs. In our simulation we chose an average value. Especially on cold winter days an electric cabin heating could cause significantly higher energy demand.
Also the impact of the uncertainty of the mentioned average consumption as discussed in Section 2.4 cannot be ignored. However, the majority of the vehicles use significantly less than 100 kWh per tour with the made assumptions, leaving a satisfactory safety margin even with the small battery (Figure 5). Furthermore, the large battery offers a safety margin of 54% for the highest simulated energy demand. Therefore, even a doubling of the consumption could be handled. Consequently, the operator could deploy a fleet of vehicles with small batteries (155 kWh) supplemented by a few vehicles with larger batteries to handle the longest tours, resulting in a cost increase somewhere between the above mentioned 18% and 30%.
To further increase range or decrease battery size, (fast) charging options during dwell times are possible. This would lead to cost savings from smaller batteries, but also entail to additional investment costs for additional chargers. We are planning to address these issues in future publications. Here, findings from publications about the intelligent placement of fast charging stations for electric city buses such as [52] will be expanded.
Our WTW analysis shows a significant reduction of GHG emissions of the EV fleet in comparison to the ICEVs. Additionally, GHG emissions with the predicted electricity mix in 2030 could be lowered by approx. 27% compared to Germany’s current electricity mix and by approx. 95% using only renewable energies. Nonetheless, future research should evaluate the whole life cycle of the vehicles, including production (in particular the production of the EVs’ battery) and end of life of the vehicles. However, this requires close cooperation with manufacturers, which we are currently working on. Furthermore, the use phase could be calculated more precisely, for example with the help of a vehicle simulation, to take use-case dependent conditions such as location-specific topology, weather conditions or actual payload and driver influences into account. At the same time, more impact categories should be considered for evaluating the environmental impacts of the ICEVs and EVs, which consider air quality and human toxicity as well.
Eventually our results on electrification of urban waste collection will become part of our study on a fully de-carbonized urban transport system.

Author Contributions

Conceptualization, R.E.; methodology, R.E.; Software, R.E., A.G., K.M.-T. and A.M.S.; validation, R.E., A.G., K.M.-T. and A.M.S.; investigation, R.E., A.G., K.M.-T. and A.M.S.; resources, K.N. and D.G.; Data Curation, R.E., A.G., K.M.-T. and A.M.S.; writing—original draft preparation, All; writing—review and editing, R.E., A.G., K.M.-T. and A.M.S.; visualization, R.E., A.G., K.M.-T. and A.M.S.; supervision, K.N. and D.G.; project administration, K.N. and D.G.; funding acquisition, K.N. and D.G. All authors have read and agreed to the published version of the manuscript.

Funding

This work was funded by the Deutsche Forschungsgemeinschaft (DFG, German Research Foundation) as project number 398051144.

Acknowledgments

We acknowledge support by the German Research Foundation and the Open Access Publication Fund of TU Berlin for the open access publication.

Conflicts of Interest

The authors declare no conflict of interest.

References

  1. Europäische Kommission. Der europäische Grüne Deal, Brussels; COM(2019) 640 Final. 2019. Available online: https://eur-lex.europa.eu/legal-content/DE/ALL/?uri=CELEX:52019DC0640 (accessed on 16 August 2021).
  2. BMU. Klimaschutzplan 2050: Klimaschutzpolitische Grundsätze und Ziele der Bundesregierung; Technical Report; Bundesministerium für Umwelt, Naturschutz und nukleare Sicherheit (BMU): Berlin, Germany, 2016. [Google Scholar]
  3. WHO Regional Office for Europe. Review of Evidence on Health Aspects of Air Pollution—REVIHAAP Project: Technical Report; WHO Regional Office for Europe: Copenhagen, Danmark, 2013. [Google Scholar]
  4. Ansari Esfeh, M.; Kattan, L. A new design and evaluation approach for managed lanes from a sustainability perspective. Int. J. Sustain. Transp. 2019, 14. [Google Scholar] [CrossRef]
  5. DFG-GEPRIS—Analyse von Strategien zur Vollständigen Dekarbonisierung des Urbanen Verkehrs. 2018. Available online: https://gepris.dfg.de/gepris/projekt/398051144?context=projekt&task=showDetail&id=398051144& (accessed on 2 June 2021).
  6. Bischoff, J.; Maciejewski, M. Electric taxis in Berlin—Analysis of the feasibility of a large-scale transition. In Tools of Transport Telematics; Mikulski, J., Ed.; Springer International Publishing: Cham, Switzerland, 2015. [Google Scholar] [CrossRef]
  7. Bischoff, J.; Maciejewski, M. Simulation of City-wide Replacement of Private Cars with Autonomous Taxis in Berlin. Procedia Comput. Sci. 2016, 83, 237–244. [Google Scholar] [CrossRef] [Green Version]
  8. Jefferies, D.; Göhlich, D. Integrated TCO Assessment of Bus Network Electrification Considering Rescheduling and Delays: Modelling Framework and Case Study. In Proceedings of the 31st International Electric Vehicle Symposium & Exhibition & International Electric Vehicle Conference EVS 31 & EVTeC, Kobe, Japan, 1 October 2018. [Google Scholar]
  9. Gao, Z.; Lin, Z.; Davis, S.; Birky, A. Quantitative Evaluation of MD/HD Vehicle Electrification using Statistical Data. Transp. Res. Rec. J. Transp. Res. Board 2018, 2672, 109–121. [Google Scholar] [CrossRef]
  10. Göhlich, D.; Gräbener, S. Identification of User-oriented Electric Commercial Vehicle Concepts with a Particular Focus on Auxiliaries. In Proceedings of the 25th Aachen Colloquium Automobile and Engine Technology, Aachen, Germany, 10–12 October 2016. [Google Scholar]
  11. Goes, G.; Bandeira, R.; Gonçalves, D.; de Almeida D’Agosto, M.; Oliveira, C. The effect of eco-driving initiatives toward sustainable urban waste collection. Int. J. Sustain. Transp. 2019, 14, 569–578. [Google Scholar] [CrossRef]
  12. Graebener, S.; Tarnowski, M.; Goehlich, D. Multi-Dimensional Value-Benefit Analysis for Electrified Commercial Vehicle Concepts. In Proceedings of the 2015 IEEE Vehicle Power and Propulsion Conference (VPPC), Montreal, QC, Canada, 19–22 October 2015; pp. 1–5. [Google Scholar] [CrossRef]
  13. Du, J.; Ouyang, D. Progress of Chinese electric vehicles industrialization in 2015: A review. Appl. Energy 2017, 188, 529–546. [Google Scholar] [CrossRef]
  14. Ziemke, D.; Kaddoura, I.; Nagel, K. The MATSim Open Berlin Scenario: A multimodal agent-based transport simulation scenario based on synthetic demand modeling and open data. Procedia Comput. Sci. 2019, 151, 870–877. [Google Scholar] [CrossRef]
  15. Arribas, C.; Blazquez, C.; Lamas, A. Urban solid waste collection system using mathematical modelling and tools of geographic information systems. Waste Manag. Res. J. Int. Solid Wastes Public Clean. Assoc. ISWA 2009, 28, 355–363. [Google Scholar] [CrossRef]
  16. Beigl, P.; Lebersorger, S.; Salhofer, S. Modelling municipal solid waste generation: A review. Waste Manag. 2008, 28, 200–214. [Google Scholar] [CrossRef]
  17. Ghose, M.; Dikshit, A.; Sharma, S. A GIS based transportation model for solid waste disposal—A case study on Asansol municipality. Waste Manag. 2006, 26, 1287–1293. [Google Scholar] [CrossRef]
  18. Willemse, E. Using Data Science to analyse waste collection activities. Res. Focus 2018, 13, 38–40. [Google Scholar]
  19. Anghinolfi, D.; Paolucci, M.; Robba, M.; Taramasso, A. A dynamic optimization model for solid waste recycling. Waste Manag. 2012, 33. [Google Scholar] [CrossRef] [PubMed]
  20. Ghiani, G.; Guerrieri, A.; Manni, A.; Manni, E. Estimating travel and service times for automated route planning and service certification in municipal waste management. Waste Manag. 2015, 46, 40–46. [Google Scholar] [CrossRef] [PubMed]
  21. Irnich, S.; Toth, P.; Vigo, D. The Family of Vehicle Routing Problems. In Vehicle Routing: Problems, Methods, and Applications, Second Edition; Number 18 in MOS-SIAM Series on Optimization; SIAM: Bologna, Italy, 2014; pp. 1–33. [Google Scholar]
  22. Willemse, E.J. Heuristics for Large-Scale Capacitated arc Routing Problems on Mixed Networks. Ph.D. Thesis, University of Pretoria, Pretoria, South Africa, 2016. [Google Scholar]
  23. Hannan, M.A.; Akhtar, M.; Begum, R.; Basri, H.; Hussain, A.; Scavino, E. Capacitated vehicle-routing problem model for scheduled solid waste collection and route optimization using PSO algorithm. Waste Manag. 2017, 71. [Google Scholar] [CrossRef] [PubMed]
  24. Laureri, F.; Robba, M. An algorithm for the optimal collection of wet waste. Waste Manag. 2015, 48. [Google Scholar] [CrossRef]
  25. Martins-Turner, K.; Nagel, K. How driving multiple tours affects the results of last mile delivery vehicle routing problems. Procedia Comput. Sci. 2019, 151, 840–845. [Google Scholar] [CrossRef]
  26. Nykvist, B.; Sprei, F.; Nilsson, M. Assessing the progress toward lower priced long range battery electric vehicles. Energy Policy 2019, 124, 144–155. [Google Scholar] [CrossRef]
  27. Bloomberg New Energy Finance. Electric Vehicle Outlook 2019; Technical Report; Bloomberg New Energy Finance: London, UK, 2019. [Google Scholar]
  28. Hacker, F.; von Waldenfels, R.; Mottschall, M. Wirtschaftlichkeit von Elektromobilität in Gewerblichen Anwendungen; Technical Report; Öko-Institut e.V: Berlin, Germany, 2015. [Google Scholar]
  29. Schimpe, M.; von Kuepach, M.E.; Naumann, M.; Hesse, H.C.; Smith, K.; Jossen, A. Comprehensive Modeling of Temperature-Dependent Degradation Mechanisms in Lithium Iron Phosphate Batteries. J. Electrochem. Soc. 2018, 165, A181–A193. [Google Scholar] [CrossRef] [Green Version]
  30. Schmalstieg, J.; Käbitz, S.; Ecker, M.; Sauer, D.U. A holistic aging model for Li(NiMnCo)O2 based 18650 lithium-ion batteries. J. Power Sources 2014, 257, 325–334. [Google Scholar] [CrossRef]
  31. Sauer, D.U.; Sinhuber, P.; Rogge, M.; Rohlfs, W.; Winter, M. Entwicklungen im Batteriebereich—Auswirkungen auf Planung, Betrieb und Sicherheit von Elektrobussen und Ladeinfrastruktur. In Proceedings of the 7 VDV-Akademie Konferenz Elektrobusse—Markt der Zukunft! Berlin Germany, 29 February–1 March 2016; p. 49. [Google Scholar] [CrossRef]
  32. Matadi, B.P.; Geniès, S.; Delaille, A.; Chabrol, C.; de Vito, E.; Bardet, M.; Martin, J.F.; Daniel, L.; Bultel, Y. Irreversible Capacity Loss of Li-Ion Batteries Cycled at Low Temperature Due to an Untypical Layer Hindering Li Diffusion into Graphite Electrode. J. Electrochem. Soc. 2017, 164, A2374–A2389. [Google Scholar] [CrossRef]
  33. Yang, X.G.; Zhang, G.; Ge, S.; Wang, C.Y. Fast charging of lithium-ion batteries at all temperatures. Proc. Natl. Acad. Sci. USA 2018, 115, 201807115. [Google Scholar] [CrossRef] [Green Version]
  34. Sripad, S.; Viswanathan, V. Performance Metrics Required of Next-Generation Batteries to Make a Practical Electric Semi Truck. ACS Energy Lett. 2017, 2, 1669–1673. [Google Scholar] [CrossRef] [Green Version]
  35. Kivekäs, K.; Vepsäläinen, J.; Tammi, K. Stochastic Driving Cycle Synthesis for Analyzing the Energy Consumption of a Battery Electric Bus. IEEE Access 2018, 6, 55586–55598. [Google Scholar] [CrossRef]
  36. Horni, A.; Nagel, K.; Axhausen, K.W. (Eds.) The Multi-Agent Transport Simulation MATSim; Ubiquity: London, UK, 2016. [Google Scholar] [CrossRef]
  37. Geissdörfer, K.; Gleich, R.; Wald, A. Standardisierungspotentiale lebenszyklusbasierter Modelle des strategischen Kostenmanagements. Z. Für Betriebswirtschaft 2009, 79, 693–715. [Google Scholar] [CrossRef]
  38. Götze, U.; Weber, T. ZP-Stichwort: Total Cost of Ownership. Z. Für Plan. Unternehmenssteuerung 2008, 19, 249–257. [Google Scholar] [CrossRef]
  39. Goehlich, D.; Spangenberg, F.; Kunith, A. Stochastic total cost of ownership forecasting for innovative urban transport systems. In Proceedings of the 2013 IEEE International Conference on Industrial Engineering and Engineering Management, Bangkok, Thailand, 10–13 December 2013; pp. 838–842. [Google Scholar] [CrossRef]
  40. Propfe, B.; Redelbach, M.; Santini, D.; Friedrich, H. Cost analysis of Plug-in Hybrid Electric Vehicles including Maintenance & Repair Costs and Resale Values. World Electr. Veh. J. 2012, 5, 886–895. [Google Scholar] [CrossRef] [Green Version]
  41. Edwards, R.; Hass, H.; Larive, J.; Lonza, L.; Maas, H.; Rickeard, D. Well-to-Wheels Report Version 4.a: JEC Well-to-Wheels Analysis; Publications Office of the European Union: Luxembourg, 2014. [Google Scholar]
  42. DIN EN ISO. DIN EN ISO 14040: Umweltmanagement—Ökobilanz—Grundsätze und Rahmenbedingungen (ISO 14040:2006); Deutsche und Englische Fassung EN ISO 14040:2006; DIN: Berlin, Germany, 2009. [Google Scholar] [CrossRef]
  43. DIN EN 16258:2012. Methodology for Calculation and Declaration of Energy Consumption and GHG Emissions of Transport Services (Freight and Passengers) (DIN EN 16258:2012); Deutsches Institut für Normung e.V: Berlin, Germany, 2013. [Google Scholar]
  44. Wernet, G.; Bauer, C.; Steubing, B.; Reinhard, J.; Moreno Ruiz, E.; Weidema, B. The ecoinvent database version 3 (Part I): Overview and methodology. Int. J. Life Cycle Assess. 2016, 21, 1–13. [Google Scholar] [CrossRef]
  45. Eggelston, S.; Buendia, L.; Miwa, K.; Ngara, T.; Tanabe, K. 006 IPCC Guidelines for National Greenhouse Gas Inventories: Intergovernmental Panel on Climate Change; Institute for Global Environmental Strategies (IGES): Kanagawa, Japan, 2006. [Google Scholar]
  46. Icha, P.; Kuhs, G. Entwicklung der spezifischen Kohlendioxid-Emissionen des deutschen Strommix in den Jahren 1990–2018; Technical Report Climate Change 10/2019; Umweltbundesamt: Dessau-Roßlau, Germany, 2019. [Google Scholar]
  47. Wietschel, M.; Kühnbach, M.; Rüdiger, D. Die aktuelle Treibhausgasemissionsbilanz von Elektrofahrzeugen in Deutschland; Working Paper Sustainability and Innovation S02/2019; Fraunhofer ISI: Karlsruhe, Germany, 2019. [Google Scholar]
  48. Amt für Statistik Berlin-Brandenburg. Einwohnerinnen und Einwohner im Land Berlin am 31. Dezember 2018. 2019. Available online: https://www.statistik-berlin-brandenburg.de/publikationen/stat_berichte/2019/SB_A01-16-00_2018h02_BE.pdf (accessed on 22 June 2021).
  49. Stadtreinigung, B. BSR-Entsorgungsbilanz. 2018. Available online: https://www.bsr.de/assets/downloads/BSR_Entsorgungsbilanz_2018_INTERNET.pdf (accessed on 22 June 2021).
  50. Rehman, M.M.U.; Zhang, F.; Evzelman, M.; Zane, R.; Smith, K.; Maksimovic, D. Advanced cell-level control for extending electric vehicle battery pack lifetime. In Proceedings of the 2016 IEEE Energy Conversion Congress and Exposition (ECCE), Milwaukee, WI, USA, 18–22 September 2016; pp. 1–8. [Google Scholar] [CrossRef]
  51. Nationale Plattform Elektromobilität. Ladeinfrastruktur für Elektrofahrzeuge in Deutschland: Statusbericht und Handlungsempfehlungen. 2015. Available online: https://www.acatech.de/publikation/ladeinfrastruktur-fuer-elektrofahrzeuge-in-deutschland-statusbericht-und-handlungsempfehlungen/download-pdf?lang=de (accessed on 22 June 2021).
  52. Kunith, A.; Mendelevitch, R.; Goehlich, D. Electrification of a city bus network—An optimization model for cost-effective placing of charging infrastructure and battery sizing of fast-charging electric bus systems. Int. J. Sustain. Transp. 2017, 11, 707–720. [Google Scholar] [CrossRef] [Green Version]
Figure 1. Flowchart of the used methods for generating and analyzing urban waste collection.
Wevj 12 00122 g001
Figure 2. Simulated areas with waste collection based on the developed synthetic collection schedule for a typical weekday. Different colors refer to districts served by different vehicle depots.
Wevj 12 00122 g002
Figure 3. Typical trajectory of one waste collection vehicle. This trajectory was created by the solution algorithm and can be interpreted as a realistic solution.
Wevj 12 00122 g003
Figure 4. Distribution of tour length for the different simulation setups.
Wevj 12 00122 g004
Figure 5. Distribution of energy consumption per tour and vehicle for the different simulation setups.
Wevj 12 00122 g005
Figure 6. Total daily operator cost on fleet level.
Wevj 12 00122 g006
Figure 7. Well-to-wheel GHG emissions on fleet level.
Wevj 12 00122 g007
Table 1. Vehicle type specifications (manufacturer information).
ICEVEV1EV2
(Large Battery)(Small Battery)
GVW [kg]26,00026,00026,000
Payload [kg]11,50010,50011,500
Capacity [m 3 ]222222
Average fuel consumption [L/100 km]73-
Fuel consumption driving60 [L/100 km]100 [kWh/100 km]
Fuel consumption collecting0.5 [L/1000 kg]1.4 [kWh/1000 kg]
Purchase Price Chassis and Collector [€]-452,250
Battery Capacity (usable) [kWh]-310155
Battery weight [kg]-29401470
Battery price [€]-234,000126,000
Cycles to 80% remaining capacity-40004000
Cell chemistry-NMC
Publisher’s Note: MDPI stays neutral with regard to jurisdictional claims in published maps and institutional affiliations.