Article

A Design Technique of Traction Motor for Efficiency Improvement Based on Multiobjective Optimization

China First Automobile Work Group Corporation E-Drive System Section, Electric Vehicle Development Department, Changchun 130000, China
*
Author to whom correspondence should be addressed.
World Electr. Veh. J. 2021, 12(4), 260; https://doi.org/10.3390/wevj12040260
Submission received: 23 August 2021 / Revised: 4 November 2021 / Accepted: 25 November 2021 / Published: 11 December 2021

Abstract

:
With the increasing demand of driving range of new energy vehicle (NEV), design optimization for energy efficiency of traction motors became more important. However, traction motor design is complex since multiple objectives should be satisfied, such as the required torque-speed operating range and package and thermal constraints. This dramatically increases the computation time of the design optimization process, while the additional energy efficiency objective of the whole driving cycle. This paper proposes an equivalent driving cycle points extraction method, based on energy consumption equivalence to facilitate the design optimization of traction motors. This paper presents necessary rules of multiobjective optimization methods, and then gives an optimization process and proves the effectiveness.

1. Introduction

Traction motor design optimization is a technology which is supposed to achieve high power density, good efficiency and excellent NVH by adjusting the motor winding turns and stator shape and rotor shape and magnets dimension, etc. Traditional design optimization only takes single motor parameter as optimizing variable remaining the other parameters unchanged. Then performance of the new design is simulated and compared to determine the value of the single variable. This dramatically increases the computation time of the design optimization process, especially allowing for minimizing the total energy loss over the whole driving cycle. This paper describes design optimization techniques for NEV traction motors to achieve high energy efficiency over CLTC driving cycle while satisfying the other required performance. Different multiobjective optimization algorithm is discussed and improve the speed and effectiveness in motor design optimization.
Most of the optimization algorithm is based on the analysis and comparison of the existing data to obtain the subsequent optimization direction, which is located in the stage of machine learning. Because there are only dozens of targets in the optimization process of motor-design, the operation quantity can be satisfied by using machine learning. Deep learning is a higher-level optimization algorithm applied to image processing and sound processing as shown in the Figure 1. Therefore, multiobjective optimization technology is mostly used to improve the motor efficiency.
The multiobjective optimization technology including:
Artificial intelligence: the optimized data can be combined with the model of machine learning training instead of CAE function of some motor simulation
Convenience: Through the integration and improvement of complex optimization algorithm, the improved algorithm with high applicability and wide coverage is developed to improve the usability.
High-speed: as the multiobjective optimization algorithm with the characteristic of large calculation and large execution processes, it needs to improve the calculation speed. Japan and Europe have begun to introduce supercomputing/cloud platform to support the optimization process
Modeling: through optimizing the software solidification model, the vehicle factory can develop driven motor based on this model. Because the model-based development needs to be iterative repeatedly, the optimization software can greatly shorten the development time.
Response surface methodology (RSM) instead of finite element: for some complex motor structures, RSM can be obtained by optimization algorithm instead of finite element calculation, greatly reducing the time. In addition, through the solidification of RSM for future product development services.
Multioccasion collaborative optimization: multi physical fields have their own simulation platforms and interfaces. Optimization software can consider different factors at the same time by integrating them for multiphysical fields or multiteam collaborative optimization.

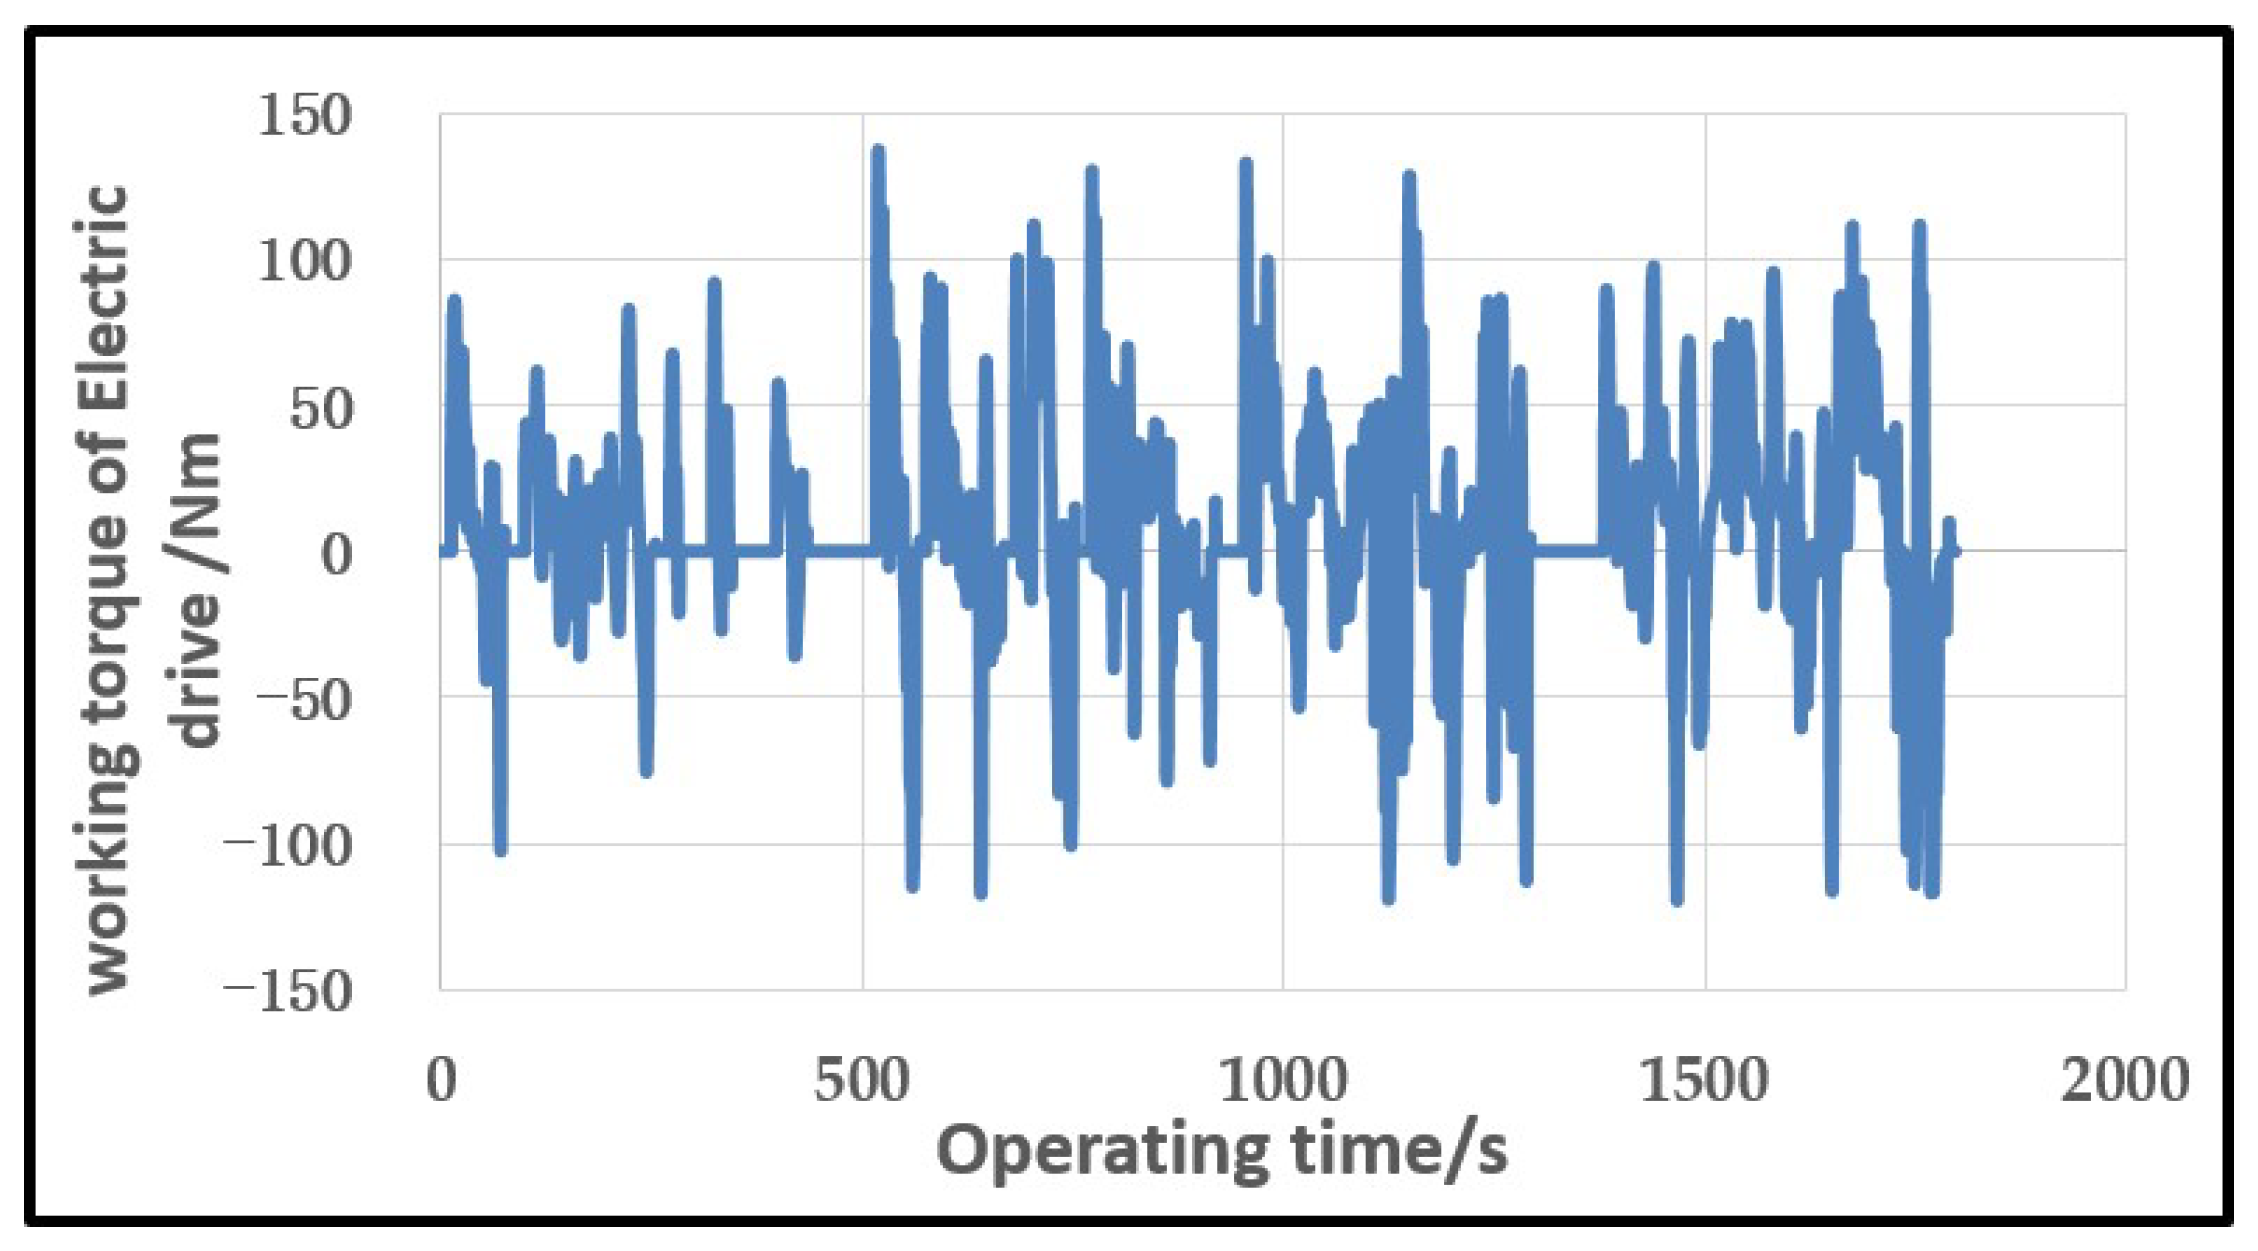
2. Driving Cycle of Traction Motors

Vehicle test cycle include new European standard driving cycle (NEDC), China light-duty vehicle test cycle (CLTC), and Worldwide Harmonized Light Vehicles Test Cycle (WLTC). NEDC is a kind of steady-state cycle determined with duration time of 1180 s, driving distance of 11 km and maximum speed of 120 km/h. 66% of the whole cycle is urban cycle, and the rest is suburban cycle. While the WLTC cycle duration time is 1800 s, the driving distance is increased to 23.25 km, and the maximum speed is 131 km/h. CLTC is a standard condition defined based on the big data of 3832 vehicles in 41 cities in China. Its duration is the same as that of WLTC, which is 1800 s. However, CLTC lacks the definition of ultrahigh speed, and the maximum speed and average speed are lower than the other two conditions. Generally, the acceleration ratio and deceleration ratio of WLTC and CLTC are significantly higher than that of NEDC, and the total duration and driving distance are greatly improved, so the harshness of WLTC and CLTC is higher than that of NEDC. CLTC is the closest working condition to the actual traffic condition in China. Based on the CLTC driving cycle, this paper carries out multiobjective optimization for the motor.
The energy consumption of the motor at any time can be described by the relationship of the traction motor speed, torque, and power in CLTC cycle according to the vehicle parameters which are defined in Table 1. The profile of motor speed, torque, and power in single CLTC is shown in the Figure 2, Figure 3 and Figure 4.

2.1. Equivalent Extraction Driving Points over CLTC

In the 1800 s duration of single CLTC, the motor speed is mostly concentrated in 2000–4000 rpm, the torque is mostly concentrated in 50 Nm, and the power is mostly about 20 kW. The energy consumption of the motor is distributed by hundreds of points within the range of speed (0~10,000 rpm) torque (−150~150 Nm), power (−80~80 kW). An equivalent driving cycle points extraction method is conducted to achieve some characteristic points according to time weight and power weight over CLTC. These characteristic points work for a long time and a large proportion power consumption. It follows the principle that the energy consumption of the vehicle over CLTC. Typically, 9 characteristic points are extracted as shown in Table 2.
Normally, too many optimization objectives make the algorithm difficult to converge. Therefore, the number of characteristic points is reduced to three during optimization process. Empirically 3 points is well equivalent and improve the optimization effectiveness. The energy efficiency over CLTC can be evaluated through 3 characteristic points as shown in Table 3.
In this paper, the basic principle of vehicle condition transformation is energy equivalent method: the motor load spectrum is divided into several regions by means of regional energy statistics; then, the characteristic speed, characteristic torque and energy (and time) ratio are calculated for each region. The characteristic speed represents the regional speed characteristics, the characteristic torque represents the regional load characteristics, and the energy (and time) ratio represents the weight of the region. Considering the optimization efficiency and accuracy, the three-point method is used for optimization, and the nine-point method is the verification method after optimization. The method was verified by practice and has strong practicability and accuracy.

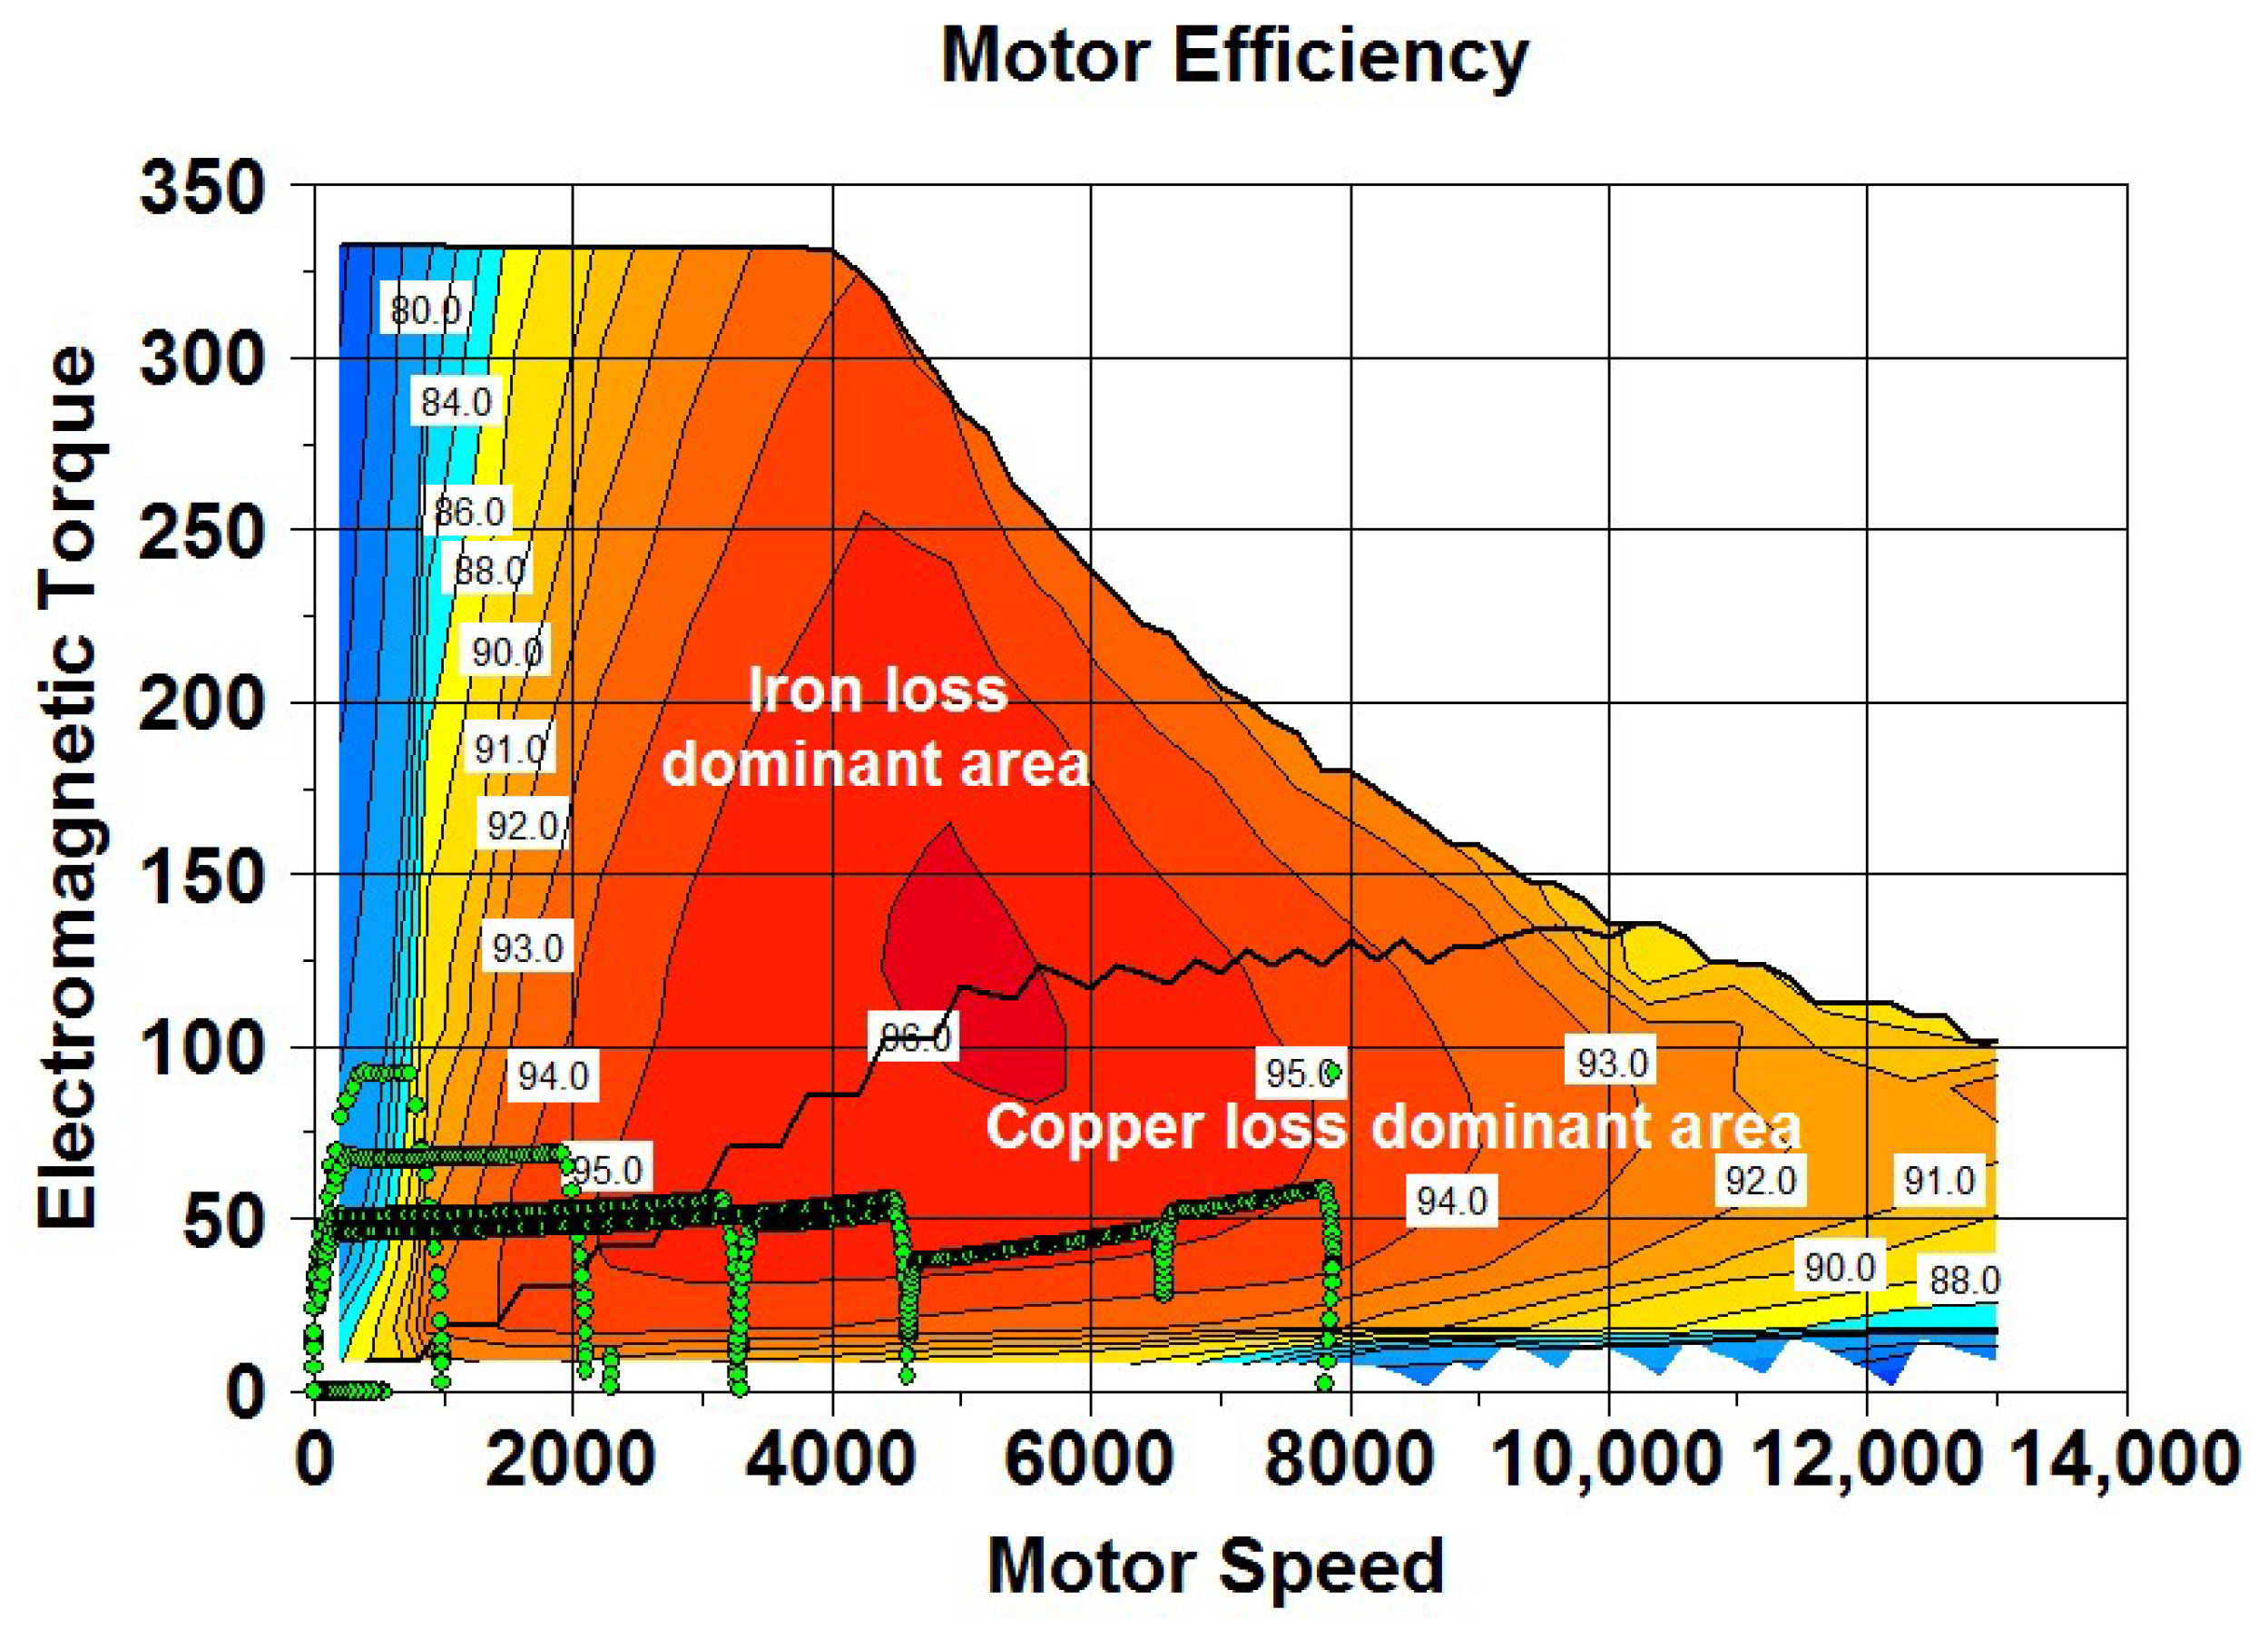
2.2. Motor Loss and Efficiency over Driving Cycle

The power weight is almost same among 3 characteristic points and 4260 rpm 33 Nm is chosen. The loss and efficiency of the motor under different loads at 4260 rpm are theoretically analyzed. Torque 30 Nm is selected as the typical load, and the corresponding magnetomotive force is 960 NA. The efficiency characteristics of the motor change by optimizing the electromagnetic design variables, and the optimal match between the high motor efficiency region and the vehicle driving cycle can be achieved.
P c u = m I 2 R = m I 2 ρ N p h L t u r n a S c u = ρ 2 L t u r n m 2 I 2 N p h 2 Q s A s l o t k f i l l
where m is the number of motor phase, I is the current, R is the coil resistance, ρ is the resistivity of coil, L t u r n is the coil length per turn, N p h is the number of windings in series per phase winding, a is the number of parallel branches, Q s is the number of stator slots, A s l o t is the stator slot area, and k f i l l is the stator slot fill factor [1].
P F e = P h + P c + P e = ( K h f B 2 + K c ( B f ) 2 + K e f 1.5 B 1.5 ) V
where P h ,   P c and P e are the hysteresis loss, and eddy current loss and excess loss of the motor respectively, f is the motor mechanical rotation frequency, B is the magnetic flux density, V is the motor volume. K h , K c and K e are the hysteresis loss coefficient, eddy loss coefficient and excess coefficient of motor core loss, respectively.
P o u t = ω A T = ω A p N p h S B k T * I
where ω A is the mechanical angular speed, T is the output torque of motor, p is the number of rotor poles, S is the pole area, and k T is the toque coefficient.
η = P o u t P o u t + P C u + P F e = k o u t k o u t + k c o p p e r ( N p h I ) + k c o r e / ( N p h I )
where η is the motor efficiency, P o u t , P C u and P F e are the output power, copper loss and core loss of motor respectively, k o u t , k c o p p e r and k c o r e are the coefficient of the P o u t , P C u and P F e , respectively.
For electric vehicle motor, when the motor works near the base speed point, ignoring the mechanical loss, it can be approximately considered that the iron loss is constant loss, and the copper loss is variable loss. When the copper loss is equal to the iron loss, the efficiency reaches the maximum. In the design of electric vehicle motor, the copper loss is generally equal to the iron loss at the base speed point, the copper loss in the low-speed area is greater than the iron loss, and the iron loss in the high-speed area is greater than the copper loss as shown in the Figure 5 [2,3].

3. Multiobjective Optimization of Traction Motor

3.1. Select of Multiobjective Optimization Algorithm

The derivation of optimization algorithm is mainly divided into three levels. The first is the public algorithm such as multiobjective genetic algorithm (MOGA), multiobjective simulated annealing algorithm (MOSA), etc., the next is the improved optimization algorithm such as MOGA-II which the optimization speed is better, and the last is the new optimization algorithm developed by major optimization software developers, which has better optimization speed.
All the optimization algorithm based on the first level. The first level algorithm mainly includes global optimization algorithm and local optimization algorithm. MOSA is suitable for global and approximate global optimization with simple structure and no need too precise for initial selection points. However, the spatial search ability of MOSA is weak and the sampling times are large which lead the optimization process takes long time. MOGA is a general self-adaptive algorithm with randomness and intelligence. The algorithm performs the process of selection, hybridization, and mutation repeatedly as shown in the Figure 6. Because of the less optimization design constraints, it is suitable for global optimization, but the local search speed is slow [4]. The difference between particle swarm optimization and genetic algorithm is no crossover and mutation, and it is relatively simple to search the global optimal solution by following the current optimal value. However, the algorithm cannot achieve real optimization for the fitness value is much higher than the average value of the current population in the early stage of the algorithm, also is known as premature convergence [5]. Differential optimization algorithm is different from genetic algorithm mutation. It achieves rapid convergence by comparing the difference and searching for the minimum disturbance value randomly. The adaptive ant colony algorithm has weak spatial search ability and long optimization process. Taguchi method is an excellent optimization algorithm which differ from the local optimization algorithms such as magnetic network method, simplex method and mountain climbing method as shown in the Figure 7. The algorithm can greatly reduce the number of experiments by using orthogonal experiment [6]. It is suitable for multiobjective optimization while it has fast convergence speed. However, the algorithm is not suitable for global optimization algorithm for it is especially dependent on the selection range of initial points. The hybrid optimization algorithm of Taguchi method and genetic algorithm combines the local optimization ability and the global optimization ability. It not only overcomes the shortcomings of Taguchi method for the global optimization, but also solves the slow convergence of genetic algorithm.

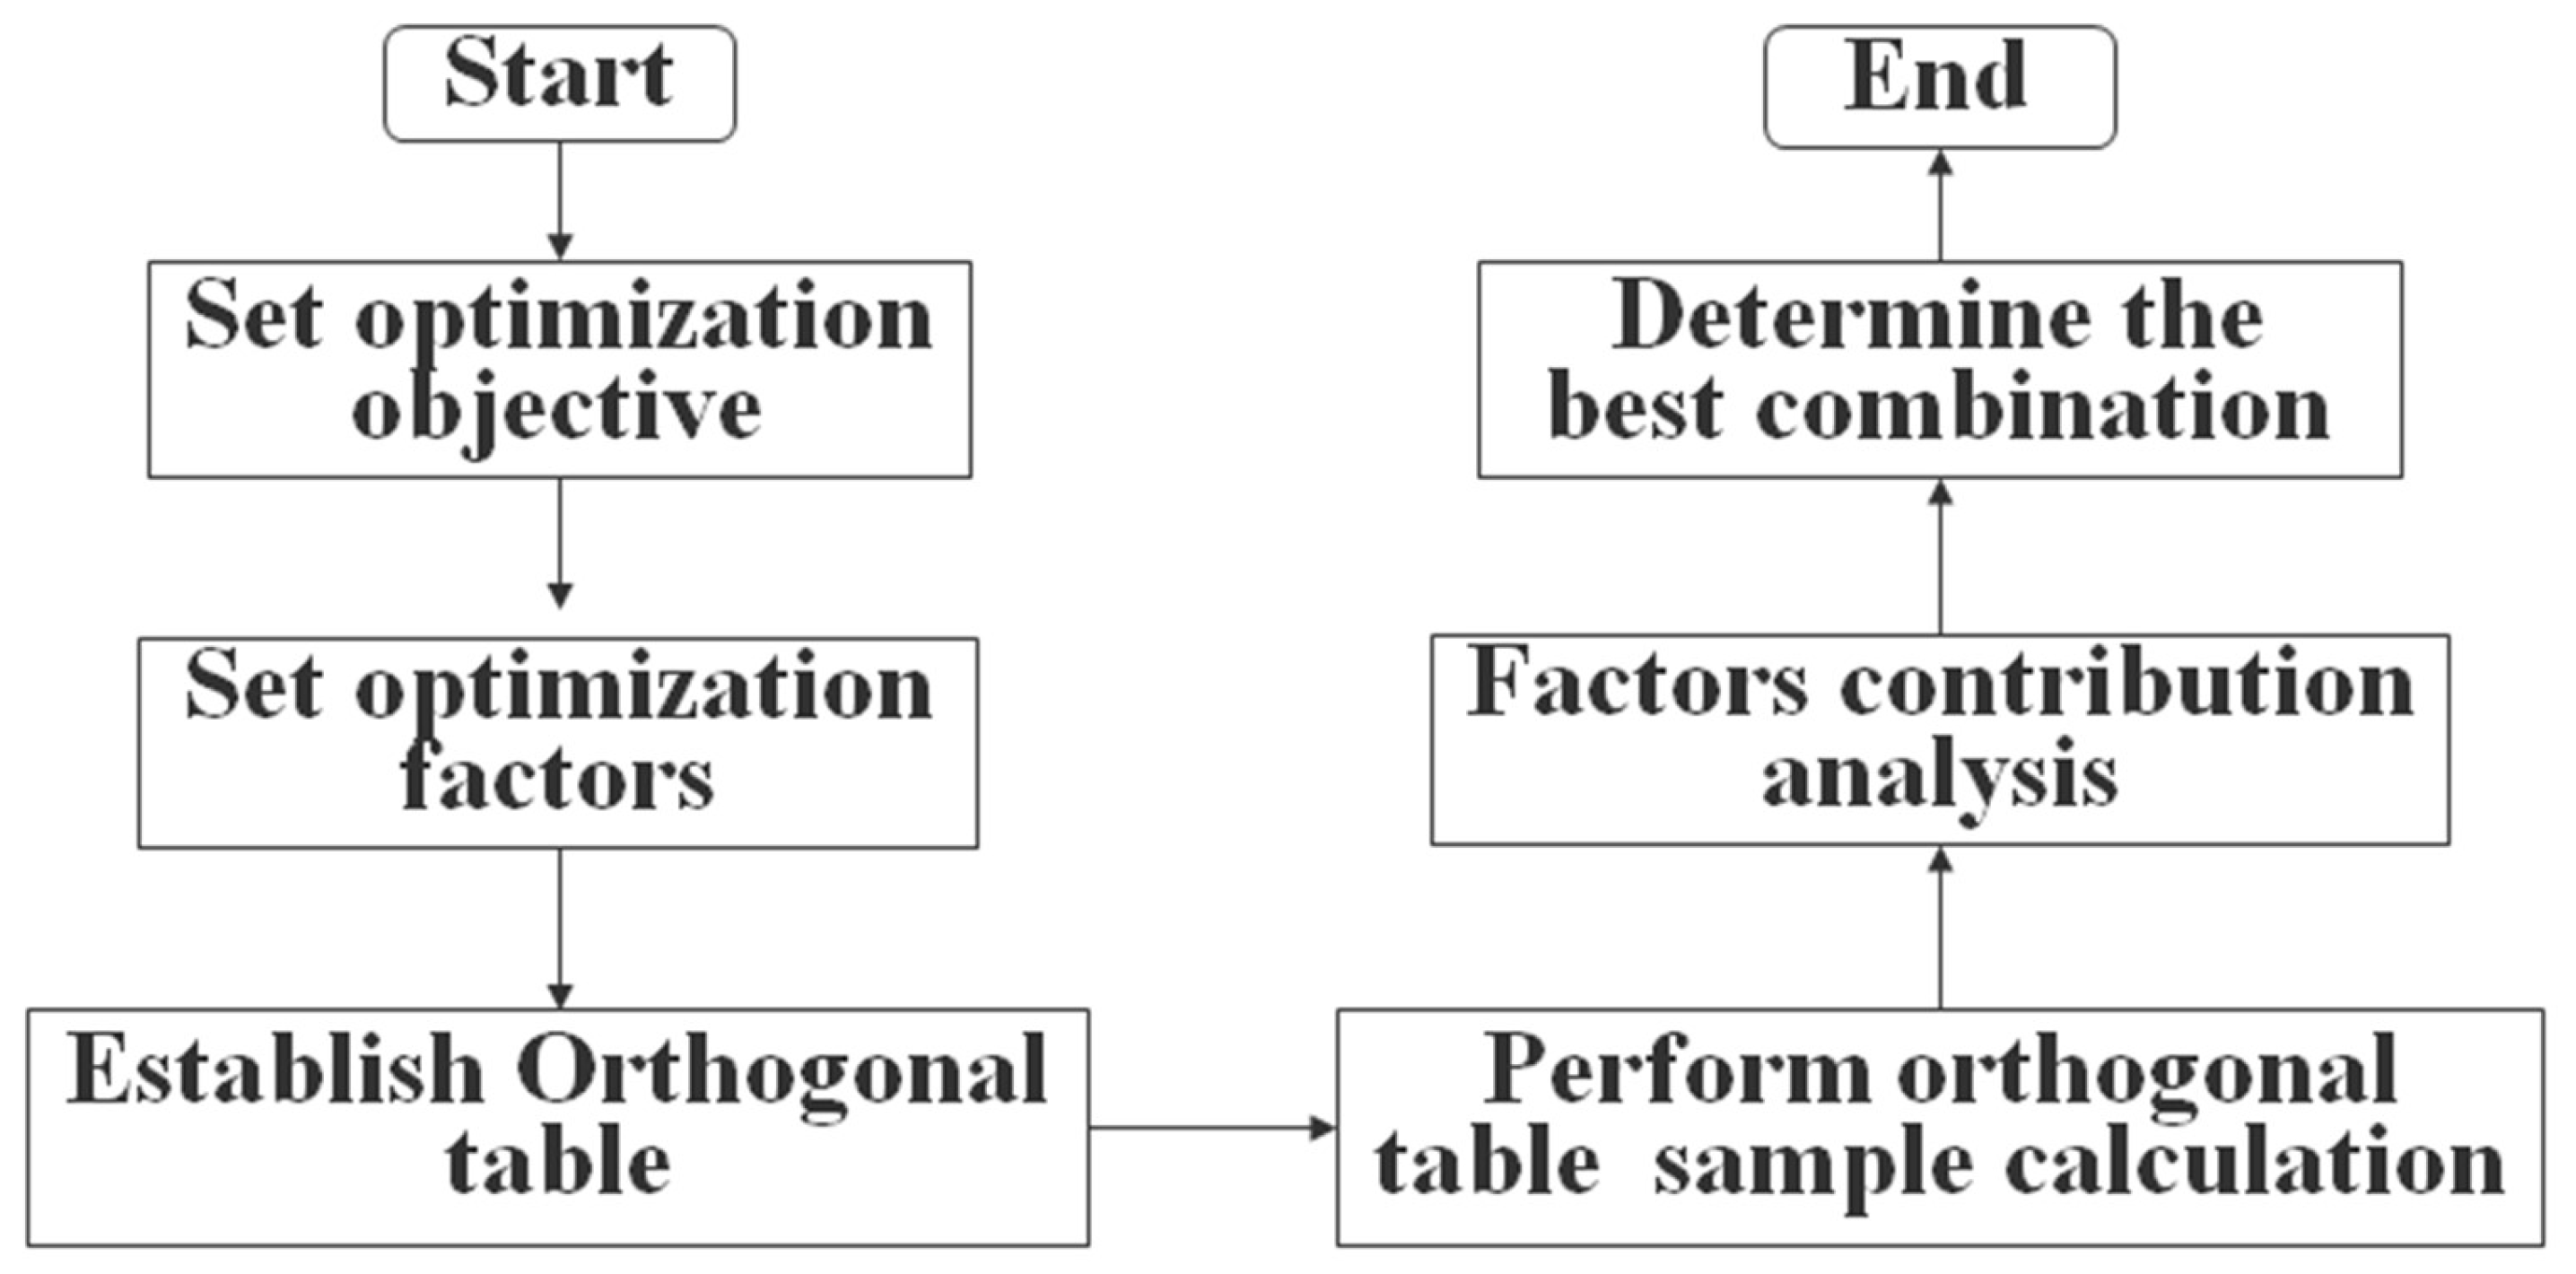
3.2. Construction of Optimization Process

For the application of motor working conditions efficiency optimization, there is no interaction between different working conditions. To improve the efficiency of algorithm optimization, this paper adopts a multi strategy adaptive algorithm, which combines the advantages of local search and global search and balances the relationship between the real optimization of Pareto front search and the virtual optimization based on response surface in an intelligent way. Even when dealing with complex output functions and constraints, it provides excellent performance. So, it is usually recommended for multiobjective problems.
The selection of optimization objectives is important, and the main traction motor performance requirements are determined by vehicle requirements and traction motor product positioning. Based on the project requirements of this paper, the objectives of the optimization process are followed:
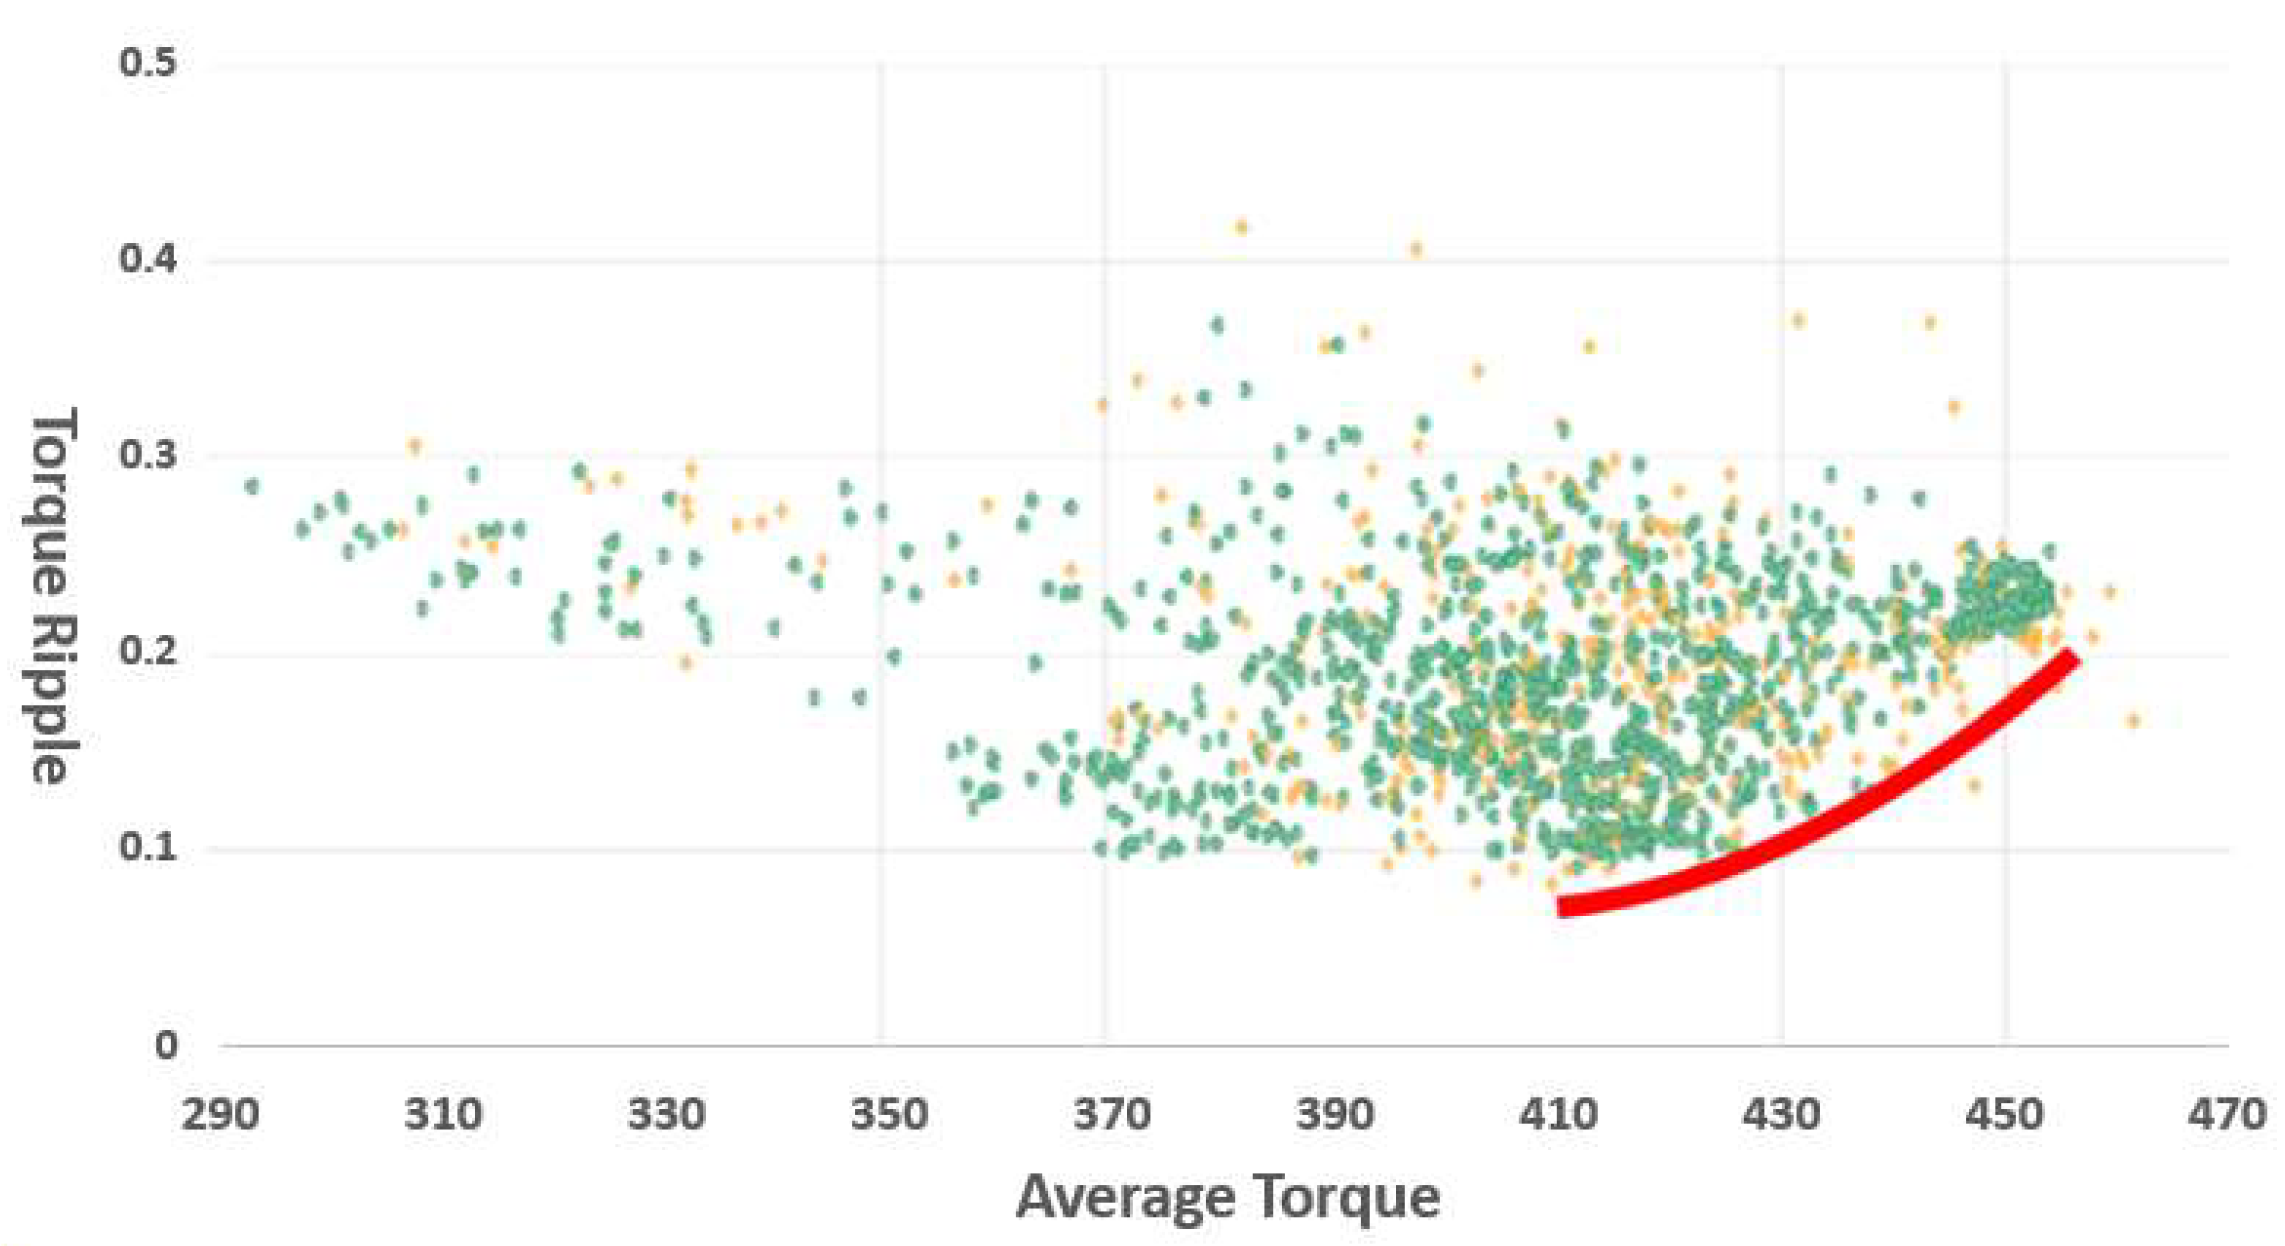
  • Maximize the motor torque. Torque represents motor power and vehicle acceleration. Under the same current condition, the torque per unit volume of the motor represents the torque density of the motor and the cost advantage of the motor.
  • Minimize the torque ripple. Motor torque ripple affects motor power output stability, which is caused by the harmonic of the motor magnetic field. Small harmonic content is beneficial to the performance of motor [7].
  • Maximize the operating efficiency of motor. The efficiency of motor working condition can be obtained by processing the efficiency of three typical working points of equivalent conversion. The higher efficiency of the motor, the lower energy consumption, and the higher driving range.
  • Better motor NVH performance. NVH noise comes from the radial electromagnetic force of the motor. The excitation source of the motor can be reduced by reducing the order harmonics of the main electromagnetic force which is beneficial to suppress the noise of the motor.
It is important to select appropriate optimization factors for they have a decisive impact on the optimization results in the optimization process and are the key in the whole optimization process. The performance of the electric drive is related to the parameters of the stator and rotor, while it is difficult to take all the geometric parameters as the input variables of the optimization process considering the workload and calculation time of the whole optimization. So, the optimization factors selection should satisfy the following principles:
  • The number of optimization factors should be suitable. With the increase of optimization factors, these factors are arranged and combined with each other, and all possible processes grow exponentially. The amount of optimization calculation is huge, the optimization results are difficult to converge. However, if the selection of optimization factors is not comprehensive, the process will be optimized in a local area.
  • The optimization factors are independent. Ensure that they do not affect each other.
  • The optimization results are closely related to the selected optimization factors, and there is an optimal combination of optimization factors to achieve the optimization objective.
  • The value of the optimization factor should be suitable. The geometric dimension will interference and the majority of models is wrong in the process if the range is too large. Meanwhile, if the range is too small, the optimal result is local.

3.3. Rules of Multiobjective Optimization Methods

The motor multiobjective optimization algorithm is a method used to analyze, process, and iterate based on finite element analysis (FEA), while the optimization process needs repeated iteration and thousands of FEA calculations are required, which takes more time. Therefore, response surface methodology (RSM) [8] needs to replace the FEA calculation model to reduce the optimization time.
The following rules should be followed to establish the response surface (RSM) algorithm based on iterative results:
  • The optimization objective must be transformed into a mathematical model, and the relationship between the optimization objective and the optimization factor can be concluded by calculation function.
  • The results of iteration should be accurate, and the assumptions and the calculation boundary should be consistent.
  • The sampling data is not allowed to be extrapolated, and the sampling points should be evenly distributed.
  • Sampling points should be random.
The rules can characterize the relationship between the optimization results and the optimization factors well, and greatly shorten the calculation time although the RSM established has no physical meaning. In addition, the RSM model based on the test can be used to predict the results. Facing the complex and time-consuming computing situation, the feasibility of optimizing process can be greatly improved by replacing RSM model, which can be used in the coupling of multiple physical fields optimization [9].

4. Multiobjective Optimization Design

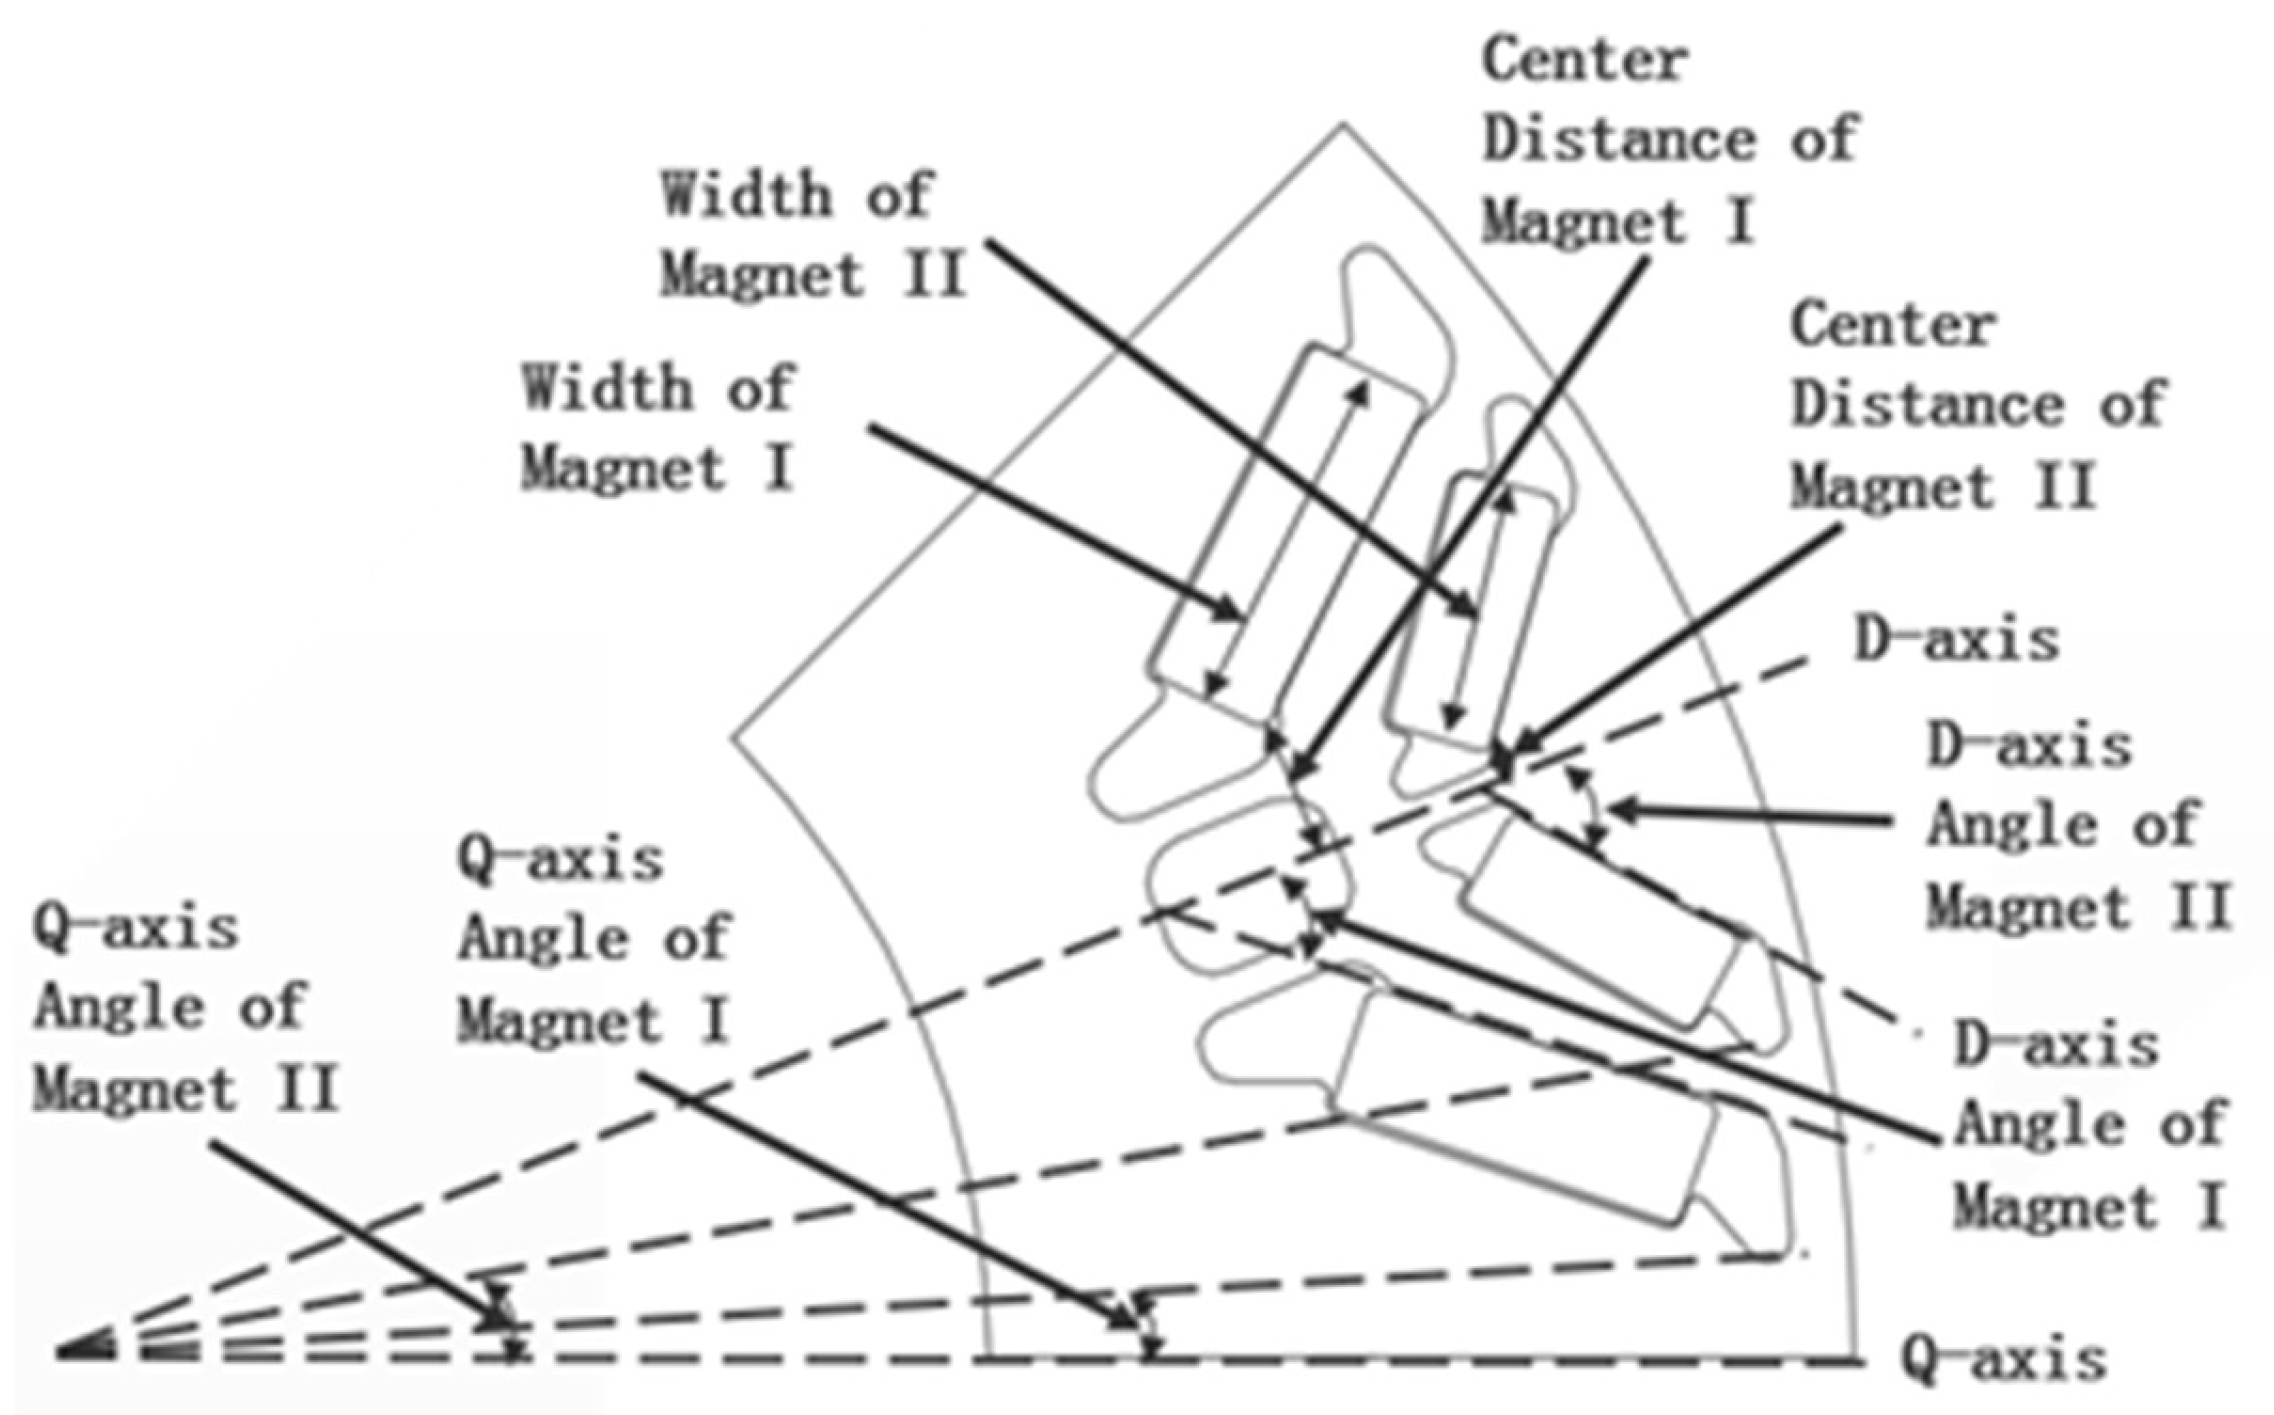
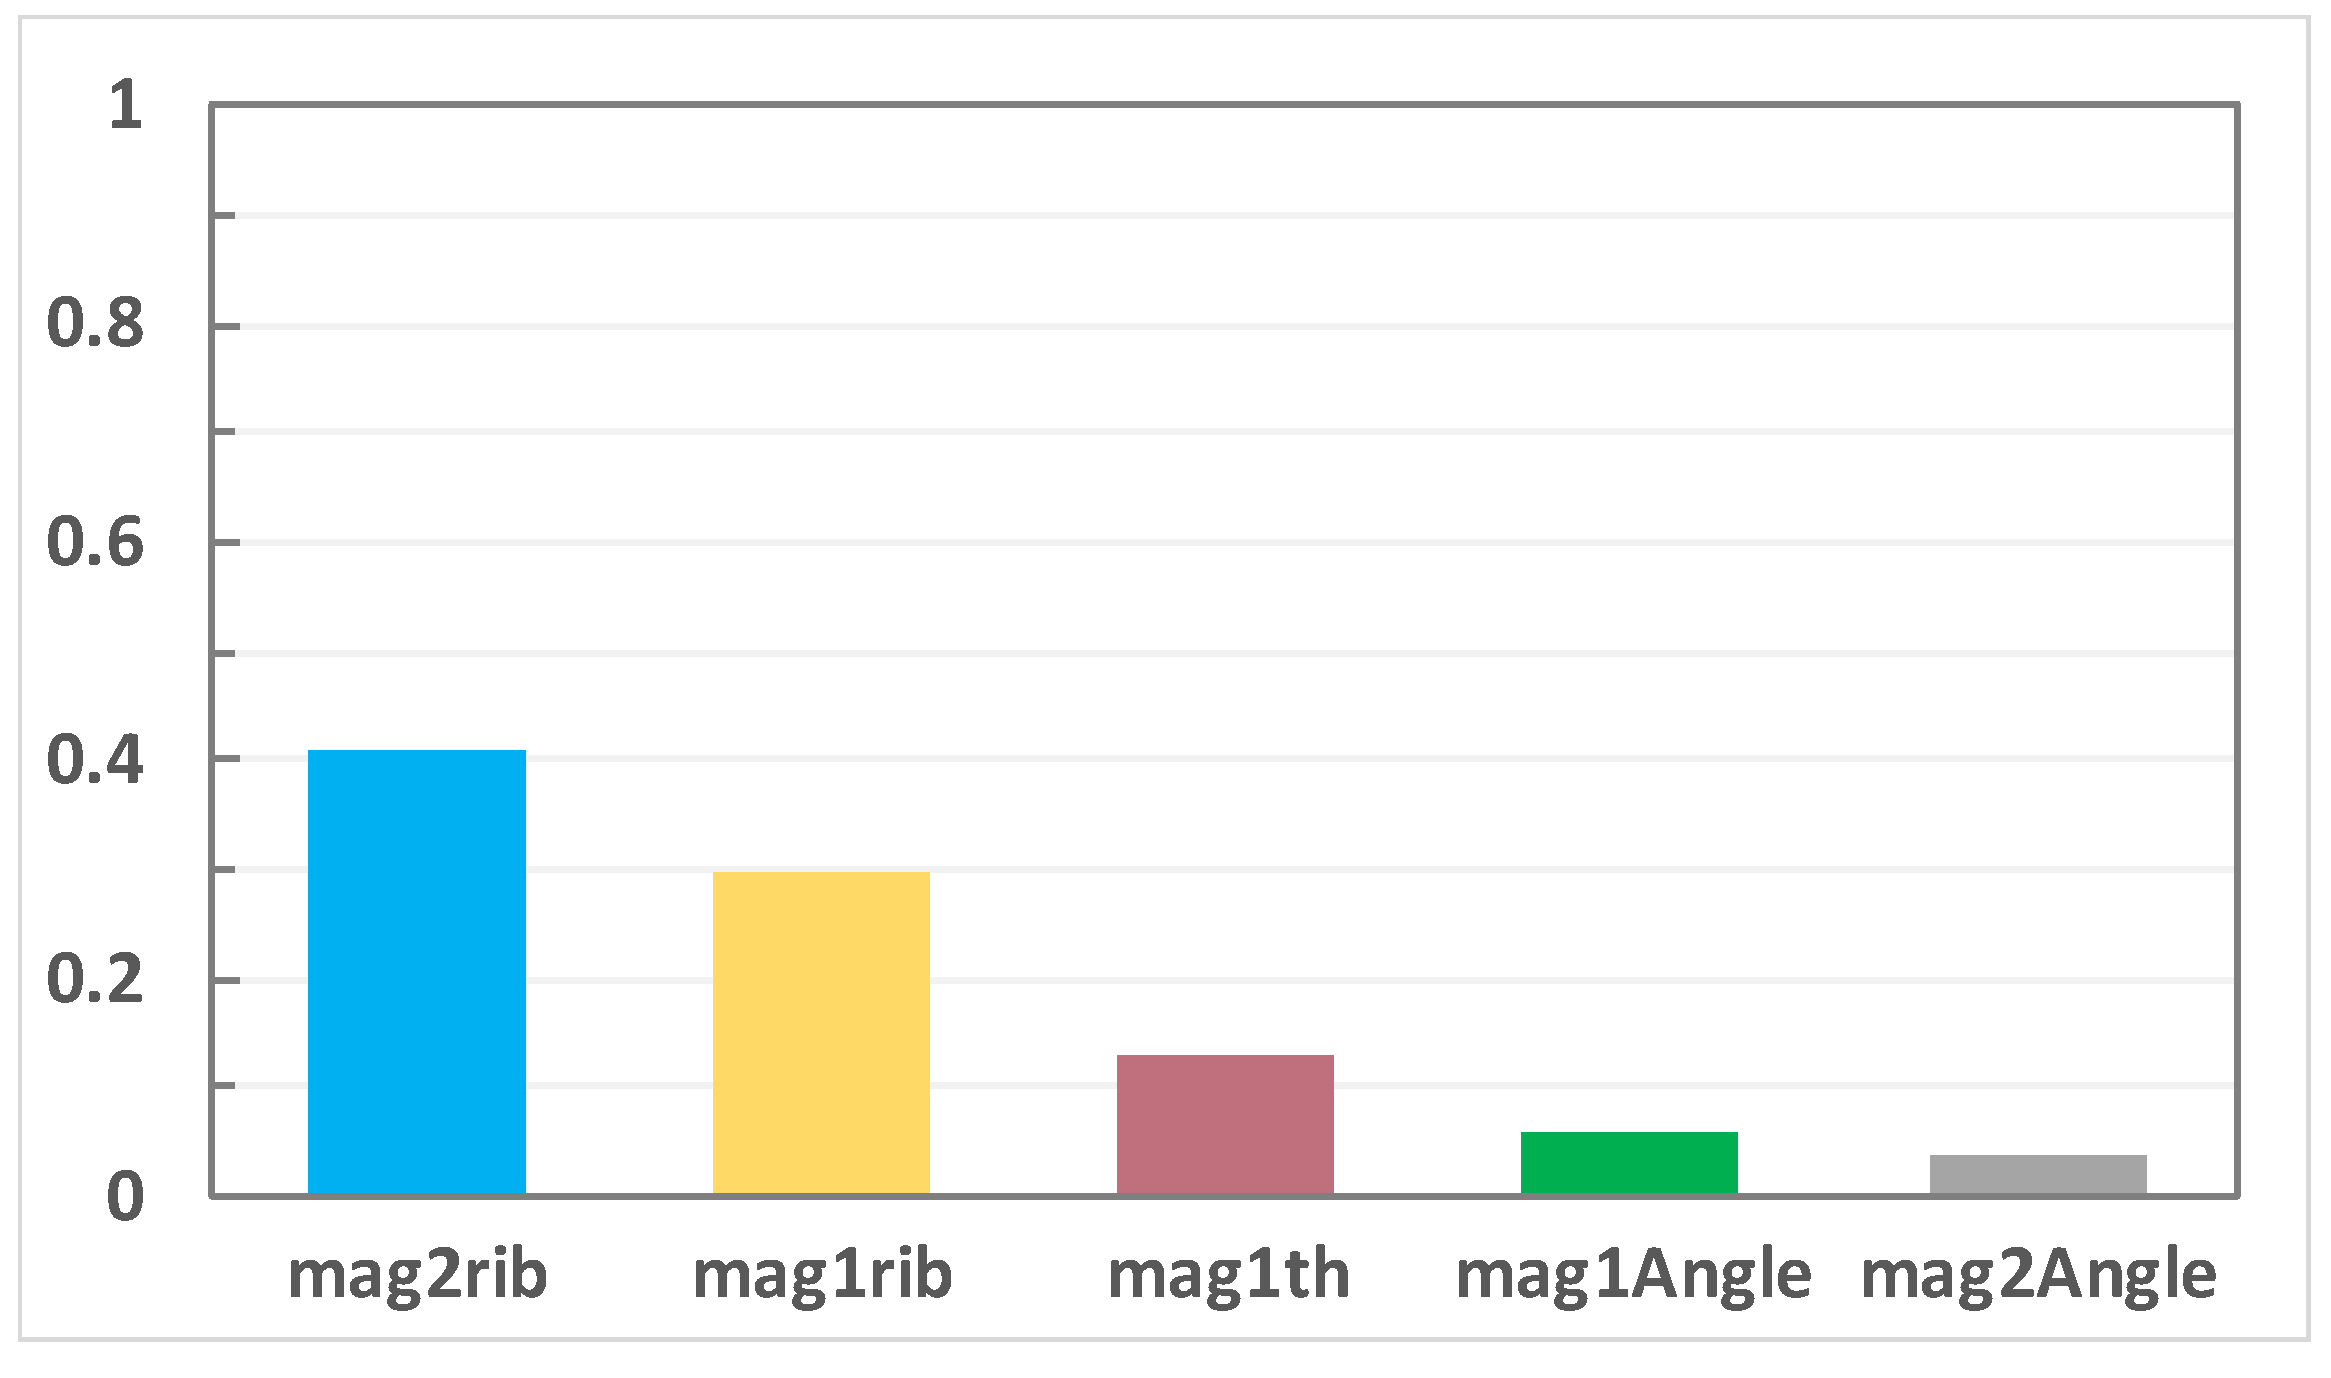
4.1. Optimization Factor

A motor is designed based on the performance requirements which are defined in Table 4. The parametric model of rotor is shown in Figure 8, which is a double-layer V-shaped magnetic structure, including motor parameters with the angle between magnet and D-axis and Q-axis, the magnet width, the air gap size, and the rotor outer diameter. The optimization factor value range is shown in Table 5. The optimization process obtains different rotor magnetic structure via the combination of parameters and expend the optimization space.
According to the above design parameters, the following principles should be satisfied when establish rotor structure:
  • Ensure that no interference between two layers magnet;
  • Ensure that design parameters are independent;
  • The value of design parameters in a reasonable range to ensure the optimization space;
  • Avoid the parametric combination against the principle of electromagnetic field theory.

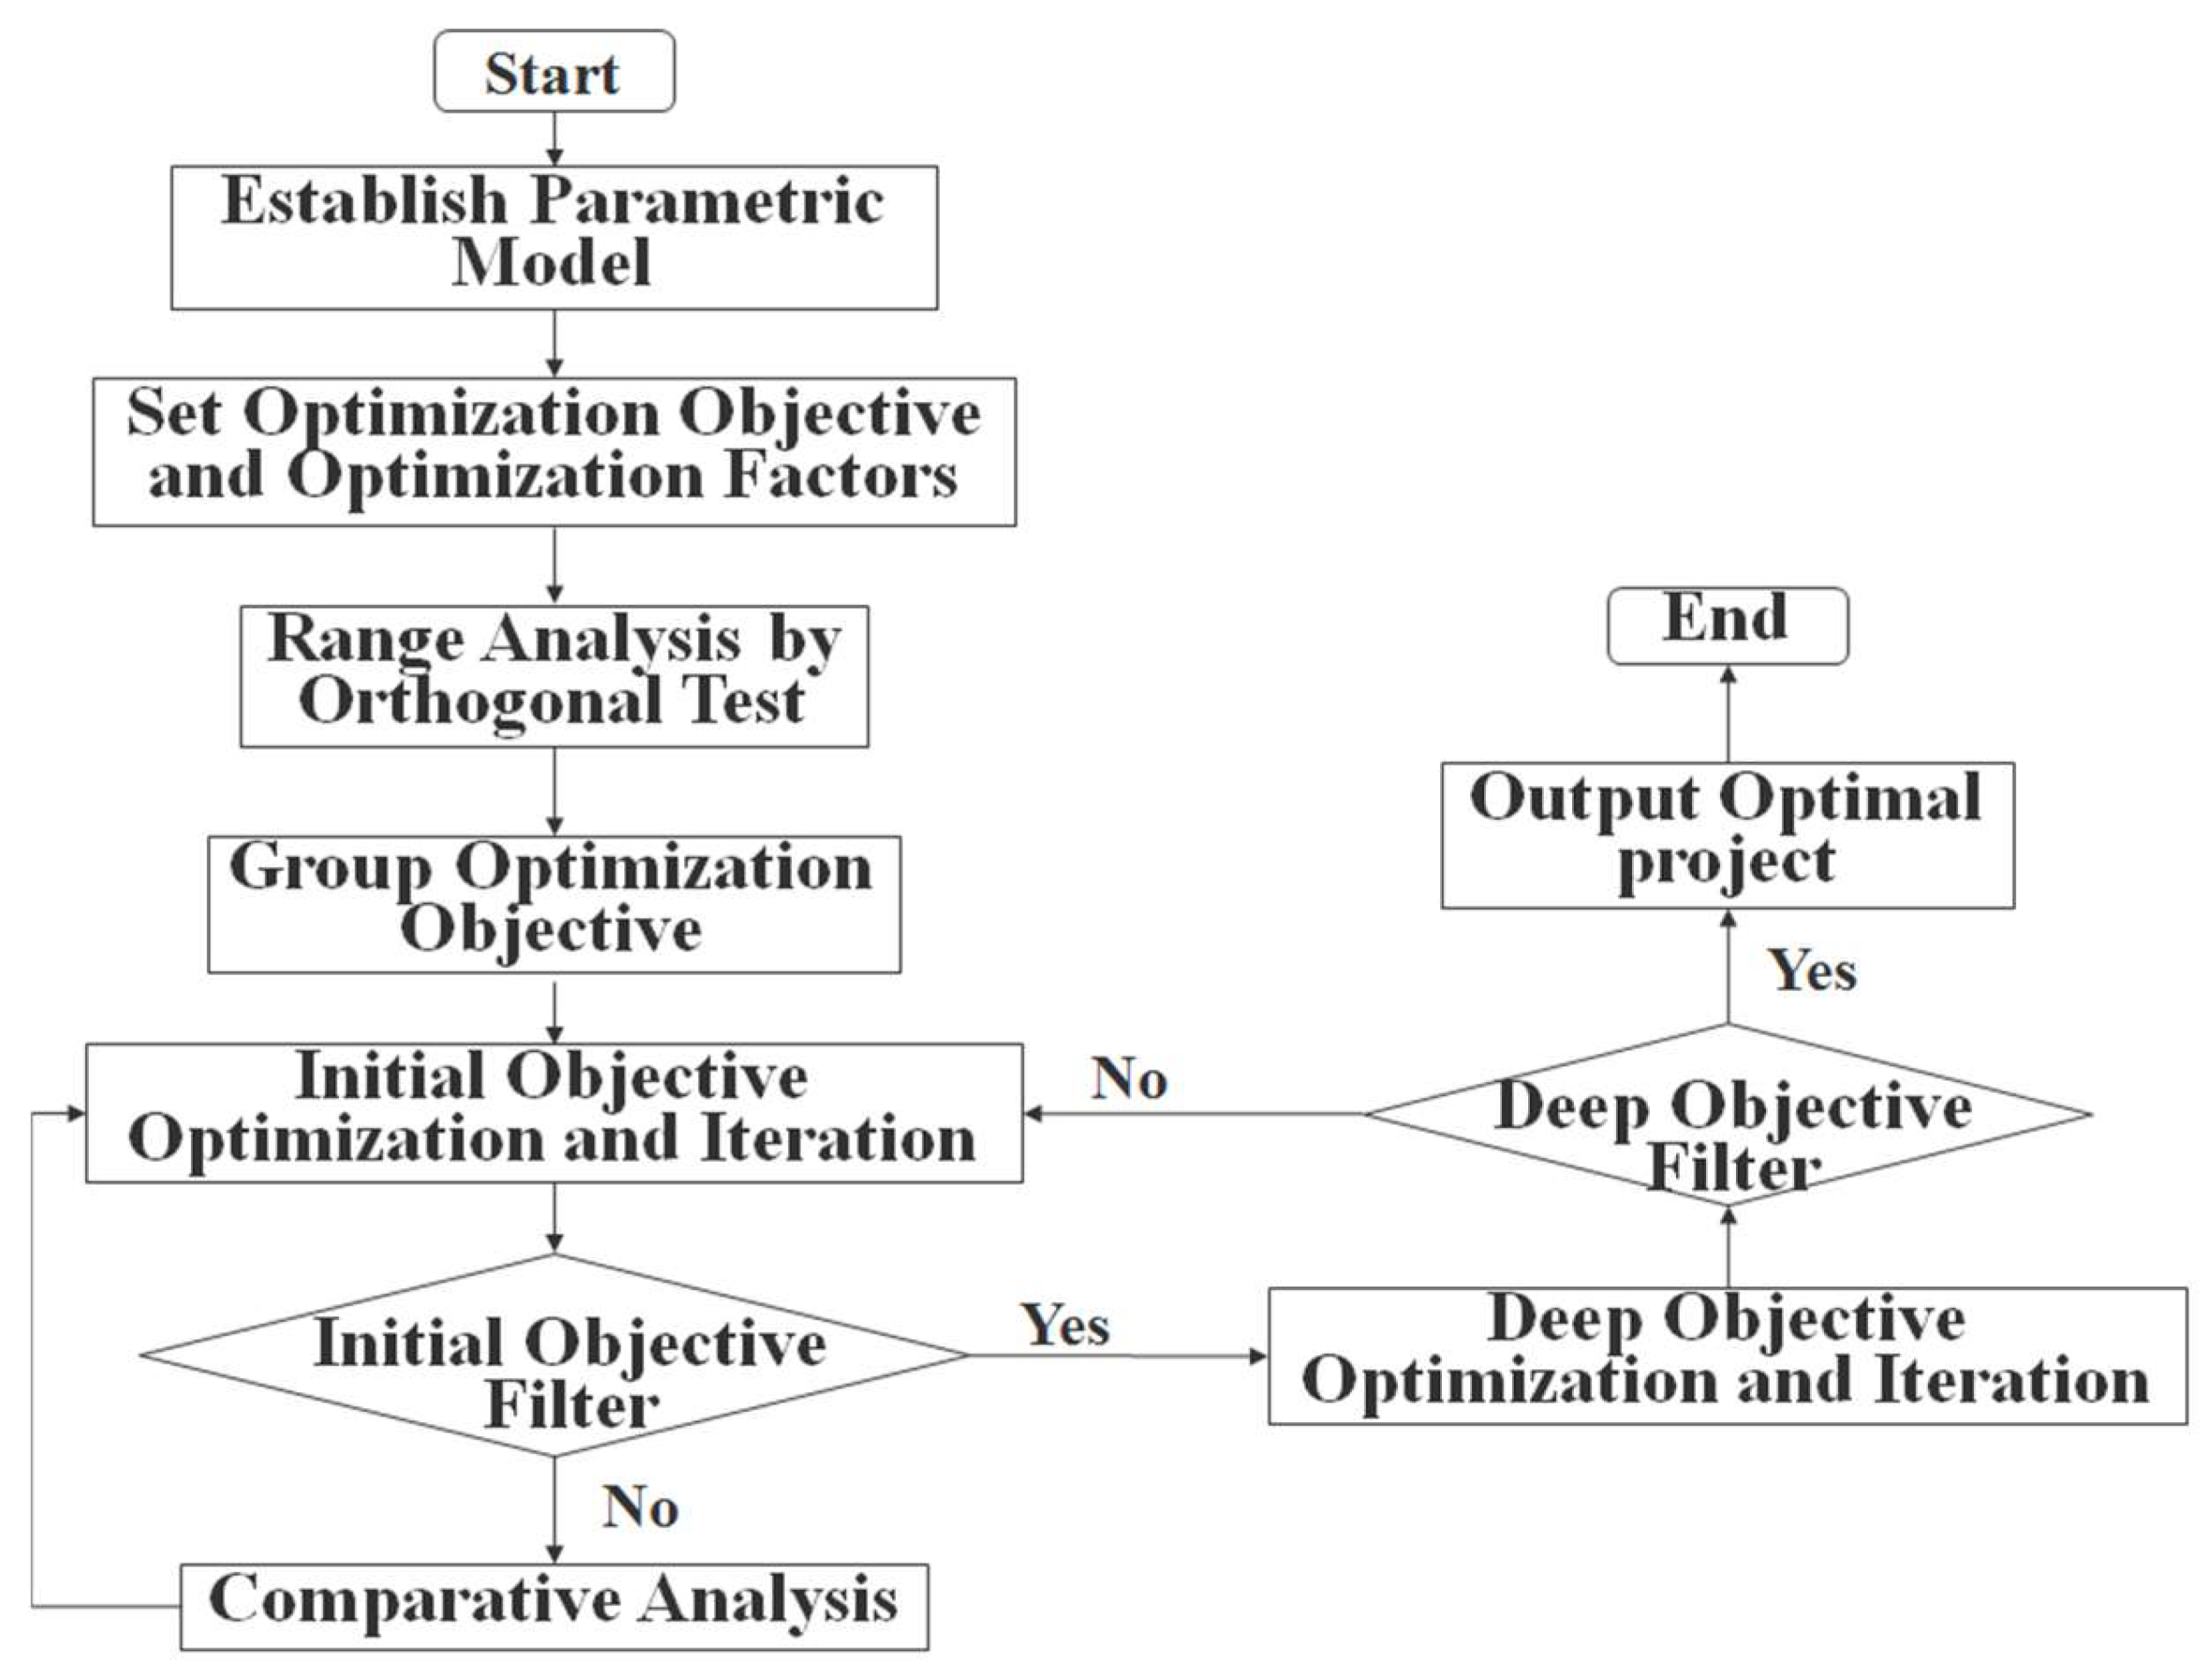
4.2. Optimization Flow

Firstly, confirm the range of each optimization factor by orthogonal test to determine the appropriate optimization factors and value. Then group the optimization objectives including initial optimization objectives and deep optimization objectives. The initial optimization objectives are the output torque, torque ripple, no-load back EMF peak to peak and cogging torque. The process that the initial optimization objective satisfies can be further optimized. The deep optimization objectives include working efficiency and harmonic content of electromagnetic force in typical working conditions. To meet the requires of both the initial optimization goal and the deep optimization goal, the optimization process iterates repeatedly. It will not stop until the process convergences to the best performance or reaches the calculation times. The multistrategy adaptive optimization algorithm flow is shown in Figure 9. If the algorithm fails to converge or to find the optimal performance process for a long time, it is important to change the optimization space by expanding the optimization factor range and changing the optimization factors.

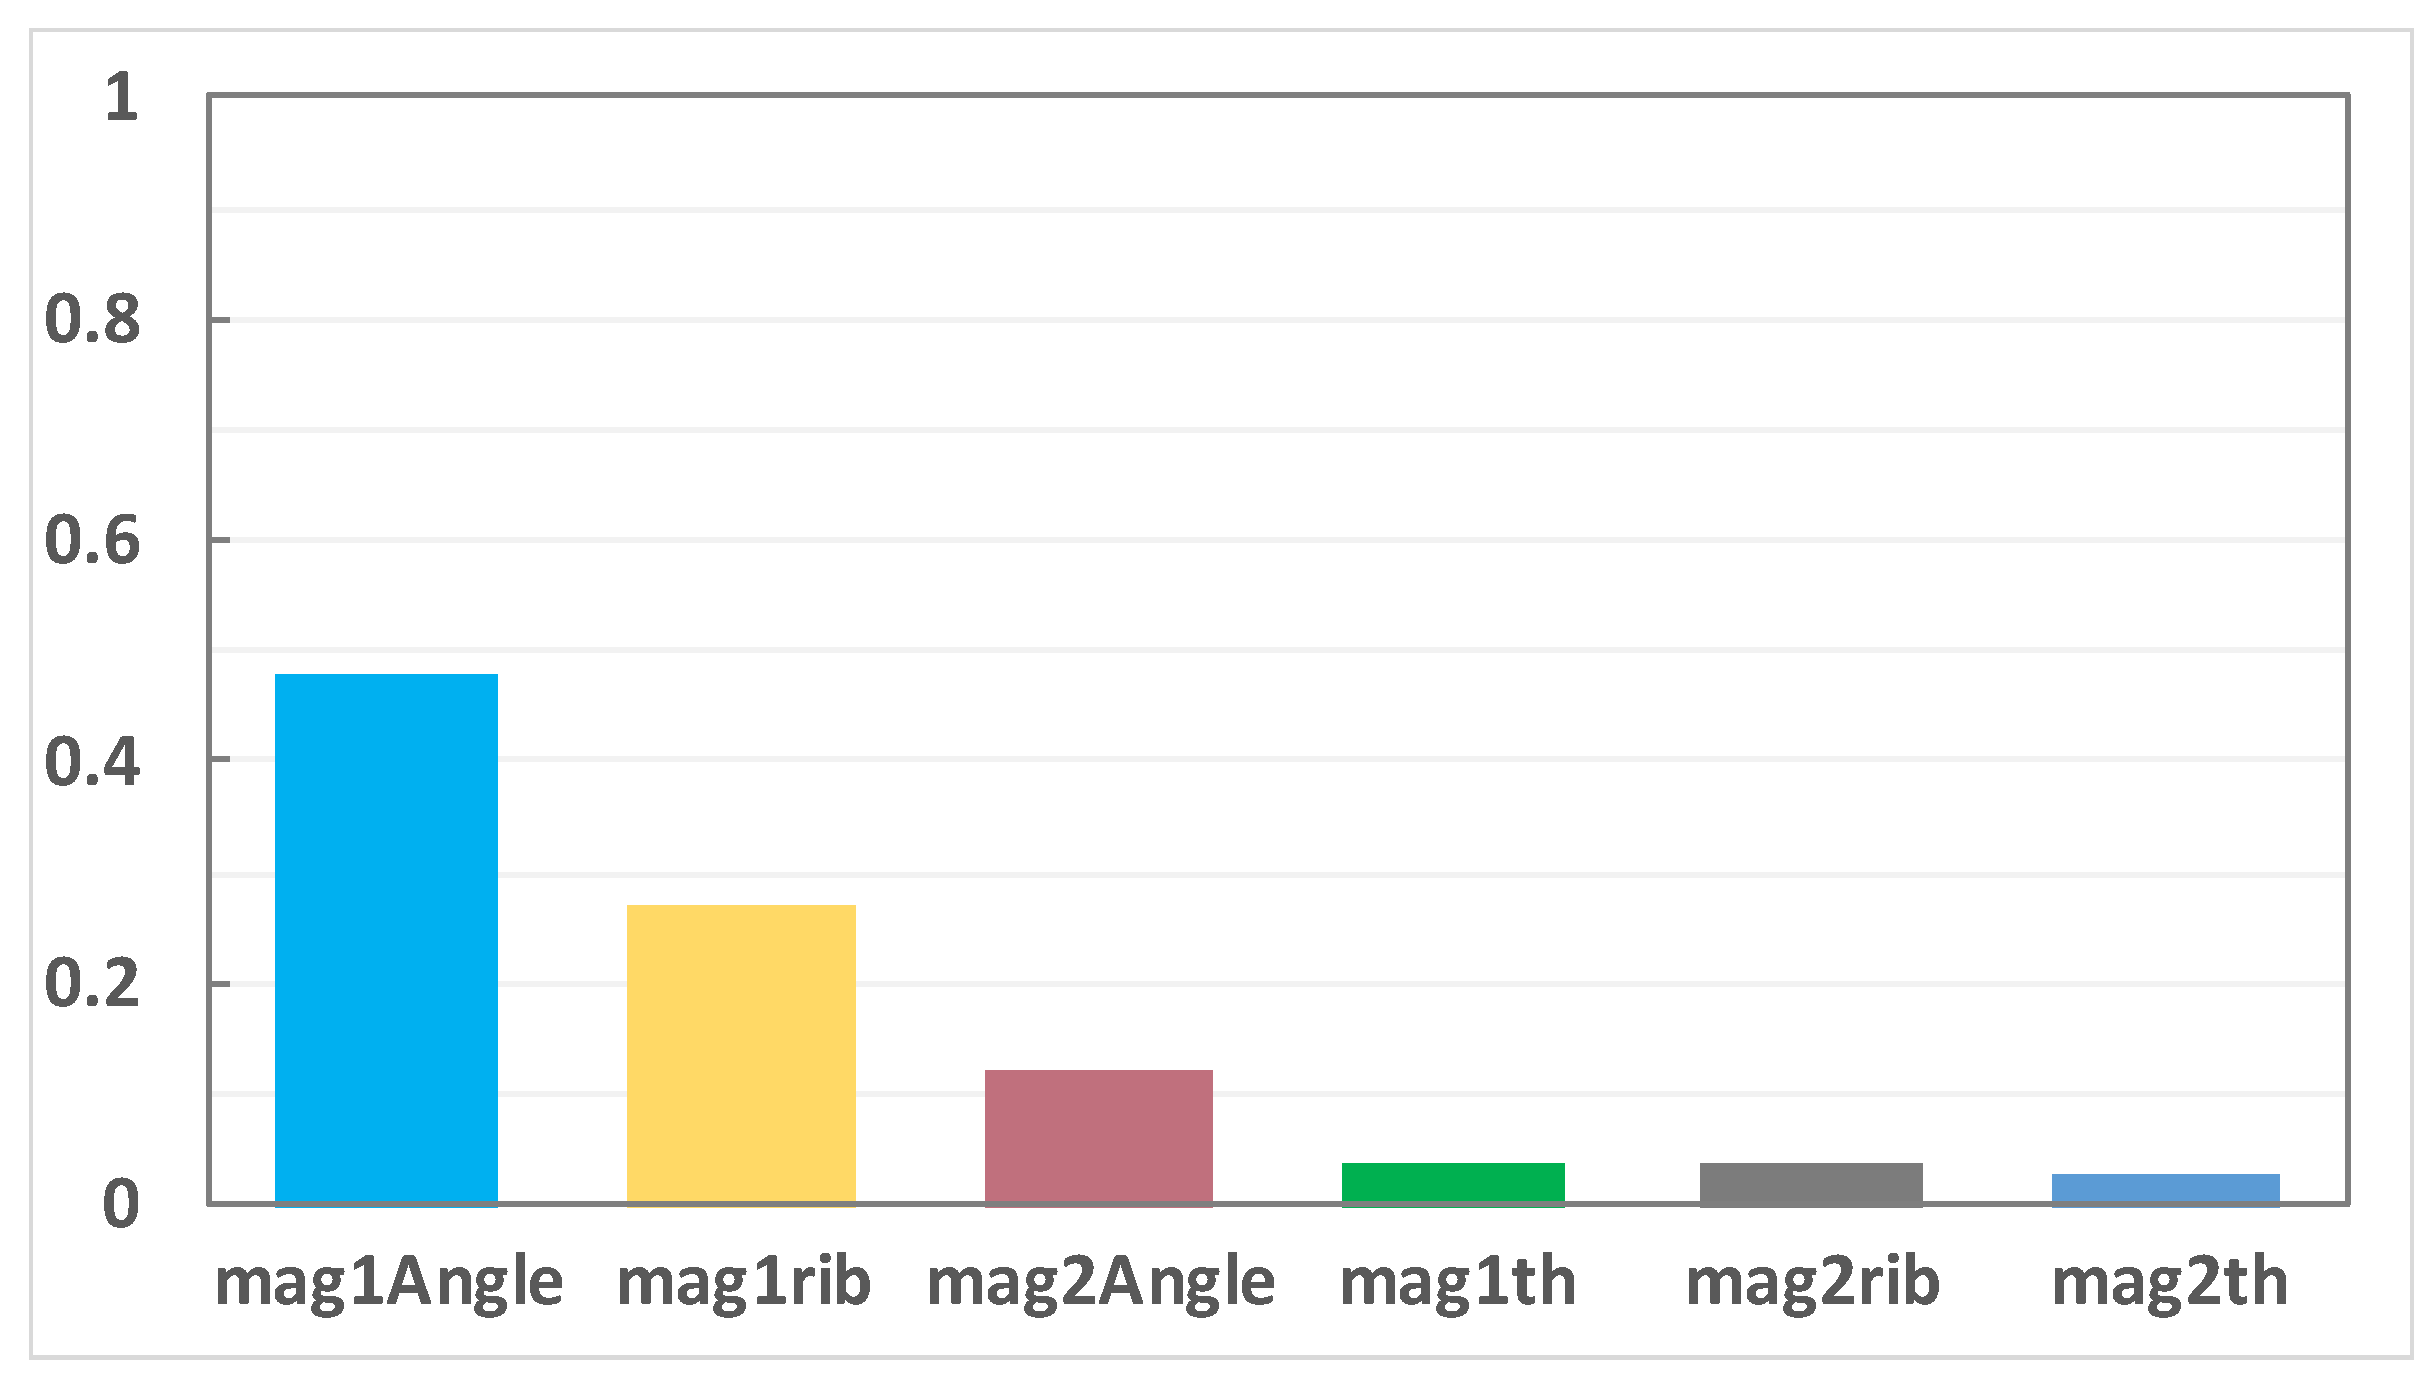
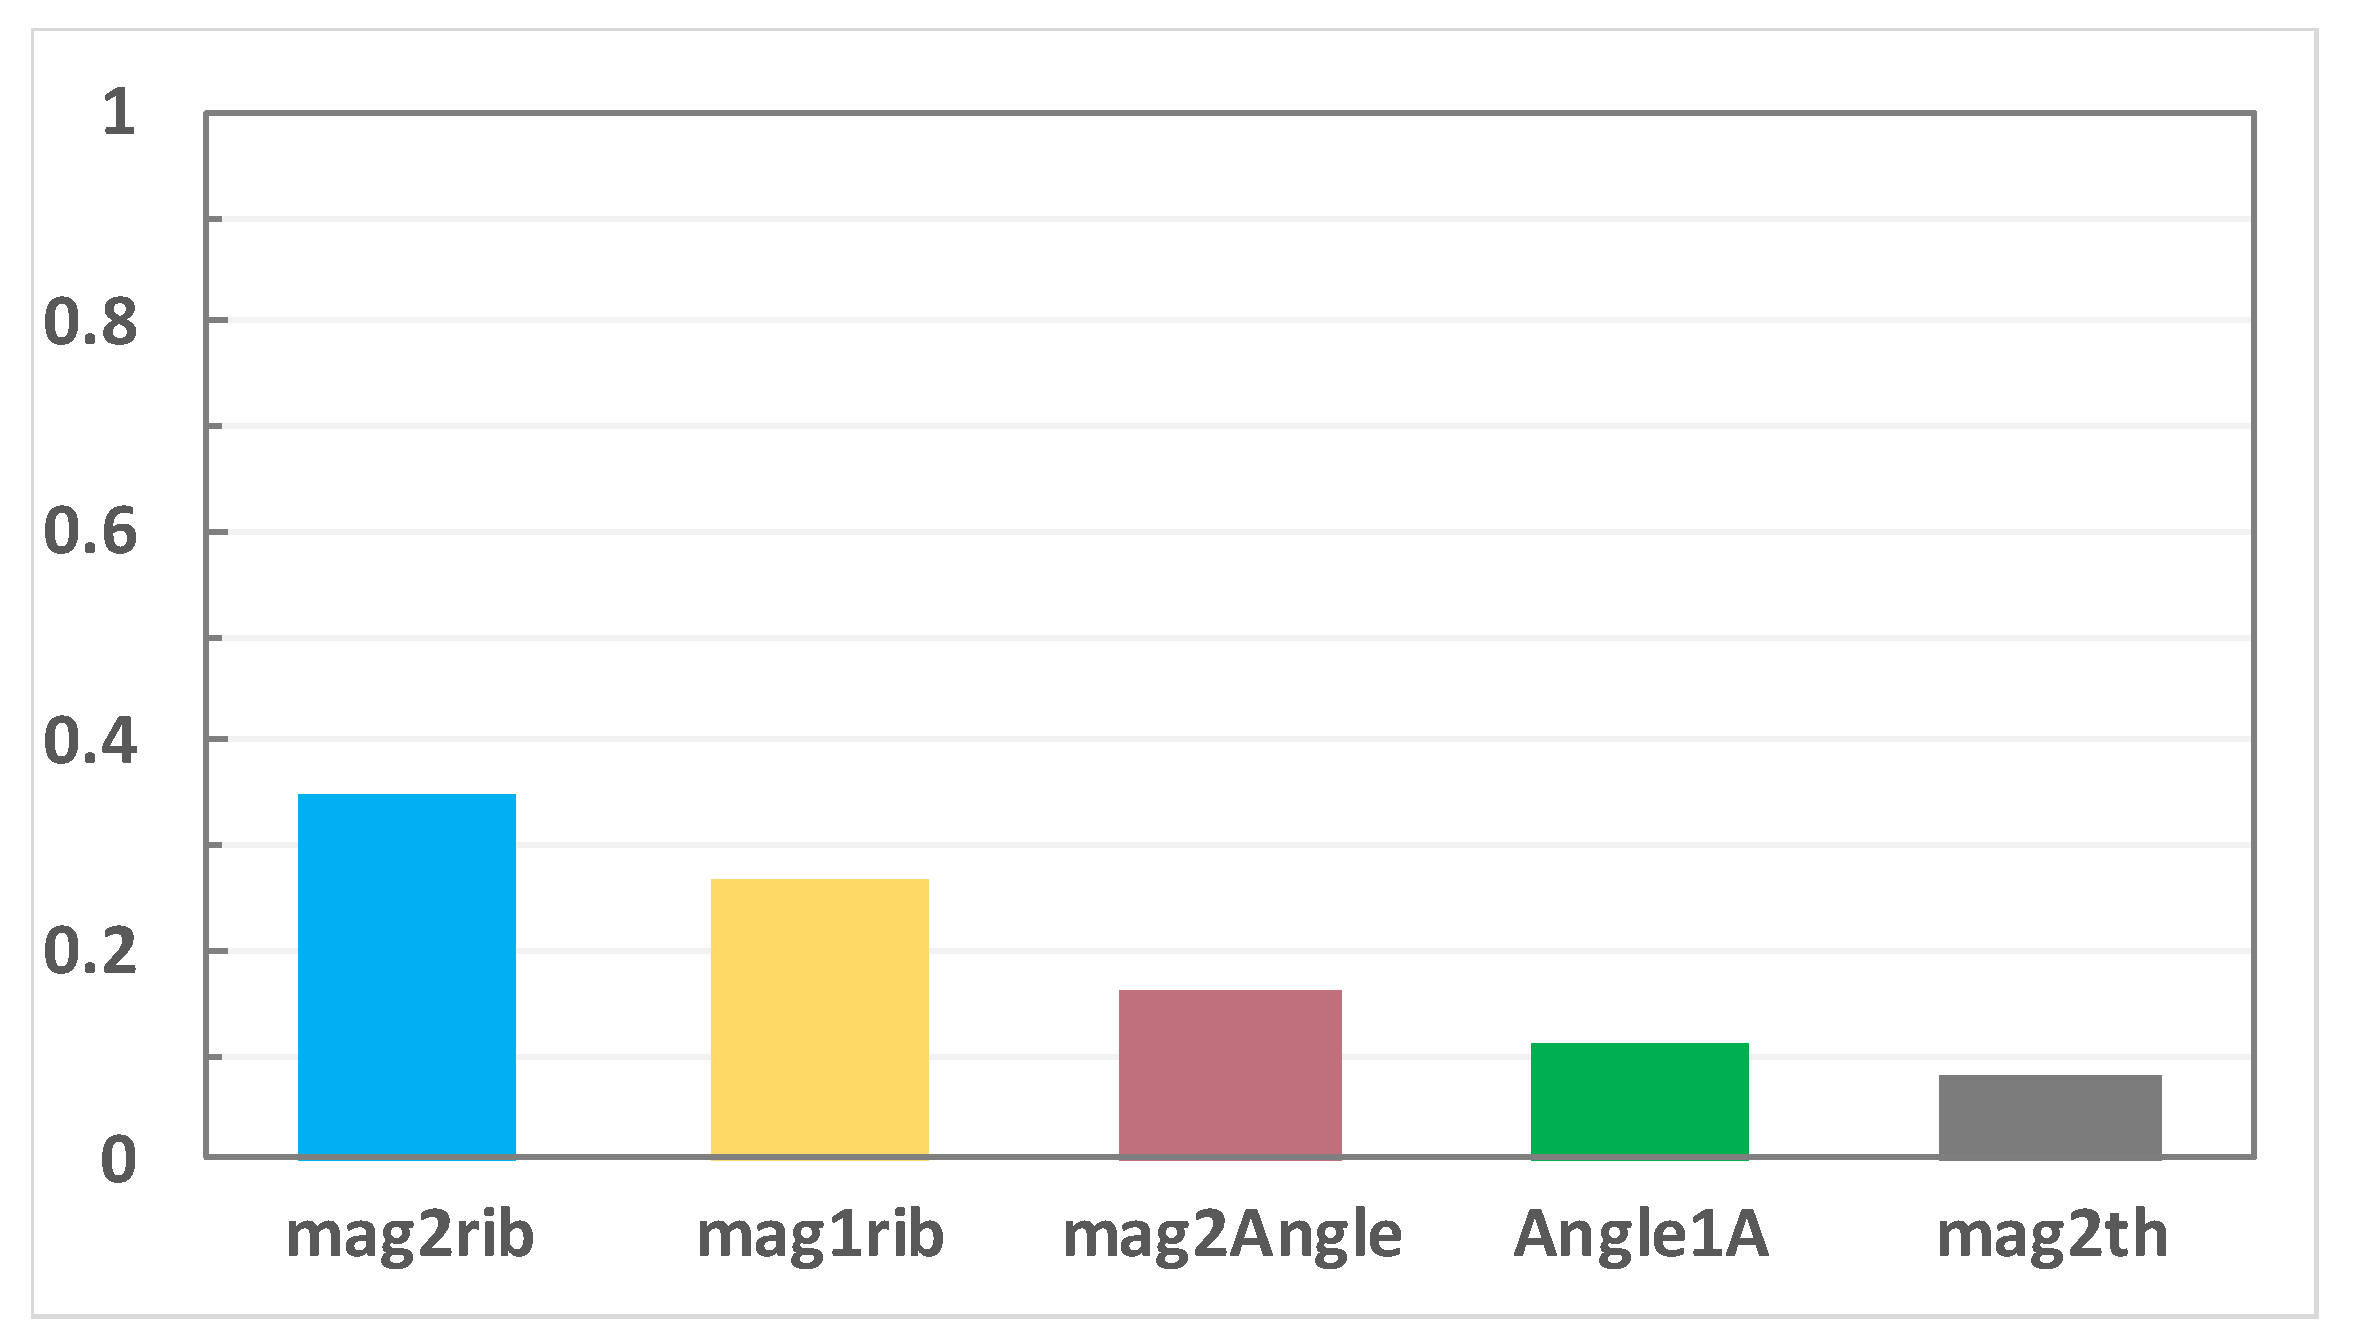
4.3. Evaluation of Optimization Result

Analyze the contribution of optimization factors to design objectives including average torque, torque ripple and 48th electromagnetic force, and confirm the optimization factor and weight. The sequence of the optimization factor contribution on the average torque from high to low is: D-axis Angle of Magnet I, Q-axis Angle of Magnet I, D-axis Angle of Magnet II, the sequence of the influence on the torque ripple is: Q-axis Angle of Magnet II, Q-axis Angle of Magnet I, D-axis Angle of Magnet II, and the sequence of the contribution on 48th electromagnetic force is: Q-axis Angle of Magnet II, Q-axis Angle of Magnet I, Width of Magnet I as shown in the Figure 10, Figure 11 and Figure 12 respectively. Y-axis represents the contribution of x-axis variables to torque, torque fluctuation and 48th order electromagnetic force, without unit. The larger the value, the greater the influence of x-axis variables on the optimization results. This makes the optimization analysis more clearly, especially the selection of optimization factors and the corresponding relationship between optimization objectives and optimization factors.
Multiobjective optimization algorithm includes more than two optimization objectives, which has mutual coupling effect, different from traditional objective optimization. The average torque and torque ripple are two relatively independent optimization objectives. In the optimization process, the results which do not meet the performance requirements cannot be judged by direct screening and sorting of big data, such as high average torque while large torque ripple and small torque ripple while low average torque. Traditional optimization process analyzes optimal objectives separately and combines the multiple objective functions by single superposition. If the coupling degree between objectives is deep, it cannot be optimized respectively. For complex multiobjective optimization process, it is necessary to make a Pareto evaluation on the optimization objectives of motor [10]. The process with the maximum average torque and the minimum torque ripple converges along the red line in Figure 13. Therefore, the multiobjective optimization direction can be judged.

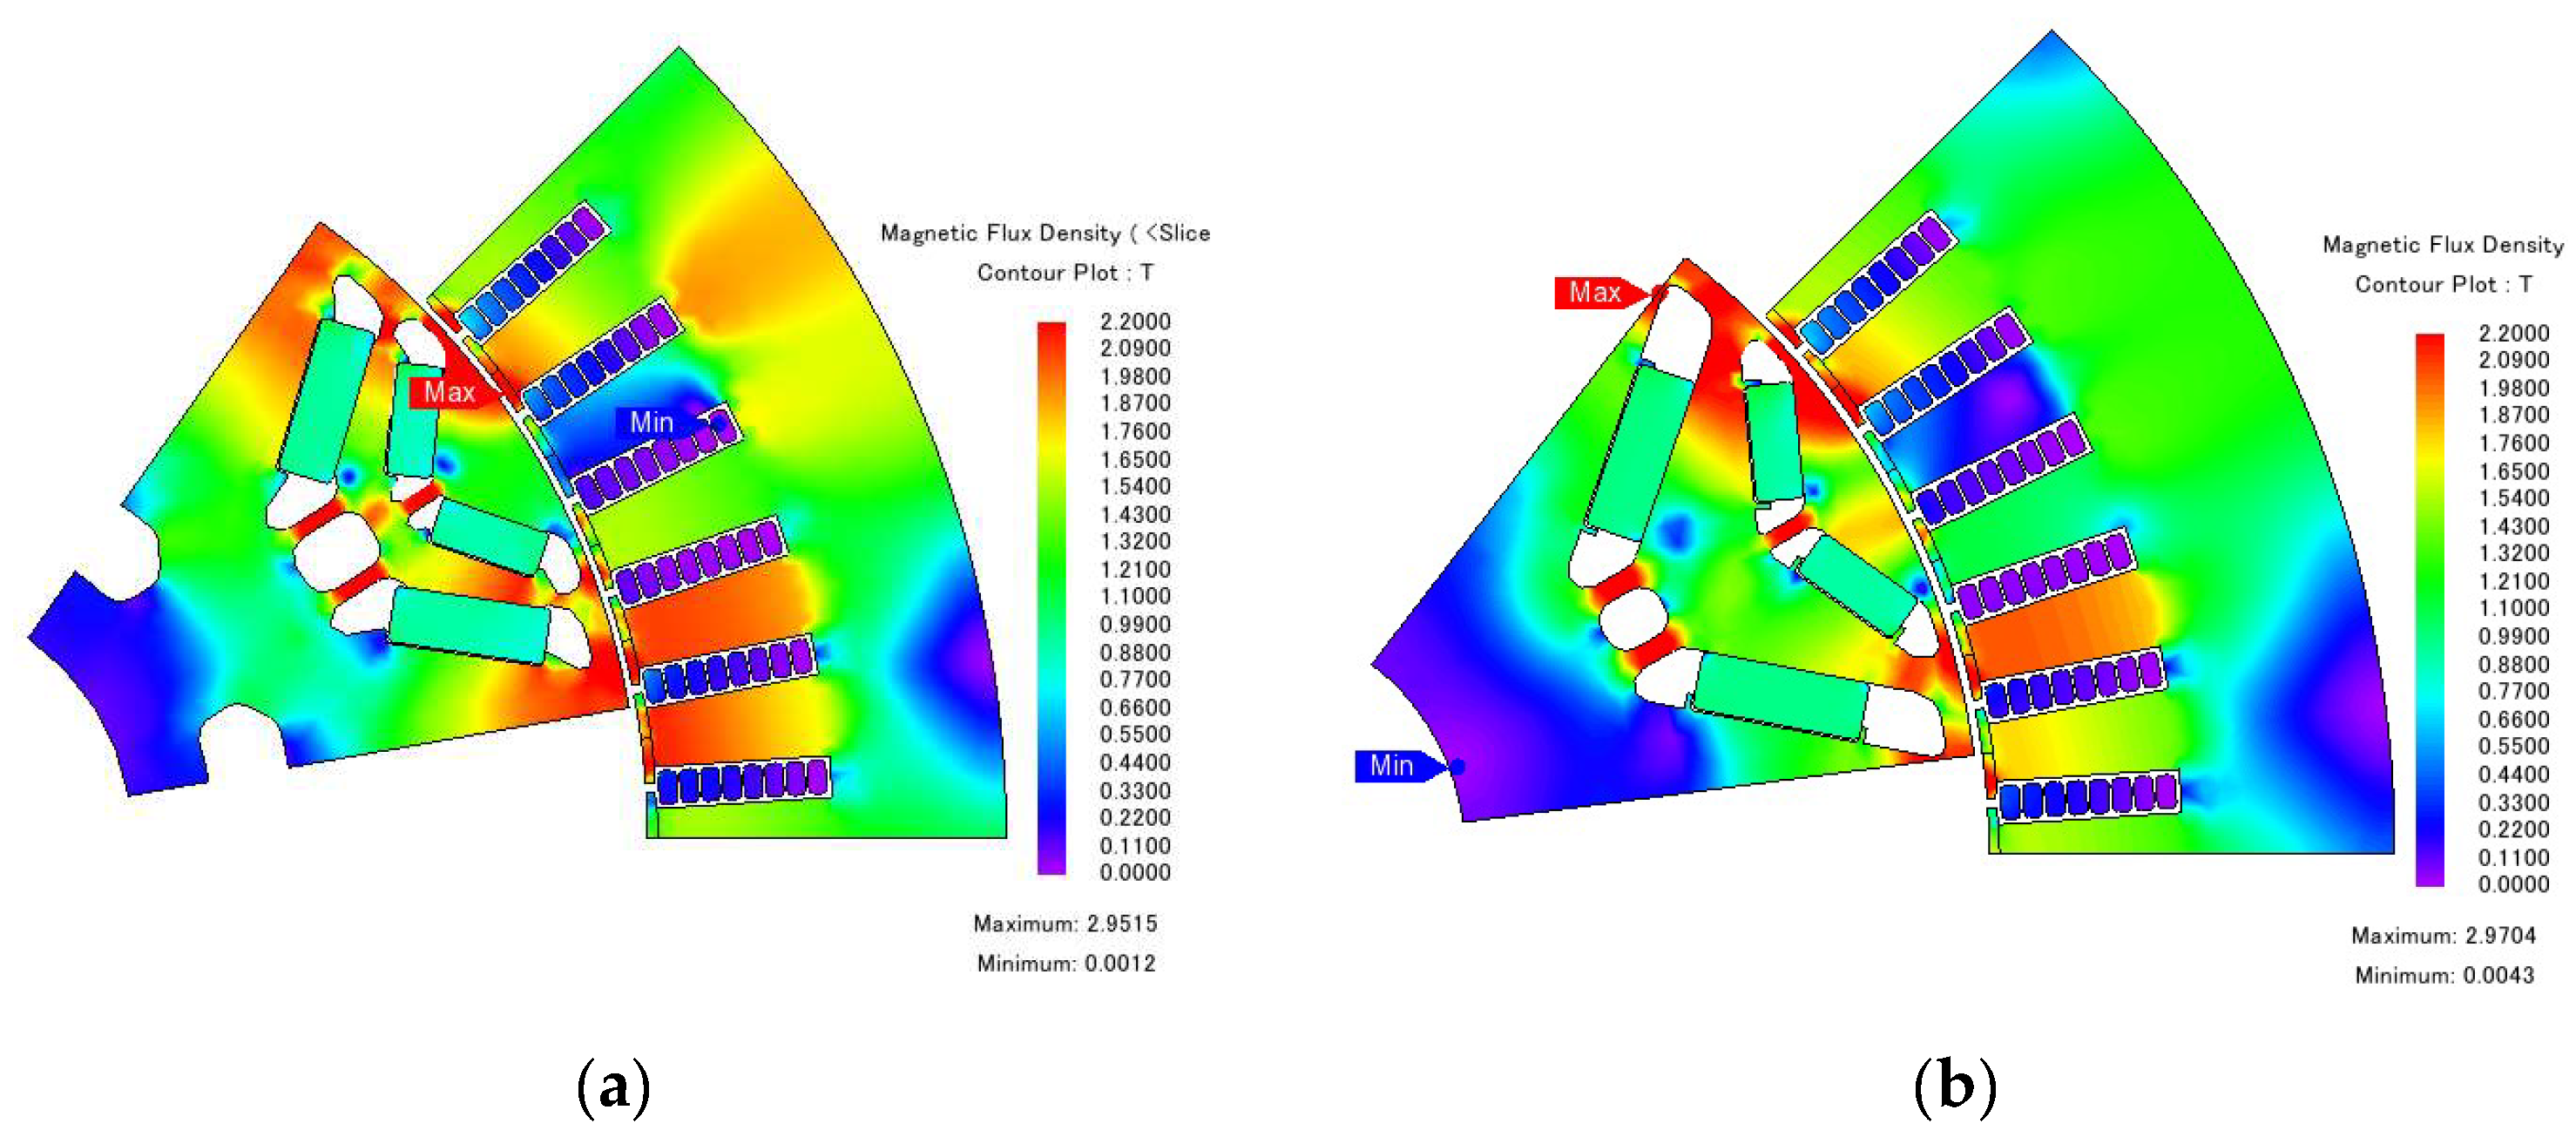
4.4. Comparison of Design

The air gap, stator inner diameter, rotor outer diameter and angle of magnet have changed after the optimization as shown in Table 6. As shown in the Figure 14, the rotor outer diameter of the is reduced, and the arrangement of the magnet is optimized, especially the Q-axis Angle of Magnet I and II are greatly changed. The rotor magnetic field distribution of the two-model change with the rotor structure.
Then, efficiency map simulation analysis is conducted, and the efficiency contour of 96% moves to the low torque and low speed direction after the multiobjective optimization. The red region accounts for a large proportion in CLTC cycle, which speed range is 2000 rpm–5000 rpm and torque range is 20 Nm–75 Nm. As shown in the Figure 15, the high-efficiency contour moves in this direction, and the CLTC efficiency is improved.
Taking the working condition efficiency as the main optimization objective and the dynamic performance as the secondary optimization objective and observation item, modifying the electromagnetic parameters and screening the optimization model, the external characteristics of the electromagnetic scheme are likely to be reduced. In addition, through the vehicle verification, the reduced performance still meets the vehicle requirements, so the optimization scheme can be accepted.
The CLTC efficiency is calculated through 9 characteristic points derived above. The result indicates that the efficiency increases from 95.0% to 95.6% as shown in the Table 7, which meets the established optimization objective. While the copper loss is not changed, the iron loss is reduced by 27%, 33%, and 35% as shown in the Table 8, which makes the high efficiency region overlaps with the CLTC cycle. The iron loss of motor is mainly produced in the stator and the magnetic density in tooth and yoke are optimized respectively below 1.4T and 1.6T, which reduces the stator iron loss. On the other hand, magnetic field harmonics in air gap are optimized, which reduces rotor iron loss.

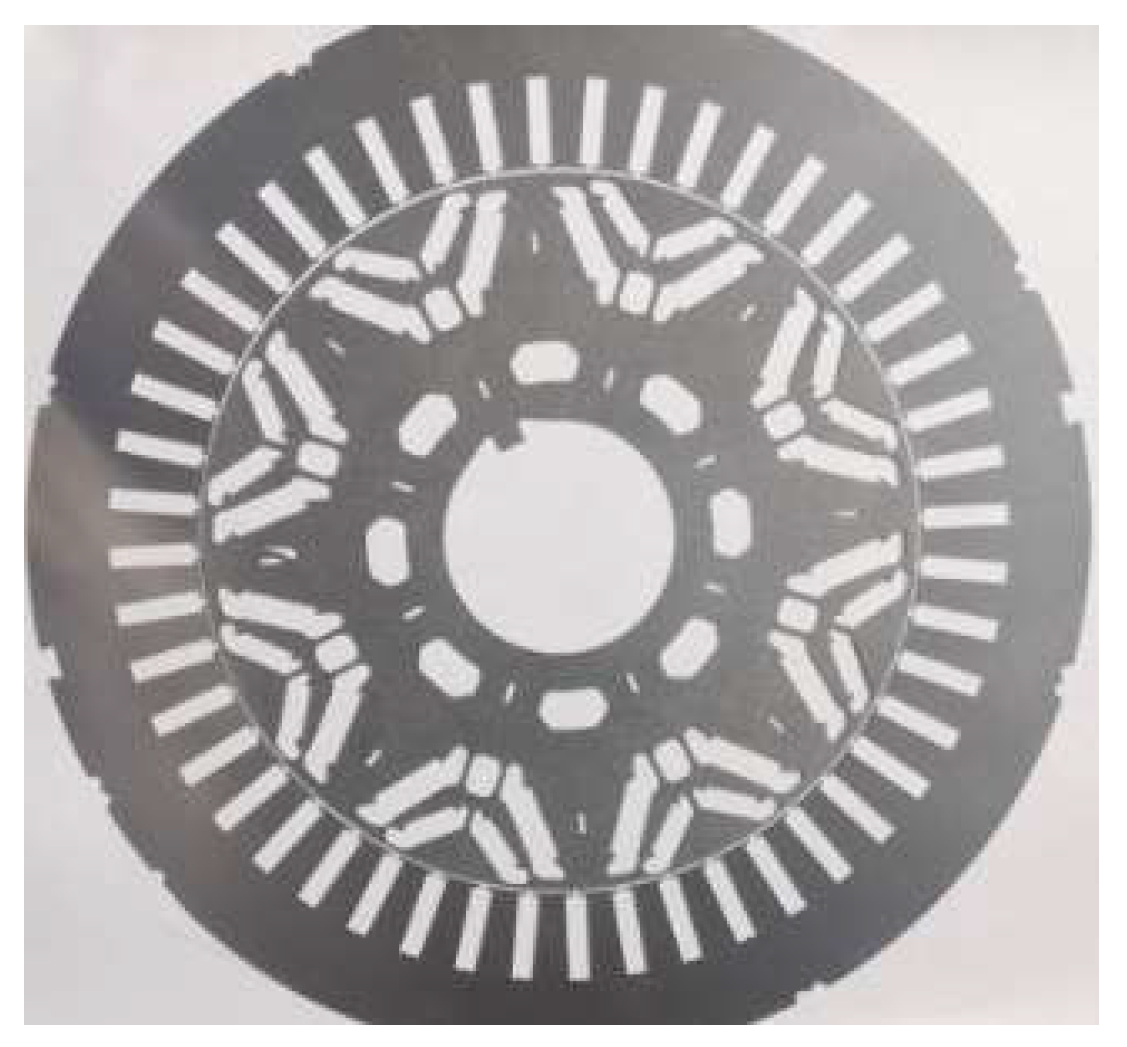
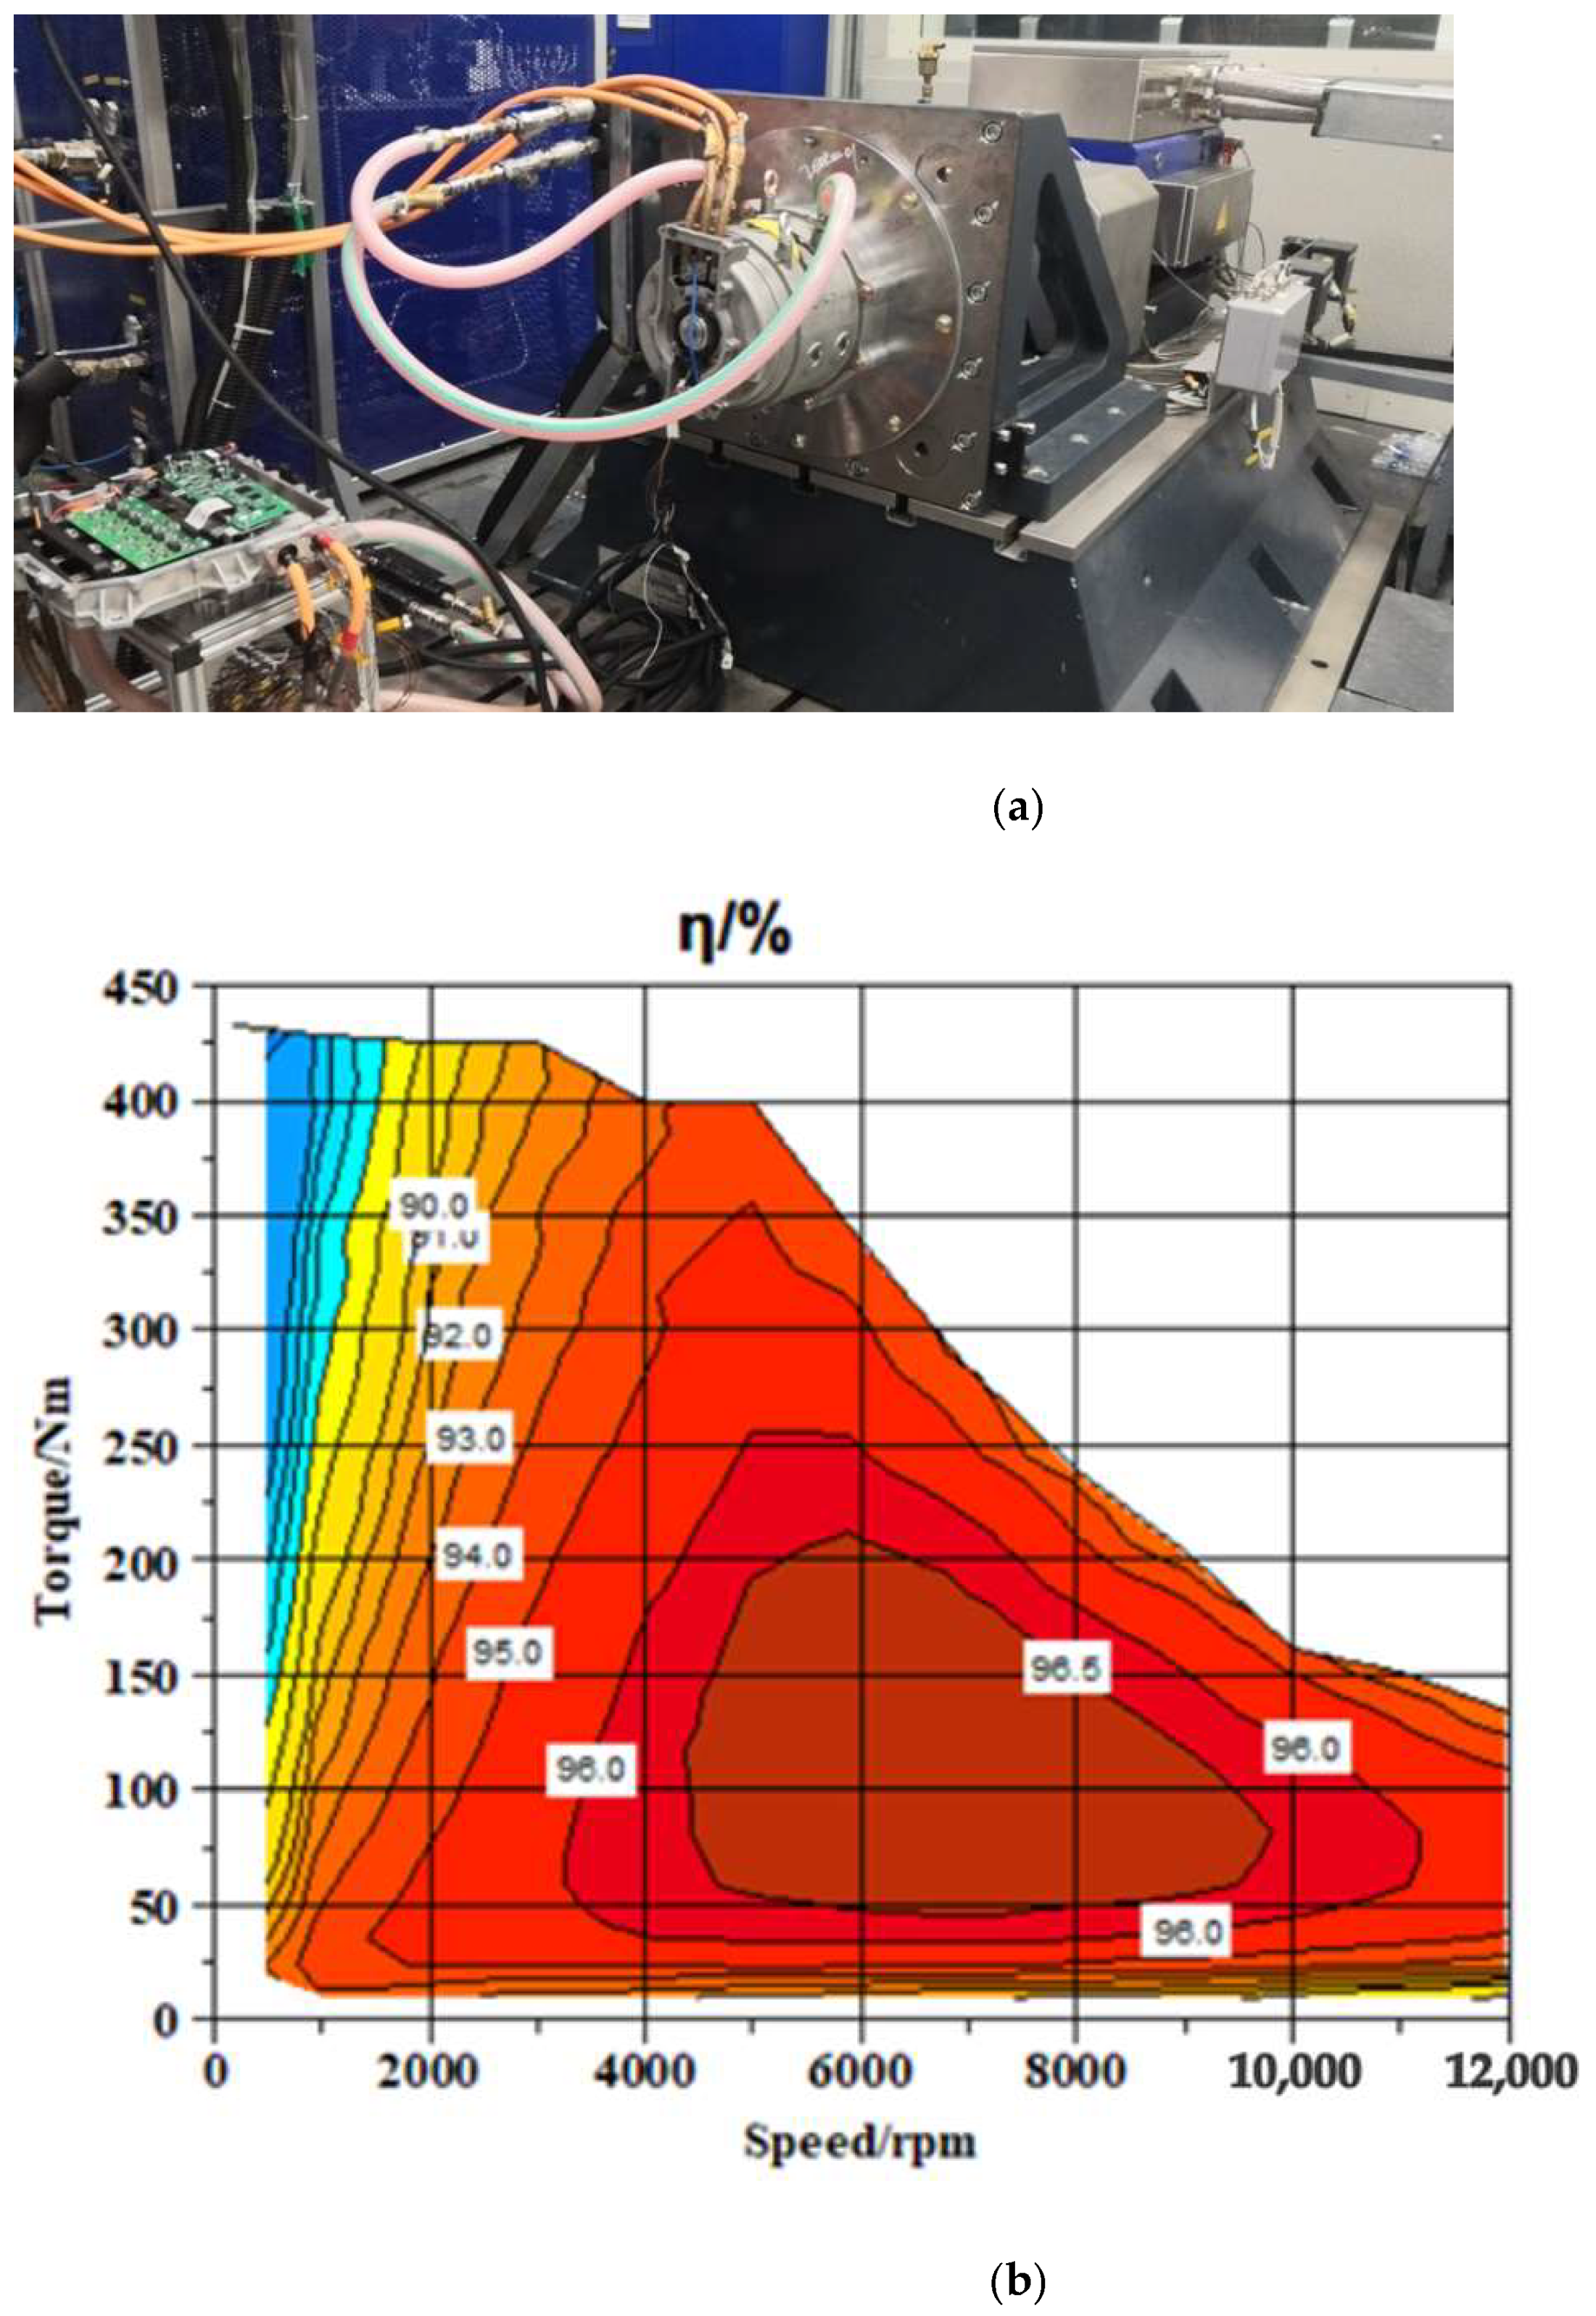
5. Experimental Result

The optimized motor is fabricated, and electromagnetic structure of the prototype motor is shown in Figure 16. The efficiency map of the optimized motor is measured through bench test, as shown in Figure 17. The CLTC efficiency calculated based on the energy equivalent 9-point method is shown in Table 9.
Considering that temperature of the motor is not exactly same between simulation and test condition, the measured CLTC efficiency is 94.8%, which differs by 0.8% from the simulation. The CLTC efficiency of the optimized motor is much higher than 93.6%, which is the CLTC efficiency of the initial motor.

6. Conclusions

In this paper, a motor design technique was presented typically for maximizing the energy efficiency of NEV traction motor over CLTC driving cycle, with the help of multiobjective optimization algorithm. Certain characteristic points can be derived to represent the whole driving cycle energy distribution. Three characteristic points are extracted as optimization objectives. The CLTC efficiency of motor increases by 0.6% by applying this design technique. The proposed technique is validated by design case studies and measurement results from a prototype machine. It provides great help and dramatically reduces time of the optimization process.

Author Contributions

Conceptualization, S.G.; validation, X.Y. and P.L.; data curation, H.Q.; writing—original draft preparation, Z.L.; writing—review and editing, H.Z. and Y.W. All authors have read and agreed to the published version of the manuscript.

Funding

This research received no external funding.

Institutional Review Board Statement

Not applicable.

Informed Consent Statement

Not applicable.

Conflicts of Interest

The authors declare no conflict of interest. All the authors are employees of FAW E-Drive System Section, Electric Vehicle Development Department. The paper reflects the views of the scientists, and not the company.

References

  1. Tang, R. Theory and Design of Modern Permanent Magnet Motor; China Machine Press: Beijing, China, 1997. [Google Scholar]
  2. Tang, Y. Electrical Machinery; Machinery Industry Press: Beijing, China, 2014. [Google Scholar]
  3. Chen, S. Design of the Electric Machine; Machinery Industry Press: Beijing, China, 2004. [Google Scholar]
  4. Wen, Y. Application of Multi-Objective Hybrid Genetic Algorithm in the Optimization Design of Permanent Magnet Motor. Master’s Thesis, North China Electric Power University, China, Beijing, 2017. [Google Scholar]
  5. Huang, R.; Zheng, D. Optimal design of unequal thickness permanent magnet motor based on Kriging model and particle ‘swarm optimization algorithm. Small Spec. Electr. Mach. 2020, 48, 19–23. [Google Scholar]
  6. Lu, Y.; Miao, H.; Zeng, C. Multi objective optimization design of surface built in permanent magnet synchronous motor based on Taguchi method. Micromotors 2019, 52, 1–5. [Google Scholar]
  7. Zhang, Y.; Du, R.; Zhao, X.; Ye, Q. Motor noise optimization based on multi-objective genetic algorithm. Small Spec. Electr. Mach. 2020, 48, 21–25. [Google Scholar]
  8. Du, X.; Huang, K.; Tan, G.; Huang, X. Multi-objective optimization of permanent magnet motor torque based on response surface method. Small Spec. Electr. Mach. 2019, 47, 20–23. [Google Scholar]
  9. Hao, J. Design and Multi Objective Optimization of High Power Density Permanent Magnet Synchronous Motor. Master’s Thesis, China University of Geosciences, Beijing, China, 2020. [Google Scholar]
  10. Ma, H. Design and Multi Objective Optimization of Low Torque Ripple Synchronous Reluctance Motor. Master’s Thesis, Hefei University of Technology, Hefei, China, 2019. [Google Scholar]
Figure 1. Difference between deep learning and machine learning.
Wevj 12 00260 g001
Figure 2. Motor speed versus time.
Wevj 12 00260 g002
Figure 3. Motor torque versus time.
Wevj 12 00260 g003
Figure 4. Motor power versus time.
Wevj 12 00260 g004
Figure 5. Relationship between iron loss, copper loss, and efficiency distribution of motor.
Wevj 12 00260 g005
Figure 6. MOGA optimization process.
Wevj 12 00260 g006
Figure 7. Taguchi method optimization process.
Wevj 12 00260 g007
Figure 8. Parametric model of rotor.
Wevj 12 00260 g008
Figure 9. Multistrategy adaptive optimization algorithm flow.
Wevj 12 00260 g009
Figure 10. Average torque-optimal factor contribution.
Wevj 12 00260 g010
Figure 11. Torque ripple-optimal factor contribution.
Wevj 12 00260 g011
Figure 12. 48th electromagnetic force-optimal factor contribution.
Wevj 12 00260 g012
Figure 13. Average torque-torque ripple pareto front.
Wevj 12 00260 g013
Figure 14. Comparison of magnetic field distribution. (a) Initial model; (b) optimized model.
Wevj 12 00260 g014
Figure 15. Comparison of efficiency map.
Wevj 12 00260 g015
Figure 16. Electromagnetic structure of prototype motor.
Wevj 12 00260 g016
Figure 17. Experimental result. (a) Test bench; (b) measured efficiency map.
Wevj 12 00260 g017
Table 1. Parameters of vehicle and electric drive.
Major ParameterValue
Vehicle Weight (kg)1600
Tire Rolling Radius (m)0.307
Peak Power (kW)200
Peak Torque (Nm)430
Gear Ratio11.8
Table 2. 9 characteristic points.
Speed (rpm)Torque (Nm)Power Weight (%)Time Weight (%)
621390.030.14
1491340.100.22
2481380.140.17
3513320.170.16
4439350.210.15
5414340.100.06
6435360.090.04
7486400.060.02
8994340.100.04
Table 3. 3 characteristic points.
Speed (rpm)Torque (Nm)Power Weight (%)Time Weight (%)
1784360.340.60
4260330.330.26
7000360.330.14
Table 4. Performance requirement of motor.
Major ParameterValue
Motor typeIPM
Voltage (V)396
Peak power (kW)200
Duration of peak power (s)60
Peak torque (Nm)410
Peak current (Arms)600
Continuous power (kW)90
Duration of continuous power (min)30
Max. output speed (rpm)16,500
Max. outer diameter of motor (mm)220
Cooling conditionWater-cooling
Table 5. Optimization factor value range.
Design VariablesSymbolValue RangeValue Interval
D-axis Angle of Magnet I (°)mag1Angle[60–120]0.4
Q-axis Angle of Magnet I (°)mag1rib[3–13]0.2
Width of Magnet I (mm)mag1wid[14–18]0.2
D-axis Angle of Magnet II (°)mag2Angle[80–140]0.4
Q-axis Angle of Magnet II (°)mag2rib[18–29]0.2
Width of Magnet II (mm)mag2wid[8–11]0.2
Rotor outer diameter (mm)D2[70–75]0.5
Air gap (mm)gap[0.6–0.8]0.05
Table 6. Comparison of design parameters.
ParameterInitial ModelOptimized Model
Winding formFlat wireFlat wire
Pole/slot8/488/48
Gap structureUniform air gapUniform air gap
Stator outer diameter/inner diameter (mm)220/149.4220/143.6
Length of stator core (mm)150140
Length of stator assembly (mm)200190
Air gap (mm)0.70.8
Width of Magnet I (mm)14.515
D-axis Angle of Magnet I (°)8282
Q-axis Angle of Magnet I (°)8.32.3
Center distance of Magnet I (mm)1010
Width of Magnet II (mm)1010
D-axis Angle of Magnet II (°)103131
Q-axis Angle of Magnet II (°)22.418.4
Center distance of Magnet II (mm)44
Rotor outer diameter (mm)7471
Cost Factor10.92
Table 7. Comparison of CLTC efficiency.
Motor DataCLTC Efficiency
Initial model95.0%
Optimized model95.6%
Table 8. Comparison of typical point losses of motor.
Typical Working PointOptimized ModelInitial Model
Copper Loss(W)Iron Loss(W)Copper Loss(W)Iron Loss(W)
36 Nm@1784 rpm19198191139
33 Nm@4260 rpm209326209486
36 Nm@7000 rpm2517122521093
Table 9. Comparison of CLTC efficiency.
Motor DataCLTC Efficiency
Simulation95.6%
Measurement94.8%
Publisher’s Note: MDPI stays neutral with regard to jurisdictional claims in published maps and institutional affiliations.

